


1 The First School of Clinical Medicine, Lanzhou University, 730030 Lanzhou, Gansu, China
2 Institute of Modern Physics, Chinese Academy of Sciences, 730030 Lanzhou, Gansu, China
3 Department of Postgraduate, University of Chinese Academy of Sciences, 100043 Beijing, China
4 School of Public Health, Gansu University of Chinese Medicine, 730030 Lanzhou, Gansu, China
†These authors contributed equally.
Abstract
Background: Gliomas are characterized by aggressive behavior, leading to severe disability and high mortality. Ubiquitin-like modifier activating enzyme 2 (UBA2) is a subunit of the E1-activating enzyme involved in the SUMOylation (SUMO, small ubiquitin-related modifier) of numerous proteins. Although the abnormality of UBA2 is linked to the progression of various tumor types, the role of UBA2 in glioma is still unknown. Methods: A bioinformatic analysis using several public databases was conducted to examine the expression level, clinicopathological correlations, and prognostic significance of UBA2 in glioma. The correlation between UBA2 expression and drug sensitivity in cancers was also explored. Multiple cellular experiments were conducted to validate the role of UBA2 in glioma. Results: Analysis of multiple databases and cellular experiments revealed that UBA2 was overexpressed in glioma tissues and cell lines, respectively. UBA2 expression in gliomas correlated with World Health Organization (WHO) grade, IDH gene status, 1p19q deletion, histological type, and immune cell infiltration in glioma. UBA2 expression in carcinomas also correlated with drug sensitivity. Kaplan-Meier analysis revealed that high expression of UBA2 predicted poorer survival in glioma patients. A nomogram model containing UBA2 expression was constructed for clinical practice. Knockdown of UBA2 was observed to suppress glioma cell progression and sensitize glioma cells to irradiation in vitro. Conclusion: Overall, this research showed that UBA2 might be involved not only in the development of glioma but also in the regulation of immunity, drug sensitivity, and radiosensitivity. Therefore, UBA2 may be a potential target for therapy and a candidate biomarker for glioma diagnosis and prognosis.
Keywords
- UBA2
- glioma
- prognosis
- tumor progression
- immunity
- radiosensitivity
Gliomas are the most frequent primary intracranial tumors and are characterized by aggressive behavior, leading to severe disability and a high rate of mortality [1]. They are typically classified into two subgroups: low-grade glioma (LGG; grade 2 and 3) and glioblastoma multiforme (GBM; grade 4) [2]. Several molecular markers, including 1p19q codeletion and isocitrate dehydrogenase (IDH) mutation are instrumental in the classification, prognosis, and treatment of gliomas [3]. The 2021 World Health Organization (WHO) Classification of Tumors of the Central Nervous System subdivided adult-type diffuse glioma into three types based on histologic patterns and molecular markers: (1) astrocytoma, IDH-mutant; (2) oligodendroglioma, IDH-mutant, and 1p/19q-codeleted; and (3) glioblastoma, IDH-wildtype [4]. The prognosis for patients with glioma remains poor, despite the availability of many treatment options, including surgical resection, chemotherapy, radiotherapy, and immunotherapy [5].
Small ubiquitin-related modifiers (SUMOs) are a large family of conserved proteins shared by all eukaryotic organisms [6]. SUMOylation is a posttranslational protein modification involved in several biological activities, including transcription and cell signaling [7]. A series of events mediated by the SUMO E1 activation enzyme, E2 conjugation enzyme, and several E3 ligases result in SUMOylation [8]. The essential elements of E1, responsible for the activation of protein SUMOylation, are SUMO-activating enzyme subunit 1 (SAE1) and ubiquitin-like modifier activating enzyme 2 (UBA2) [9]. Of note, several studies have shown that UBA2 expression is strongly correlated to the progression of pancreatic, lung, kidney, and colorectal cancers as well as being overexpressed in a variety of malignancies [7, 10, 11, 12, 13, 14]. These findings imply that UBA2 is a promising therapeutic target for the management of cancer. However, the role of UBA2 in glioma is still unknown.
The aim of this research was therefore to clarify the expression level of UBA2 in glioma, as well as its clinicopathological correlations and prognostic significance. In addition, the correlation between UBA2 expression and drug sensitivity in cancer was also examined. To accomplish this, a bioinformatic analysis of various public databases was conducted. A series of in vitro cellular experiments further explored the function of UBA2 in glioma. Individualized treatment of gliomas is still being investigated, and there is an urgent need for more research on different targets. The results of the present work show that UBA2 is a promising prognostic biomarker and a potential therapeutic target in glioma. These findings may be important for the management of future glioma patients.
The UCSC Xena online tool (https://xenabrowser.net/datapages/) was used to compile data from the Cancer Genome Atlas (TCGA) and the Genotype-Tissue Expression (GTEx) RNAseq databases in transcripts per million (TPM) format, and together with prognostic data for glioma [15]. UBA2 protein levels were analyzed using the University of Alabama at Birmingham Cancer Data Analysis Portal (UALCAN, https://ualcan.path.uab.edu/), and the aforementioned results were verified using the Gene Expression Profiling Interactive Analysis (GEPIA, http://gepia.cancer-pku.cn/) database [16, 17]. Finally, the diagnostic receiver operating characteristic (ROC) curve was used to determine the ability of UBA2 expression to distinguish between tumor and normal tissue. Youden’s index was used to determine the cut-off value for UBA2 expression to classify tumor and non-tumor brain tissue.
The median value of UBA2 mRNA expression in 698 glioma patients from the TCGA
dataset was used as the cut-off value to classify patients into low and high
expression groups. Kaplan-Meier (K-M) survival analysis was conducted using the R
packages “survminer” and “survivor”, and survival curves were plotted for
both groups. The study endpoints were disease-specific survival (DSS), overall
survival (OS), and progression-free interval (PFI). A cohort dataset was also
retrieved from the Chinese Glioma Genome Atlas database (CGGA,
http://www.cgga.org.cn/) in order to perform survival analysis [18]. Univariate
analysis using Cox proportional risk regression modelling was first performed to
study the link between UBA2 expression and OS. Other clinical and pathological
prognostic factors were also evaluated. Subsequently, variables with p
values
Immune infiltration was first evaluated based on the single sample gene set enrichment analysis (ssGSEA) algorithm provided in the R package “Gene Set Variation Analysis (GSVA)” and using previously published markers for 24 immune cells types [19, 20]. Subsequently, immune cell infiltration was determined using the xCELL, CIBERSORT, MCPcounter, and TIMER algorithms with the R package “IOBR” [20, 21, 22, 23, 24, 25, 26]. The stromal, immune, and estimate scores were then calculated using the R package “ESTIMATE” [19].
The RNAs associated with Drug (RNAactDrug, http://bio-bigdata.hrbmu.edu.cn/RNAactDrug/) database was used to explore the relationship between UBA2 mRNA expression and drug sensitivity. This online tool contains the Cancer Cell Line Encyclopedia (CCLE), the Genomics of Drug Sensitivity in Cancer (GDSC, formerly known as CGP), and the CellMiner databases. The computational analysis of resistance (CARE) algorithm utilizes compound screening data to identify biomarkers of response to targeted therapies. This contains the Cancer Therapeutic Response Portal (CTRP), CCLE, and CGP databases, and results in a CARE score that reflects drug sensitivity [27].
Three human glioma cell lines (A172, U251, and U87) and one human normal
astrocyte cell line (HA1800) were investigated in this study. The glioma cell
lines were obtained from the Institute of Modern Physics, Chinese Academy of
Sciences (Lanzhou, China), while the HA1800 cell line was obtained from
Mingzhoubio (Ningbo, China). Short Tandem Repeat (STR) analysis was performed to
identify the cell lines. All the cell lines were mycoplasma-negative and were
cultured at 37 °C with 5% CO
Lentiviruses containing short hairpin RNA targeting UBA2 (shUBA2) and
negative control (shNC) were obtained from Hanbio (Shanghai, China). The shRNA
sequences were: shUBA2-1, 5
Total protein was extracted from cells using radioimmunoprecipitation assay
lysis buffer containing a serine protease inhibitor (1% phenylmethylsulfonyl
fluoride). Proteins were subsequently separated by electrophoresis on a 10%
sodium dodecyl sulfate-polyacrylamide gel, and then transferred onto a
polyvinylidene fluoride membrane (Millipore, Cork, Ireland). After blocking for 1
h in 5% non-fat milk in tris-buffered saline and Tween 20 (TBST, Solarbio,
Beijing, China), the membrane was incubated overnight at 4 °C with
primary antibody against
TRIzol reagent (Ambion, Carisbad, CA, USA) was used to extract total RNA from
cells. This was then reverse transcribed to generate cDNA using the SweScript RT
First Strand cDNA Synthesis Kit (Servicebio, Wuhan, China). Quantitative
Real-Time Polymerase Chain Reaction (qRT-PCR) was conducted using Bio-rad CFX
management and 2
Cells were irradiated using an X-RAY generator (X-RAD 225, North Branford, CT, USA). The dose rate was set to 2.0–3.0 Gy/min (225 KV/13.3 mA, 0.2 mm Al filter), and source-skin distance was 40 cm.
For the colony formation assay, a single cell suspension containing an appropriate number of cells was placed in 60-mm petri dishes. The medium was replaced every 4 days. After 2 weeks of incubation, the cells were fixed in ethanol and 0.1% concentration of crystal violet (Solarbio, Beijing, China) was used to stain the colonies.
Cells were seeded at 4
Cells were seeded into 6-well plates (2
The cell migration assay was performed using 24-well transwell chambers
(Corning, Kennebunk, ME, USA). Briefly, 3
The student’s t test or Mann–Whitney U rank-sum test was used to
compare UBA2 expression between tumor and normal tissues, depending on the
results of the normality test of the samples. These tests were also used to
determine correlations between UBA2 expression and clinicopathological variables.
The log-rank test was used to perform a K-M survival analysis. The Pearson or
Spearman’s test was used for correlation analysis. R software 4.2.1 (Ross Ihaka and Robert Gentleman, Auckland,
New Zealand) and GraphPad Prism 9.4.0 (Dotmatics, Boston, MA, USA) were employed
for all statistical calculations and data visualizations, with the specific R
package described in the preceding sections. All p-values in this study
were tested using a two-tailed test, with p
Pan-cancer analysis of the TCGA-GTEx database revealed that UBA2 was overexpressed in multiple cancers relative to corresponding normal tissues, including glioma (Fig. 1A–C). In the GEPIA, UALCAN, and Clinical Proteomic Tumor Analysis Consortium (CPTAC, https://proteomics.cancer.gov/programs/cptac) databases, UBA2 expression was substantially higher in glioma compared to normal tissues (Fig. 1D–F). UBA2 protein and mRNA expression in glioma (A172, U251, and U87) and astrocyte (HA1800) cell lines were detected using Western blotting and quantitative real-time polymerase chain reaction (qRT-PCR) assays. Compared to the typical astrocyte cell line, glioma cell lines expressed significantly higher levels of UBA2 protein and mRNA (Fig. 1G,H). Furthermore, the diagnostic ROC curve showed that UBA2 expression could effectively differentiate between glioma and normal tissues (Area Under Curve = 0.867, Fig. 1I). The expression level of UBA2 was 5.81 at the maximum Youden’s index, indicating this was the optimal cut-off value for distinguishing between glioma and normal tissues (Supplementary Fig. 1). These findings demonstrate that UBA2 is overexpressed in glioma cell lines and tissues.
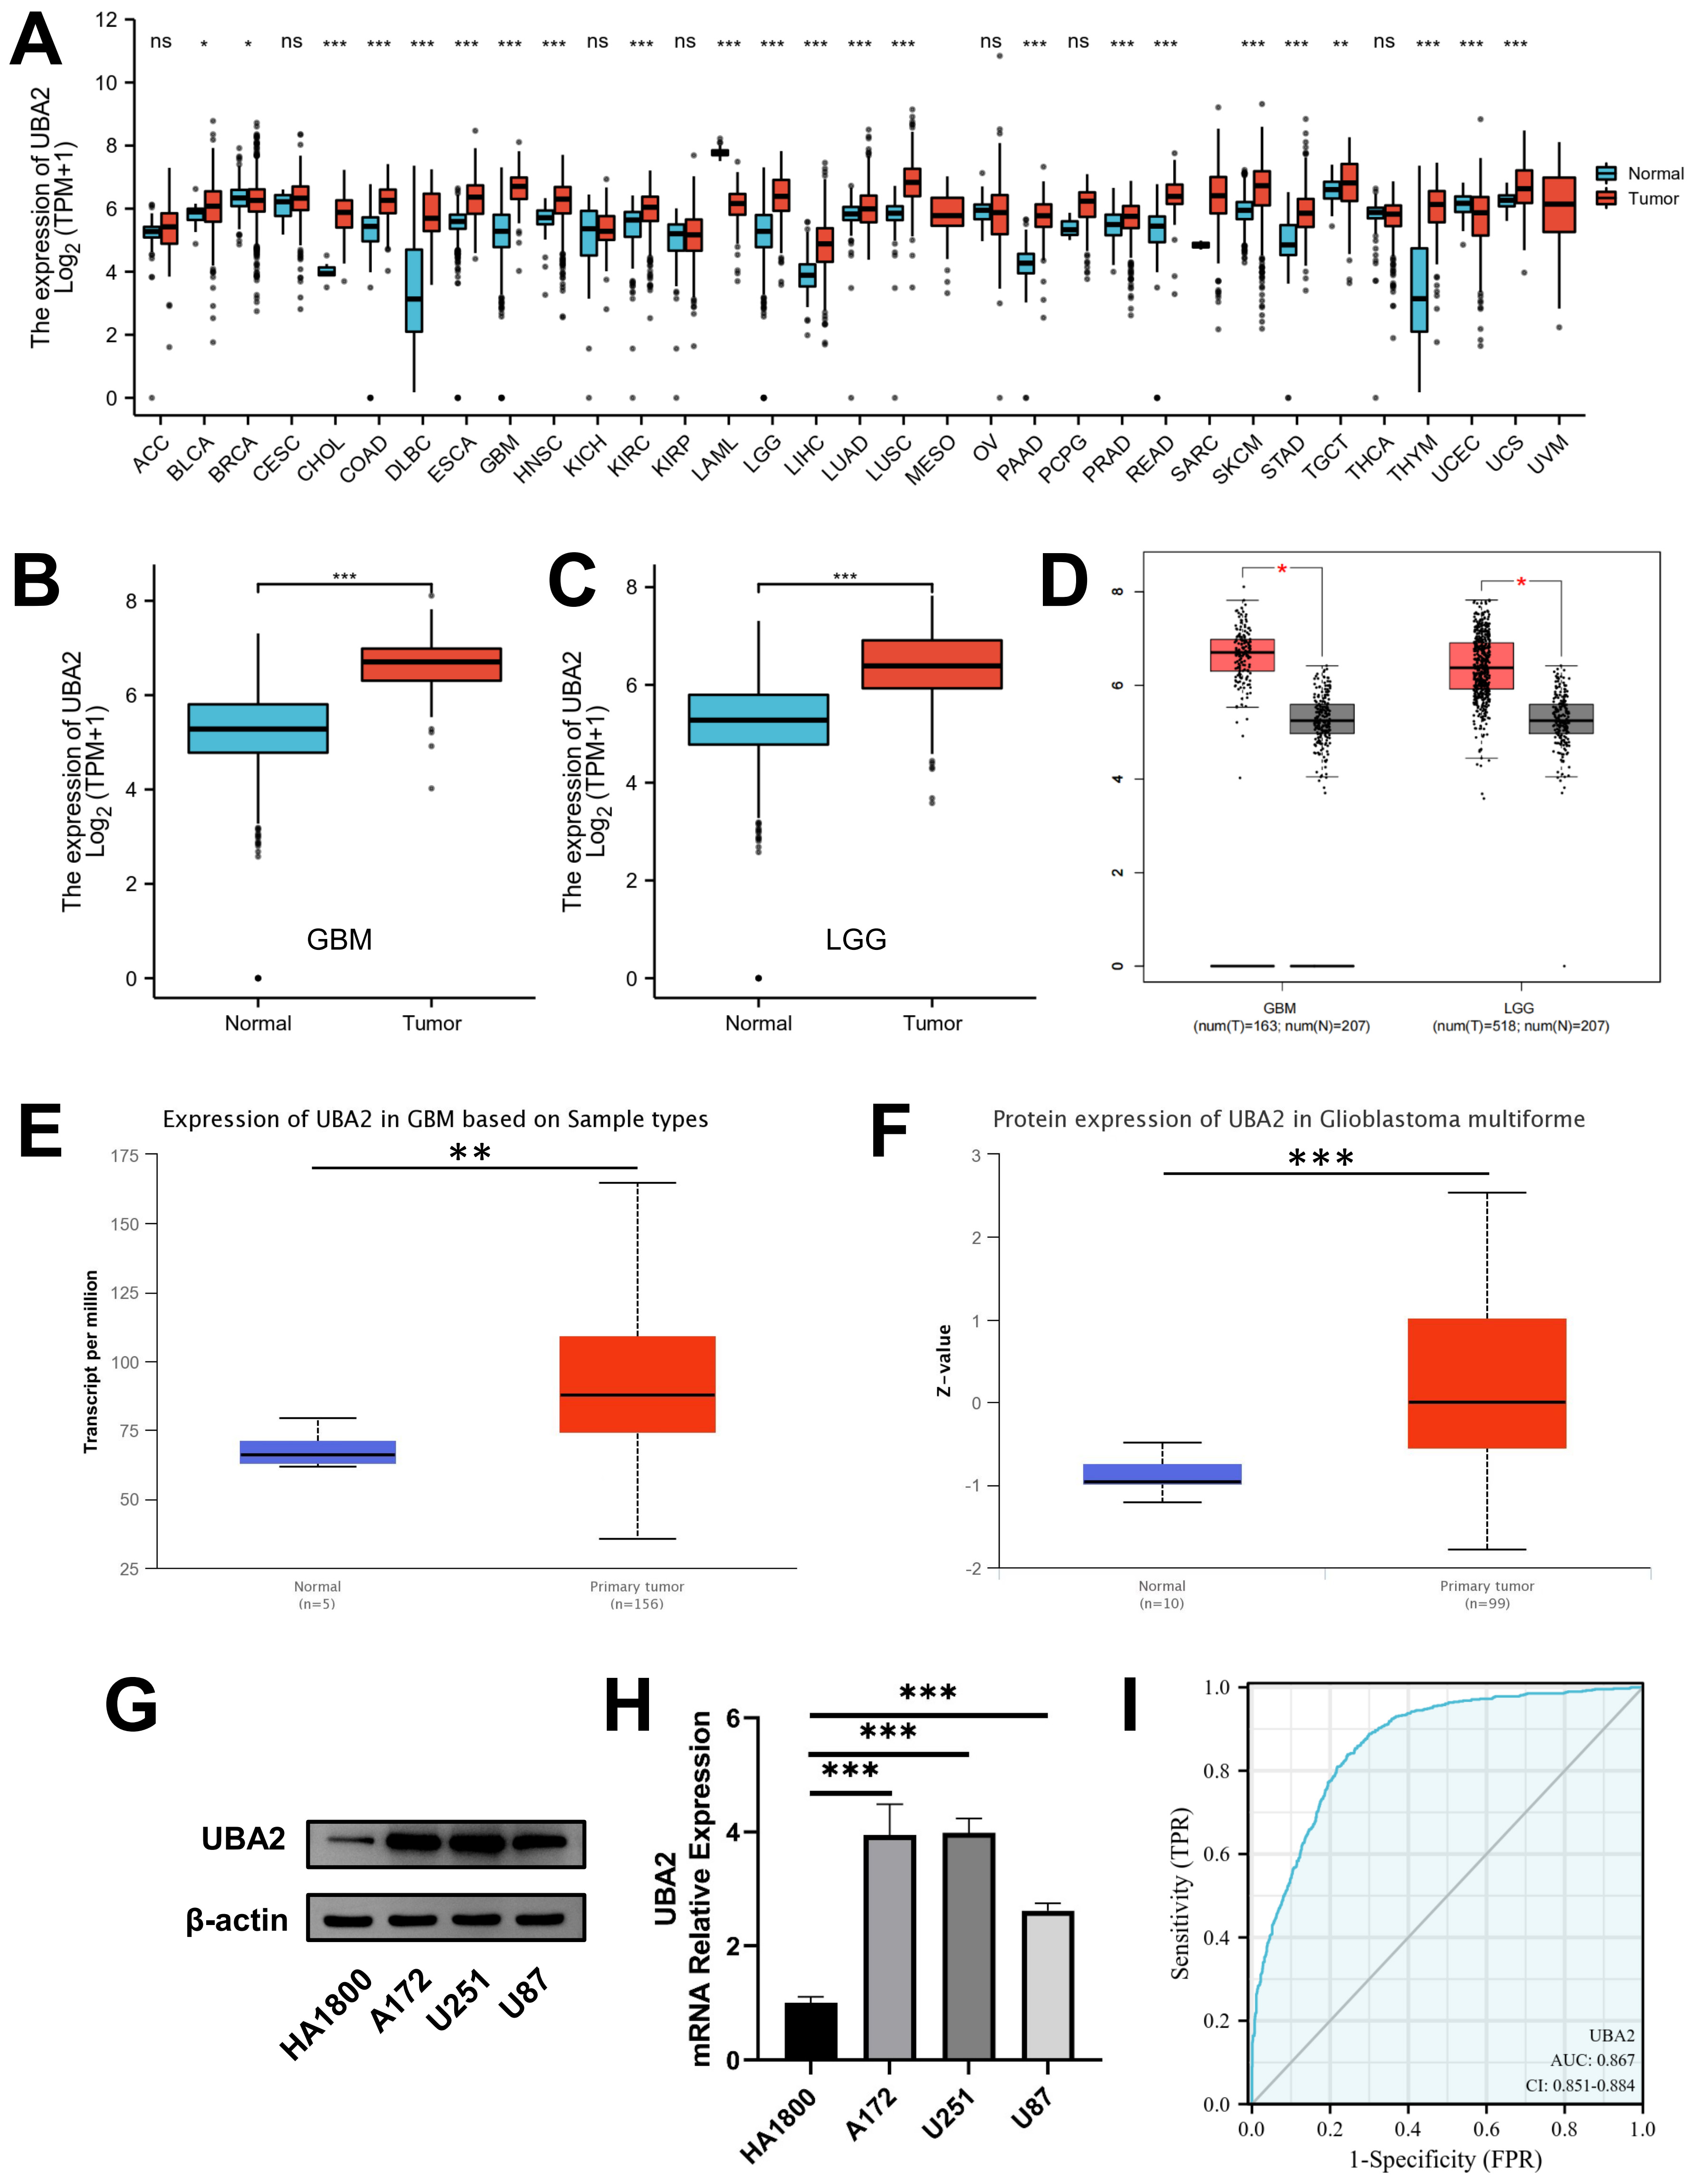 Fig. 1.
Expression of UBA2 in glioma tissues and cell lines.
UBA2 mRNA expression between tumor and normal samples in (A)
pan-cancer, (B) GBM, and (C) LGG from TCGA and GTEx database.
(D) UBA2 mRNA expression between tumor and normal samples in GBM and LGG from
GEPIA database. (E) UBA2 mRNA expression in GBM between tumor
and normal samples from UALCAN database. (F) UBA2 protein expression in
glioblastoma between tumor and normal samples from CPTAC database. (G) Western
blotting and (H) quantitative real-time PCR analysis of UBA2 in
normal astrocyte and glioma cell lines (***p
The relationship between UBA2 expression and various clinicopathological parameters in glioma patients was analyzed using the TCGA database (Supplementary Table 1). UBA2 expression in glioma was associated with WHO grade, IDH gene status, histological type, and 1p19q deletion, but not with patient sex, race, or age. UBA2 expression was higher in WHO grade 4 gliomas compared to WHO grade 2 and 3 gliomas (Fig. 2A). Additionally, UBA2 expression was higher in glioblastoma than in astrocytoma, oligoastrocytoma, and oligodendroglioma (Fig. 2C). Patients with 1p19q non-codeletion and IDH-wildtype, both of which are indicators of poor prognosis, showed highly elevated expression of UBA2 (Fig. 2B,D). Together, these findings indicate that UBA2 expression is associated with the malignant progression of glioma.
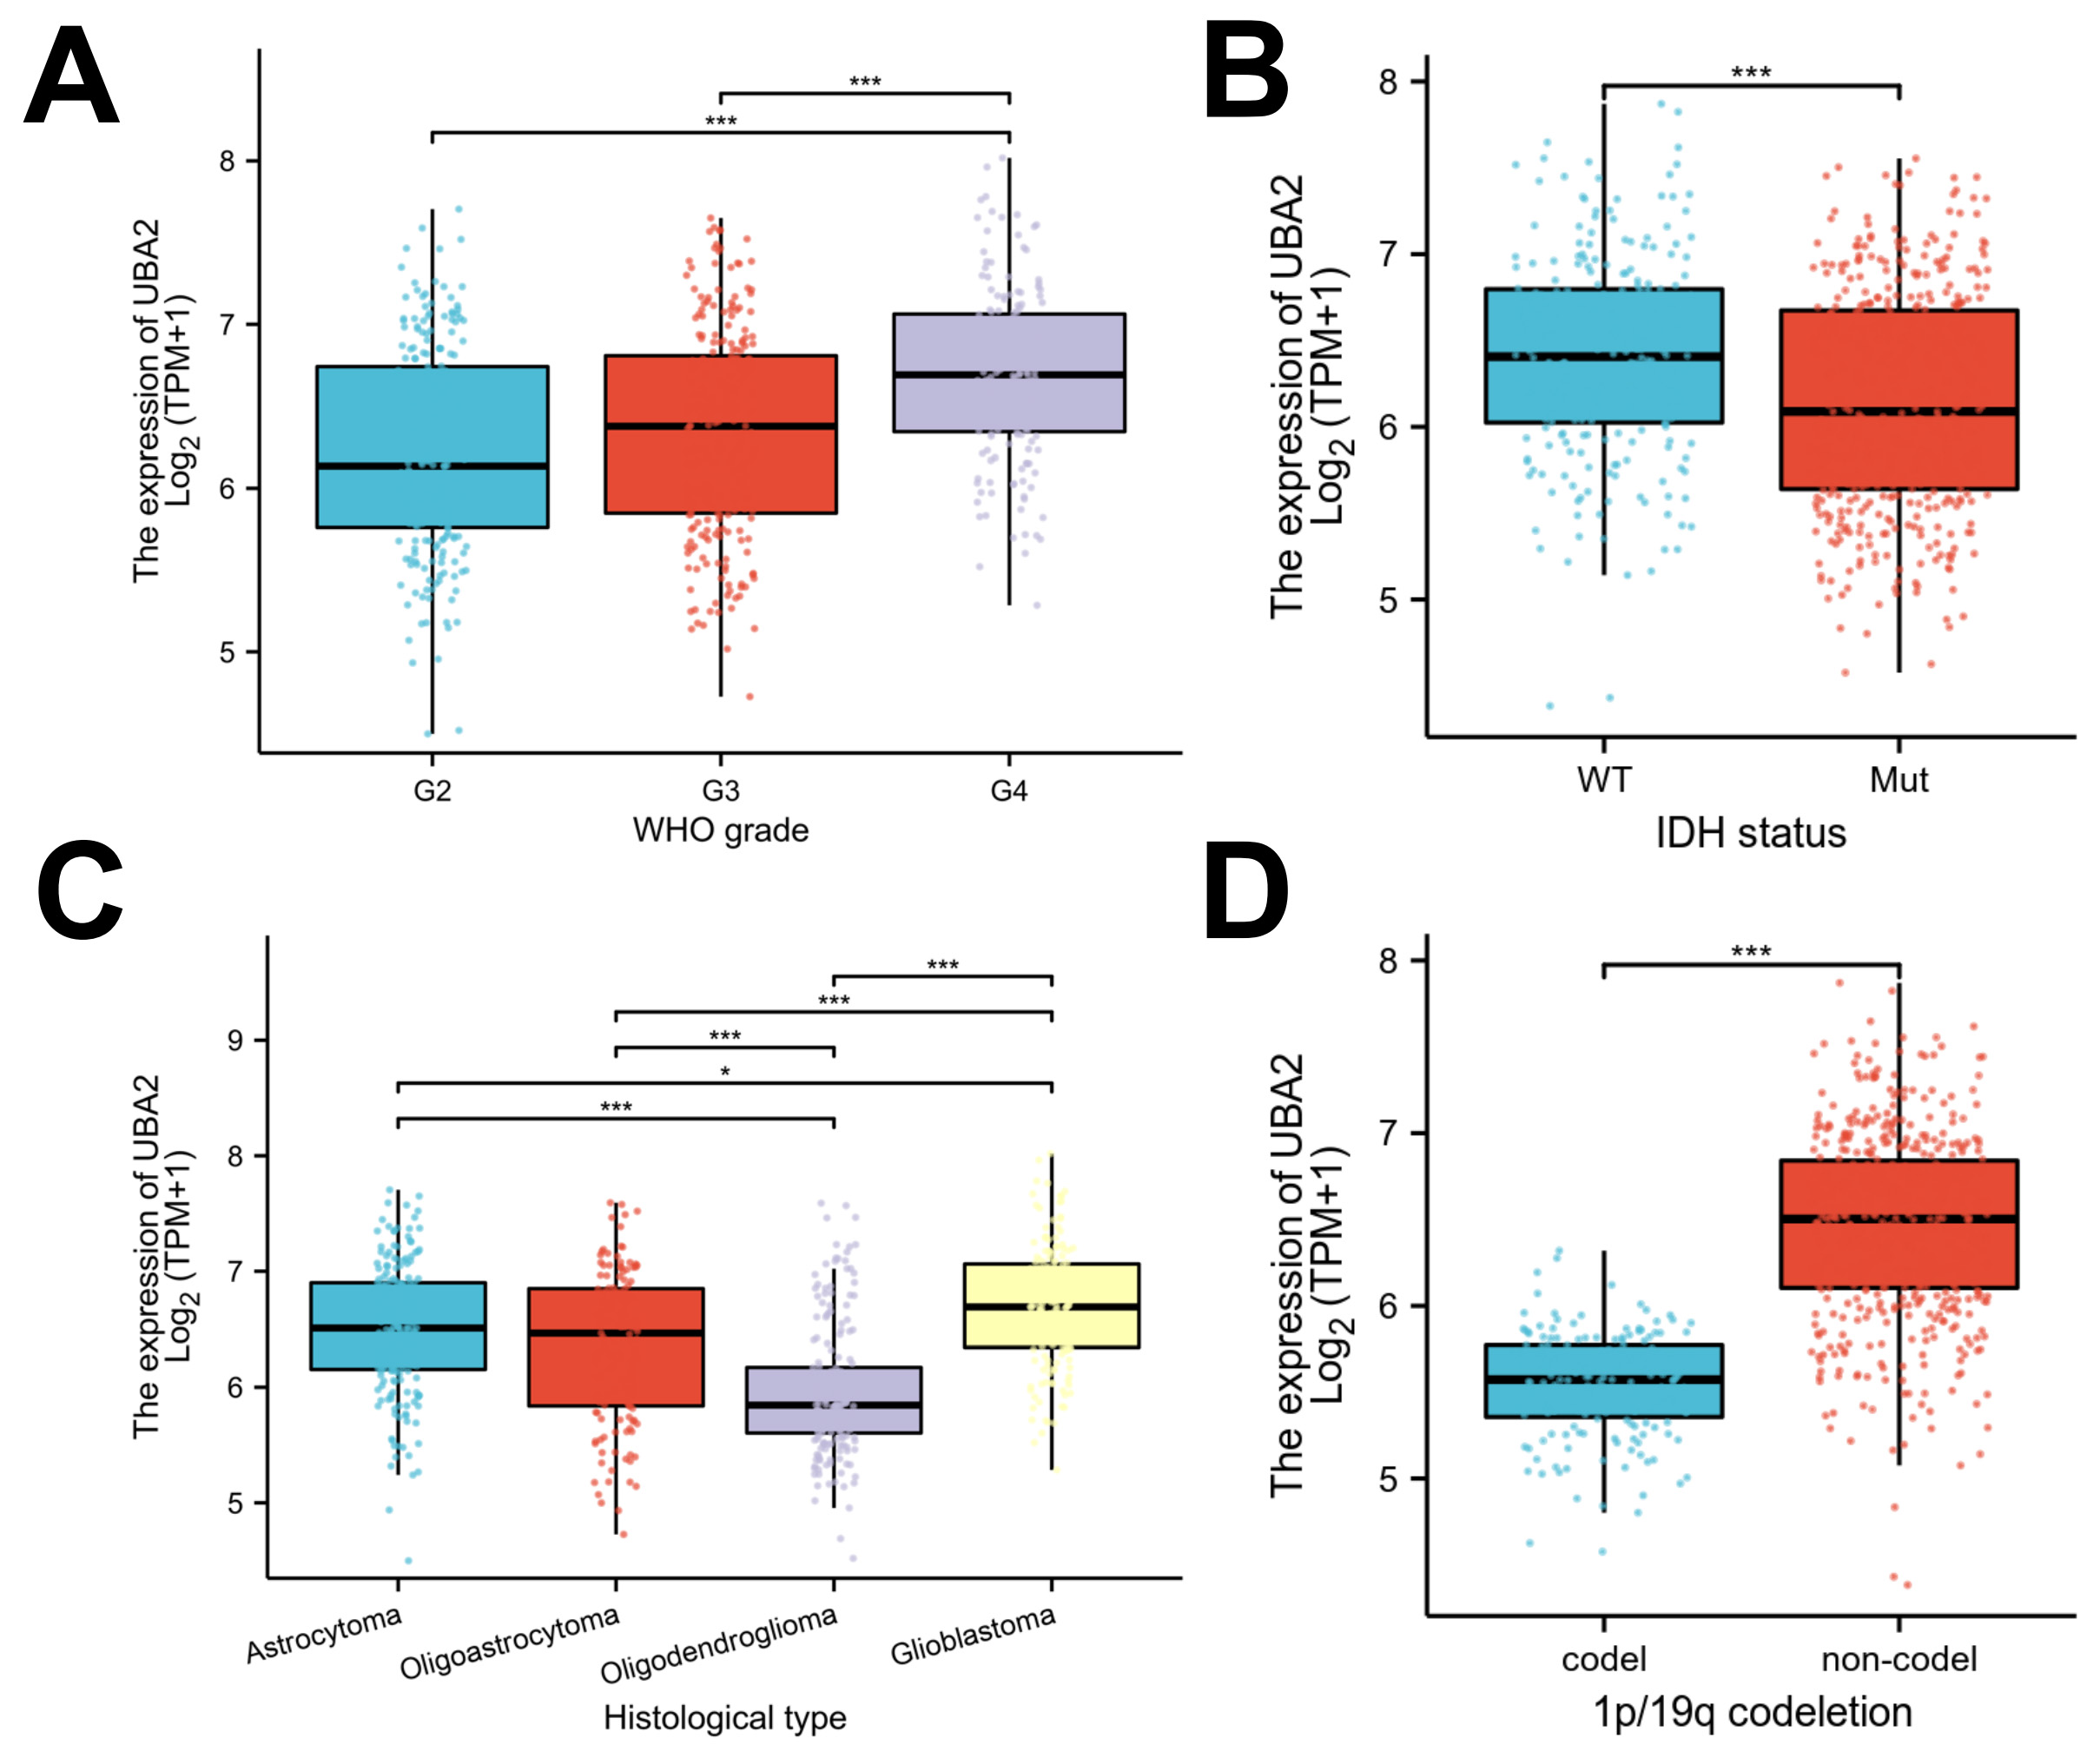 Fig. 2.
Associations between UBA2 expression and clinicopathological
parameters. Violin plots indicating UBA2 expression in different (A) WHO grade,
(B) IDH status, (C) histological type, and (D) 1p/19q
co-deletion status from the TCGA database. (*p
K-M analysis to explore the association between UBA2 expression and survival in
glioma patients from the TCGA database. Patients with high UBA2 expression showed
significantly worse OS, PFI, and DSS than those with low UBA2 expression (Fig. 3A–C). Further subgroup analyses revealed that high UBA2 expression was
associated with poorer OS in patients with WHO grade 2 glioma, oligodendroglioma,
and IDH mutant glioma, as well as in both male and female patients, aged
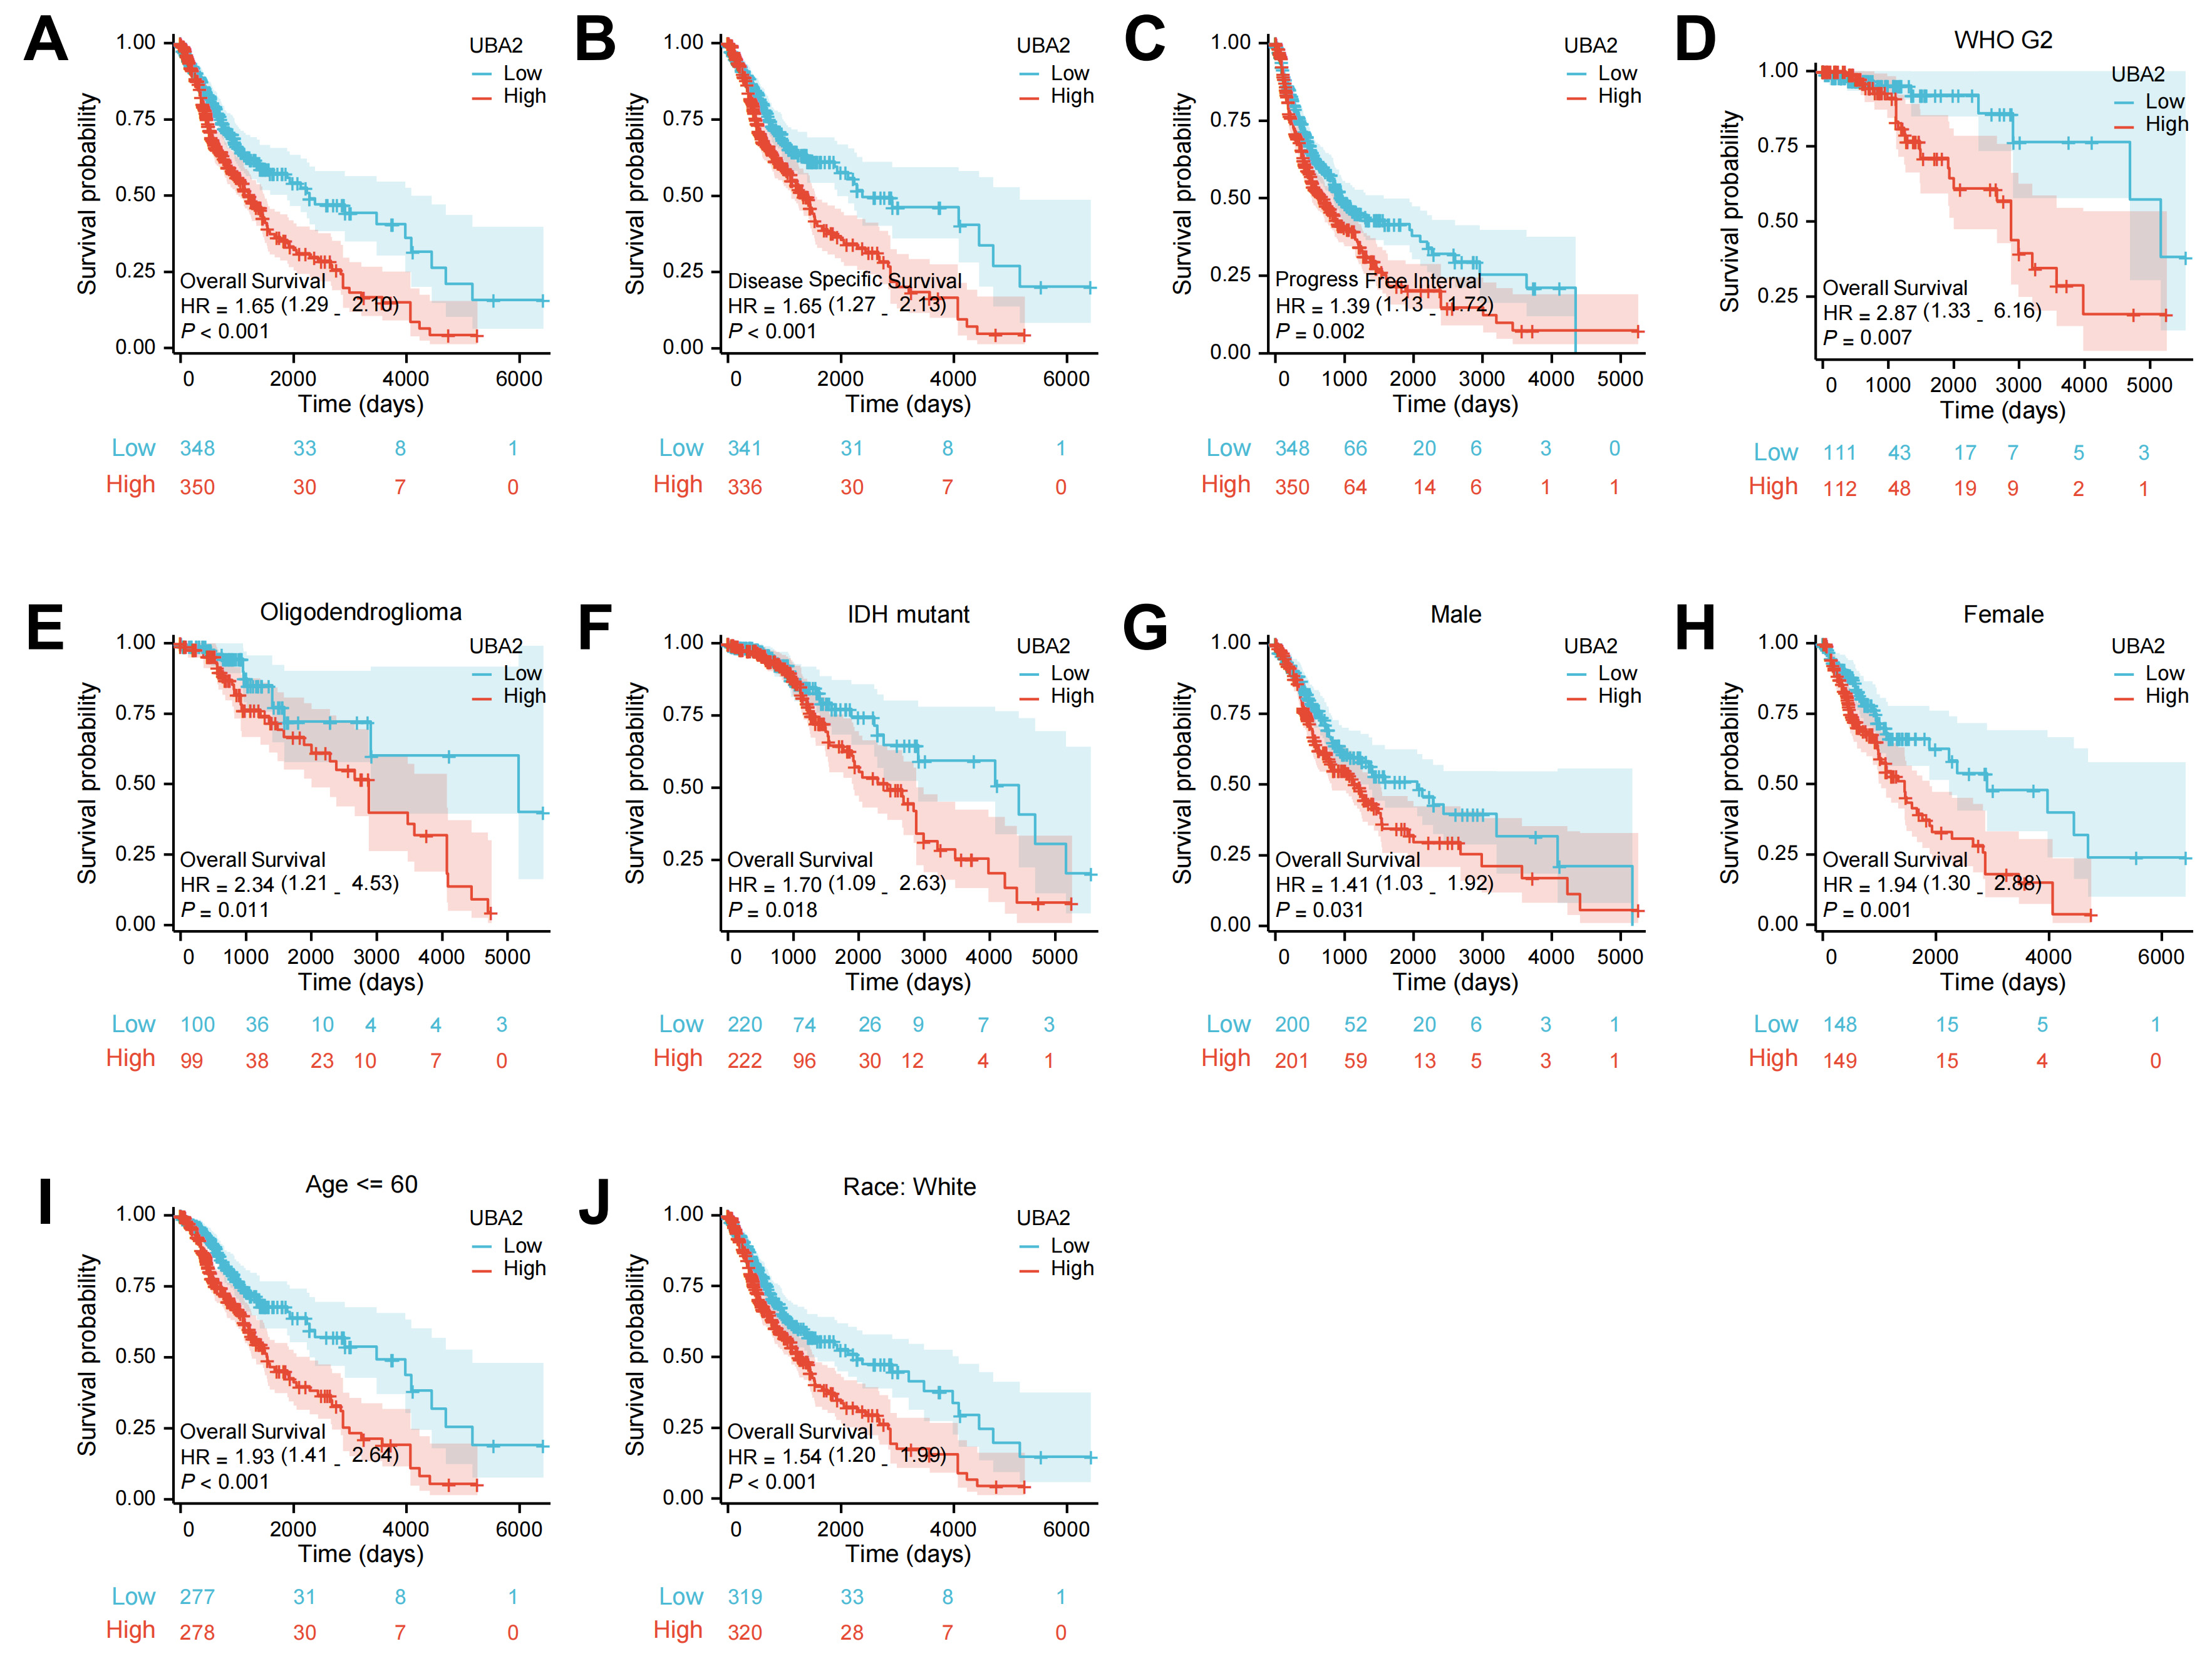 Fig. 3.
The survival curves of UBA2 high- and low-expression groups in
glioma patients from TCGA database. The survival curves of (A) OS, (B) PFS, and
(C) DSS. The survival curves of OS in (D) WHO grade 2, (E) oligodendroglioma, (F)
IDH-mutation, both (G) male and (H) female, (I) age
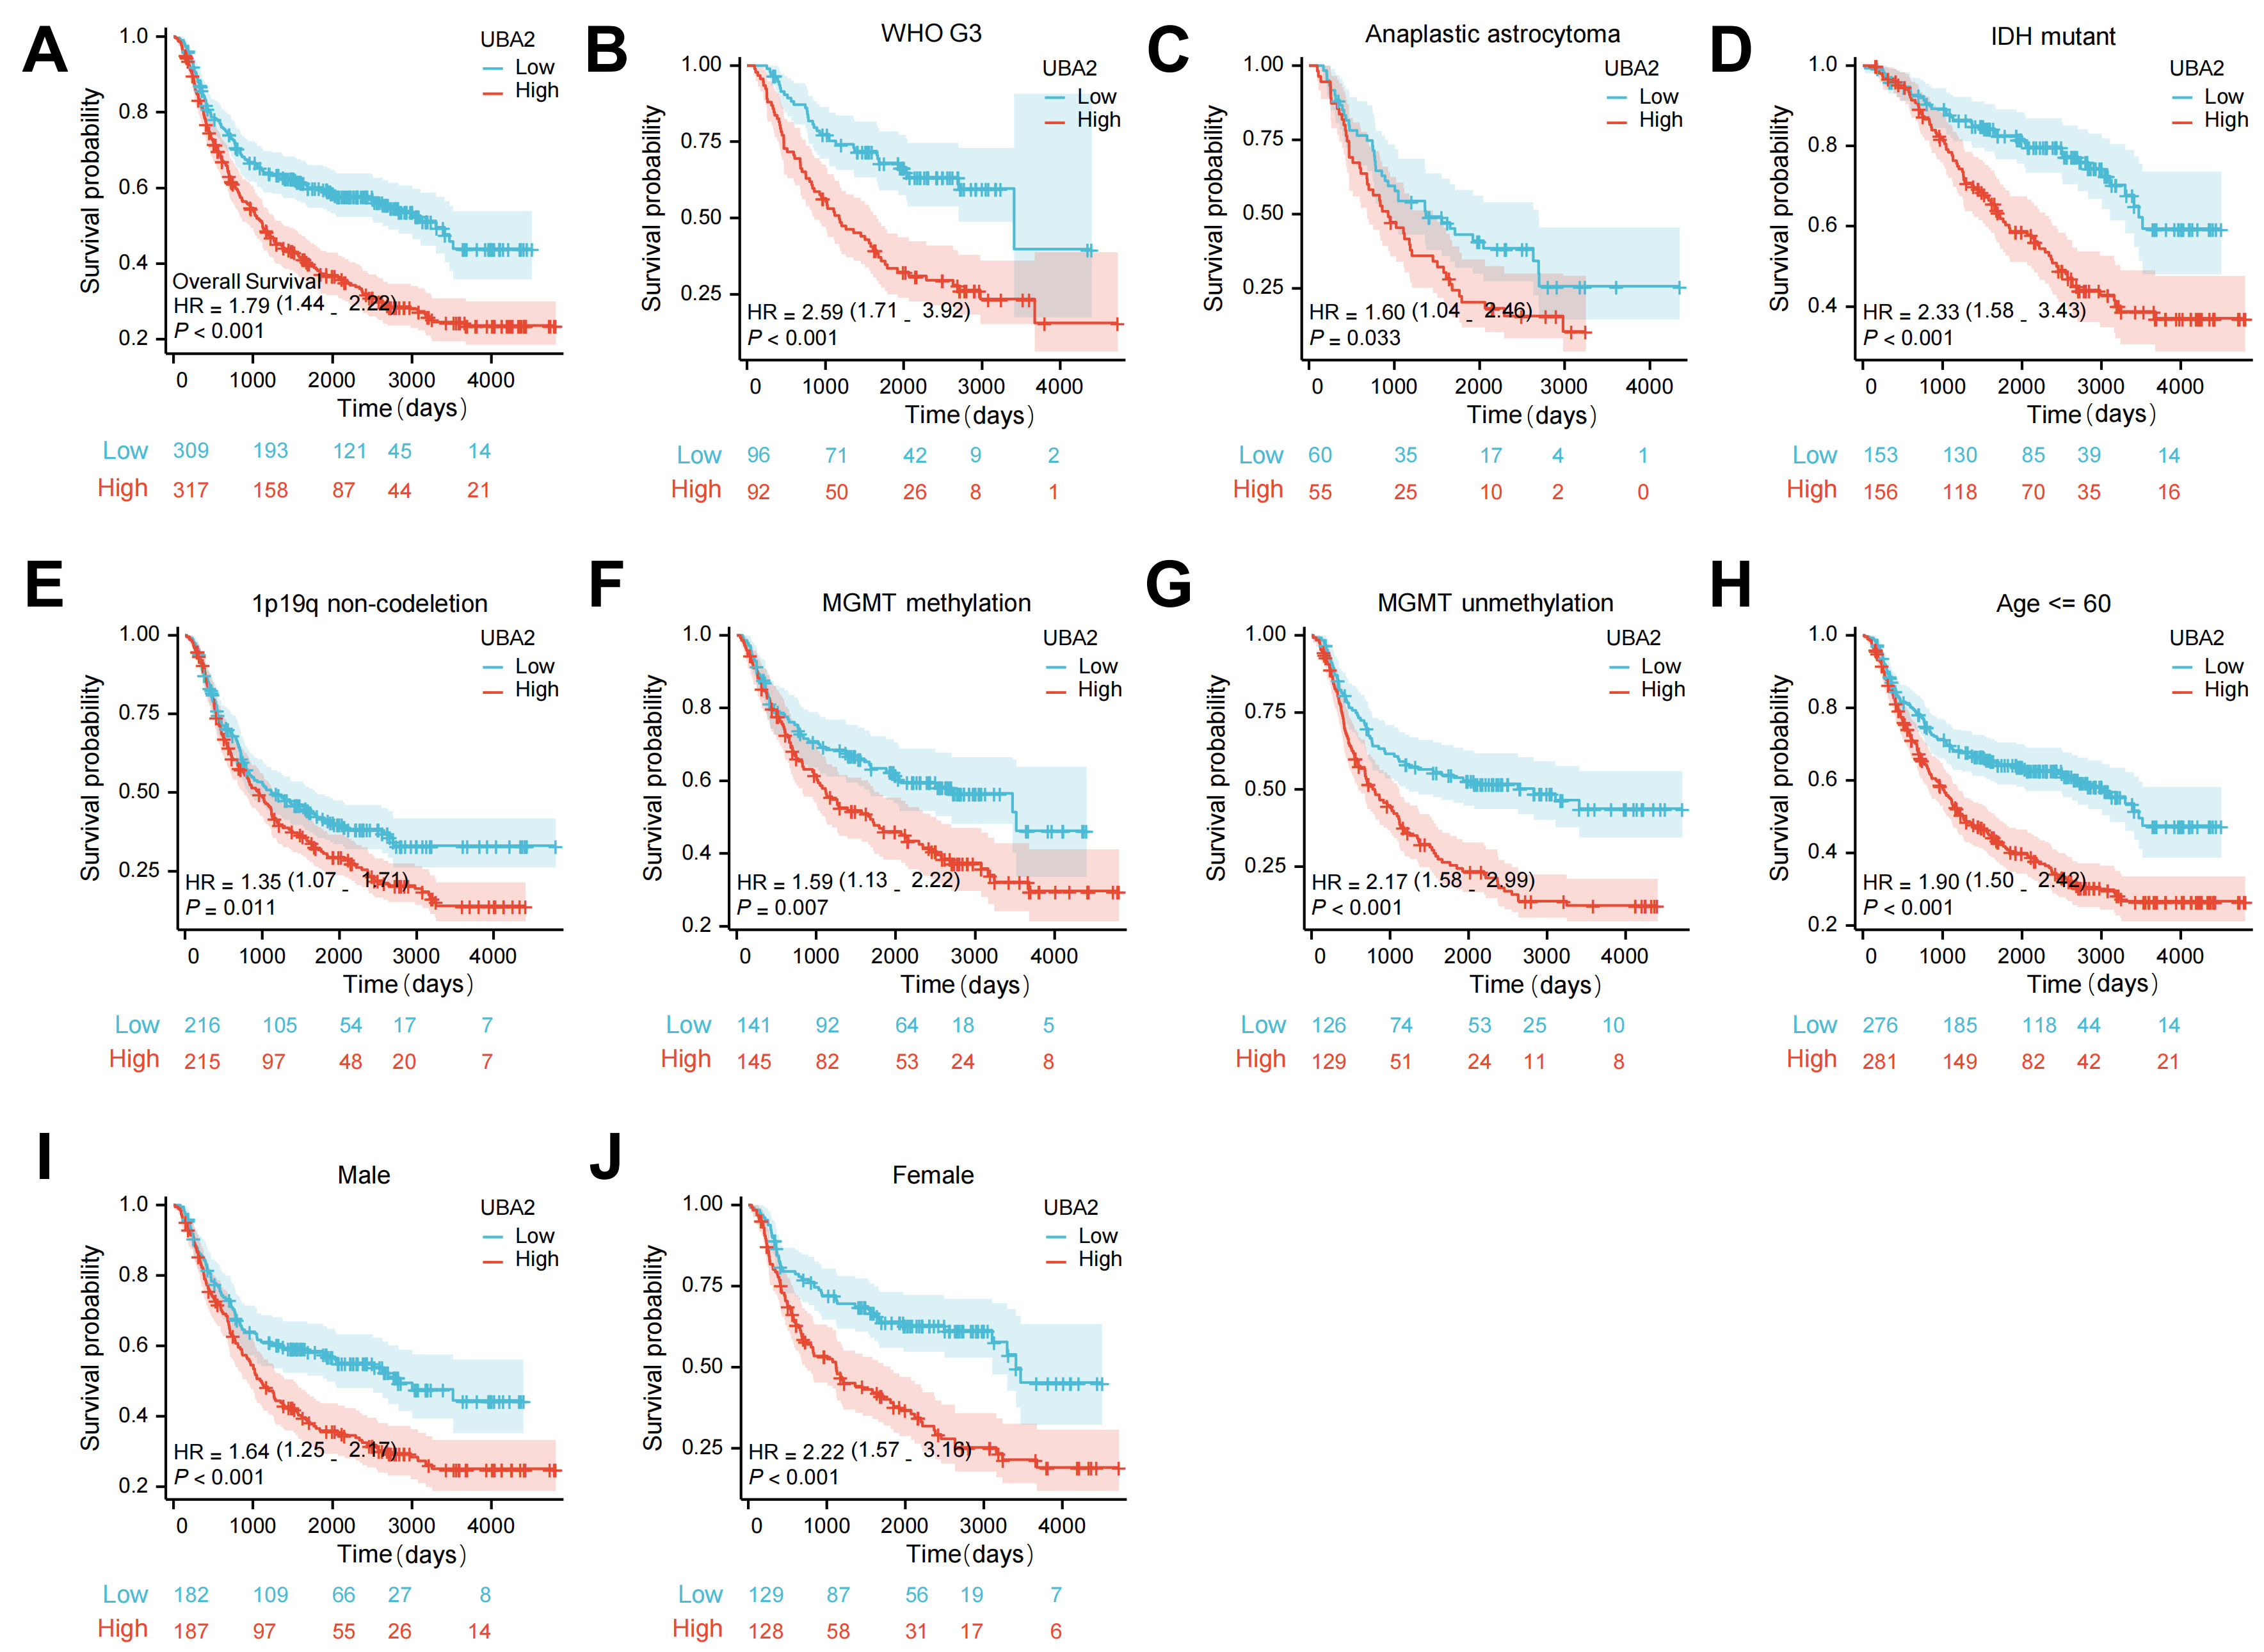 Fig. 4.
The survival curves of UBA2 high- and low-expression groups in
glioma patients from CGGA database. (A) The survival curves of OS. The survival
curves of OS in (B) WHO grade 3, (C) anaplastic astrocytoma, (D)
IDH-mutation, (E) 1p/19q non-codeletion, both (F)
MGMT methylation and (G) unmethylation, (H) age
To further examine whether UBA2 is a prognostic factor for glioma, data from the TCGA database was used to perform univariate and multivariate Cox regression analyses. IDH status, patient age, WHO grade, 1p19q codeletion, sex, and UBA2 expression levels were all significantly associated with OS in univariate analysis (Fig. 5A). Multivariate analysis further revealed that patient age, IDH status, and WHO grade were independent prognostic factors (Fig. 5B). Next, a nomogram was constructed using WHO grade, IDH status, age, and UBA2 expression level to predict 1-year, 3-year, and 5-year OS in glioma patients (Fig. 5C). The calibration curve demonstrated consistency of the observed results with the predicted values (Fig. 5D). Using this method, nomograms for PFI and DSS and their respective calibration curves were also created (Fig. 5E–H). Taken together, these results indicate that UBA2 is a promising prognostic biomarker for glioma.
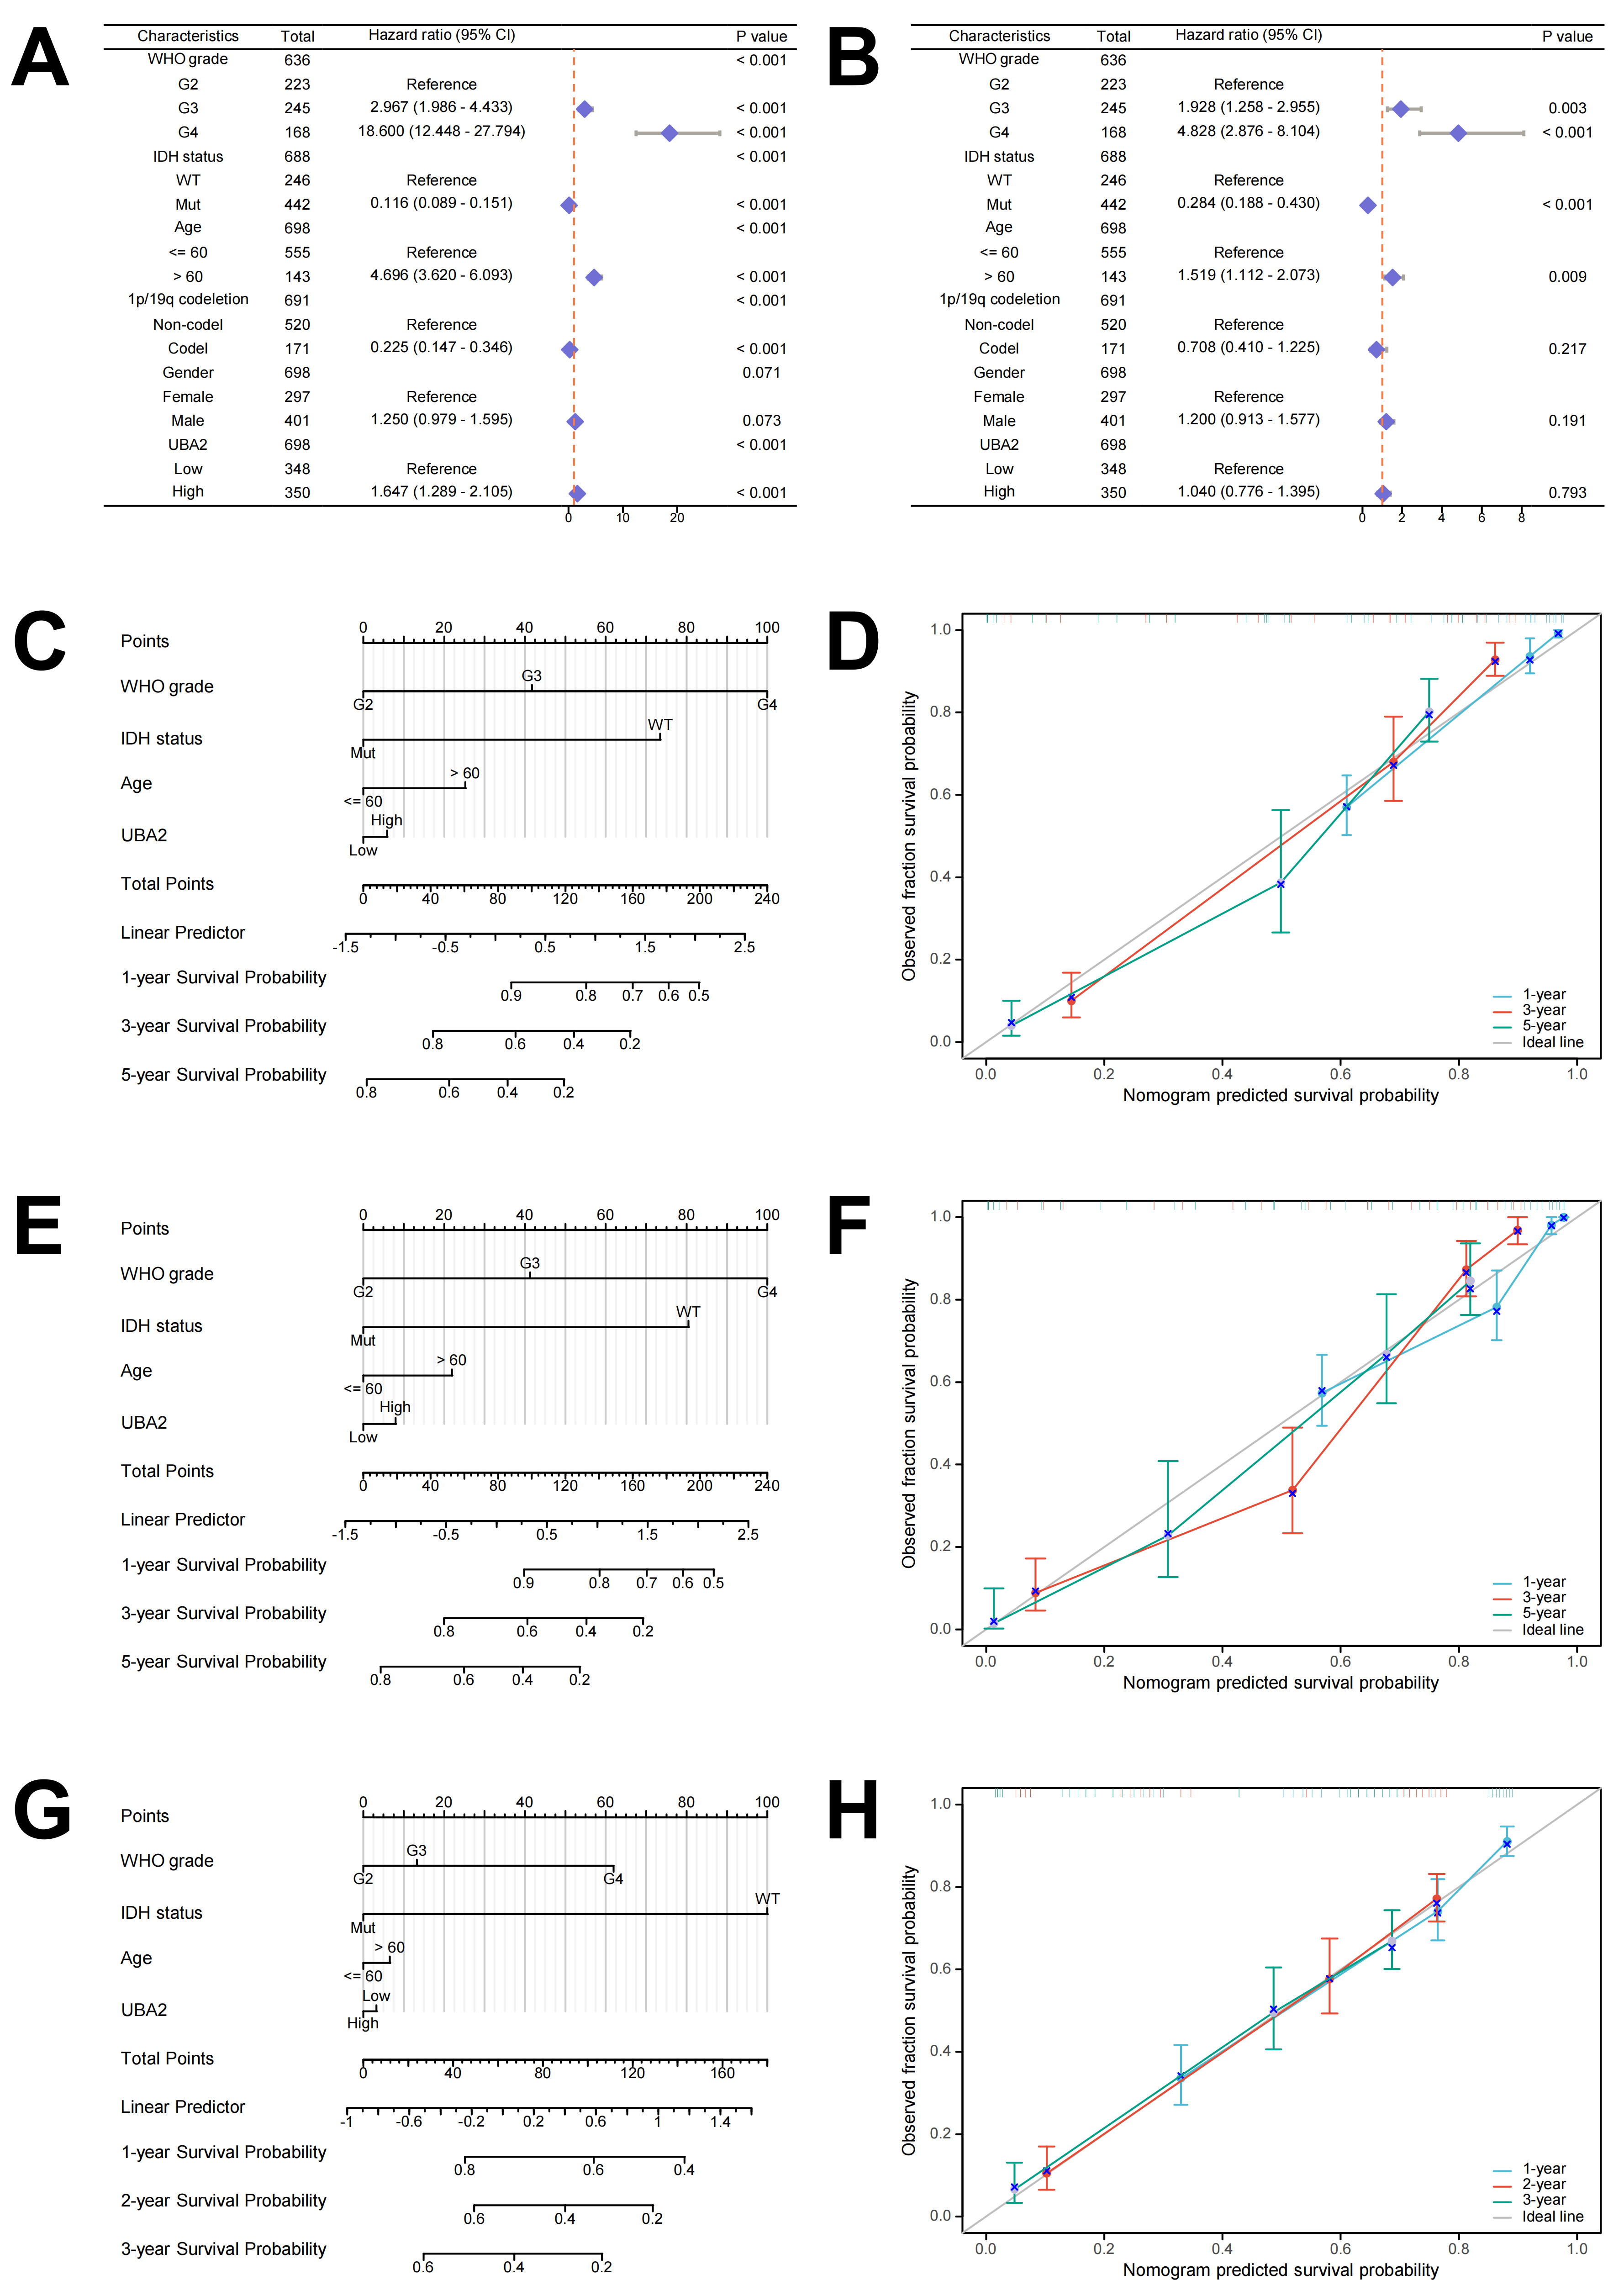 Fig. 5.
The prognostic value of UBA2 in glioma. (A) Univariate and (B) multivariate Cox hazard regression analyses in glioma. (C) Nomogram and (D) calibration curves of 1-, 3-, and 5-year OS probabilities. (E) Nomogram and (F) calibration curves of 1-, 3-, and 5-year PFI probabilities. (G) Nomogram and (H) calibration curves of 1-, 2-, and 3-year DSS probabilities. PFI, progression-free interval.
In light of the prognostic significance of tumor-infiltrating immune cells in gliomas, we next evaluated whether UBA2 expression was related to immune cell infiltration. The ssGSEA computational tool was used to compare the distribution of 24 distinct immune cell subpopulations between the high and low UBA2 expression groups. As shown in Fig. 6A, activated dendritic cells (DC), induced DC, macrophages, neutrophils, T helper cells, gamma delta T cells, and T helper type 2 cells were markably increased in the high UBA2 expression group. In contrast, CD8 T cells, DC, mast cells, natural killer (NK) CD56 bright cells, NK CD56 dim cells, plasmacytoid DC, follicular helper T cells (Tfh), Th17 cells, and T-regulatory cells were markedly lower in the high UBA2 expression group (Fig. 6A). Validation was performed with four algorithms, all of which yielded the same results as above (Fig. 6B). The ImmuneScore, EstimateScore, and StromalScore values were all higher in the UBA2 high expression group compared to the low expression group, with all showing a positive linear correlation (Fig. 6C–H). These findings indicate that UBA2 expression is linked to immune cell infiltration in glioma.
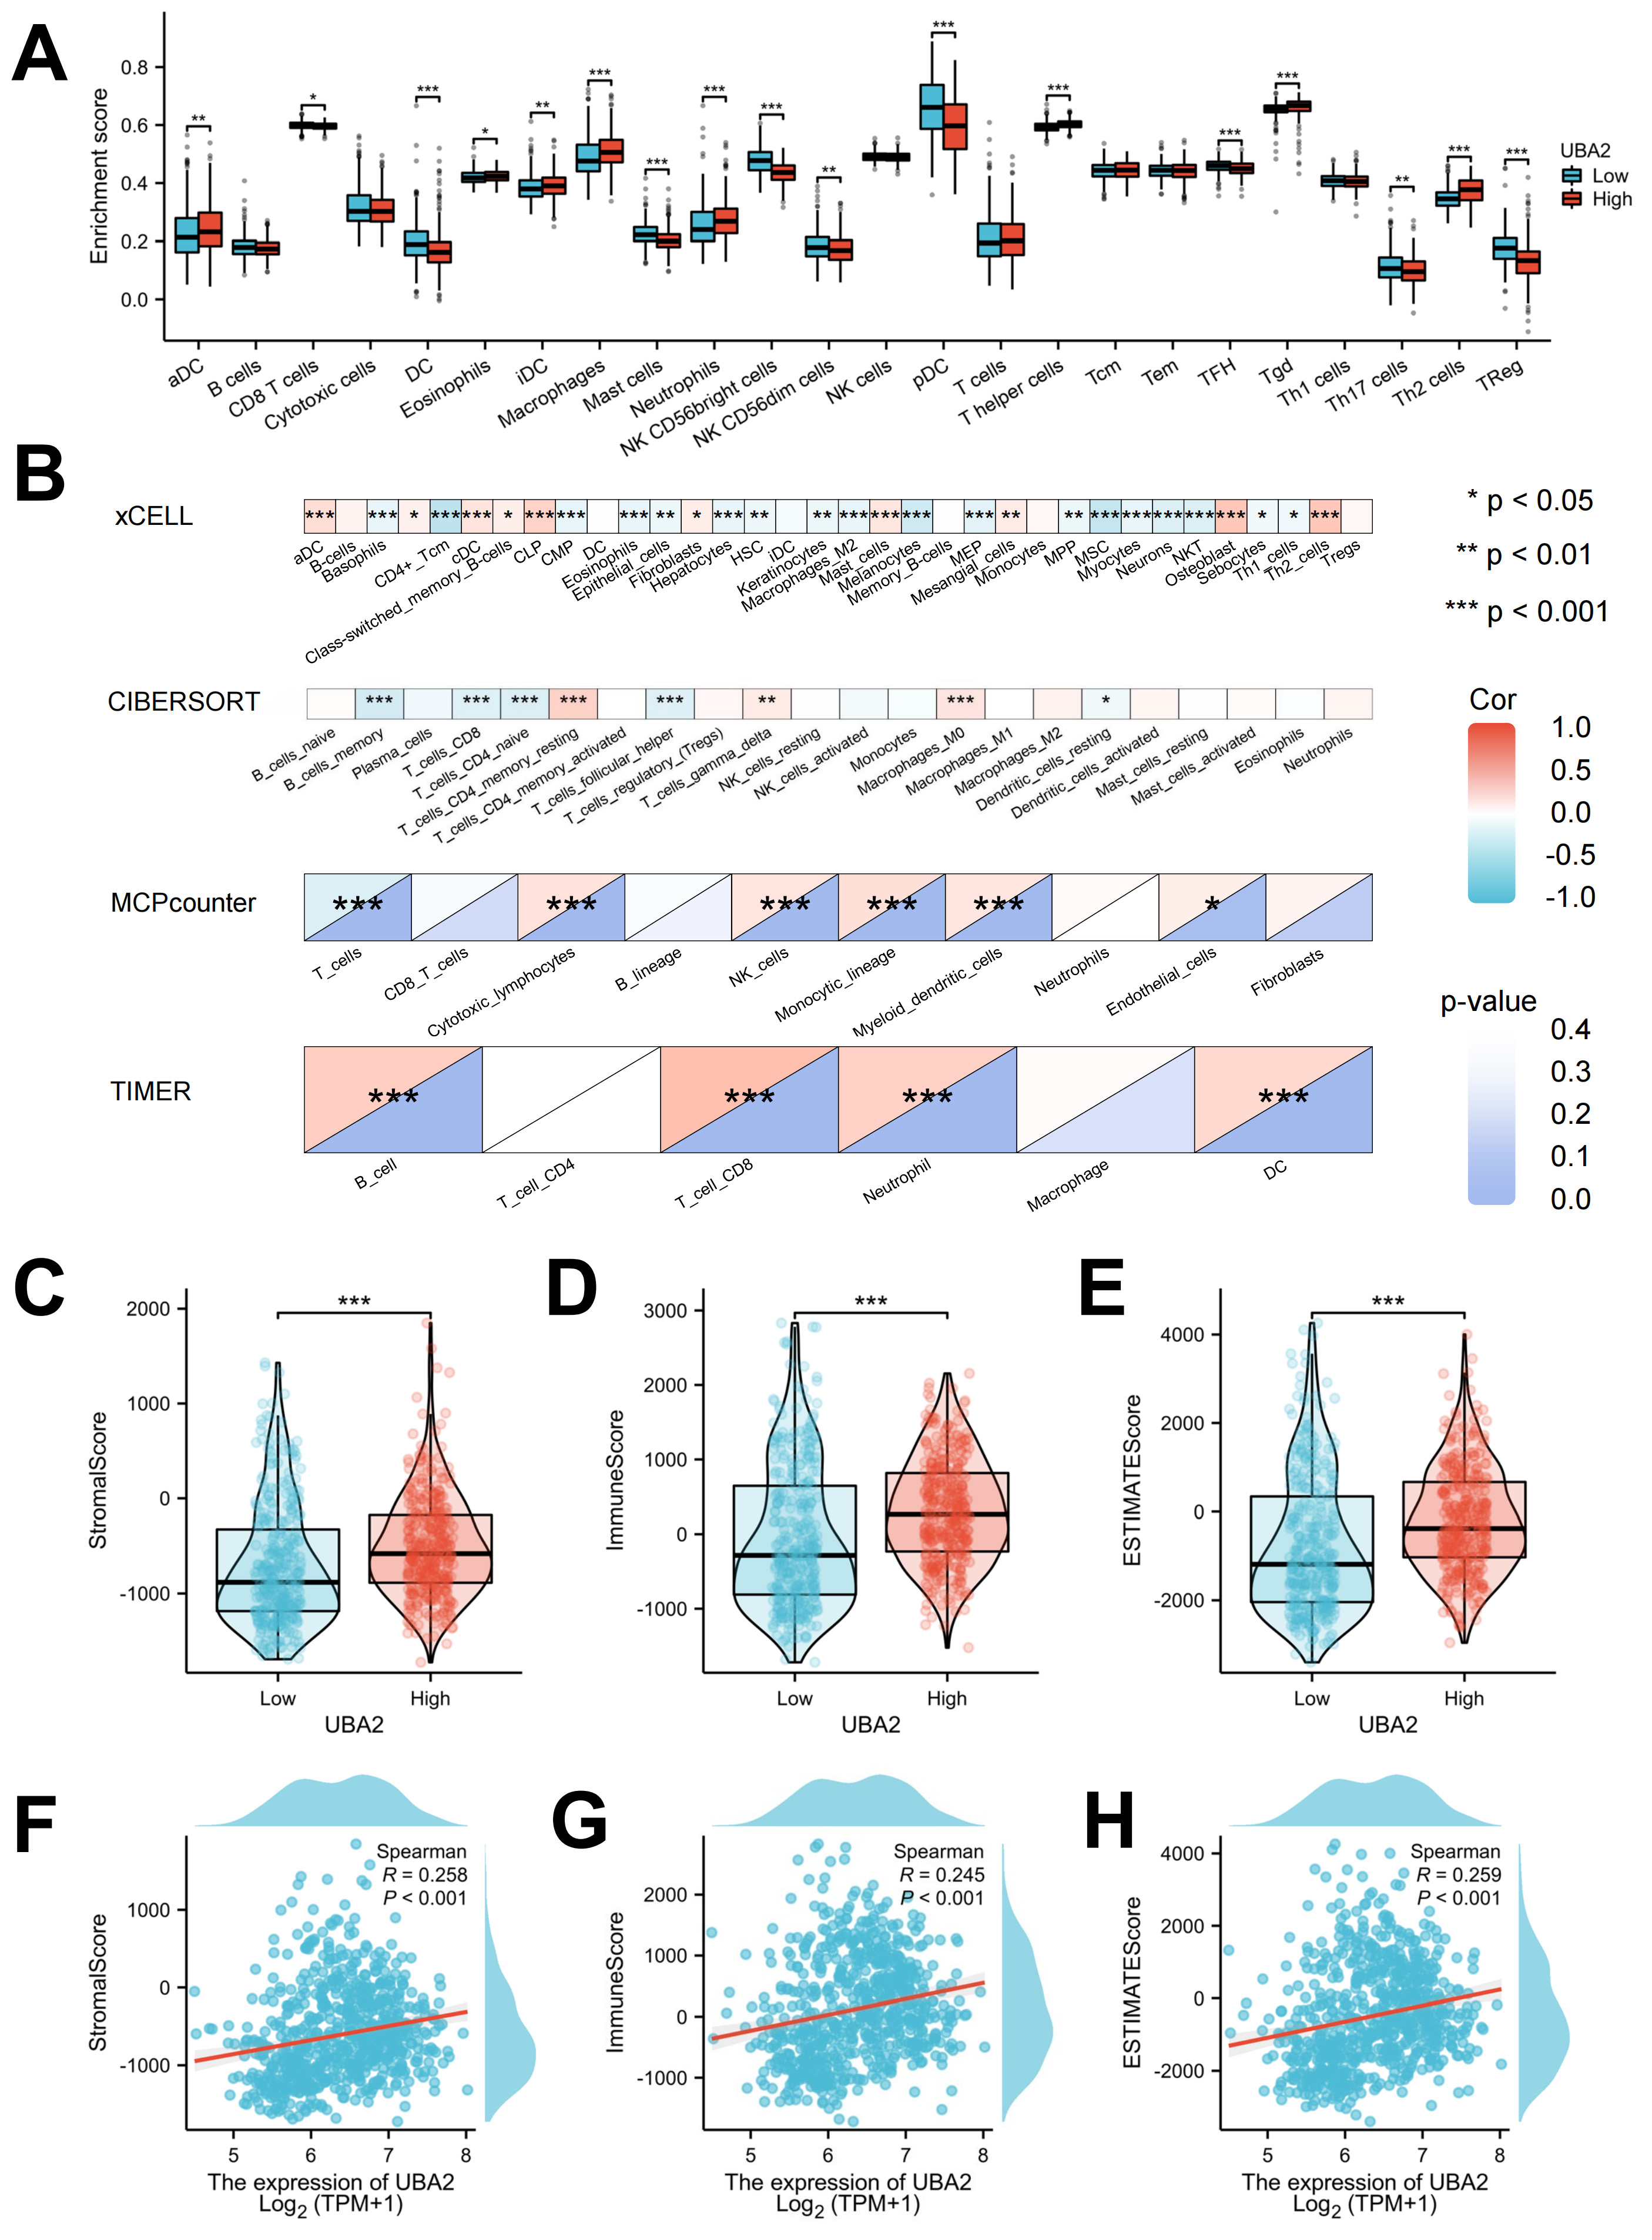 Fig. 6.
Evaluation of the proportions of immune cell infiltration. (A)
Immune cell distribution between tumor and normal tissues by ssGSEA. (B)
Correlation patterns of infiltrating immune cells by 4 different algorithms.
Correlation of UBA2 expression with (C,F) stromal, (D,G) immune, and (E,H)
ESTIMATE scores. (*p
The relationship between UBA2 expression and drug sensitivity was analyzed using the RNAactDrug database. The calculated values showed a relationship between UBA2 expression and the IC50 of drugs. Sensitivities to Nilotinib, Erlotinib, Panobinostat, Sorafenib, Topotecan, and Irinotecan were all positively associated with UBA2 expression (Fig. 7A). A total of 6, 124, and 35 compounds from the CCLE, CTRP, and CGP databases, respectively, were screened by CARE (Fig. 7B). Twenty of these compounds contained in at least two of the databases were selected for visualization and to label their targets, including drugs such as Nilotinib, Sorafenib, Axitinib, Vorinostat, Linifanib, Navitoclax, Cabozantinib, Imatinib, Quizartinib, Abraxane, Topotecan, and Panobinostat. These drugs are already on the market or have been used in clinical trials (Fig. 7C). The findings show that UBA2 expression is associated with the drug sensitivity of cancers.
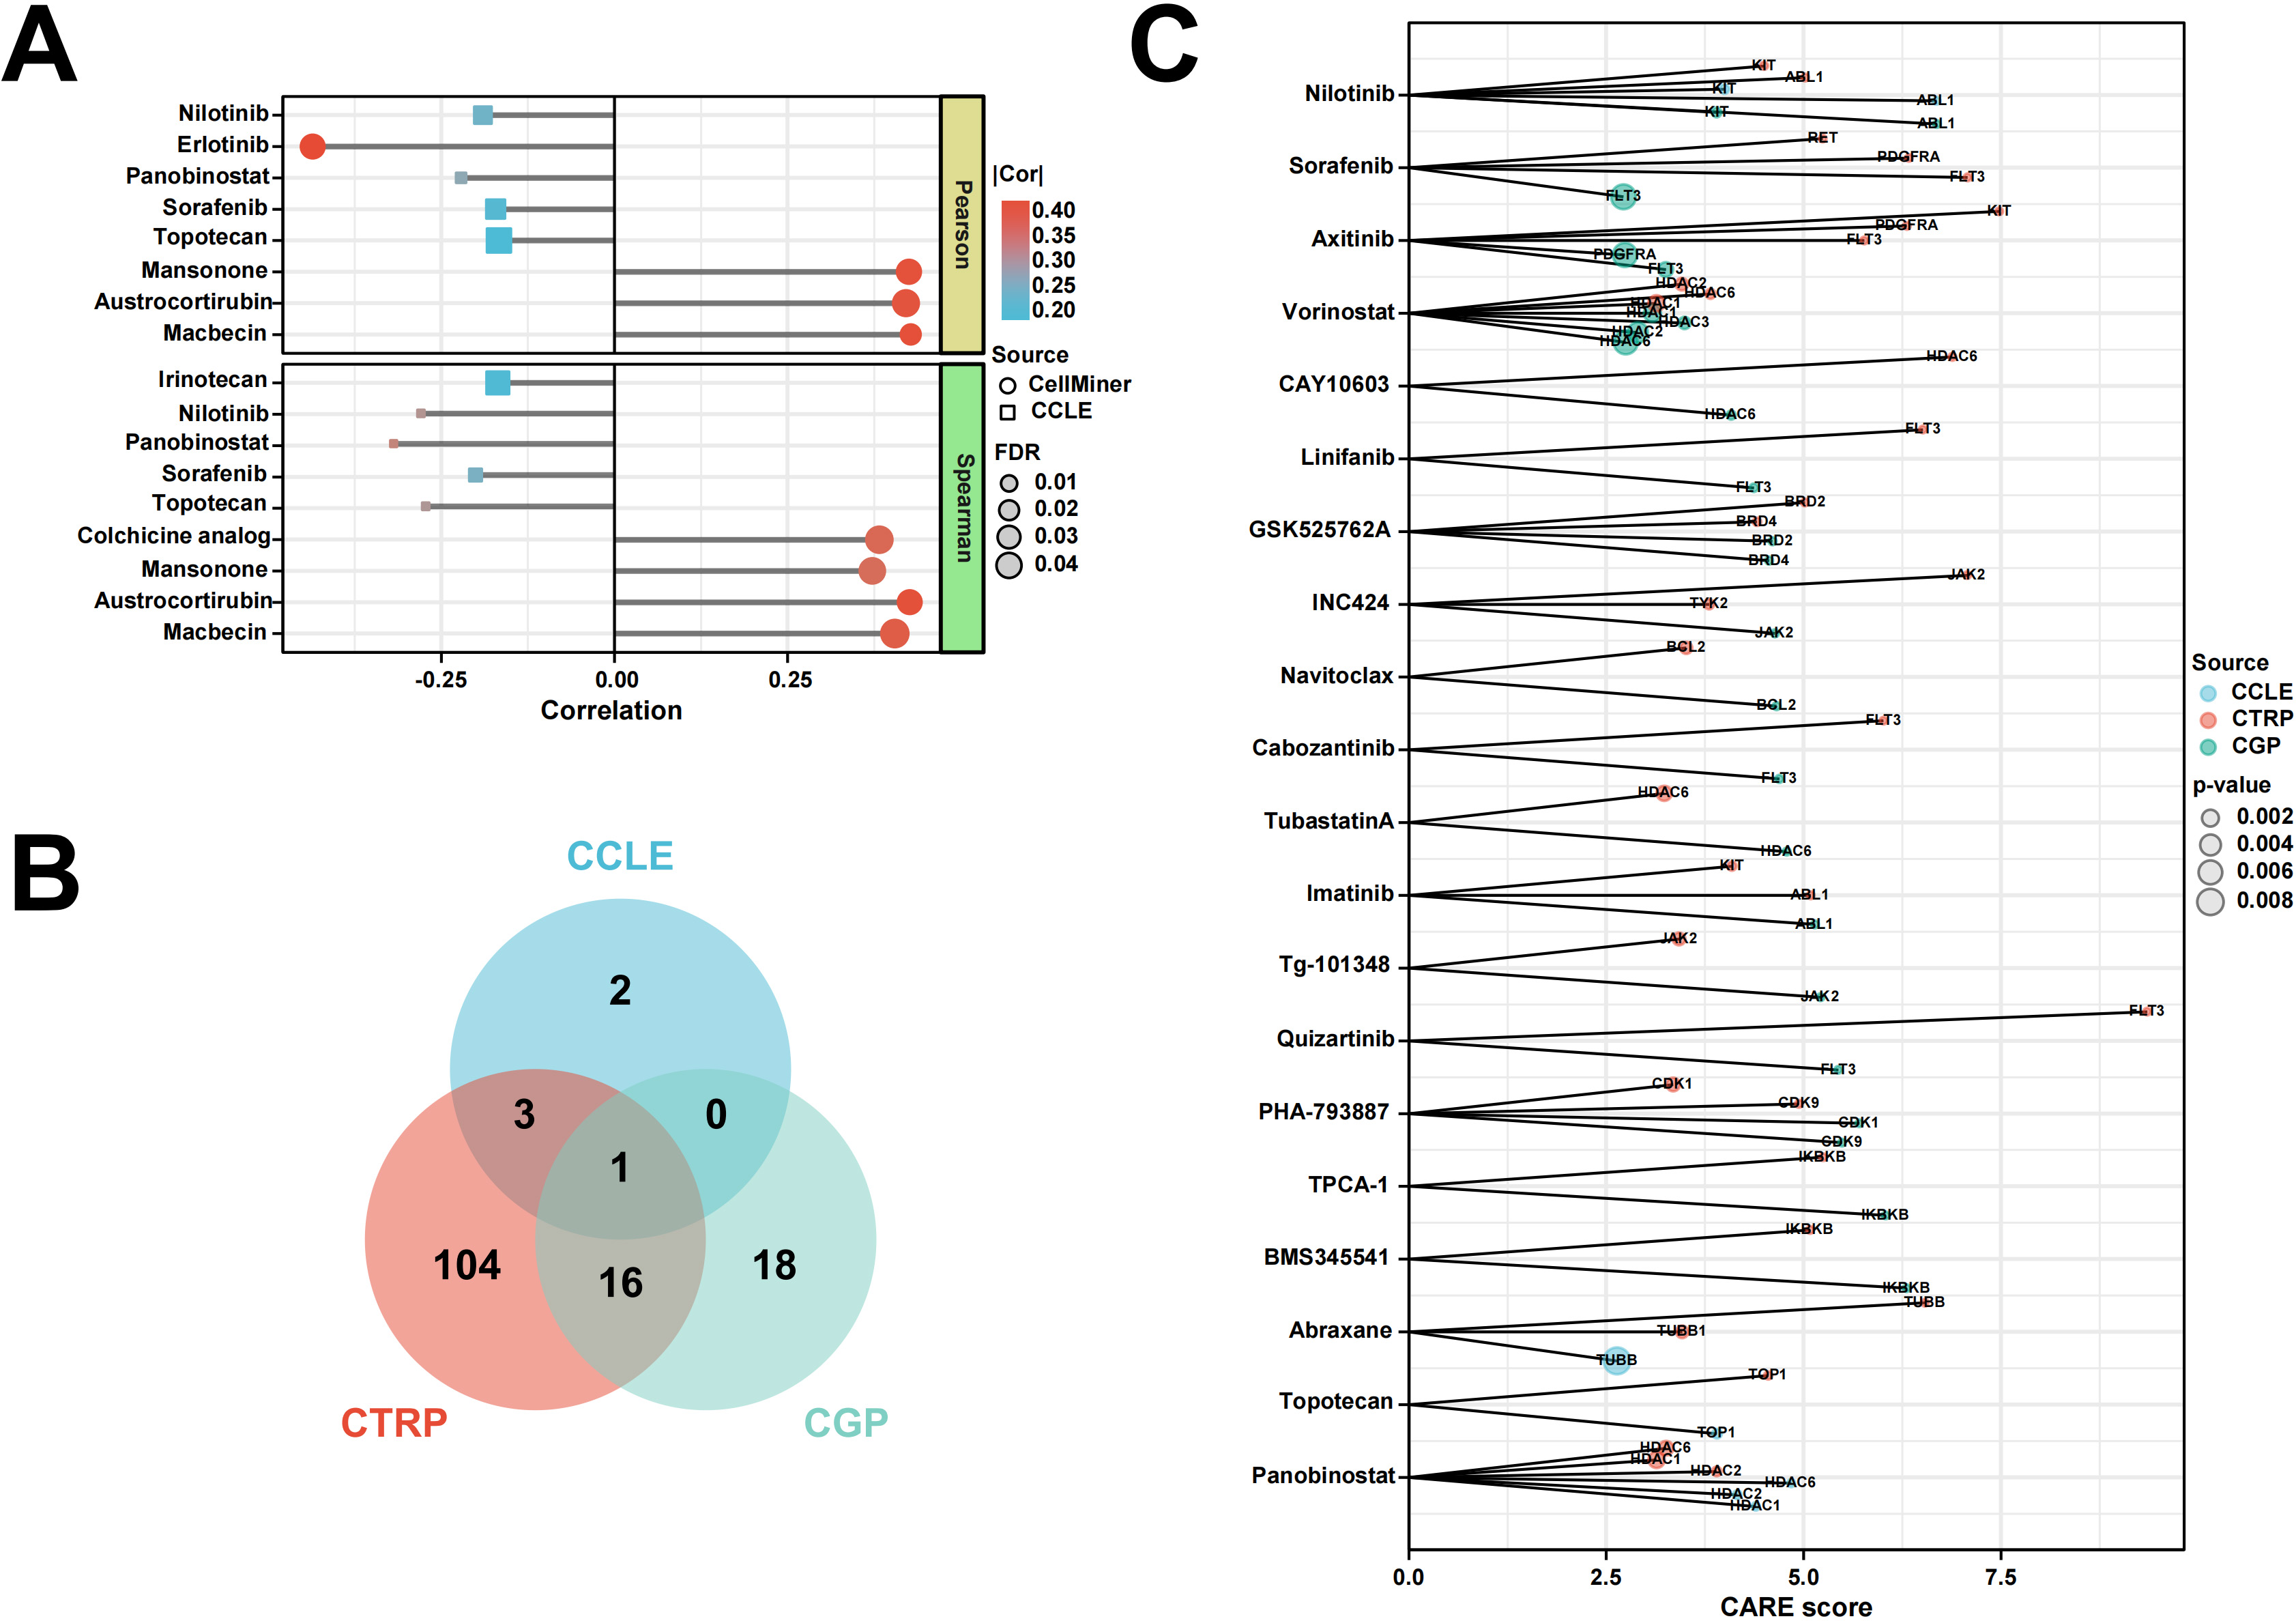 Fig. 7.
Relationship between UBA2 expression and drug sensitivity. (A) Lollipop chart shows the correlation between UBA2 expression and drug sensitivity of tumor cells by RNAactDrug. (B) Venn diagram indicates the shared drug of three source using CARE. (C) Visualization of drugs overlapping in (B) and labeling of their targets. CCLE, Cancer Cell Line Encyclopedia; CTRP, Cancer Therapeutic Response Portal; CARE, Computational Analysis of Resistance.
To further examine the involvement of UBA2 in glioma development, lentiviruses carrying short hairpin RNA were used for stable knockdown of UBA2 in U87 cells (shUBA2-U87) and for the negative control (shNC-U87). Both the protein and mRNA levels of UBA2 were markedly lower in shUBA2-U87 cells, as determined by Western blotting and qRT-PCR (Fig. 8A,B). U87 cells with the shUBA2-1 sequence were selected for subsequent experiments. The CCK-8 assay showed that knockdown of UBA2 significantly slowed the proliferation of U87 cells (Fig. 8C). shUBA2-U87 cells also showed fewer colonies in the colony formation assay (Fig. 8D). The cell apoptosis assay revealed a significantly higher number of apoptotic shUBA2-U87 cells compared to shNC-U87 cells, suggesting that silencing of UBA2 plays a role in cell apoptosis (Fig. 8E). UBA2 knockdown in U87 cells significantly increased G0/G1 phase cells observed in the cell cycle assay, while reducing the S phase cells (Fig. 8F). Furthermore, shUBA2-U87 cells showed greatly reduced migration and invasion capacities (Fig. 8G). Taken together, these findings demonstrate that UBA2 knockdown suppresses the progression of glioma cells.
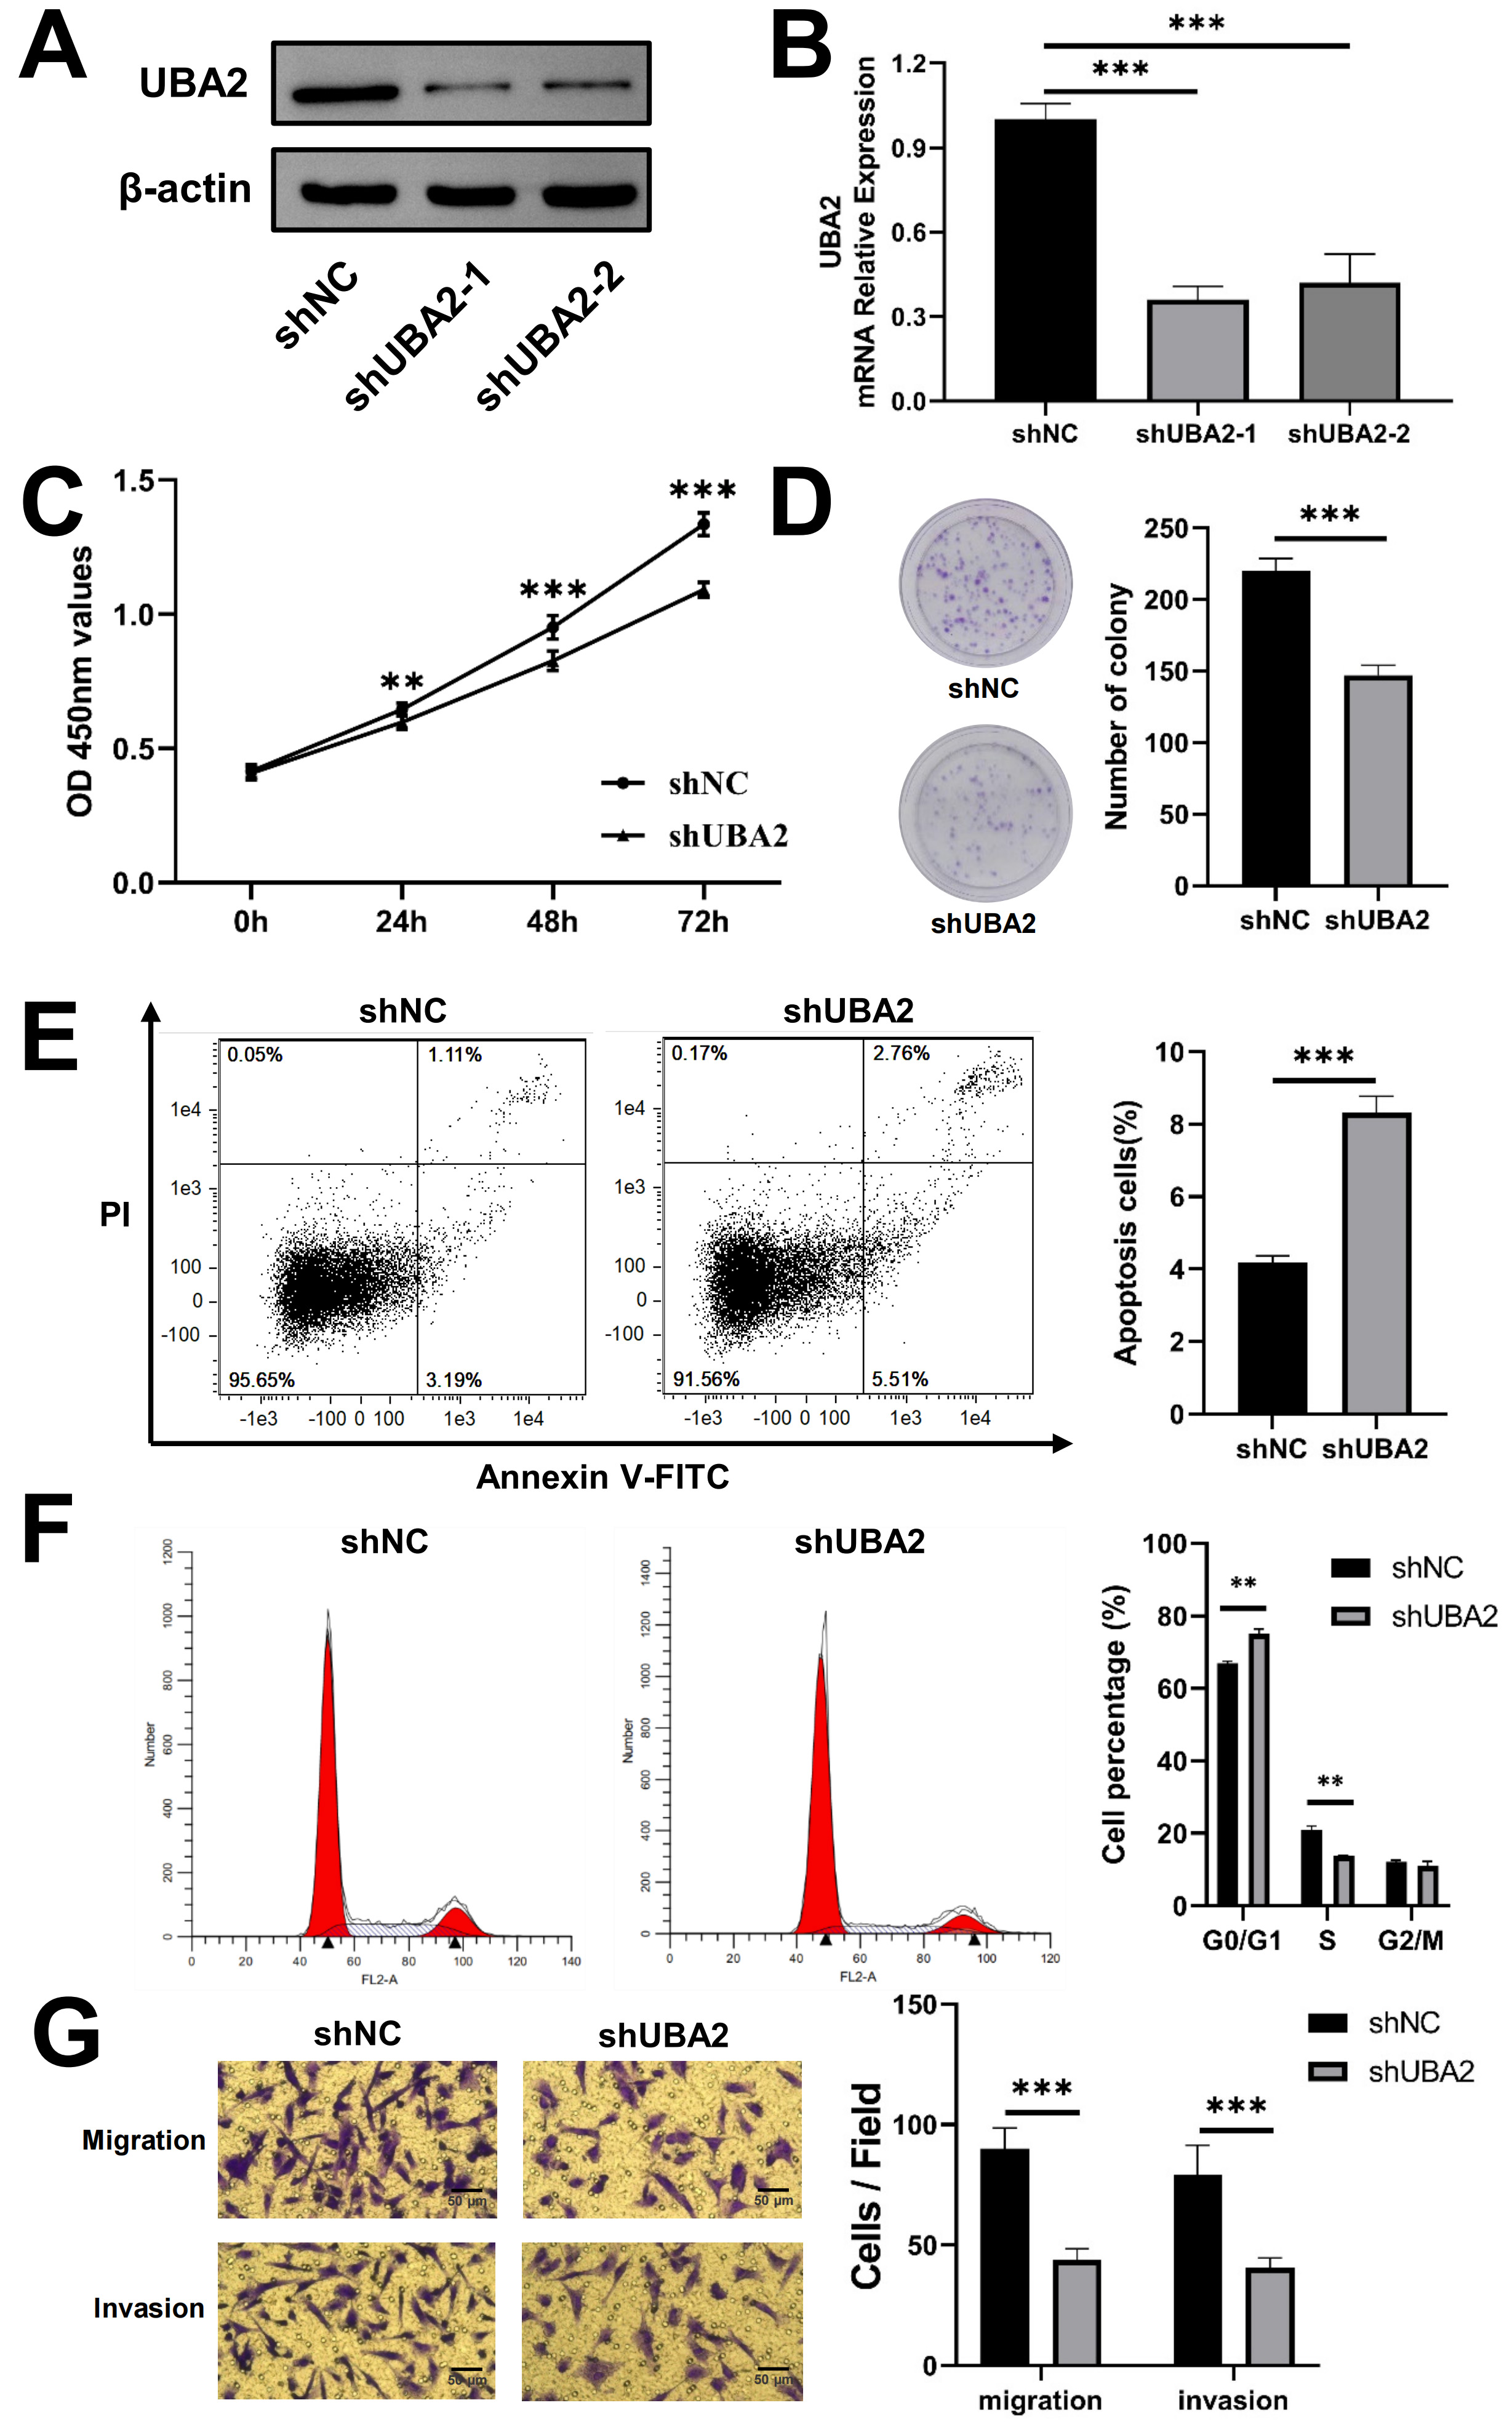 Fig. 8.
Knockdown of UBA2 inhibited U87 cells progression. (A)
Western blotting, (B) quantitative real-time PCR (***p
The CGGA database was used to determine whether UBA2 expression was associated with the outcome of glioma patients after radiotherapy. Individuals with high UBA2 expression levels had a markedly poorer prognosis compared to those with low expression (Fig. 9A). We also investigated whether UBA2 knockdown would sensitize glioma cells to irradiation. The colony formation assay and CCK-8 assay revealed that UBA2 knockdown together with irradiation suppressed cell colony formation and proliferation (Fig. 9B,C). Moreover, the cell apoptosis assay revealed a higher apoptotic rate in irradiated shUBA2-U87 cells than in irradiated shNC-U87 cells (Fig. 9D). In summary, these findings imply that UBA2 knockdown can sensitize glioma cells to irradiation.
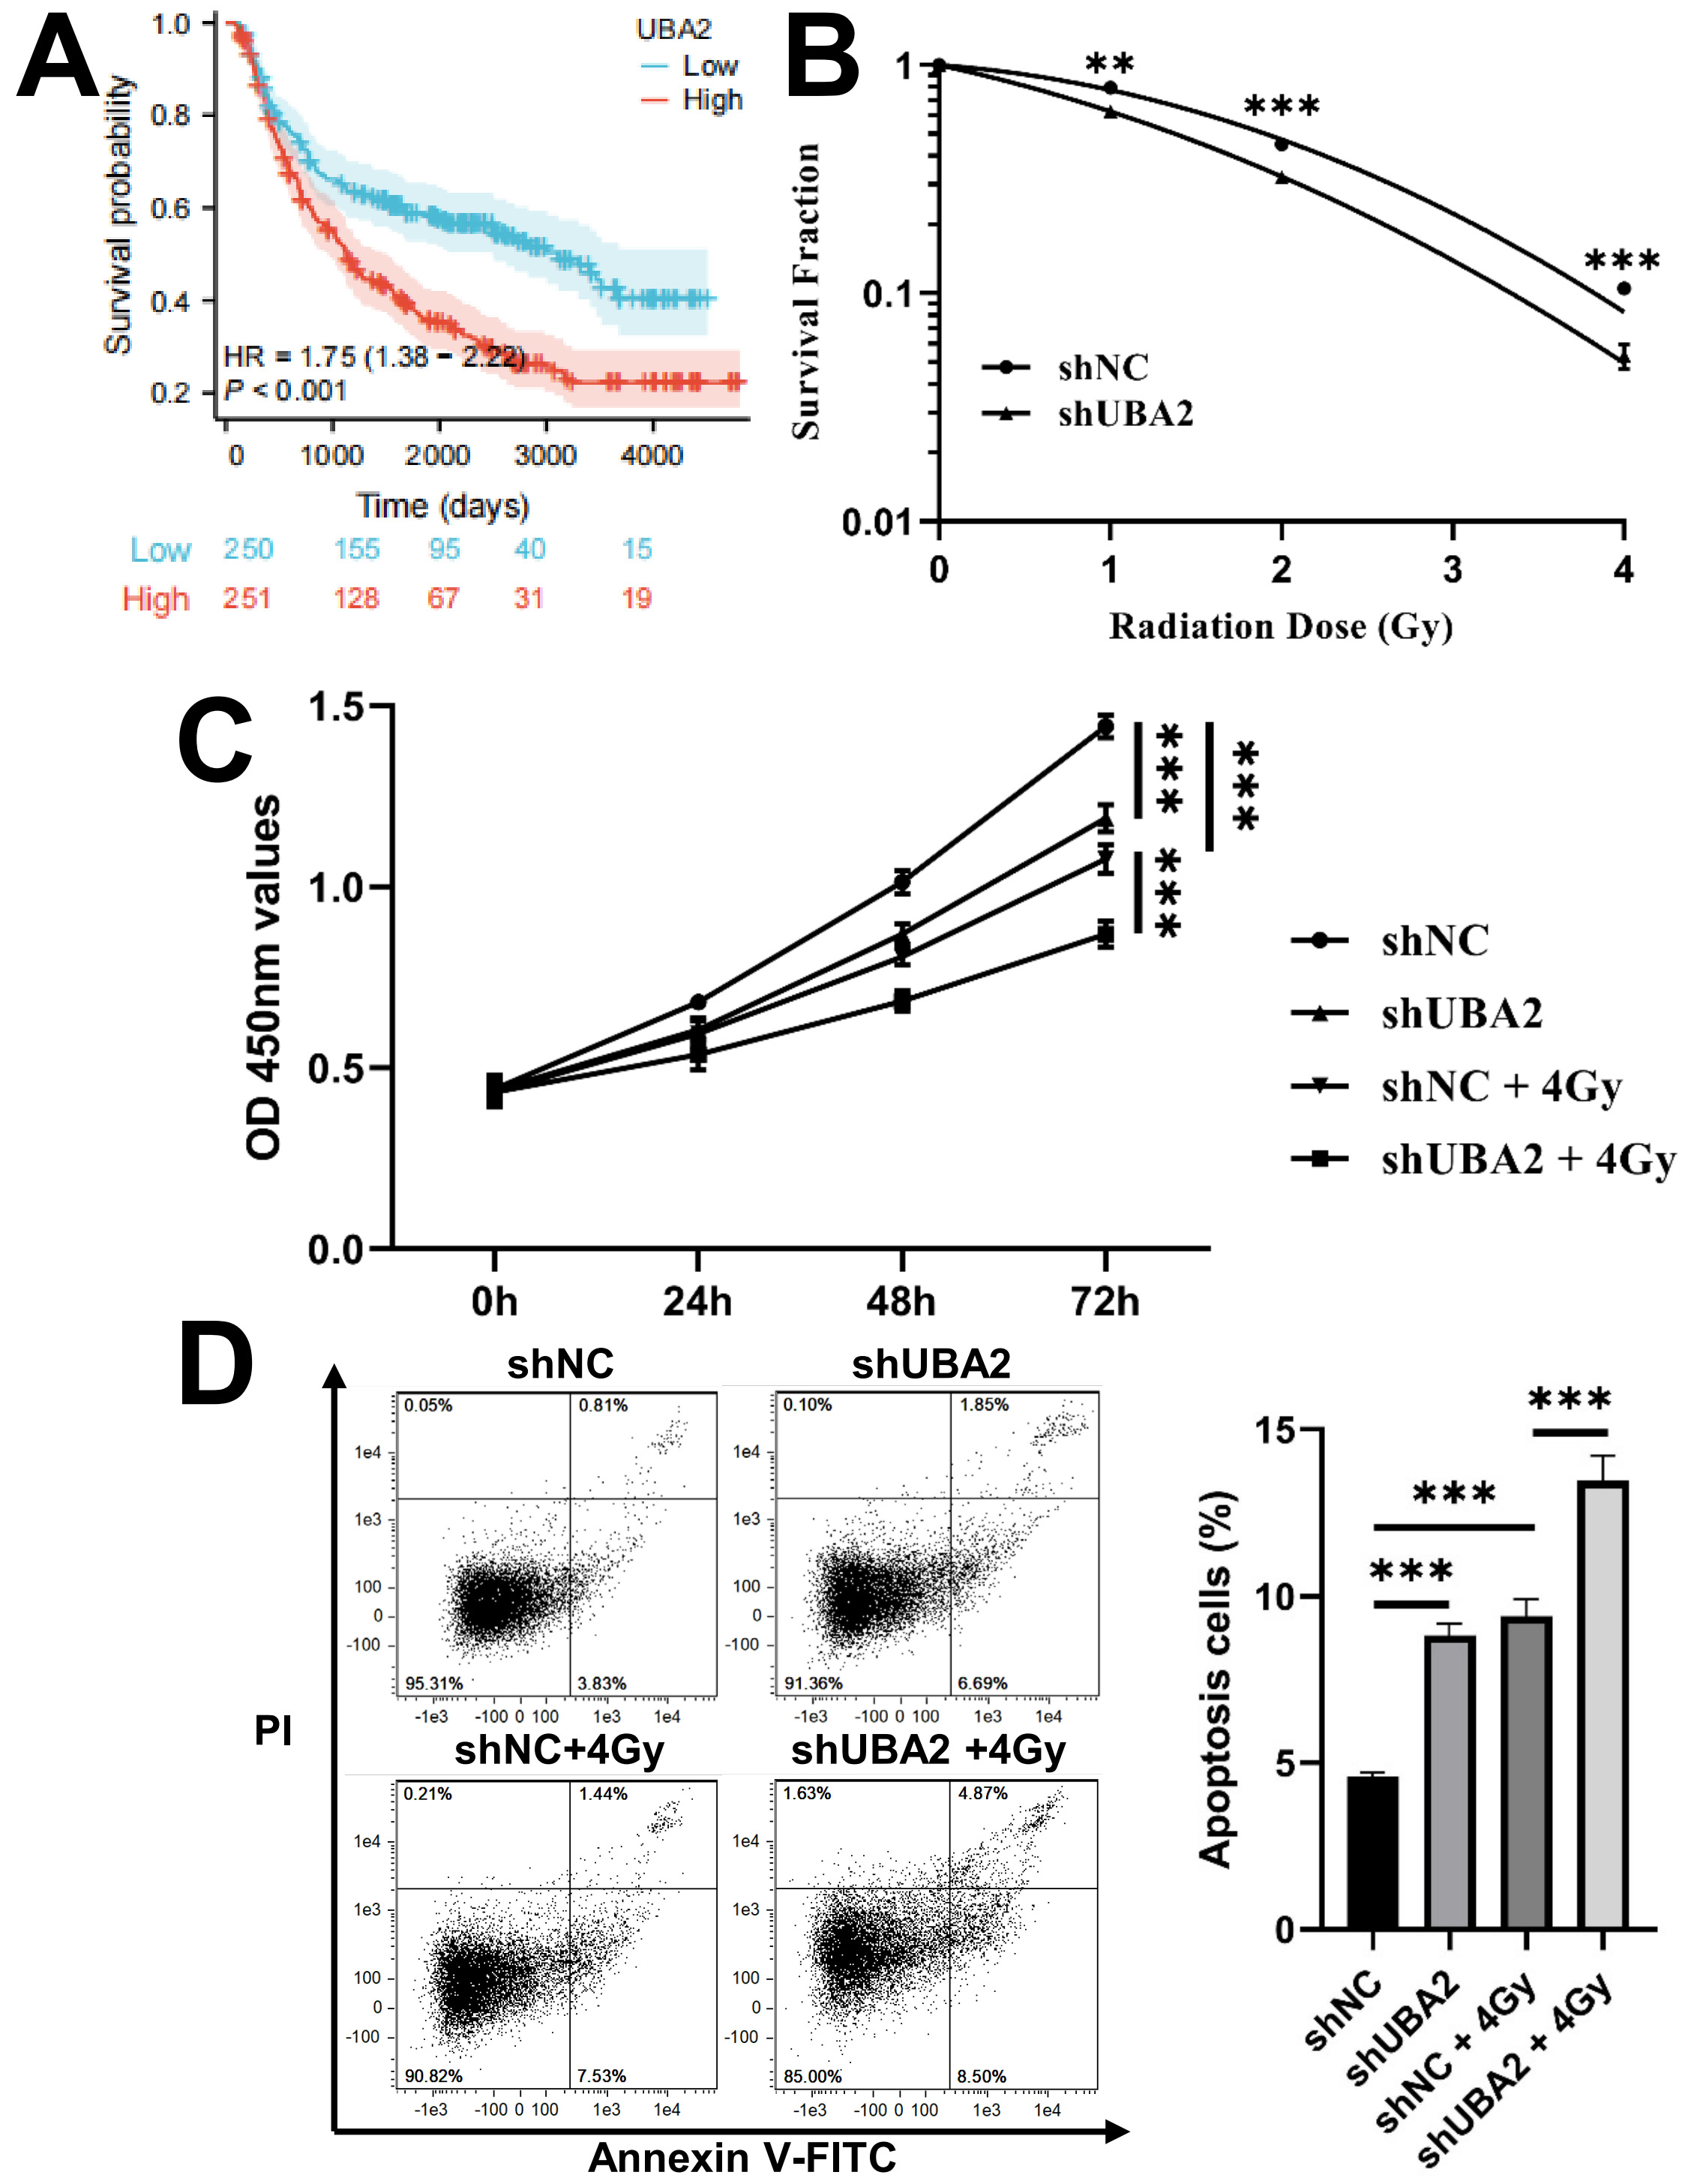 Fig. 9.
Knockdown of UBA2 sensitized U87 cells to irradiation.
(A) The survival curves of OS in glioma patients treated with radiotherapy from
CGGA database. (B) Survival fraction of shNC and shUBA2 at different irradiation
doses (**p
Gliomas are a large group of heterogeneous neurological tumors. The typing of gliomas is becoming clearer thanks to advances in molecular genetic testing and several clinical trials. Traditional and new treatment protocols are becoming more precise and standardized. These usually involve comprehensive assessment of the patient’s clinical presentation, general condition, prognostic factors, and side effects after surgery and chemoradiotherapy. The results of molecular pathology and genetic examinations can provide important prognostic information, as well as guiding the choice of radiotherapy and chemotherapy. Mutations in IDH1 and IDH2 are associated with favorable prognosis, and patients with these mutations respond better to alkylating agents and radiotherapy [28]. The combined deletion of chromosome 1p19q is also thought to be a favorable prognostic indicator and a predictor of greater sensitivity to radiotherapy and alkylating agents [29]. Methylation of the MGMT promoter in glioblastoma also indicates favorable prognosis and a positive therapeutic effect of temozolomide [30]. Several other molecular markers such as H3K27, H3G34, a-thalassemiamentalretardation syndrome X (ATRX), telomerase reverse tranase (TERT), and miR181d have also been shown to have both diagnostic and prognostic value.
Several previous studies have reported on the role of UBA2 in tumor
development. Zhang et al. [14] found that inhibition of UBA2 in clear
cell renal cell carcinoma suppressed cell growth, induced apoptosis, and reduced
the level of crucial enzymes associated with the p53 mutant,
c-Myc, and SUMO modification systems. He et al. [12] reported
that UBA2 knockdown in colorectal cancer cells reduced cell
proliferation and concurrently increased cell apoptosis through regulation of the
P53/murine double minute2 (MDM2)/P21 and phosphatase and tensin homolog deleted
on chromosome ten (PTEN)/phosphoinositide 3-kinase (PI3K)/protein kinase B (AKT) signaling
pathways. Li et al. [31] reported that knockdown of UBA2 inhibited the
invasion and migration of gastric cancer cells by regulating the
Wnt/
Immune cell infiltration and immune regulation play a significant role in influencing the prognosis of glioma [32]. Increased expression levels of inhibitory checkpoint proteins, programmed cell death protein 1 (PD-1) (and its ligand PD-L1), and cytotoxic T lymphocyte-associated protein 4 (CTLA-4) have been correlated with immune evasion, elevated tumor grade, and poor prognosis in glioma patients [33]. However, immunotherapy for glioma remains challenging. Nivolumab and pembrolizumab have proven effective in other solid tumors and are now commonly used immune checkpoint inhibitors. However, both have failed to improve OS in several clinical trials of glioma [34, 35, 36]. Immunotherapy for glioma is still being explored, with the main focus currently being on immune checkpoint inhibitors. Recruitment has been completed for a clinical trial of ipilimumab with temozolomide versus temozolomide alone after surgery and chemoradiotherapy in GBM (Ipi-Glio/NCT02311920) [37]. In addition to PD-1/PD-L1 and CTLA-4, clinical trials that target other immune checkpoints such as T-cell immunoglobulin and mucin domain 3 (TIM3) and lymphocyte-activation gene 3 (LAG3) are currently ongoing (NCT02658981 and NCT02817633). These will not be discussed further here as several comprehensive reviews have recently summarized the topic of immunotherapy for glioma, we will not go into detail [38, 39, 40]. The current study found that UBA2 expression was significantly correlated with immune cell infiltration and the tumor microenvironment. This suggests that UBA2 is a key player in immune regulation and may also reflect the status of the immune microenvironment in gliomas. Furthermore, it suggests that UBA2 may be a biomarker of the response to immune checkpoint inhibitors in gliomas, as well as affecting their efficacy.
Although radiotherapy is one of the standard treatment modalities for glioma, its efficacy is limited by radioresistance [41]. New approaches are therefore needed to improve the efficacy of radiotherapy for glioma. Several studies have shown that SUMOylation or SUMO targets are associated with the development of radioresistance in several tumor types. SUMO-interacting motif mimetic peptides coupled to gold nanoparticles have been observed to inhibit polySUMO-2/3-dependent protein-protein interactions [10]. The mechanism by which the SUMO pathway sensitizes cancer cells to irradiation could therefore be via control of the DNA damage response. SUMO-specific proteases modulate the radiosensitivity of cancer cells through their involvement in various cellular processes [42, 43, 44, 45]. Additionally, the combination of SUMOylation inhibitors such as 2-D08 and ML-792 with radiotherapy may improve the outcome of cancer patients [46]. SAE1 or UBA2 is a subunit of the E1-activating enzyme involved in the SUMOylation of numerous proteins. The results of the present study are similar to a previous investigation which found that knockdown of SAE1 enhanced the radiosensitivity of colorectal cancer cells [47]. We found that knockdown of UBA2 sensitized glioma cells to irradiation, indicating that it may be a target for the radiosensitization of gliomas.
To our knowledge, this is the first study to correlate the expression of UBA2 in glioma with clinicopathological factors, immune cell infiltration, drug sensitivity, and radiosensitivity. UBA2 is overexpressed in gliomas, and is also closely associated with IDH status, histological type, WHO grade, and 1p19q codeletion status. The prognosis of glioma patients with high UBA2 expression is worse than that of patients with low expression. These findings suggest that UBA2 expression is associated with the progression of gliomas and patient outcomes. It is well-known that the occurrence and advancement of glioma are related to immune cell infiltration, which has been shown to influence tumor progression and prognosis [48]. Our results showed that UBA2 expression was positively correlated with several immune cell types, including macrophages, neutrophils, activated DC, induced DC, and T helper cells, but negatively correlated with CD8 T cells, DC, mast cells, NK CD56 bright cells, and NK CD56 dim cells. These findings suggest that UBA2 might participate in regulating immune cell infiltration in glioma. The major tumor-infiltrating cells are macrophages and neutrophils, and the infiltration and polarization of these cells are the main causes of chemotherapy and radiation resistance in gliomas [49]. Glioma-associated macrophages (GAMs) act critically in enhancing tumor progression and can alter drug resistance, promoting resistance to radiotherapy and establishing an immunosuppressive environment [50, 51]. The current study showed that UBA2 expression was related to drug sensitivity in cancers, including glioma. The efficacy of radiotherapy in glioma appears to be constrained by cellular resistance to irradiation [41], with the present study finding that UBA2 knockdown sensitized glioma cells to irradiation. In summary, it seems reasonable to speculate that UBA2 might be involved in drug and irradiation resistance by regulating immune cell infiltration in gliomas.
Several potential biases and shortcomings of this study must be addressed prior to clinical translation. Firstly, public databases such as TCGA and CGGA, contain only limited clinical information. In particular, they lack data on surgical margins/extent of resection, which is a key determinant of prognosis. Moreover, the TCGA database contains only GBM and LGG cohorts. Despite these being the predominant pathological types, they are not completely representative of glioma. In order to validate our findings, future studies should include a larger size of clinical samples and more detailed clinical information. Secondly, the involvement of UBA2 in glioma was not fully elucidated, and further investigations into the molecular mechanisms involved are warranted.
This study found that UBA2 has diagnostic and prognostic value in glioma. UBA2 may also be associated with tumor progression, immune cell infiltration, drug sensitivity, and radiosensitivity in glioma. It could therefore be a potential target for therapy, as well as a biomarker for the diagnosis, prognosis, immune response, drug sensitivity, and radiosensitivity of gliomas. This study provides new insights into the role of UBA2 in the growth and regulation of gliomas. The findings should contribute to the individualized treatment of glioma and may also help to guide clinical practice.
The datasets generated during and/or analyzed during the current study are available from the corresponding author on reasonable request.
YO and TD contributed to the conceptualization, methodology, software, validation, formal analysis, investigation, resources, data curation, writing—original draft preparation, writing—review and editing, and visualization; RL, DW, JC, MD, YW, and ZY contributed to the data curation, HL, QZ, and XW contributed to the conceptualization, supervision and project administration. All authors contributed to editorial changes in the manuscript. All authors read and approved the final manuscript. All authors have participated sufficiently in the work and agreed to be accountable for all aspects of the work.
Not applicable.
We appreciate all the authors who contributed to this study.
The study was supported by the National Key Research and Development Program of China (No. 2022YFC2401500), Science and Technology Plan Project of Chengguan District of Lanzhou (No. 2020-2-2-5), Talent Innovation and Venture Project of Lanzhou City (No. 2017-RC-23; 2021-RC-125; 2020-RC-113), China Foundation for International Medical Exchange (No. Z-2017-24-2108), Gansu Province Project of Science and Technologies (Grant No. 20JR10RA680), and the Lanzhou heavy Ion Accelerator High-end user Project (HIR20GY007).
The authors declare no conflict of interest.
References
Publisher’s Note: IMR Press stays neutral with regard to jurisdictional claims in published maps and institutional affiliations.