


 , Shisheng Zhao 1,2, Ling Ren 1, Qianqian Li 1, Li Li 3, Chaoli Wang 2, Chunmei Meng 1, Yuling Chen 1, Weimin Hu 1,2,*
1 Department of Immunology, North Sichuan Medical College, 637100 Nanchong, Sichuan, China
2 Institute of Basic Medicine and Forensic Medicine, North Sichuan Medical College, 637100 Nanchong, Sichuan, China
3 Department of Pathology, North Sichuan Medical College, 637100 Nanchong, Sichuan, China
Abstract
Background: Mounting evidence indicates that complement components play a crucial role in cancer progression. Recent findings indicate that certain complement components display a significant rise in expression within esophageal squamous cell carcinoma (ESCC). However, the specific tumorigenic functions of these components remain unclear. This study focuses on investigating the expression pattern of C1r, elucidating a role for C1r in ESCC, as well as exploring underlying mechanisms controlled by C1r. Methods: The expression of C1r in ESCC tissues, malignant epithelial cells, and its relationship with survival were analyzed using the Gene Expression Omnibus (GEO) database and tissue microarrays. Single-cell RNA sequencing (scRNA-seq) was used to study the expression of C1r in malignant epithelial cells. C1r knockdown or C1r overexpression in cultured ESCC cells were used to assess the effects of C1r on proliferation, migration, invasion, cell-matrix adhesion, apoptosis, and growth of xenografted tumors in immunocompromised (nude) mice. Western blotting was used to detect the expression of MMP-1 and MMP-10 in C1r knockdown or C1r overexpressing ESCC cells. Results: C1r was highly expressed in ESCC tissues, malignant epithelial cells, and cultured ESCC cell lines. High C1r expression indicated a poor prognosis. Knockdown of C1r significantly suppressed the proliferation, migration, invasion, cell-matrix adhesion, and promoted apoptosis in cultured ESCC cells. Additionally, knockdown of C1r markedly inhibited tumor growth in nude mice. Overexpression of C1r had the opposite effects. C1r induced the expression of MMP-1 and MMP-10. Conclusions: C1r is highly expressed in ESCC and promotes the progression of this tumor type. Our findings suggest that C1r may serve as a novel prognostic biomarker and therapeutic target in ESCC.
Keywords
- complement component C1r
- esophageal squamous cell carcinoma (ESCC)
- biomarker
- malignant progression
- single-cell RNA sequencing (scRNA-seq)
Esophageal carcinoma (EC) is a common malignant tumor, and its incidence and mortality rank 7th and 6th, respectively, among all malignant tumors worldwide [1]. Esophageal squamous cell carcinoma (ESCC) and esophageal adenocarcinoma (EAC) are the two most commonly encountered pathological forms of EC. The incidence of EAC is higher in high-income areas and East Asia and Eastern Africa are high-incidence areas of ESCC [1, 2]. Currently, conventional treatments for ESCC encompass surgical resection, radiotherapy, and chemotherapy. However, the restricted efficacy and serious side effects associated with these therapies continue to result in a high mortality rate for ESCC [3, 4]. Previous studies have indicated that therapeutics targeting epidermal growth factor receptor (EGFR), human epidermal growth factor receptor 2 (HER-2), or vascular endothelial growth factor (VEGF) have shown very limited efficacy against ESCC [5, 6]. Recently, immunotherapy approaches targeting programmed cell death protein 1 (PD-1), programmed cell death ligand 1 (PD-L1), and Cytotoxic T lymphocyte associated protein-4 (CTLA-4) have shown some promise in the treatment of ESCC [7, 8]. However, these approaches are not suitable for all ESCC patients and display less than 30% response rates [8, 9]. Therefore, there is an imminent necessity to enhance our comprehension of the mechanisms underlying ESCC progression, as well as identifying novel biomarkers and potential therapeutic targets.
As an integral component of the innate immune system, the complement is vital in maintaining tissue homeostasis and host defense against microbial pathogens [10]. Depending on its starting composition, complement cascade pathways are divided into three main pathways: classical, alternative, and lectin pathways. These three different pathways all depend on the same terminal pathway, which starts with C5 and ends with forming a membrane attack complex (MAC), also known as C5b-9. MAC destroys the membrane structure of cells, eventually leading to cell lysis.
C1q, C1r, and C1s combine in specific proportions to form the C1 complex. The C1 complex interacts with C4, C2, and C3, serving as the initiator of the classical pathway. Through binding to tumor antigen, some antibodies can activate complement through the classical pathway to form MAC, resulting in the lysis of tumor cells. Therefore, early studies have suggested that the activation of complement may inhibit the malignant progression of tumors and some current tumor treatments that use monoclonal antibodies are based on this principle [11]. However, a new function of complement in tumors has emerged, dramatically changing earlier viewpoints. Growing evidence indicates that some complement components produced by malignant cells in tumor tissue, such as complement factor B (CFB), C1r, C1s, C3 and C5a, do not inhibit tumors, but rather, promote tumor development [12, 13, 14, 15, 16, 17]. While C1r exhibits the potential to promote the malignant progression of tumors, its role and underlying mechanisms in ESCC remain unclear.
In this study we analyzed the expression pattern of various complement components in ESCC tissues using bioinformatics analysis and these efforts uncovered a complement-rich phenotype in ESCC. Furthermore, we sought to elucidate the expression patterns of C1r and delve deeper into its potential influence on ESCC cell behavior. Results obtained using single-cell RNA sequencing (scRNA-seq) and immunohistochemistry (IHC), indicated that C1r was highly expressed in ESCC tissues, malignant epithelial cells, and ESCC cell lines. High C1r expression indicated a poor prognosis. These results suggested that C1r might have a significant impact on the progression of ESCC. In C1r knockdown or C1r overexpressing ESCC cell lines, we examined the impact of C1r on cell proliferation, migration, invasion, adhesion, and apoptosis. In conclusion, C1r demonstrates substantial prognostic value and holds promise as a potential therapeutic target in ESCC.
In this study, 5 datasets (Table 1) were used for differential expression
analysis using online tool GEO2R (https://www.ncbi.nlm.nih.gov/geo/geo2r/) and R
(version 4.1.1, The R Foundation, https://www.r-project.org/) package limma.
Based on the percentile of C1R expression, we divided the samples in the GSE53625
dataset into three groups (
| Dataset | Sample size | Paired or not | |
| ESCC tissues | Adjacent normal tissues | ||
| GSE75241 | 15 | 15 | Yes |
| GSE44021 | 113 | 113 | Yes |
| GSE20347 | 17 | 17 | Yes |
| GSE161533 | 28 | 28 | Yes |
| GSE53625 | 179 | 179 | Yes |
| GSE188900 | 7 | 1 | / |
GEO, Gene Expression Omnibus; ESCC, esophageal squamous cell carcinoma.
The raw data (GSE188900) of scRNA-seq experiments was analyzed and integrated by R packages Seurat and Harmony. For quality control, the standard used is the same as the reference [18]. R package SingelR and CellMarker database [19], cell markers [18, 20, 21, 22, 23] were used to annotate cell types, and R package CopyKat was used to identify malignant epithelial cells [24]. Only aneuploid cells were considered malignant epithelial cells, while other cells were considered non-malignant. Gene ontology (GO) and gene set variation analysis (GSVA) were used to enrich the pathways in each group or cell.
Using the median C1R expression value, tumor samples in GSE44021 were divided into low-expression and high-expression groups. GSEA was subsequently used to evaluate different functions in two groups with different C1R expression.
Based on esophageal carcinoma (ESCA) data in TCGA, online tool TIMER2.0 (http://timer.cistrome.org/) was used for the systematic analysis of the infiltration of various immune cells in ESCA [25]. Correlation modules of TIMER2.0 were used to reveal the co-expression of C1R and tumor-infiltrating lymphocyte (TILs) gene markers, including gene markers for macrophages, myeloid cells, and cancer-associated fibroblasts (CAFs). TIMER2.0 did not distinguish ESCA data into ESCC or EAC.
The human ESCC TMA (HEsoS180Su11, Shanghai Outdo Biotech Co., Ltd., Shanghai, China) used, contained a total of 180 tissues, specifically, 72 pairs of ESCC tissues and matched paratumor tissues, and 36 non-matched ESCC tissues. The TMA was deparaffinized, rehydrated, subjected to antigen retrieval, and then incubated with diluted primary antibodies to C1r (1:2000, Proteintech, Rosemont, IL, USA) at 4 °C overnight. After blocking and incubating with secondary antibody, EnVision™ FLEX+ and Autostainer Link 48 (Dako, Glostrup, Denmark) were used for signal development. Finally, the TMA was counterstained with hematoxylin solution for 1 min and in 0.25% hydrochloric-alcohol solution for 10 sec.
Staining intensity was classified into four degrees (0–3) of intensity: no
staining, weak staining, moderate staining, strong staining. The number of
positive cells within a field was divided into five degrees (0,
The ESCC cell lines (TE-1, Eca-109, and KYSE-150) and normal human esophageal
epithelial cell line (HEEC) were separately obtained from the Cell Bank of Type
Culture Collection of the Chinese Academy of Science (Shanghai, China) and
Sciencell (Carlsbad, CA, USA). To identify the cell lines, the short tandem
repeat (STR) was conducted. All cells were maintained in RPMI 1640 medium (Gibco,
Waltham, MA, USA) containing 10% fetal bovine serum (Every Green, Zhejiang,
China), 100 U/mL penicillin, and 100 µg/mL streptomycin (HyClone, Austria)
in a 5% CO
Lipofectamine™ 2000 (Invitrogen, Waltham, MA, USA) was used to transiently transfect cells with C1r-specific small interfering RNAs (C1r siRNAs) or negative control siRNA (NC siRNA). The siRNAs used were listed in Table 2 [14] and were obtained from GenePharma (Shanghai, China). Commercially available C1r knockdown lentivirus (C1r-specific short hairpin RNA, C1r shRNA) or the control (CTRL), and C1r overexpression lentivirus (C1r OE) or the negative control (NC) were designed and produced by Genechem (Shanghai, China). TE-1 or Eca-109 cells were infected with these lentiviruses and selected with puromycin (Solarbio, Beijing, China). The shRNAs used were listed in Table 3.
| Sequences | ||
| Sense | Antisense | |
| NC siRNA | 5 |
5 |
| C1r siRNA1 | 5 |
5 |
| C1r siRNA2 | 5 |
5 |
siRNA, small interfering RNA.
| Sequences | |
| CTRL shRNA | 5 |
| C1r shRNA1 | 5 |
| C1r shRNA2 | 5 |
| C1r shRNA3 | 5 |
shRNA, short hairpin RNA.
RIPA lysis buffer containing PMSF (Beyotime, Shanghai, China) was utilized to
extract cellular protein. Using the protocol supplied with the SDS-PAGE gel
preparation kit (Beyotime), after protein denaturation, 8% gel was used
to separate the proteins. Then the gel contents were subsequently transferred to
PVDF membranes (Beyotime). Membranes were subsequently blocked, and
incubated with primary antibodies to C1r (1:2000, Proteintech), MMP-1
(1:2000, Proteintech), MMP-10 (1:1000, Beyotime), or
5
After reaching 90% confluence in 12-well plates, ESCC cell monolayers were scratched, transfected with siRNA, and cultured in an incubator. At 0, 24, 48, and 72 hr, images were taken with an inverted microscope (Olympus IX71, Olympus Optical, Tokyo, Japan). ImageJ (version 1.51, https://imagej.net/) was used to calculate the migration rate. Similarly, the procedure for the stable cell lines was the same as mentioned above, but there was no transfection step after the cells were seeded.
To assess the impact of C1r on the invasive potential of ESCC cell lines, a
Transwell invasion assay was conducted. Matrigel (Corning, Corning, NY, USA) was
diluted in serum-free Roswell Park Memorial Institute (RPMI) 1640 medium and added to the upper chambers (Corning). ESCC cells were subjected to a 24 hr starvation period in serum-free RPMI
1640 medium. Subsequently, cells (2
For cell-matrix adhesion assay, 10 µg/mL fibronectin (Solarbio) was
coated into 96-well plates. After being blocked by 1% bovine serum albumin for 1
hr at 37 °C, 5
A 60% confluent culture of ESCC cells was transfected with indicated siRNAs and then further cultured for 48 hr. Per the instructions of the Annexin V-APC/PI Apoptosis Detection Kit (KeyGEN BioTECH, Nanjing, China), cells were stained, and apoptosis was analyzed by flow cytometry using a NovoCyte™ Flow Cytometer (ACEA Biosciences, Santa Clara, CA, USA).
BALB/c nude mice (female, 4–6 weeks old, weighing 14 g–16 g) were provided by
the Experimental Animal Study Center of North Sichuan Medical College.
Considering different efficiencies of shRNAs, C1r shRNA1 was ultimately used. To
establish a xenograft mouse model (n = 5 in each group), TE-1 cells with C1r
knockdown (TE-1 CTRL/TE-1 C1r shRNA1, 3
For data analysis, SPSS 23.0 (IBM Corp., Chicago, IL, USA) statistical software
was used. The data are presented as mean
Multiple differentially expressed complement components in four GEO datasets
were integrated and displayed through heatmaps. According to results obtained
using GEO2R, the expression of C1QA, C1QB, C1QC, C1R, C1S, C2, and
CFB genes showed a significant trend of high expression in ESCC tissues
(p
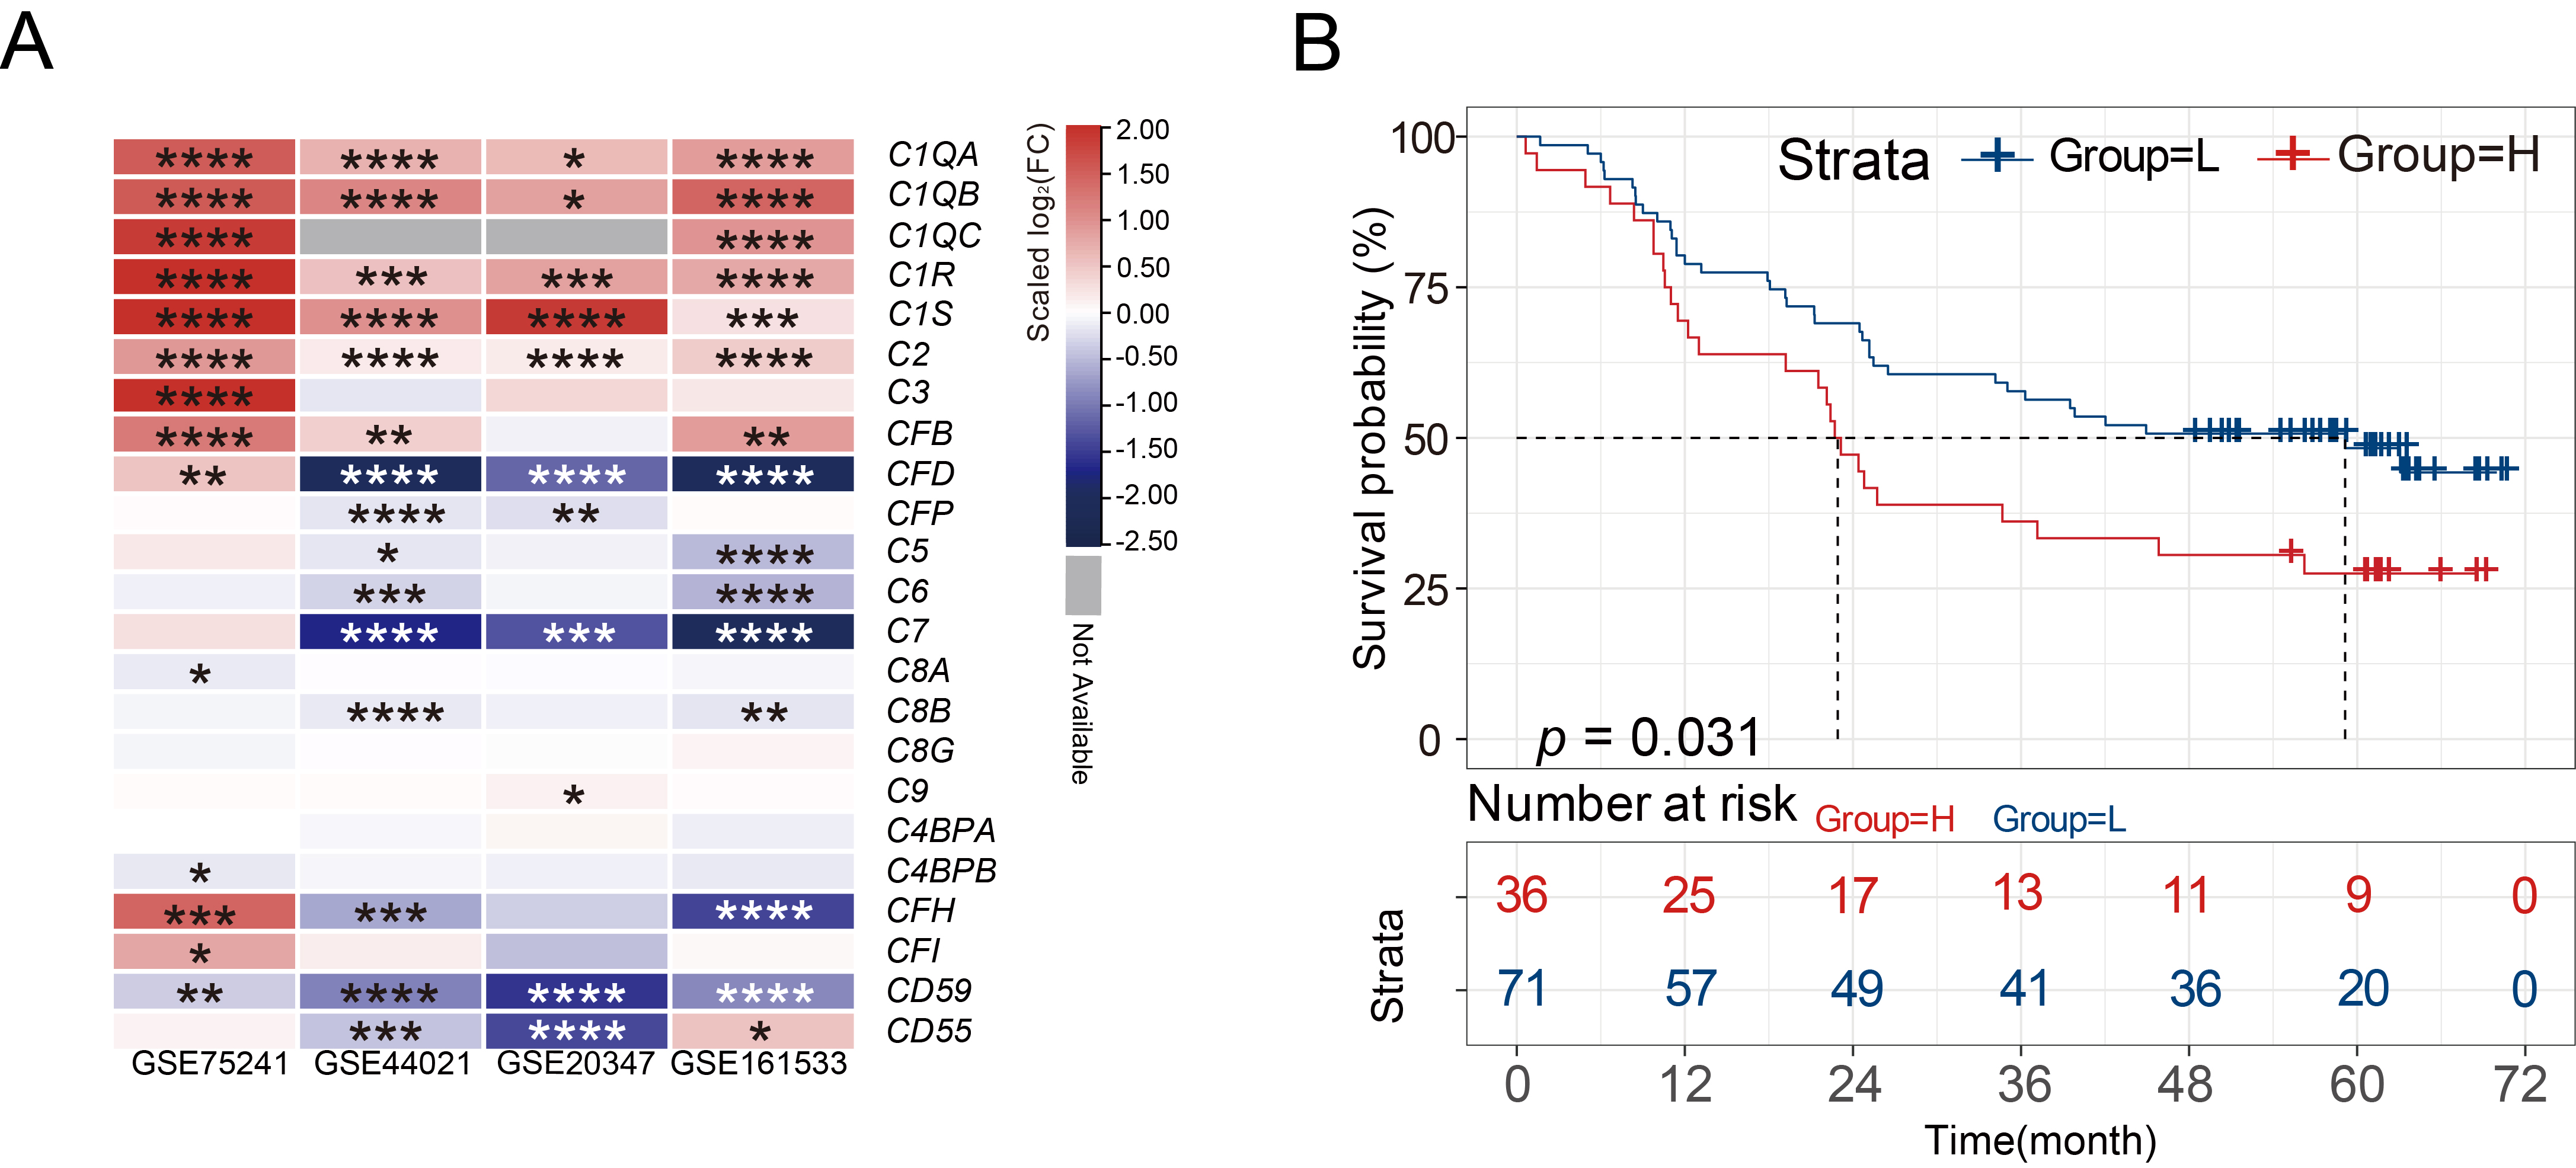 Fig. 1.
C1R is highly expressed in ESCC tissues. (A)
Heatmaps showed the differential expression of various complement genes in normal tissues and
ESCC tissues. (B) Kaplan-Meier curves indicated the correlation of C1R
with overall survival. * adjusted p-value
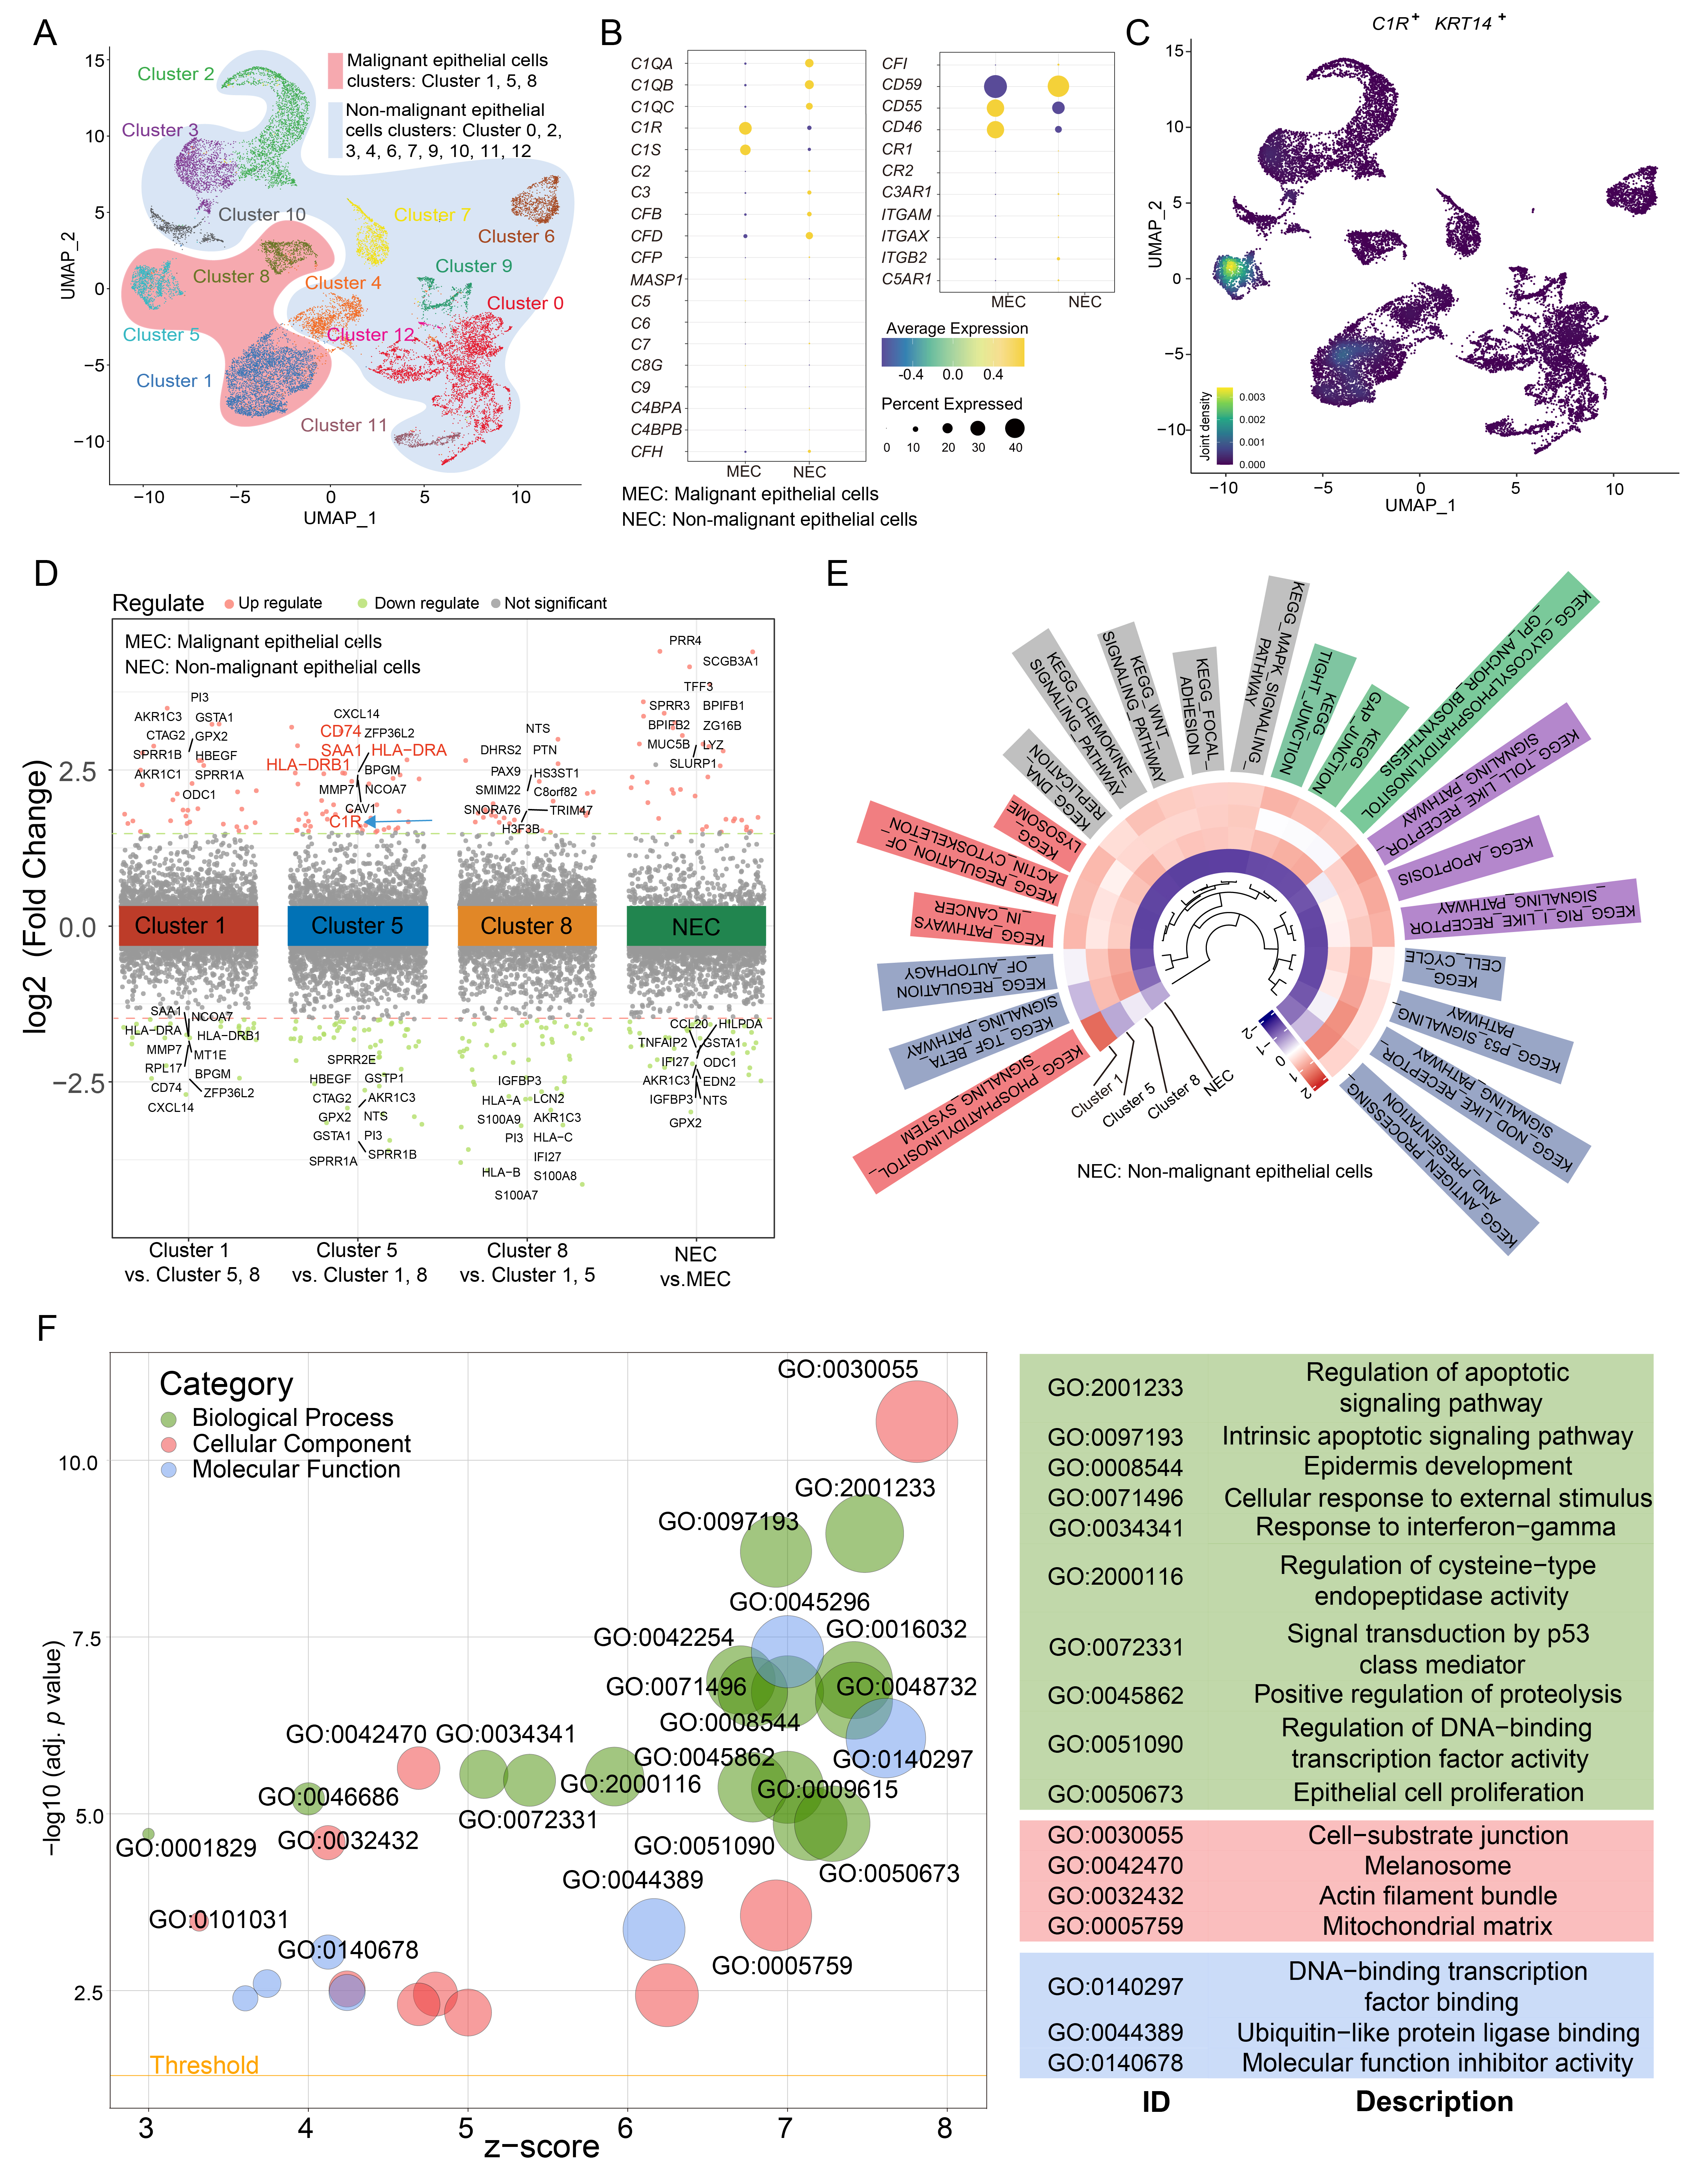
In scRNA-seq experiments, 22,317 cells were divided into 9 cell types (Supplementary Fig. 1A,B). To further examine the expression of C1R in epithelial cells, epithelial cells were further separated into malignant and non-malignant epithelial cells (Supplementary Fig. 1C,D). Cluster 1, 5, and 8 were annotated as malignant epithelial cells, while other clusters were annotated as non-malignant epithelial cells (Fig. 2A). We found that the malignant epithelial cells highly expressed the C1R gene (Fig. 2B). Cluster 5 highly expressed C1R, KRT14, CD74, HLA-DRA, and HLA-DRB1, which is an epithelial-immune dual feature of malignant cells previously reported in nasopharyngeal carcinoma (Fig. 2C,D) [26]. The results of GSVA revealed that Cluster 5 was enriched in antibody processing and presentation, NOD-like receptor and p53 signaling pathways. In Clusters 1 and 5, apoptosis, Toll-like receptor signaling pathway, and MAPK signaling pathways were enriched, while Cluster 8 was enriched in the TGF beta signaling pathway and pathways that regulate autophagy (Fig. 2E). The results of GO analysis revealed that compared with other malignant cell clusters, Cluster 5, which has a high expression of C1R, was also enriched in genes associated with epithelial cell proliferation, regulation of apoptotic signaling, cell-substrate junction, and DNA-binding transcription factor binding (Fig. 2F).
 Fig. 2.
C1R is highly expressed in malignant epithelial cells in ESCC. (A) A uniform manifold approximation and projection (UMAP) plot showed subclusters of epithelial cells. (B) A Dot plot showed the expression level for complement component genes in malignant cells and non-malignant cells. (C) Density map indicated the expression level of C1R and KRT14. (D) Up and down-regulated genes within tumor clusters, or between non-malignant epithelial cells and malignant epithelial cells, were shown. (E) A circle heatmap generated by gene set variation analysis (GSVA) indicated the differences in enriched pathways of the four epithelial cell subtypes. (F) The results of gene ontology (GO) enrichment were shown using a dot plot.
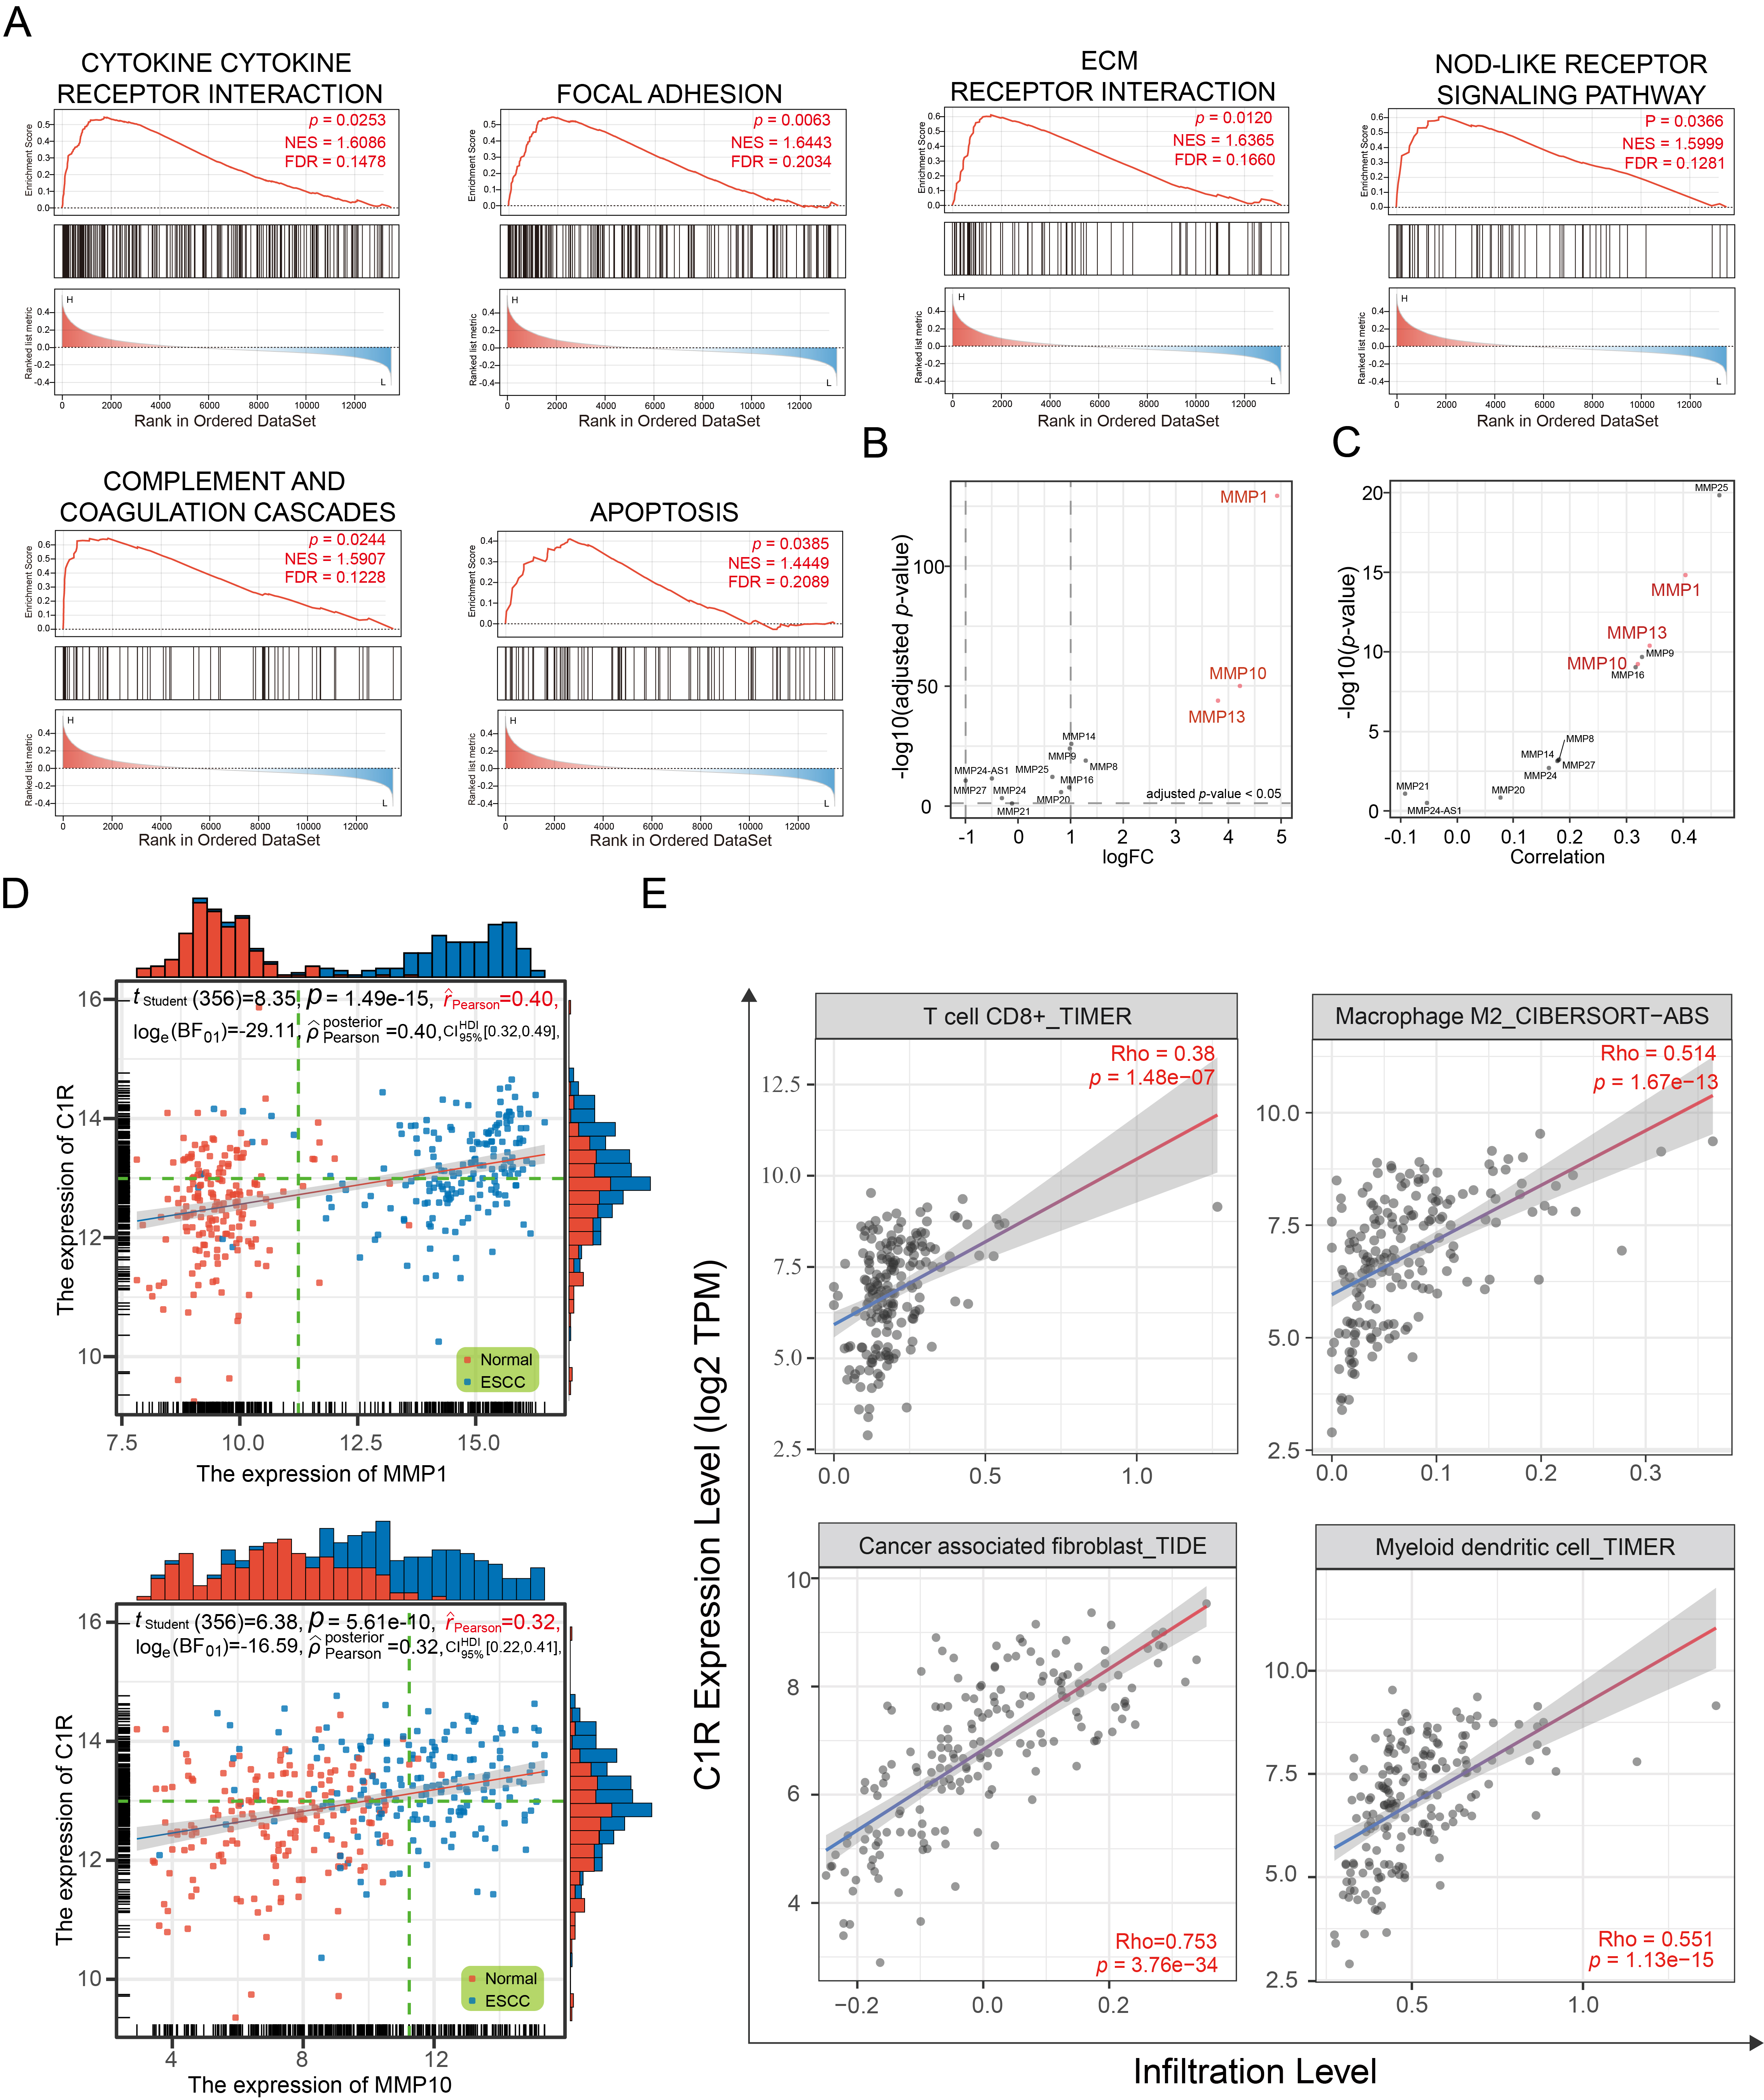
Based on the median expression of C1R, samples in GSE44021 were divided into two groups. Using GSEA (Fig. 3A), the significant enrichment pathways for the biological function of C1R were cytokine-receptor interactions, focal adhesion, ECM receptor interaction, NOD-like receptor signaling pathway, complement and coagulation cascades, and apoptosis.
 Fig. 3.
C1R expression is correlated with extracellular matrix (ECM) receptor regulatory networks and immune infiltration. (A) Gene set enrichment analysis (GSEA) analysis indicated the Kyoto Encyclopedia of Genes and Genomes (KEGG) pathways associated with C1R expression. (B) A dot plot indicated the expression levels of matrix metalloproteinases (MMPs) in GSE53625. (C,D) The correlation was shown for C1R expression and MMPs expression. (E) The correlation of C1R expression with immune cell infiltration levels in esophageal carcinoma (ESCA) was shown.
The ECM receptor regulatory network plays an essential role in promoting the adhesion, proliferation, and migration of tumor cells, and influencing the tumor microenvironment (TME). Matrix metalloproteinases (MMPs) are involved in the remodeling of the ECM, and some of these, such as MMP-1, MMP-10, and MMP-13, were highly expressed in ESCC tissues (Fig. 3B). We found that the expression of C1R was significantly co-expressed with MMP-1 and MMP-10 (Fig. 3C,D).
As a part of TME, immune infiltration is essential in promoting malignant
progression. In this analysis, C1R expression had a negative correlation
with the purity of ESCA (rho = –0.262, p = 3.61
The abundance of C1r protein in an ESCC TMA was analyzed by IHC. C1r was found to be located in the cytoplasm of cancer cells and normal esophageal mucosal epithelial cells (Fig. 4A,B). IHC staining scores indicated that when compared to normal esophageal mucosal epithelium, C1r protein abundance in ESCC tissues was significantly increased (Fig. 4C. paired t-test). The high expression of C1r in cancer cells was also significantly correlated with histological grade, but not with other patient/tumor variables including age, gender, pathologic type, size, lymph node metastasis, infiltration degree, and TNM stage (Table 4). Representative IHC images for C1r with different histological grade ESCC tumors is shown in Fig. 4D. High expression of C1r was significantly associated with poor prognosis (Fig. 4E). Western blot analysis showed that C1r was expressed in both normal HEEC and three ESCC cell lines. C1r abundance in all three ESCC cell lines was notably higher than that observed in the HEEC cell line, and was highest in TE-1 cells (Fig. 4F).
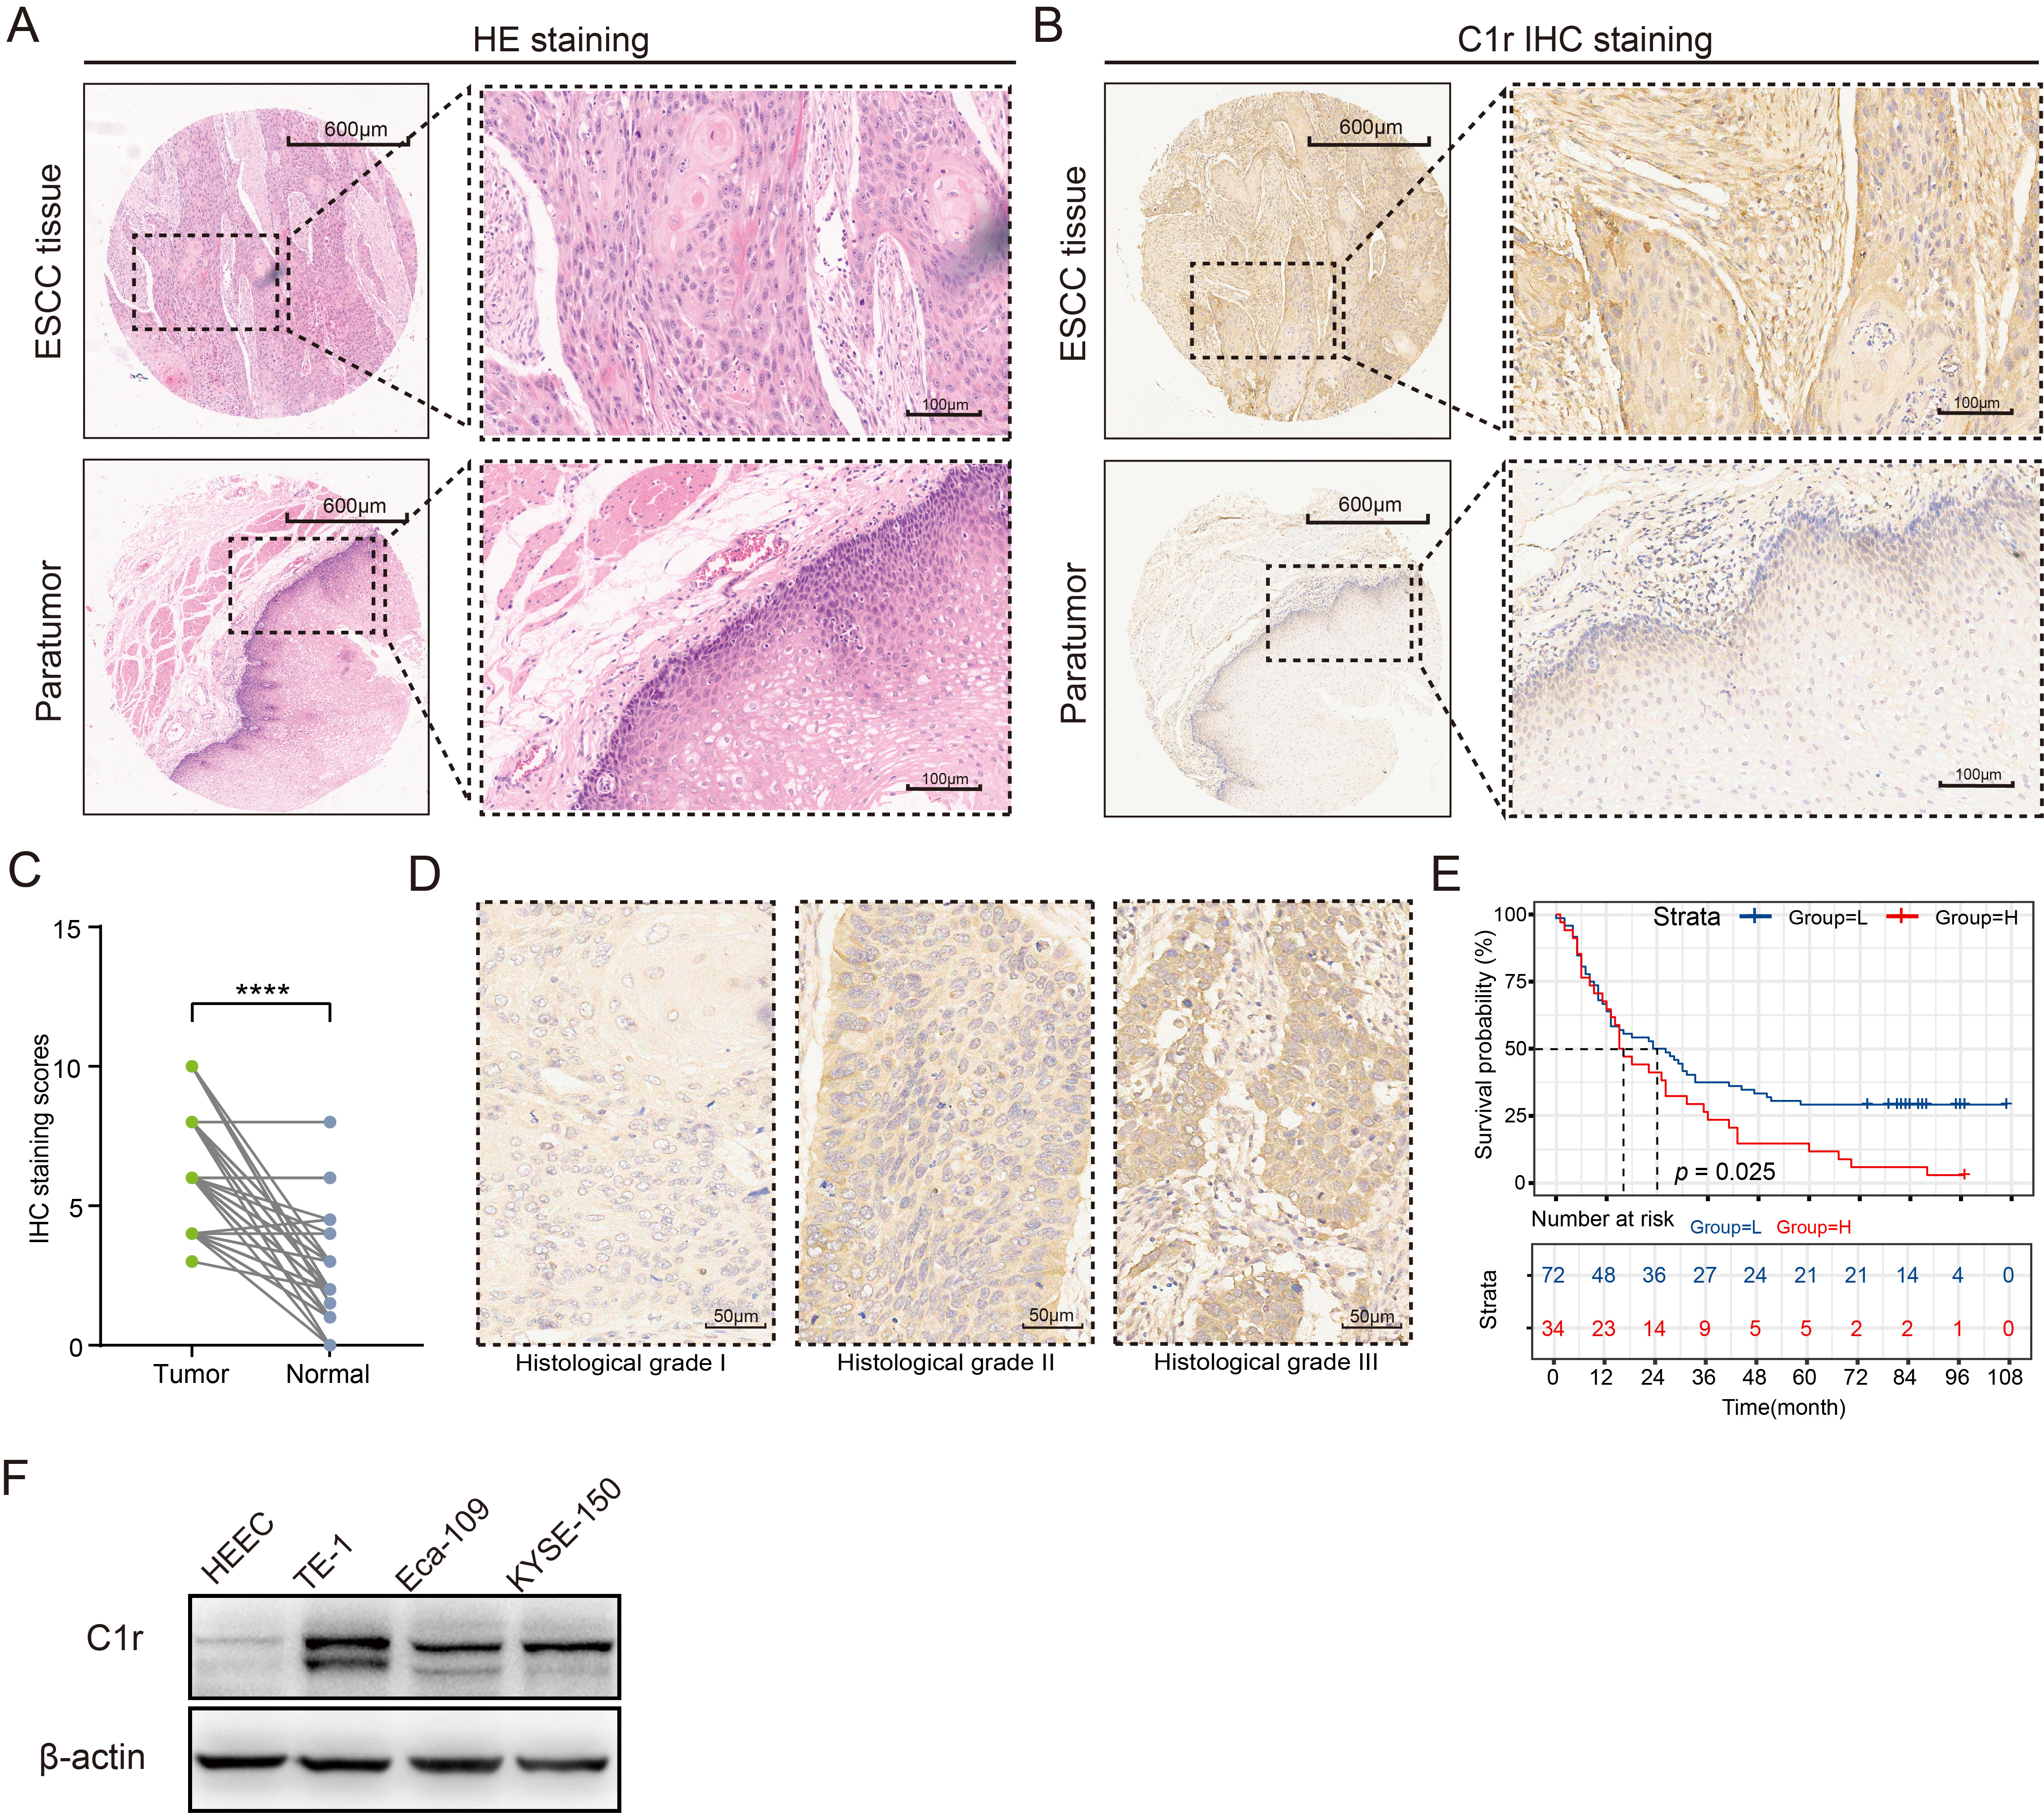 Fig. 4.
C1r protein is highly expressed in ESCC tissues and
ESCC cell lines, and is associated with poor prognosis. (A) Hematoxylin-eosin
(HE) staining was used to identify pathological changes in ESCC tissues. (B) The
expression patterns of C1r in paired ESCC and paratumor tissues was shown. (C)
Immunohistochemistry (IHC) staining score was evaluated in paired ESCC and normal
tissues. (D) Representative IHC images showing C1r expression in different
histological grades were shown. (E) Kaplan-Meier survival analysis was performed
to assess the correlation of C1r with overall survival in the low and high IHC
staining score groups. (F) The expression of C1r in ESCC cells and human
esophageal epithelial cell line (HEEC) cells was evaluated by western blotting.
**** p
| C1r High Expression Group | C1r Low Expression Group | Total | p | ||
| (N = 34) | (N = 72) | (N = 106) | |||
| Age | 0.210 | ||||
| 7 | 23 | 30 | |||
| 27 | 48 | 75 | |||
| Miss | 1 | 1 | |||
| Gender | 0.106 | ||||
| Male | 29 | 51 | 80 | ||
| Female | 5 | 21 | 26 | ||
| Pathologic type | 0.110 | ||||
| Ulcerative | 16 | 39 | 55 | ||
| Medullary | 11 | 18 | 29 | ||
| Others | 5 | 5 | |||
| Miss | 7 | 10 | 17 | ||
| Size (cm) | 0.912 | ||||
| 13 | 28 | 41 | |||
| 19 | 39 | 58 | |||
| Miss | 2 | 5 | 7 | ||
| Lymph node metastasis | 0.287 | ||||
| N0 | 13 | 35 | 48 | ||
| N1–3 | 21 | 36 | 57 | ||
| Miss | 1 | 1 | |||
| Infiltration degree | 0.478 | ||||
| T1–2 | 8 | 13 | 21 | ||
| T3–4 | 24 | 56 | 80 | ||
| Miss | 2 | 3 | 5 | ||
| Histological grade | 0.017 | ||||
| I, I–II | 7 | 32 | 39 | ||
| II, II–III, III | 27 | 40 | 67 | ||
| TNM stage (AJCC) | 0.072 | ||||
| I–II | 11 | 37 | 48 | ||
| III–IV | 21 | 32 | 53 | ||
| Miss | 2 | 3 | 5 | ||
TNM, tumor-node-metastasis; AJCC, The American Joint Committee of Cancer.
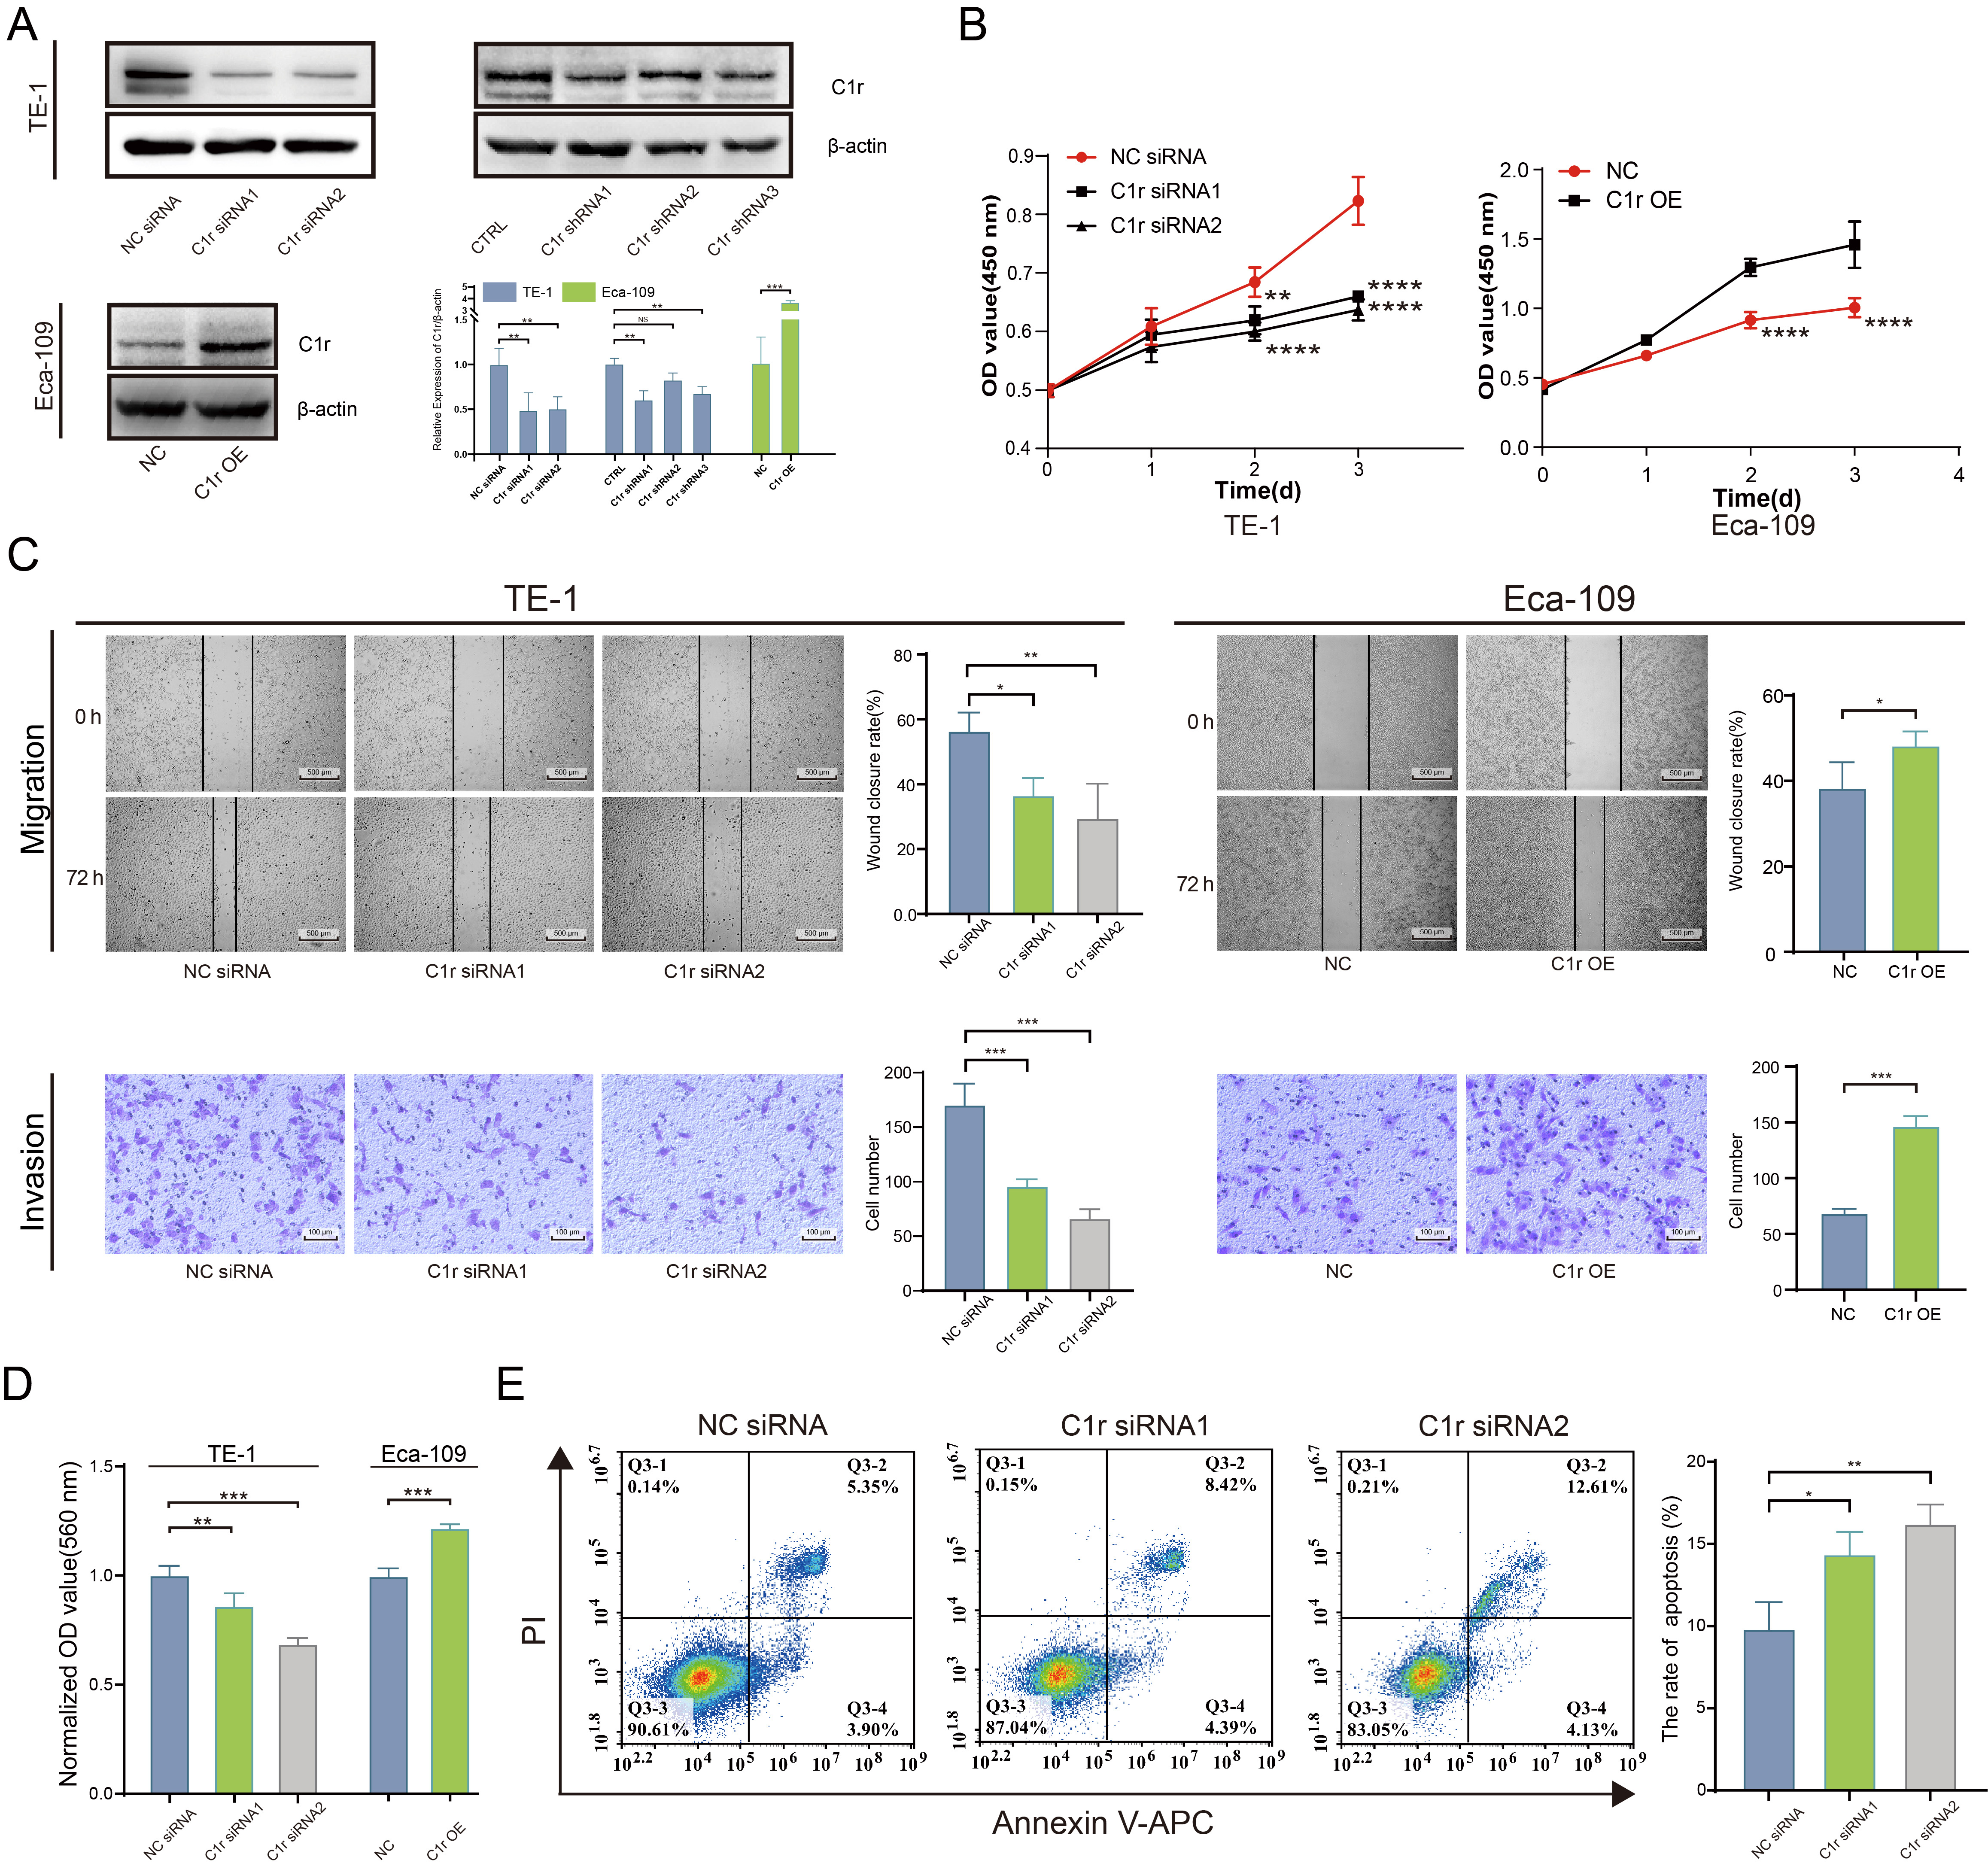
The expression of C1r was significantly reduced in C1r knockdown TE-1 cells. Further, the expression of C1r was significantly higher in Eca-109 cells overexpressing recombinant C1r than that documented in negative control cells (Fig. 5A). In C1r knockdown TE-1 cells, the proliferation rate of these cells was significantly reduced. In contrast, the proliferation rate of Eca-109 cells overexpressing recombinant C1r was increased (Fig. 5B).
 Fig. 5.
C1r promotes the proliferation, migration, invasion, cell-matrix
adhesion, and inhibits the apoptosis of ESCC cells. (A) The expression of C1r in
C1r knockdown TE-1 cells and C1r overexpressing Eca-109 cells was evaluated by
western blotting. (B) The impact of C1r on the proliferation of ESCC cells was
quantified by Cell Counting Kit-8 (CCK-8) assay. (C) The impact of C1r on the migration and invasion of
ESCC cells was evaluated by a wound healing assay and Transwell invasion assays.
(D) The impact of C1r on the cell matrix adhesion of ESCC cells was evaluated by
crystal violet staining. (E) Apoptosis was measured in C1r knockdown TE-1 cells
by flow cytometry. NS p
Wound healing assays and Transwell invasion assays were performed separately to determine the effect of C1r expression on the migration and invasion ability of ESCC cells. Results obtained indicated that the migration and invasion in C1r knockdown TE-1 cells decreased significantly. Coordinately, the migration and invasion of Eca-109 cells overexpressing recombinant C1r was found to be increased compared to the negative control group (Fig. 5C).
To better understand the effect of C1r on human ESCC cell extracellular matrix adhesion, a cell-matrix adhesion experiment was conducted using fibronectin. The results showed that fibronectin adhesion was significantly decreased in TE-1 cells with C1r knockdown. In contrast, in Eca-109 cells overexpressing C1r exhibited significantly increased fibronectin adhesion when compared to negative control cells (Fig. 5D) strongly suggesting that C1r promotes cell-matrix adhesion in ESCC cells.
Next, the impact of C1r on apoptosis in human ESCC cell lines was assessed through flow cytometry. C1r knockdown resulted in significant increases in apoptotic (Annexin V/PI-positive) TE-1 cells (Fig. 5E), leading us to conclude that C1r decreases apoptosis in ESCC cells.
The result of GSEA suggested that C1R expression is closely associated with the expression of MMP-1 and MMP-10. Thus, we next examined the expression of MMP-1 and MMP-10 in C1r knockdown and C1r overexpressing ESCC cell lines by western blotting. In response to C1r knockdown in TE-1 cells, the expression of MMP-1 and MMP-10 significantly decreased. Conversely, overexpression of C1r in Eca-109 cells resulted in heightened expression of both MMP-1 and MMP-10 (Fig. 6A,B).
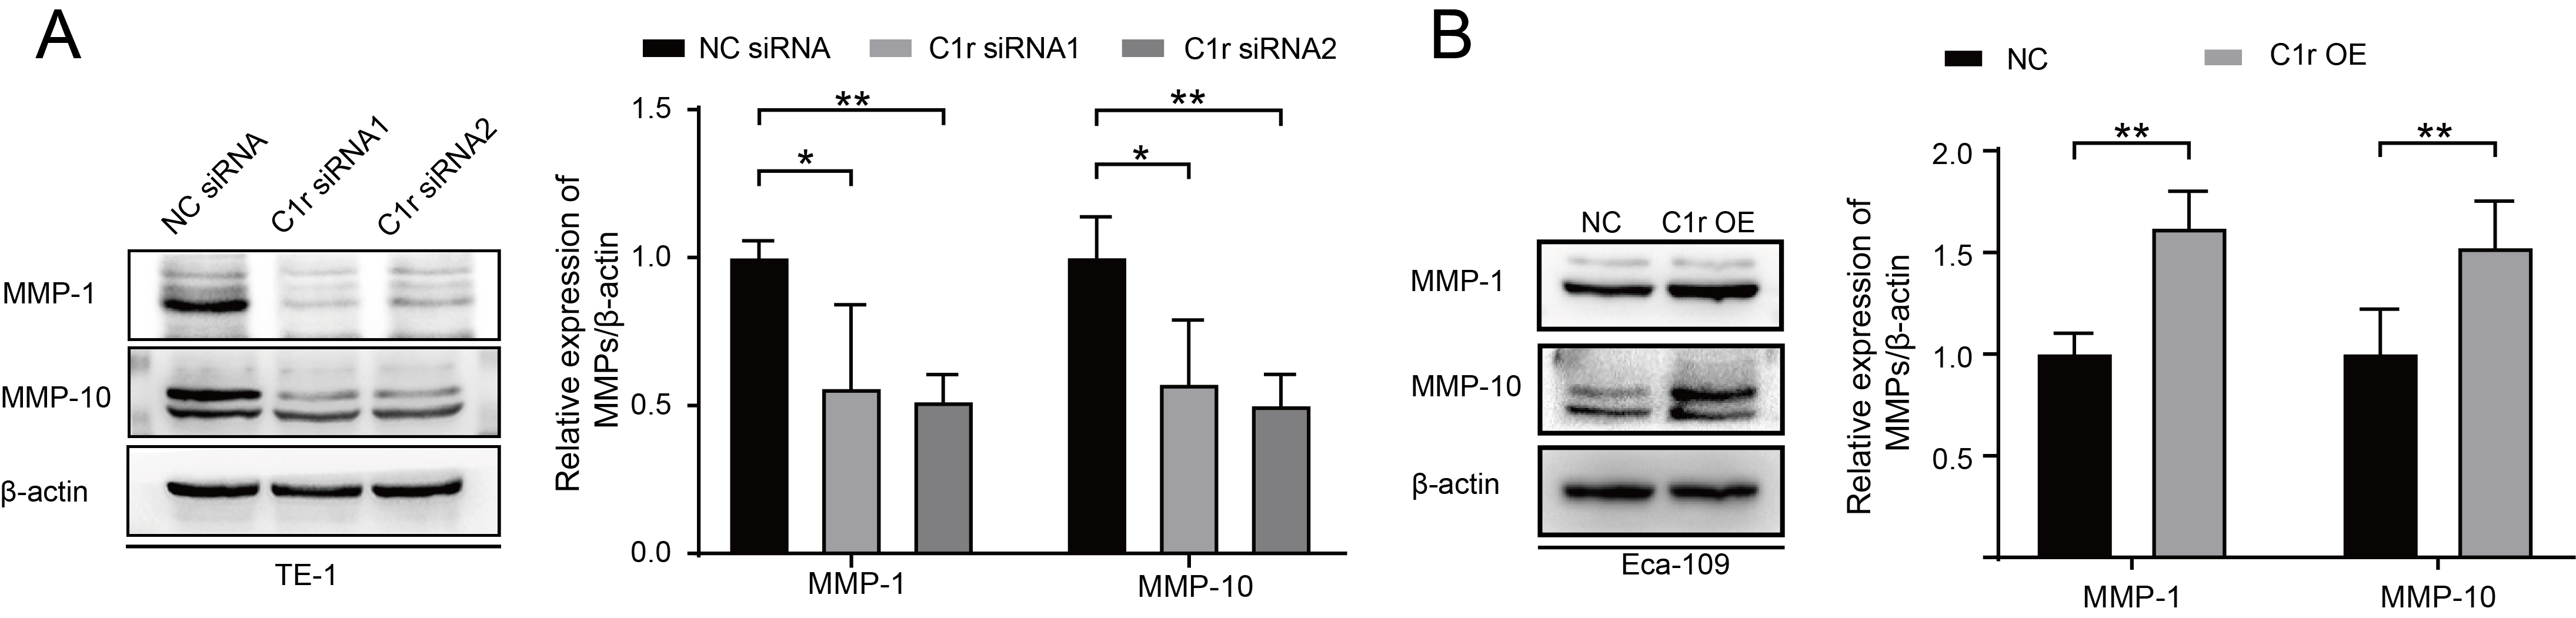 Fig. 6.
C1r influences the expression of MMP-1 and MMP-10 in ESCC cells.
(A) The expression of MMP-1 and MMP-10 in C1r-knockdown TE-1 cells was evaluated
and quantified. (B) The expression of MMP-1 and MMP-10 in C1r overexpressing
Eca-109 cells was evaluated. * p
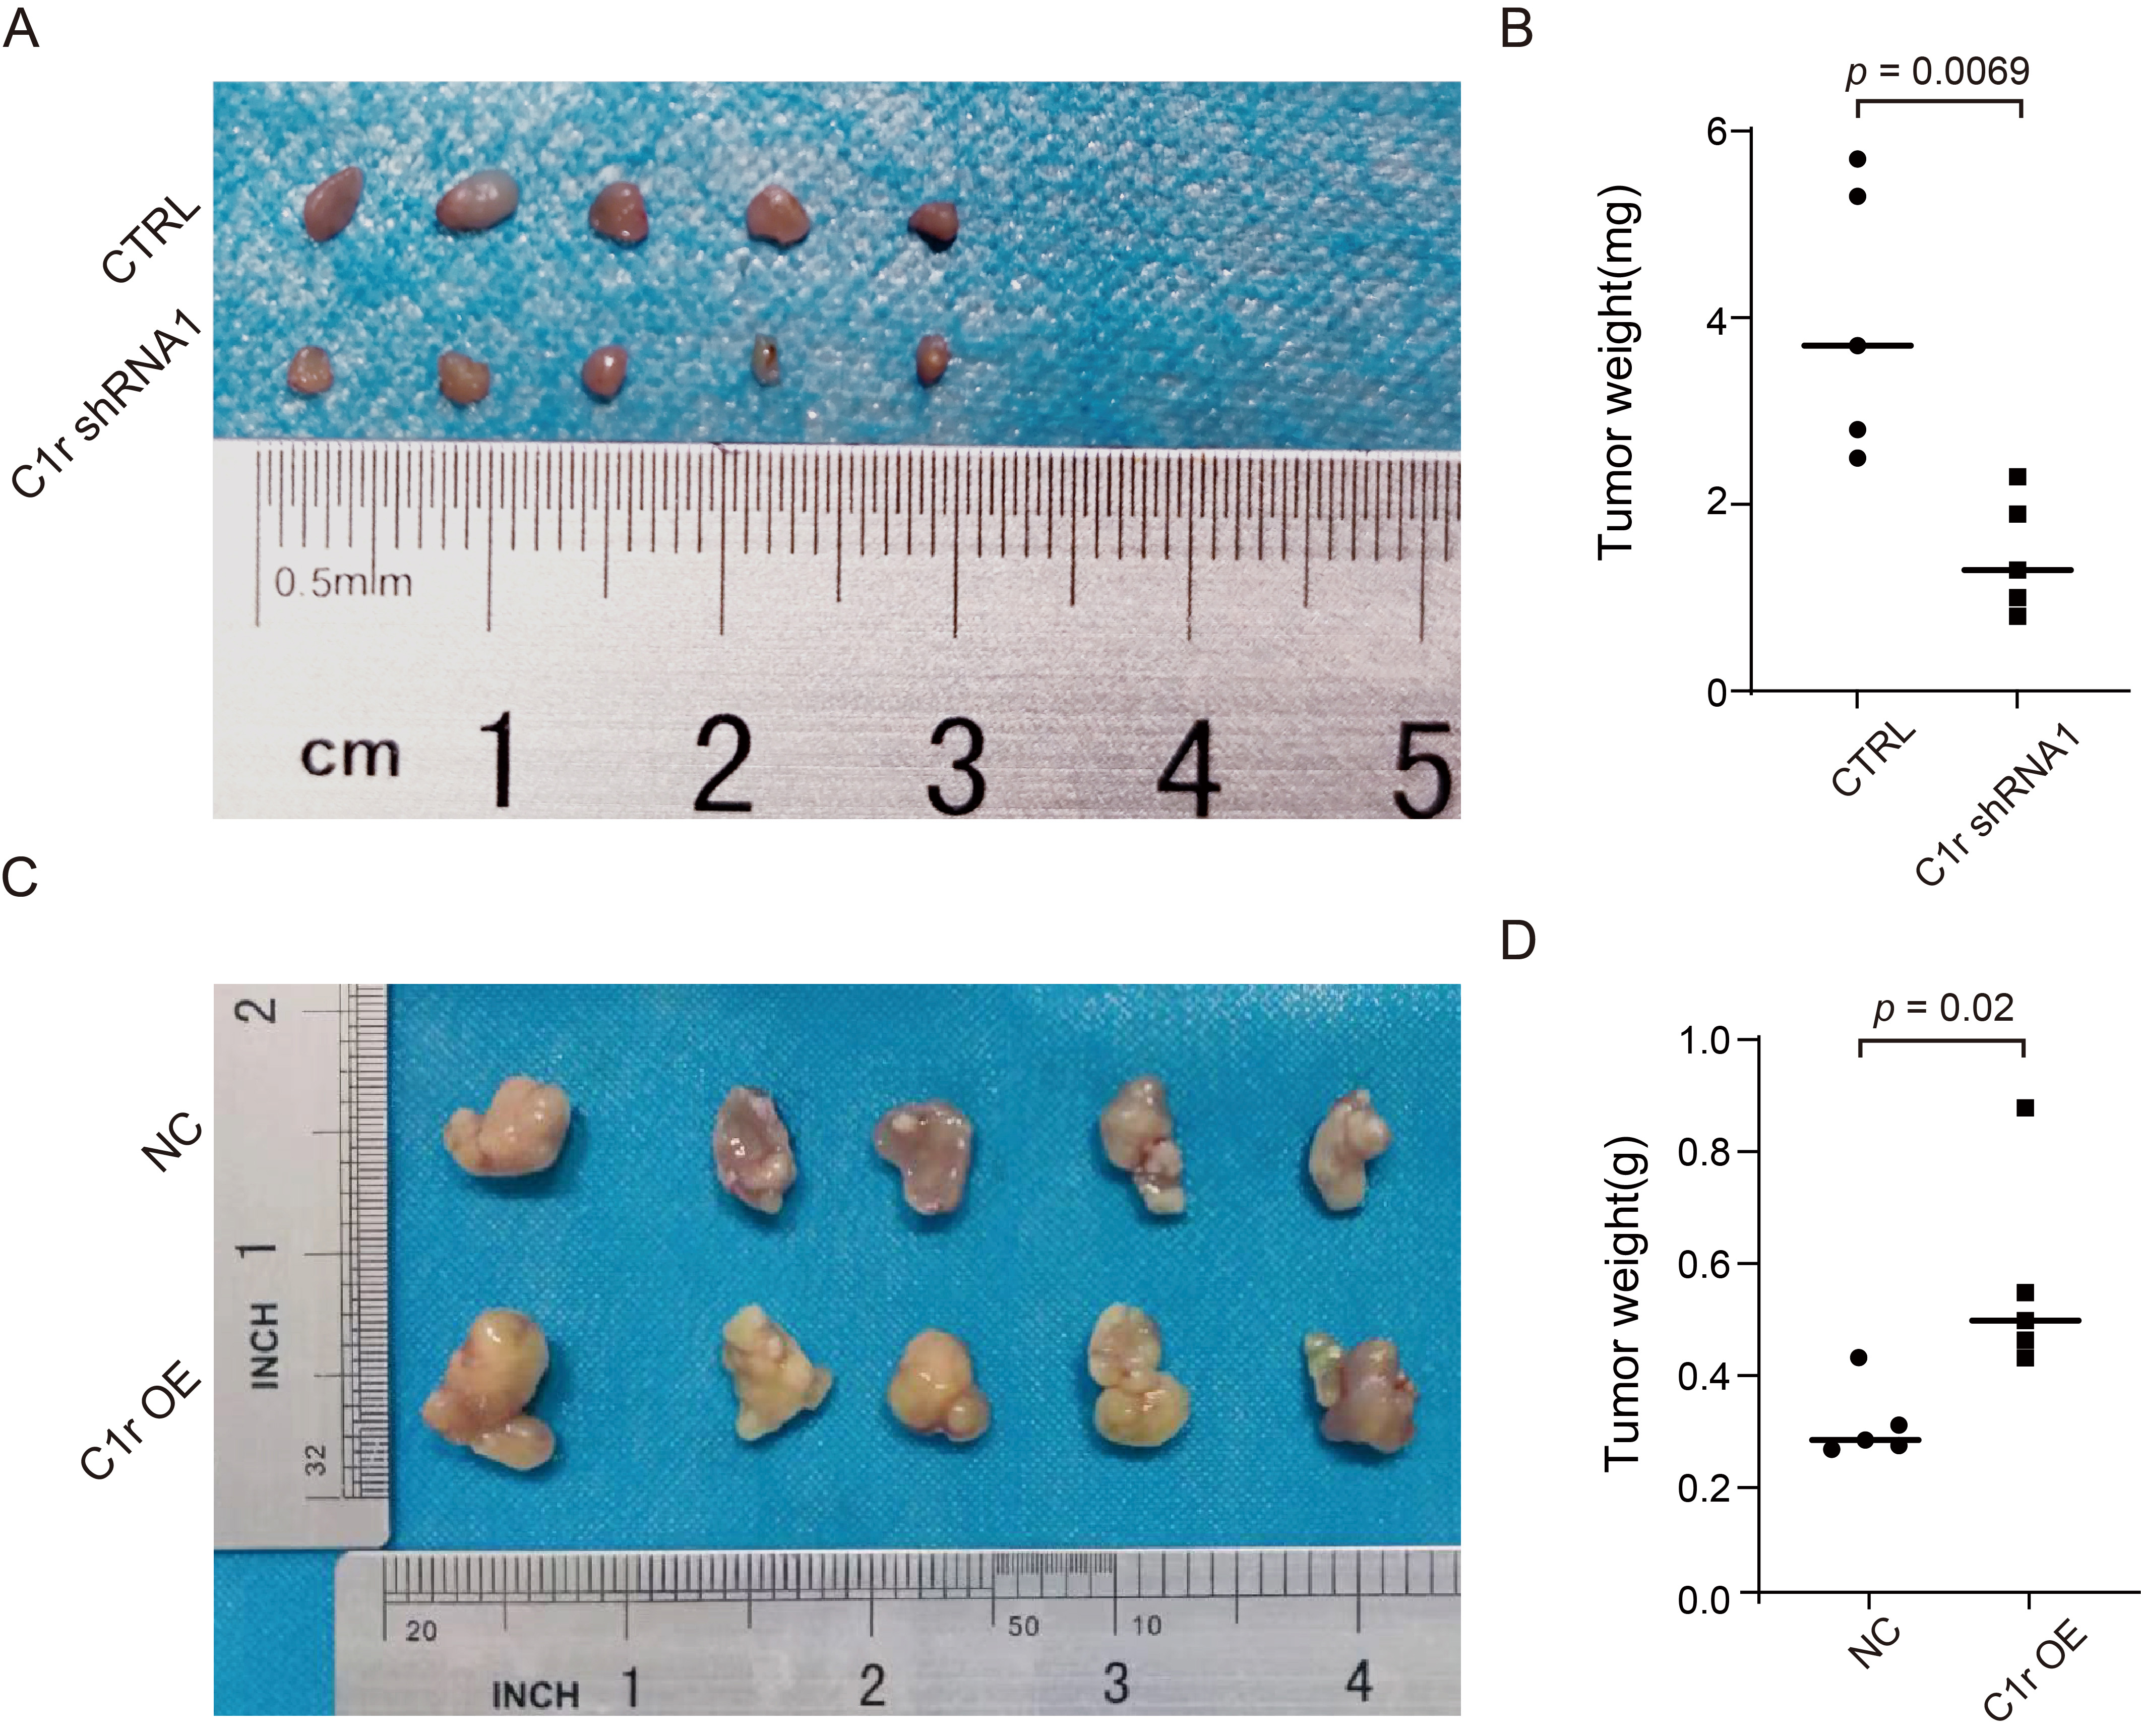
To further examine the effect of C1r on the growth of ESCC cells in
vivo, TE-1 cells with C1r knockdown (TE-1 CTRL/TE-1 C1r shRNA1) or Eca-109 cells
with C1r overexpression (Eca-109 NC/Eca-109 C1r OE) were subcutaneously injected
into the armpit of the nude mice. After injection, we observed that all mice grew
tumors, and the tumor formation rate in both groups was 100%. However, TE-1
cells in both CTRL and C1r shRNA1 groups exhibited extremely slow growth in nude
mice. After complete dissection of the tumor, we observed a significant reduction
in tumor weight in the C1r shRNA1 group compared to the CTRL group (Fig. 7A,B).
In contrast, the average tumor weight of the C1r overexpression group was 0.5508
 Fig. 7.
C1r promotes ESCC tumor growth in vivo. (A) Cell-based (TE-1 CTRL/TE-1 C1r shRNA1) xenografts in nude mice were completely dissected and photographed 25 days post-implantation into nude mice. (B) The tumor weights of C1r knockdown group and negative control group were confirmed at the end of the experiment. (C) Cell-based (Eca-109 NC/Eca-109 C1r OE) xenografts were completely dissected and photographed 35 days post-implantation into nude mice. (D) Dissected xenografts of C1r overexpression group and control group were weighed at the end of the experiment.
Tumors have complex microenvironments. One such aspect of this complexity is that many cell types contribute to the local production of complement components, including immune cells, endothelial cells, and malignant tumor cells [27, 28, 29]. In the past, complement components have been considered to have tumor-inhibitory roles within the microenvironment owing to their essential function of forming MAC. But recently, some studies have pointed out that complement components derived from tumor cells do not inhibit tumors, but rather, promote the development of tumors. It has been reported that the C1s located in the cytoplasm of clear cell renal cell carcinoma (ccRCC) cells promotes their proliferation [12]. In cutaneous squamous cell carcinoma (cSCC), complement components, namely, CFB, C1r, C1s and C3 regulate both proliferation and migration of cSCC cells [13, 14, 16]. Yang et al. [15] also demonstrated that C5a promotes the expression of PD-1/PD-L1 in metastatic renal cell carcinoma. Tumor cells are capable of generating a variety of complement components, in most cases, the complement components produced by tumor cells are principally C1r, C1s, C2, C3, and C4, which is considered a complement-rich phenotype [27]. Similarly, there is also a complement-rich phenotype observed in ESCC. Our findings showed that the expression of complement component genes C1QA, C1QB, C1QC, C1R, C1S, C2, and CFB, were relatively high in ESCC. Complement components produced by tumor cells can directly regulate cellular metabolism and physiological function [30]. It has been reported that endogenous CFB regulates p21-dependent cellular senescence [17]. According to the latest report, the intracellular complement (complosome) of C3 and C5, are closely related to NLRP3 and regulate cell trafficking, metabolism, and proliferation [31]. C1r is also reported to function in promoting cSCC invasiveness by modulating Akt and ERK1/2 phosphorylation [14]. ScRNA-seq and IHC indicated that, malignant epithelial cells highly expressed C1r. High expression of C1r mRNA and protein was associated with poorer overall survival. Interestingly, according to the latest study on the proteome of plasma membrane extracellular vesicles (EVs) in ESCC patients, the content of C1r protein in EVs obtained from ESCC patients is elevated and this is correlated with poor clinical outcomes [32].
Results of our immune infiltration analyses indicated that C1R abundance shows a
strong association with increased abundance of CAFs and M2 macrophages. Thus, C1r
and/or its downstream molecules may participate in shaping the TME. CAFs and M2
macrophages play an essential role in TME and have become prominent targets for
tumor prevention and treatment [33, 34, 35]. CAFs have multiple distinct subtypes, and
the proportions of these various subtypes differ amongst tumor tissues, as each
have different functions. Notably, the inflammatory CAFs or complement-secreting
CAFs exhibit high expression levels of multiple complement components which may
be involved in inflammation, and/or recruitment of myeloid-derived suppressor
cells (MDSCs) [36, 37, 38, 39]. In ESCC, CAFs have been implicated in chemotherapy
resistance, promotion of ESCC metastasis by remodeling the ECM, enhancing immune
evasion through upregulating the expression of PD-L1, recruiting MDSCs, and
inducing macrophages to differentiate into the M2 phenotype [9]. Macrophages can
differentiate into two cell types with opposite functions: pro-inflammatory M1
macrophages with antitumor functions and anti-inflammatory M2 macrophages that
exhibit tumor-supportive activity [40, 41]. M2 macrophages are capable of
participating in the malignant progression of tumor cells by producing cytokines
such as IL-10 and TGF-
Through cell function experiments, we confirmed that C1r could effectively promote the proliferation, migration, invasion, cell-matrix adhesion, and decreased apoptosis exhibited by ESCC cells. These findings highlight the direct impact of C1r on the biological functions of ESCC tumors. Further, our findings suggest that the downstream mechanism of the pro-tumoral effect of C1r may involve MMP-1 and MMP-10, both of which contribute to a pro-tumorigenic role in ESCC. The elevated levels of MMP-1 play a significant role in increasing cell viability, enhancing colony-forming abilities, and improving cell migration [46]. MMP-10 is one of the core molecules that regulate and activate MMPs. MMP-10 can effectively activate MMP-1, 7, 8, 9, and 13. MMP-10 also functions in a crucial role in various aspects of ESCC, including proliferation, metastasis, invasion, and angiogenesis [47]. The development of targeted therapies against C1r, such as anti-C1r antibodies and small molecule inhibitors, is predicted to provide a promising new avenue for the treatment of ESCC.
This body of work has primarily confirmed the significant role of tumor cell-derived C1r in the progression of ESCC. We found that C1r was highly expressed in ESCC tissues, malignant epithelial cells, and cultured ESCC cell lines. High C1r expression was associated with poor overall survival, and in vitro experiments established that C1r promoted the proliferation, migration, invasion, cell-matrix adhesion, and inhibited the apoptosis of ESCC cells. Moreover, C1r induced expression of MMP-1, MMP-10. However, further investigation into its downstream and upstream signaling pathways linked to C1r is still required, and the function of C1r within the TME has not been fully elucidated. A more comprehensive understanding of the function and mechanisms of C1r may provide promising new targets for the treatment of ESCC.
All data are available from the corresponding author upon reasonable request.
MT and WH designed the research study. MT, SZ and LR performed the research. QL and LL contributed to the analysis and interpretation of data. CW, CM, YC contributed to technical support. MT and LR wrote the manuscript. WH contributed to review the manuscript and supported funding. All authors contributed to editorial changes in the manuscript. All authors read and approved the final manuscript. All authors have participated sufficiently in the work and agreed to be accountable for all aspects of the work.
The tissue microarray (TMA, HEsoS180Su11) was provided by Shanghai Outdo Biotech Co., Ltd. and approved by the Ethics Committee of Shanghai Outdo Biotech Company. All animals used in this study were conducted following the laboratory guidelines for animal care and approved by the Ethics Committee of North Sichuan Medical College (No. NSMC202222).
Not applicable.
This work was supported by grants from the Cooperation Project on Scientific Research between Nanchong City and North Sichuan Medical College (No. 20SXQT0332 and No. 19SXHZ0344).
The authors declare no conflict of interest.
References
Publisher’s Note: IMR Press stays neutral with regard to jurisdictional claims in published maps and institutional affiliations.