


1 Department of General Practice, Yangpu Hospital, School of Medicine, Tongji University, 200090 Shanghai, China
2 Department of Spinal Surgery, Shanghai East Hospital, School of Medicine, Tongji University, 200092 Shanghai, China
Abstract
Background: The pituitary tumor-transforming gene 1 (PTTG1), also recognized as securin, plays a crucial role in diverse biological processes, such as restraining sister chromatid segregation, facilitating DNA repair, contributing to organ development, and governing angiogenesis. Additionally, it regulates the expression and secretion of transfer factors. The epigenetic characteristics of PTTG1 suggest its potential in elucidating the progression of malignant tumors in pan-cancer. Nevertheless, the current comprehension of this relationship remains limited, necessitating further comprehensive studies to delve into the underlying pathogenesis. Methods: This investigation aimed to explore the potential functions of PTTG1 in pan-cancer by leveraging existing databases, such as TCGA and GTEx. Notably, PTTG1 was overexpressed in nearly all tumors, indicating promising prognostic and diagnostic capabilities. Moreover, the observed correlation between PTTG1 and immune cell infiltration, immune checkpoint genes, tumor mutational burden (TMB), microsatellite instability (MSI), and other immune features suggests its potential utility as a guide for immunotherapy. Results: The study unveils that the downregulation of PTTG1 expression in neuroblastoma results in reduced cell proliferation and increased apoptosis, substantiating the proposition that PTTG1 could serve as both a prognostic biomarker and a potential target for immunotherapy across various cancer types. Conclusions: This study centers on the exploration of the expression and role of PTTG1 in both tumors and the tumor microenvironment (TME), offering valuable insights for the development of cancer therapeutic strategies. These discoveries present potential alternative avenues for addressing clinically resistant cancers.
Keywords
- PTTG1
- pan-cancer
- immune infiltration
- biomarker
- immunity
- prognosis
Cancer manifests as a diverse and heterogeneous disease characterized by complexity across various levels, including genetic factors, epigenetic modifications, and cellular signaling. Evaluating this complexity is crucial for the development of more efficacious treatment strategies, for which surgery, chemotherapy, radiotherapy, and immunotherapy constitute the primary treatment modalities. While these approaches have demonstrated clinical success, saving lives in specific cases, they have also created challenges, such as drug resistance and adverse effects. Consequently, patient prognosis and survival rates are not entirely satisfactory. Hence, identifying precise targets and novel tumor markers is imperative for advancing tumor therapy [1, 2]. The intricate nature of cancer phenotypes encompasses various factors. Serving as a potent instrument for bioinformatics analysis, the R software package assumes a pivotal role in differential expression analysis, survival analysis, machine learning, and network analysis. A comprehensive grasp of cancer complexity enables the formulation of personalized treatment strategies, thereby enhancing treatment outcomes [3, 4].
The pituitary tumor-transforming gene 1 (PTTG1) has garnered significant attention in cancer research. Initially identified in connection with pituitary tumors, subsequent investigations have revealed its crucial involvement in a diverse array of cancers. The discovery of the PTTG1 dates back to 1997 when it was initially found in rat pituitary tumor cells and was recognized as a transforming gene that originated from the pituitary gland [5]. Situated on human chromosome 5q33.3, the PTTG1 encodes a 188-amino acid protein. Functioning as a transcriptional regulator, PTTG1 is intricately involved in cell cycle regulation and cell proliferation. It is pivotal in preserving normal cell division and the well-coordinated proliferation of cells under physiological conditions. Nevertheless, in the context of cancer, the aberrant expression and malfunction of PTTG1 are intimately linked to the initiation, progression, and prognosis of tumors [6, 7]. Research has indicated that PTTG1 expression is notably elevated in various tumors, particularly those originating in the endocrine system. However, it has also been detected in non-endocrine-related cancers, affecting the central nervous system, lung system, and gastrointestinal system [8, 9, 10, 11, 12, 13, 14, 15]. PTTG1 is a protein that exerts its function by directly binding to DNA or interacting with other proteins while also possessing transcriptional activity. Its main role is to promote tumor cell invasion through its transcriptional activity. For instance, it activates the expression of metalloproteinase 2 (MMP-2), which accelerates the transfer of tumor cells and leads to faster tumor growth [16, 17, 18]. Furthermore, it has been discovered that PTTG1 can enhance the migratory and invasive characteristics of cancer cells by activating the epithelial–mesenchymal transition (EMT) pathway [19, 20]. PTTG1 orchestrates cell entry into mitosis by modulating the expressions of the cyclin proteins, particularly by fostering the accumulation of cyclin B1 [21]. This holds significant implications for the aberrant proliferation observed in cancer cells. Moreover, PTTG1 heightens the resistance of tumor cells to therapy by impeding DNA damage repair pathways, including the non-homologous end joining pathway [22, 23]. Given the comprehensive understanding of the pivotal role PTTG1 plays in cancer, it has emerged as a potential target for cancer therapy and prognostic evaluation. Numerous studies demonstrate the effective inhibition of tumor growth and metastasis by restraining the expression or function of PTTG1. Hence, PTTG1 holds promise as a crucial component in forthcoming individualized treatment strategies.
Our research is groundbreaking as it marks the inaugural extensive pan-cancer analysis of PTTG1, utilizing data from both the TCGA project and the GEO database. To deepen our insight into the molecular mechanisms involving PTTG1 in the onset and clinical prognosis across a spectrum of cancers, we considered various factors, encompassing gene expression, survival outcomes, DNA methylation, genetic alterations, protein phosphorylation, immune infiltration, and pertinent cellular pathways.
The PROTTER database (https://wlab.ethz.ch/protter/start/) was utilized to forecast protein sequence characteristics and exhibit the transmembrane topology of proteins using the experimental proteomics evidence set of PTMs [24]. The Human Protein Atlas (HPA) database, available at https://www.proteinatlas.org/, utilizes a variety of techniques, including antibody-based imaging, mass spectrometry-based proteomics, transcriptomics, and systems biology to comprehensively map all human cells, tissues, and proteins in the organs [25, 26]. We obtained the pan-cancer dataset from the UCSC database, which was unified and standardized. This dataset, named TCGA TARGET GTEx (PANCAN, N = 19,131, G = 60,499), was used to extract the gene expression data of ENSG00000114346 (PTTG1) in each sample.
We obtained the harmonized pan-cancer dataset from the UCSC database (https://xenabrowser.net/), specifically the TCGA TARGET GTEx dataset (PANCAN, N = 19,131, G = 60,499). Subsequently, we extracted the gene expression data for ENSG00000164611 (PTTG1) in each sample from TCGA Target GTEx (PANCAN, N = 19,131, G = 60,499). Then, the sample sources were filtered based on the following criteria: Primary blood-derived cancer–peripheral blood (TCGA-LAML), primary tumor, TCGA-SKCM metastatic, primary blood-derived cancer–bone marrow, primary solid tumor, recurrent blood-derived cancer–bone marrow samples. Additionally, we obtained high-quality prognostic TCGA datasets from research previously published in Cell using the TCGA prognosis. After excluding samples with a follow-up time of less than 30 days, we transformed each expression value using log2(x+0.001). Finally, cancer samples with fewer than 10 samples in a single cancer were excluded, resulting in a final dataset comprising 44 cancer samples.
To study the genetic changes in the pan-cancer cohort regarding the PTTG1 gene, we logged into the cBioPortal website (https://www.cbioportal.org/) [27, 28]. To query the genetic alteration signature of PTTG1, we selected the ‘TCGA Pan-Cancer Atlas Studies’ in the ‘Quick Selection’ section. The Cancer Types Summary module was used to view the mutation frequency, mutation type, and copy number alteration (CNA) results for all TCGA tumors. Additionally, the mutation module displayed the PTTG1 mutation site information in the protein structure diagram or three-dimensional structure.
We obtained the pan-cancer dataset from the UCSC database (https://xenabrowser.net/). The dataset, which included TCGA TARGET GTEx (PANCAN, N = 19,131, G = 60,499), was used to extract the ENSG00000164611 (PTTG1) genes and 150 marker genes for the five types of immune pathways (chemokine (41), receptor (18), MHC (21), Immunoinhibitor (24), Immunostimulator (46)) from each sample expression data. To calculate the stromal, immune, and ESTIMATE scores of each patient in each tumor based on gene expression, we utilized the R package ESTIMATE. The collated gene expression data was combined with the measured infiltration scores of various cell types for every patient in each tumor using the “Timer” [29], “deconvo_epic”, and “deconvo_quantiseq” algorithms in the R package “IOBR”. The results were visualized using the R package “reshape2” and “RColorBreyer”. The Tumor Immunity Single Cell Center (TISCH) has compiled a comprehensive collection of 76 tumor datasets from 27 different cancer types. This includes single-cell transcriptome profiles of nearly 2 million cells, providing an invaluable resource for researchers studying tumor immunity [30].
We obtained the pan-cancer dataset from the UCSC (https://xenabrowser.net/) database, which was unified and standardized. This dataset, known as TCGA pan-cancer (PANCAN), consisted of 10,535 samples and 60,499 genes. We specifically extracted the gene expression data of ENSG00000164611 (PTTG1) from each sample. To ensure the highest quality data, we further screened the samples only to include those from primary blood-derived cancers in peripheral blood and primary tumor samples [31], and we calculated the TMB (tumor mutation burden), MSI (microsatellite instability), purity, for the DNA of each tumor using the R package maftools [32, 33, 34]. The gene expression data from the samples underwent integration before being transformed using the log2(x+0.001) formula. Cancer types with less than three samples were eliminated to ensure data accuracy, resulting in a final dataset of expression data for 37 cancer types.
The SK-N-SH cell line was obtained from the Chinese Academy of Sciences and
cultured in DMEM (Yeasen biotech; 41420ES76; Shanghai, China) supplemented with
10% heat-inactivated fetal bovine serum (FBS, Yeasen biotech; 40130ES76;
Shanghai, China). All cell lines were validated by STR profiling and tested
negative for mycoplasma. Cells were all cultured in a humidified incubator at 37
°C and 5% CO
PTTG1-1: 5
PTTG1-2: 5
Cell proliferation was evaluated utilizing the Cell Counting kit-8 (CCK-8,
Yeasen biotech; 40203ES60; Shanghai, China) assay from Yeasen. In 96-well plates,
cells were seeded at a density of 6
To identify EdU-positive cells, flow cytometry analysis was performed on proliferating cells using the Cell-Light EdU Apollo 488 (Yeasen biotech; 40275ES76; Shanghai, China), following the manufacturer’s protocol. The fluorescence signal was detected at 488 nm using flow cytometry.
To assess cell apoptosis, SK-N-SH cells were seeded in 6-well plates and transfected with siPTTG1 when they reached a confluency of 30%–40%. After 48 hours, an Annexin V-FITC kit (Yeasen biotech; 40306ES60; Shanghai, China) was utilized.
Western blotting was performed following previously described protocols [35].
The primary antibodies targeting PTTG1 (Abcam; ab79546, 1:100,
Univ Cambridge UK) were sourced from Abcam, while
RNA extraction was performed using TRIzol reagent (Yeasen biotech; 19202ES60;
Shanghai, China), and reverse transcription was conducted using PrimeScript RT
Master Mix (Perfect Real Time) kit (Yeasen biotech; 10137ES76; Shanghai, China).
Real-time quantitative PCR (qPCR) was performed using SYBR Green Master Mix
(Yeasen biotech; 11201ES60; Shanghai, China). Relative mRNA expression levels
were determined using the 2
PTTG1 forward: 5
PTTG1 reverse: 5
GAPDH forward: 5
GAPDH reverse: 5
In this investigation, disparities in gene expression were assessed through the
Wilcoxon rank sum test and the Kruskal–Wallis test. Additionally, we gauged the
correlation between the two groups using either Spearman’s rank correlation
coefficient or Pearson correlation analysis. Survival characteristics were
compared using the Kaplan–Meier method and Cox regression analysis. Statistical
analyses and visualizations were executed using R software (R-4.2.2; University of Auckland, New
Zealand), Sangerbox, and GraphPad Prism 9 (GraphPad Software Inc.; California, USA) [36]. A
p-value
First, we present a flowchart of the analytical methods used in this paper (Supplementary Fig. 1). To determine the cellular localization of PTTG1, we employed indirect immunofluorescence to examine its distribution in the endoplasmic reticulum (ER) and microtubules of PC-3 prostatic cancer (PC) cells, U-251 malignant glioblastoma (MG) cells, and U-2 osteosarcoma (OS) cells, all sourced from the HPA database. Our findings indicate that PTTG1 is predominantly localized in the cytoplasm of all three cell types, evident from its co-localization with cytoplasmic markers (Fig. 1A). Moreover, the structural arrangement of the PTTG1 protein suggests that natural missense variants of Ala2 and Ser165 are situated within the cell membrane (Fig. 1B). In our investigation, the analysis of single-cell RNA-sequencing data, utilizing fluorescent ubiquitin-based technology, demonstrated a substantial correlation between increased expression of PTTG1 RNA and cell cycle progression. Changes in protein expression levels of PTTG1 were observed to align with progression through the G1, S, and G2 phases (Fig. 1C). Furthermore, our research revealed the presence of PTTG1 messenger RNA (mRNA) and protein in various normal human tissues, including the testis, lymph nodes, tonsils, thymus, nasopharynx, and thyroid gland (Fig. 1D,E).
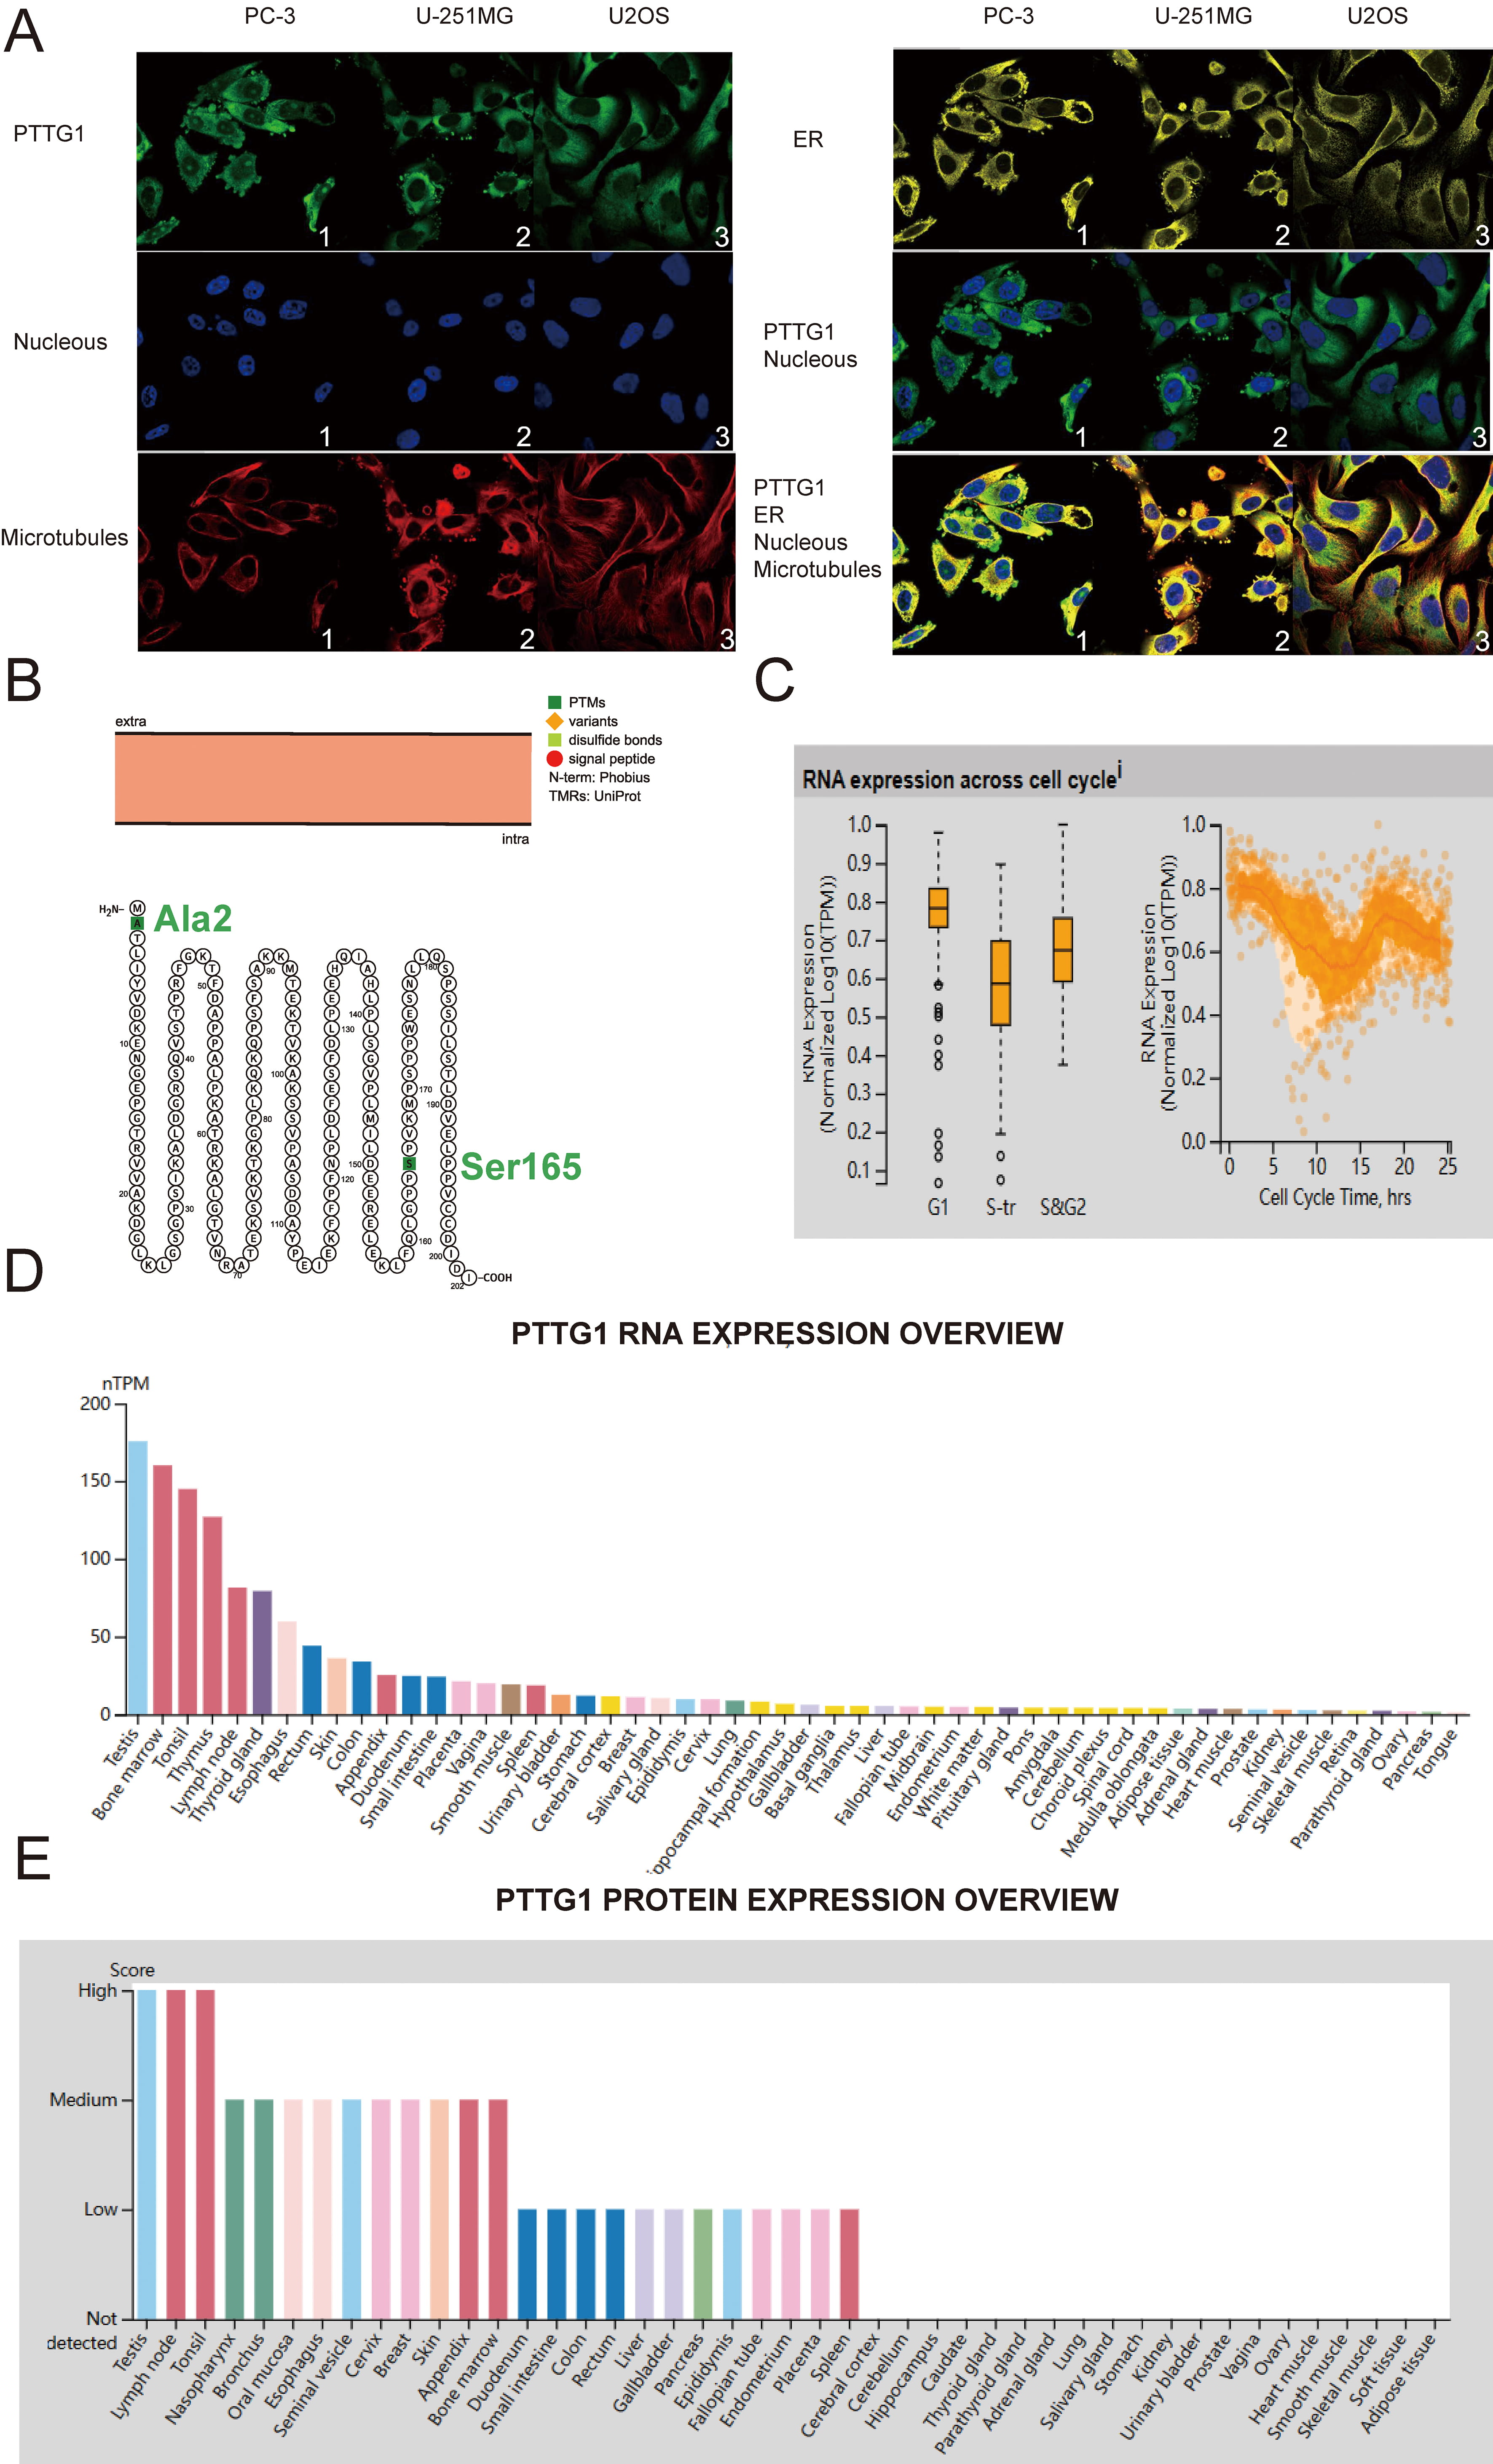 Fig. 1.
Pituitary tumor-transforming gene 1 (PTTG1) variants, localization, single-cell variations, functional partners, and expression profiles under physiological conditions. (A) Immunofluorescence staining demonstrates the subcellular distribution of PTTG1 within the nucleus, endoplasmic reticulum (ER), and microtubules of PC-3 prostatic cancer cells, U-251 malignant glioblastoma (MG) cells, and U-2 osteosarcoma (OS) cells, sourced from the Human Protein Atlas (HPA) database. (B) The topology of the PTTG1 protein reveals its membrane localization, featuring a natural missense variant of Ala2 and Ser165. (C) A plot based on single-cell RNA-Seq data illustrates the correlation between PTTG1 mRNA expression and cell cycle progression. (D) Expression levels of PTTG1 RNA in various tissues were assessed using the HPA dataset. (E) The expression level of PTTG1 protein in tissues was evaluated in the HPA dataset (https://www.proteinatlas.org/ENSG00000164611-PTTG1/tissue). RNA-Seq, RNA sequencing; mRNA, messenger RNA.
In this investigation, we utilized R software to assess the expression differences between normal and tumor samples across various cancers. Significance analysis was conducted using unpaired Wilcoxon rank-sum and signed-rank Tests. PTTG1 exhibited significant upregulation in 33 tumors, encompassing GBM, GBMLGG, LGG, UCEC, BRCA, CESC, LUAD, ESCA, STES, KIRP, KIPAN, COAD, COADREAD, PRAD, STAD, KIRC, LUSC, LIHC, WT, SKCM, BLCA, THCA, READ, OV, PAAD, UCS, ALL, LAML, PCPG, ACC, KICH, and CHOL (Fig. 2A).
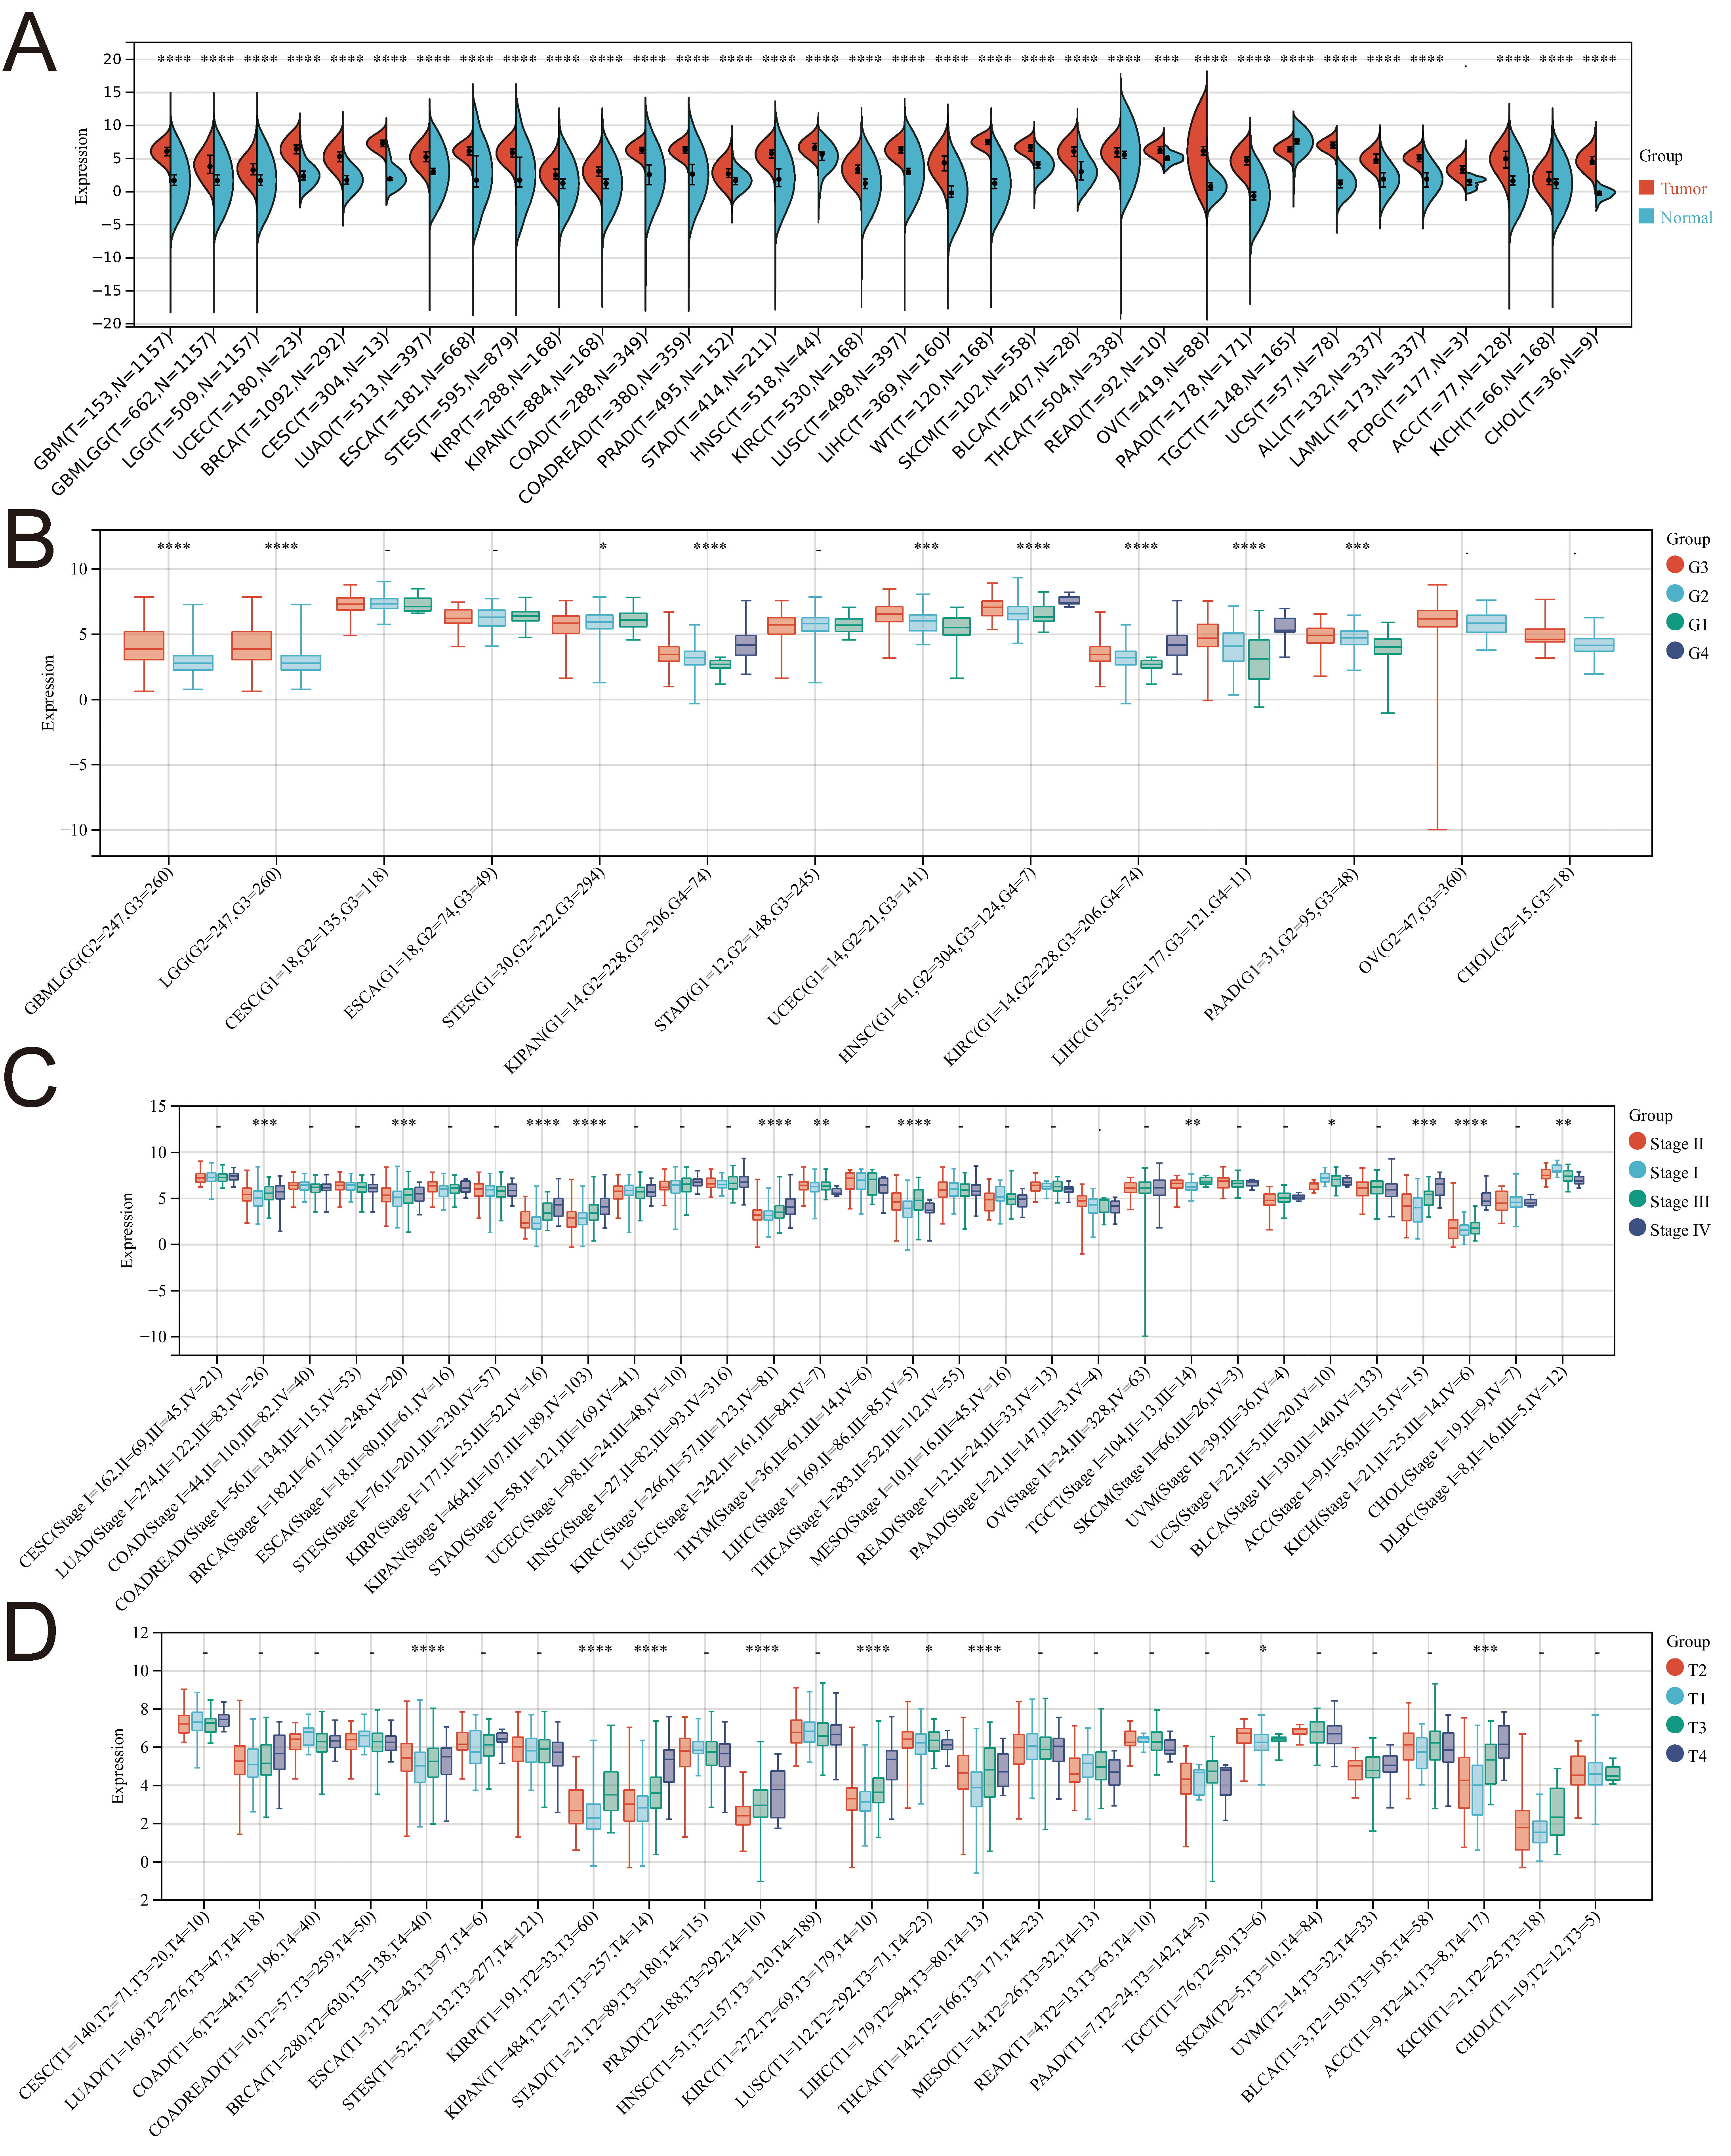 Fig. 2.
Examining the correlation between PTTG1 gene expression
and diverse clinicopathological stages in pan-cancer. (A) Comparative analysis
of PTTG1 expression in TCGA and GTEx databases. (B) Violin plots depict the
variation in PTTG1 expression across pathological G1/G2/G3 stages. (C) Violin
plots display the differences in PTTG1 expression levels among pathological
I/II/III/IV stages. (D) Violin plots illustrate the distinctions in PTTG1
expression levels across pathological T1/T2/T3/T4 stages. Significance denoted as
*p
Moreover, the expression of PTTG1 demonstrated significant variations among patients with GBMLGG, LGG, STES, KIPAN, UCEC, HNSC, KIRC, LIHC, and PAAD, contingent on their pathological stage (G1/G2/G3/G4) (Fig. 2B). In several cancers, including LUAD, BRCA, KIRP, KIPAN, KIRC, LUSC, LIHC, TGCT, UCS, ACC, KICH, and DLBC, PTTG1 expression exhibited notable differences across pathological stages I, II, III, and IV (Fig. 2C). Additionally, there were significant differences in PTTG1 expression among patients with BRCA, KIRP, KIPAN, PRAD, KIRC, LUSC, LIHC, TGCT, and ACC, based on their pathological T1/T2/T3/T4 stage (Fig. 2D).
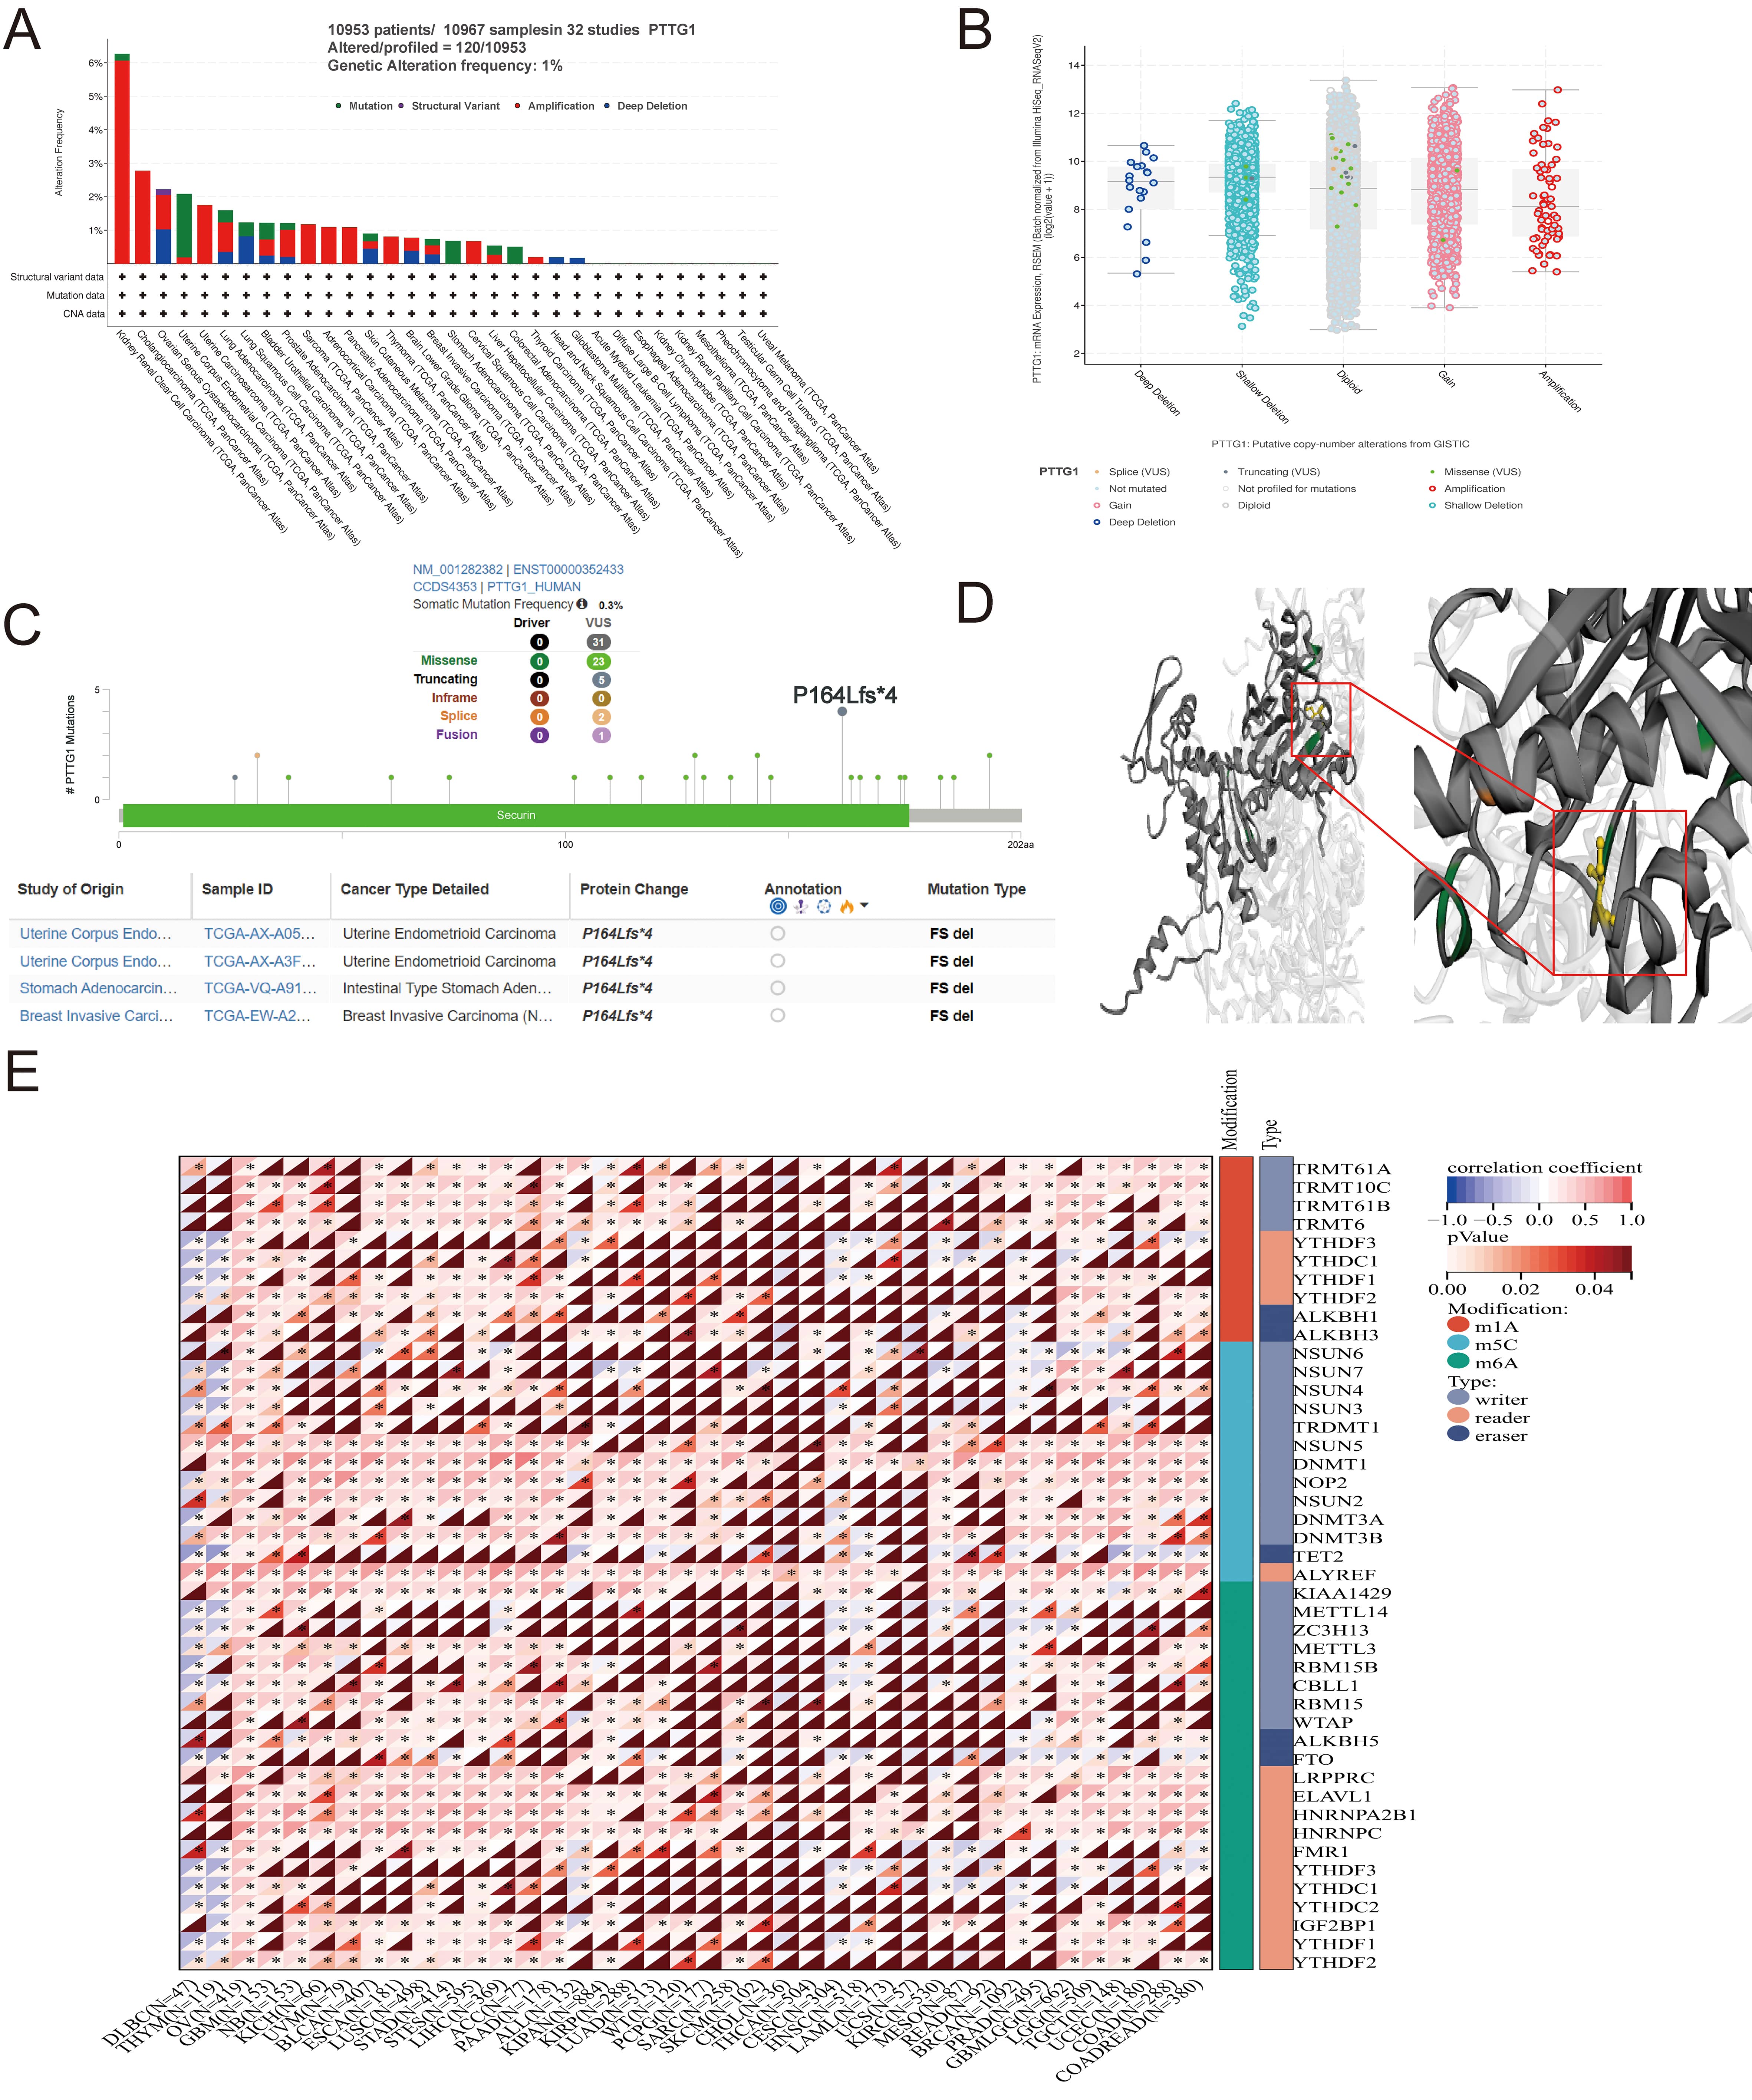
A comprehensive analysis of PTTG1 in malignant tumors was undertaken to elucidate its role in cancer. The TCGA pan-cancer dataset was examined, revealing that the most prevalent DNA alteration in PTTG1 was amplification. This amplification was most frequently observed in kidney renal clear cell carcinomas, followed by cholangiocarcinoma and ovarian serous cystadenocarcinoma (Fig. 3A). Notably, PTTG1 mutations were identified in uterine corpus endometrial carcinoma, stomach adenocarcinoma, and colorectal adenocarcinoma, with deep deletion of PTTG1 predominantly observed in stomach adenocarcinoma. Furthermore, a statistically significant correlation was observed between PTTG1 expression and mutation type and copy number (Fig. 3B). Missense mutations were identified as the primary genetic alterations in the PTTG1 gene, with the P164Lfs4 mutation being the most common alteration, observed in two cases of UCEC (Fig. 3C). The three-dimensional structure of the PTTG1 protein further highlighted the P164Lfs4 site (Fig. 3D). Therefore, the elevated expression of PTTG1 in cancer may be attributed to genetic variations. Recent research has identified over 100 types of RNA modifications that act as crucial regulators of gene transcriptional expression. RNA methylation and its associated downstream signaling pathways are pivotal in various biological processes, including cell differentiation, sex determination, and stress responses [37]. The expression of PTTG1 is believed to be primarily regulated through RNA post-transcriptional modifications, evident from the significant positive correlation between PTTG1 expression and RNA modification-related genes, such as m1A, m5C, and m6A. Specifically, genes involved in RNA modification, including METTL3, METTL14, WTAP, and YTHDF1, exhibited a significant positive correlation with PTTG1 expression (Fig. 3E).
 Fig. 3.
Mutation characteristics of PTTG1 in various TCGA tumors. (A)
Utilizing the cBioPortal tool, we scrutinized the mutation features of PTTG1
across TCGA tumors, presenting the alteration frequency categorized by mutation
type. (B) Depiction of potential alterations in PTTG1 copy number. (C)
Visualization of the PTTG1 3D structure, highlighting the mutation site with the
highest alteration frequency (P164Lfs*4 site). (D) Presentation of the specific
mutation site. (E) Evaluation of the correlation between PTTG1 expression and the
expression of RNA modification regulators in pan-cancer. Significance indicated
as *p
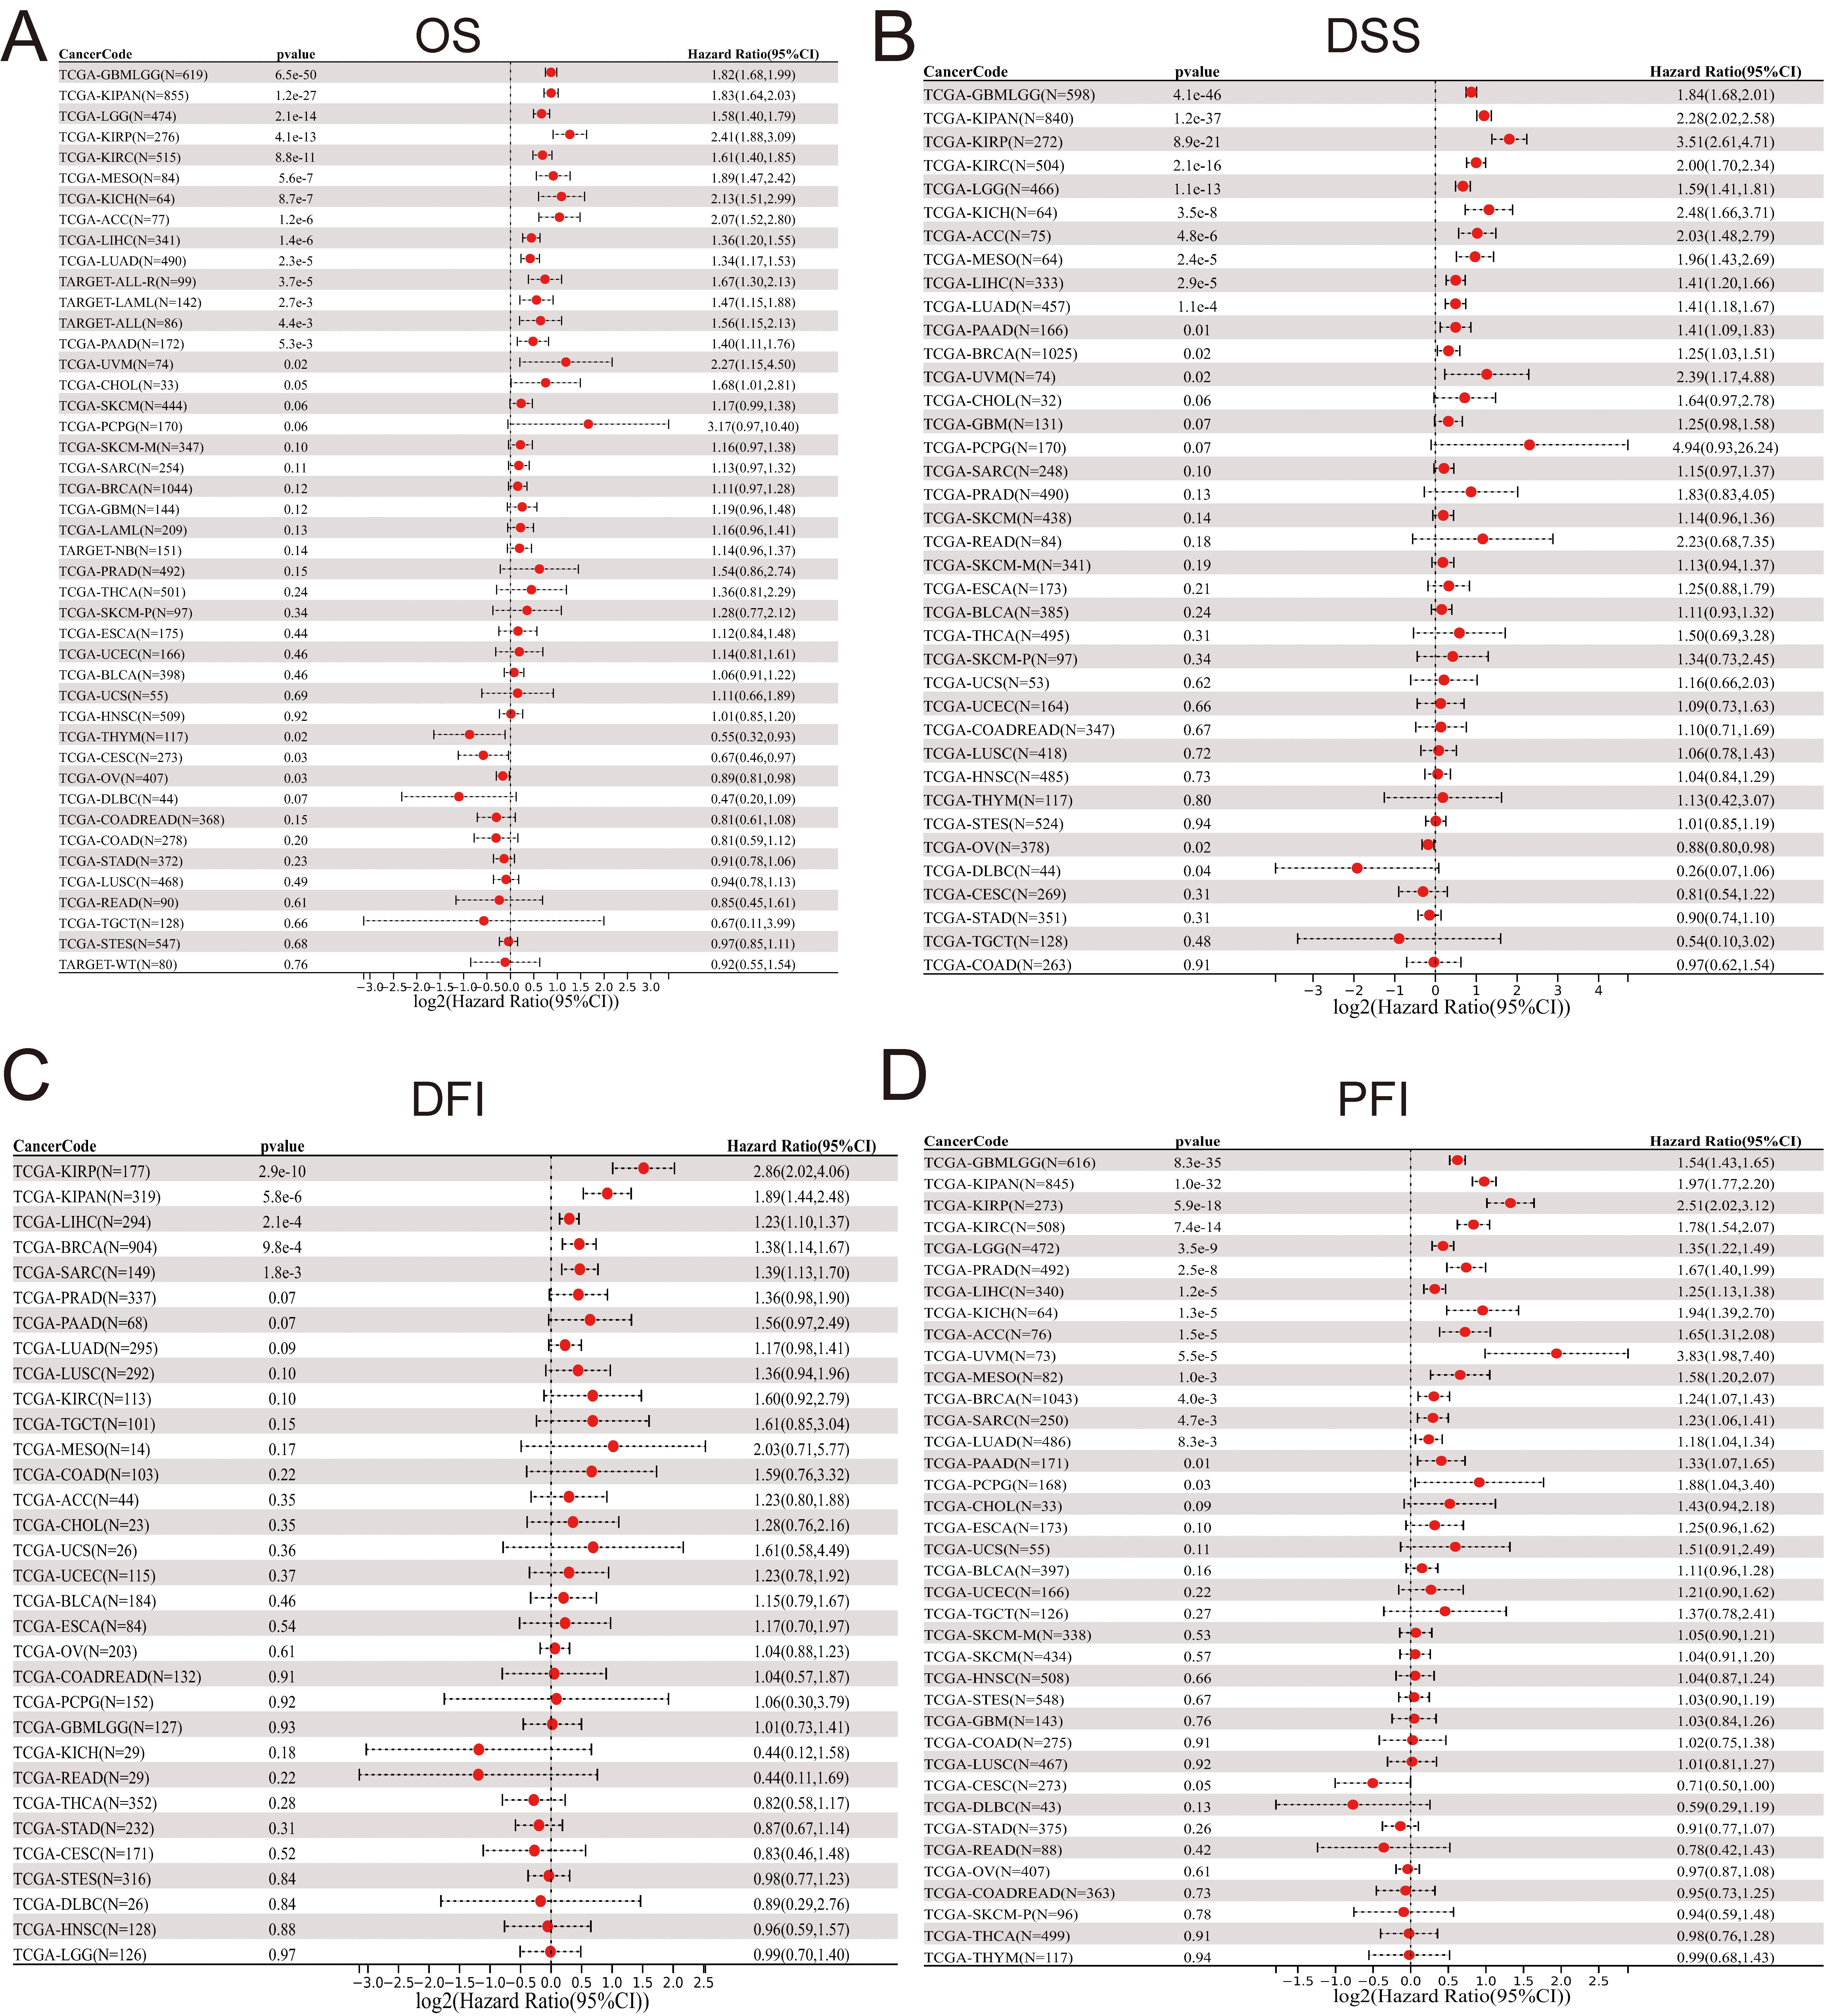
The survival analysis of PTTG1 across four domains—OS, DSS, PFS, and DFS—reveals its prognostic significance in pan-cancer. The Cox regression model analysis indicates that patients with elevated PTTG1 expression in the 16 considered tumor types face an increased risk of poor overall survival (OS) (Fig. 4A), encompassing GBMLGG, LGG, LAML, LUAD, KIRP, KIPAN, KIRC, LIHC, MESO, UVM, PAAD, ALL, CHOL, ACC, KICH, and ALL-R. Subsequent investigations demonstrate a substantial association between PTTG1 expression and DSS across various carcinoma categories, including but not limited to GBMLGG, KIPAN, KIRP, KIRC, LGG, KICH, ACC, MESO, LIHC, LUAD, PAAD, BRCA, and UVM (Fig. 4B). Moreover, heightened PTTG1 expression suggests a lower DFI in BRCA, SARC, KIRP, KIPAN, and LIHC (Fig. 4C). We further established a univariate Cox regression model to correlate PTTG1 expression with PFI in various cancer types. The findings highlight that PTTG1 expression is associated with poor prognosis in 16 tumor types, including GBMLGG, KIPAN, KIRP, KIRC, LGG, PRAD, LIHC, KICH, ACC, UVM, MESO, BRCA, SARC, LUAD, PAAD, and PCPG (Fig. 4D). The associations between PTTG1 and OS, DSS, DFS, and PFS were evaluated using Kaplan–Meier (KM) survival analysis curves, and revealed a trend consistent with the univariate Cox regression analysis. In CESC, GBMLGG, KIRP, LAML, LGG, and LIHC, elevated PTTG1 expression correlated with a declining trend in OS (Supplementary Fig. 2), mirroring the KM curves for DSS in GBMLGG, KIPAN, KIRP, and LGG (Supplementary Fig. 3A–D). Kaplan–Meier survival analysis further demonstrated a significant correlation between high PTTG1 expression and disease-free survival (DFS) in breast invasive carcinoma (BRCA), kidney renal papillary cell carcinoma (KIRP), liver hepatocellular carcinoma (LIHC), and pancreatic adenocarcinoma (PAAD) (Supplementary Fig. 3E–H). PTTG1 exhibited a robust association with progression-free survival (PFS) across pan-cancer studies, notably showing low PFS rates in patients with GBMLGG, KIRC, LGG, and PRAD (Supplementary Fig. 4). To substantiate their prognostic value, separate nomogram models were constructed for KIRC, LUSC, and LIHC, chosen based on univariate Cox regression results. The accuracy of these models was assessed through calibration curves at 1-year, 3-year, and 5-year intervals. The findings demonstrated that the nomogram models for KIRC (Supplementary Fig. 5A), LUSC (Supplementary Fig. 5C), and LIHC (Supplementary Fig. 5E) accurately predicted survival rates, emphasizing the significant impact of PTTG1 on prognosis and its role as a robust predictor of overall survival over the 1-year, 3-year, and 5-year periods (Supplementary Fig. 5B,D,F).
 Fig. 4.
Univariate Cox Regression Analysis of PTTG1 Regarding OS, PFS, DFS, and DSS Across Pan-Cancer. (A) Assessment of the correlation between PTTG1 expression and OS (overall survival). (B) Examination of the correlation between PTTG1 expression and DSS (disease-specific survival). (C) Investigation of the correlation between PTTG1 expression and DFI (disease-free interval). (D) Evaluation of the correlation between PTTG1 expression and PFI (progression-free interval).
This study aimed to explore the influence of PTTG1 on the tumor microenvironment (TME) and its association with immune infiltration levels across various cancers. Additionally, we investigated the correlation between PTTG1 expression and three immune scores. Our findings indicated a significant negative correlation between PTTG1 expression and immune infiltration, as assessed by StromalScore, in BRCA, STES, STAD, and LUSC (Fig. 5A). Similarly, there was a negative correlation between PTTG1 expression and immune infiltration, as determined by ImmuneScore, in GBM, STES, LUSC, and READ (Fig. 5B). EstimateScore suggested a decreasing trend in immune infiltration levels with elevated PTTG1 expression in GBM, STES, STAD, and LUSC (Fig. 5C). Despite variations in score values, the overall trend remained consistent, highlighting the significant regulatory role of PTTG1 in the tumor immune microenvironment across the mentioned malignancies. Our analysis explored the potential correlation between PTTG1 expression and immune checkpoint pathway genes across diverse cancer types. The results demonstrated a significant association between PTTG1 and both immunosuppressive and immunostimulatory genes in pan-cancer. Of particular note was the positive correlation observed between PTTG1 and the immune checkpoint pathway genes, providing further evidence of the involvement of PTTG1 in the regulation of the immune response in cancer (Fig. 5D). We conducted a comparative analysis of PTTG1 with genes related to immune regulation, including major histocompatibility complex (MHC), chemokines and chemokine receptor genes, immunosuppressants, and immunostimulators. Our findings revealed strong correlations between PTTG1 expression levels and these three gene families across various tumor types. The correlation analysis of PTTG1 with immune checkpoint genes showed a positive correlation in GBMLGG, LGG, KIRP, and KIPAN, while a negative correlation was observed in DLBC and THYM. In several malignancies, such as GBMLGG, LGG, KIPAN, KIRC, OV, UVM, MESO, LIHC, PAAD, THYM, and DLBC, the correlation between PTTG1 and the five gene families was particularly significant, demonstrating an overall positive correlation. Notably, GBMLGG, LGG, KIPAN, and KIRC exhibited the highest expression levels, and PTTG1 expression positively correlated with nearly all MHC and chemokine receptor genes in these five malignancies. While this correlation was evident in pan-cancer, it was not statistically significant in UCS, SKCM, and WT tumors (Fig. 5E).
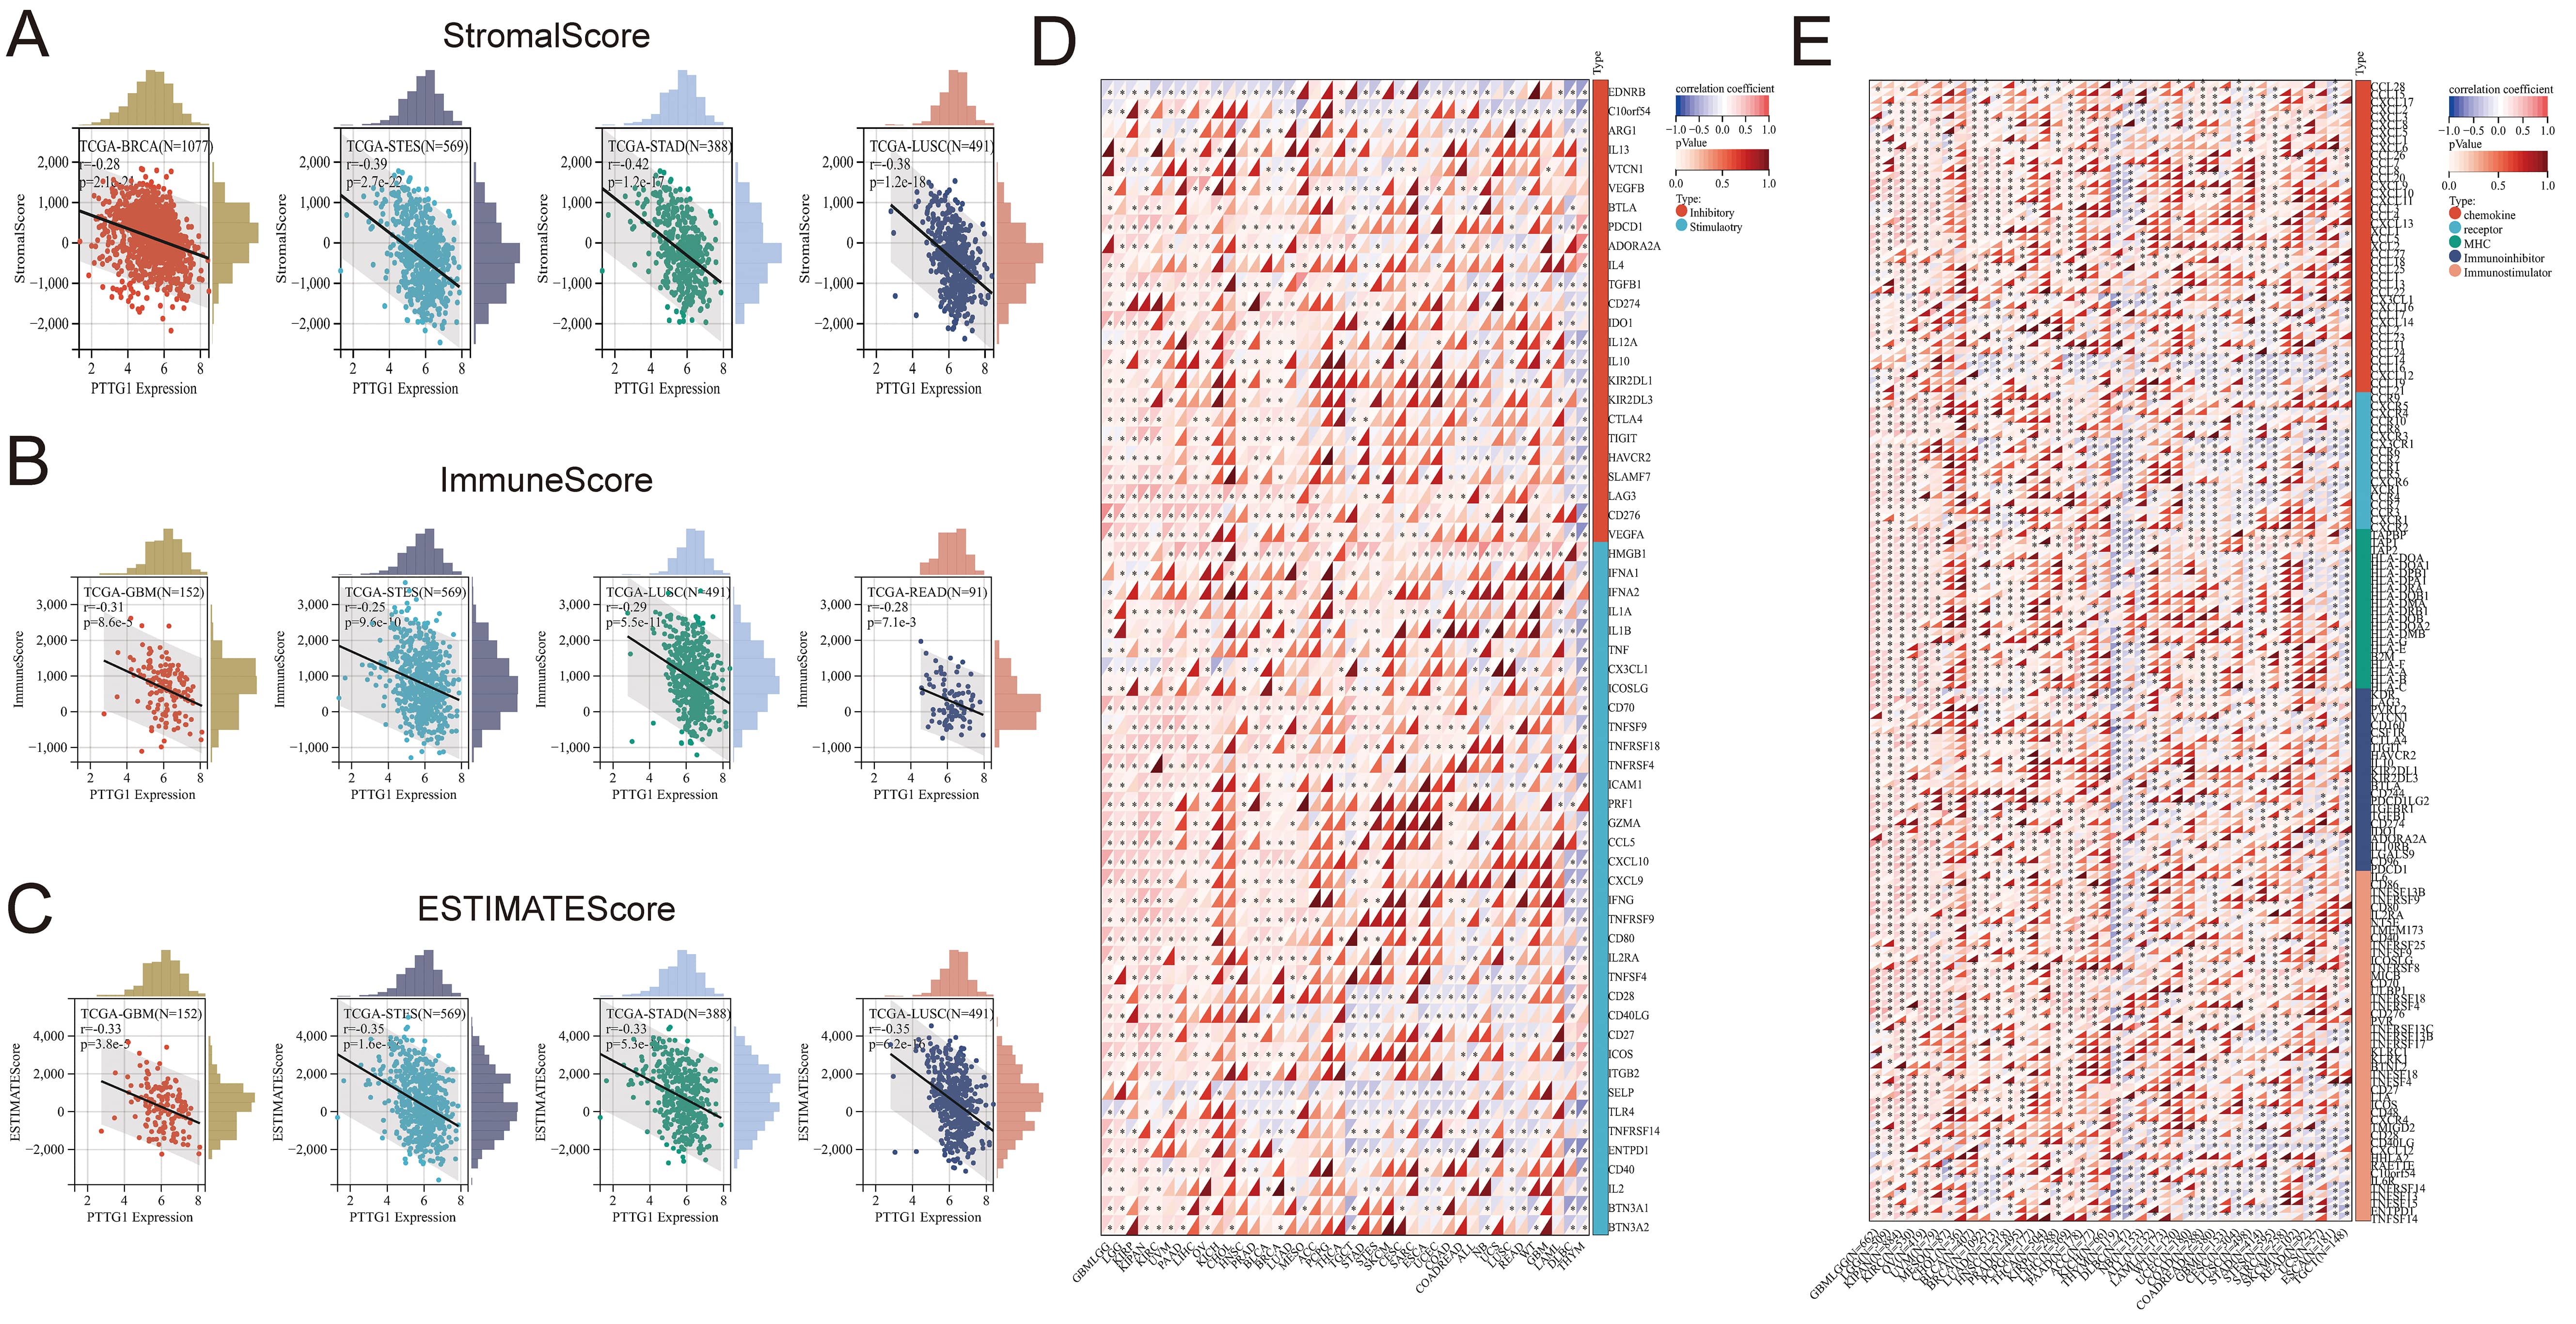 Fig. 5.
The relationships between PTTG1 expression and immune
infiltration and immune checkpoints. (A) Examining the correlation between PTTG1
expression and StromalScore. (B) Investigating the correlation between PTTG1
expression and ImmuneScore. (C) Assessing the correlation between PTTG1
expression and EstimateScore. (D) Analyzing the correlation between PTTG1
expression and genes related to immune checkpoints. (E) Exploring the correlation
between PTTG1 and genes involved in immunomodulation. Significance denoted as
*p
We evaluated tumor immune scores using four algorithms: xCELL, CIBERSORT, QUANTISEQ, and EPIC. Moreover, we explored the correlation between PTTG1 expression and immune cell levels through immune infiltration analysis. Our findings revealed a significant enhancement in immune cell infiltration in most tumors with high PTTG1 expression, which particularly impacted macrophages, Th1 cells, Th2 cells, and T cells (Fig. 6A). Combining results from the three algorithms indicated that a negative correlation existed between PTTG1 and immune cell infiltration in various malignancies, such as OV, TGCT, GBM, KIRC, and SARC, suggesting that PTTG1 was involved in shaping an immunosuppressive microenvironment in these cancers. Comparisons across algorithms showed strong positive or significant negative correlations of PTTG1 with immune cells in KIPAN, KIRC, PRAD, BRCA, LGG, and others, highlighting the intricate relationship between PTTG1 and these immune cells. Notably, PTTG1 significantly promoted immune cell infiltration in most cancers, except for CHOL, PCPG, and other specific cancer types (Fig. 6B; Supplementary Fig. 6A,B). Additionally, we examined PTTG1 expression in TME-related cells using the scRNA-seq database. Across AEL, AML, ALL, BCC, BRCA, CHOL, CRC, and Glioma, CD4Tconv, CD8T, CD8Tex, Mono/Macro, Treg or macrophages, and proliferating T cell fibroblasts exhibited the highest PTTG1 expression levels (Supplementary Fig. 7A–H). These results underscored the close association of PTTG1 with the tumor microenvironment in cancer.
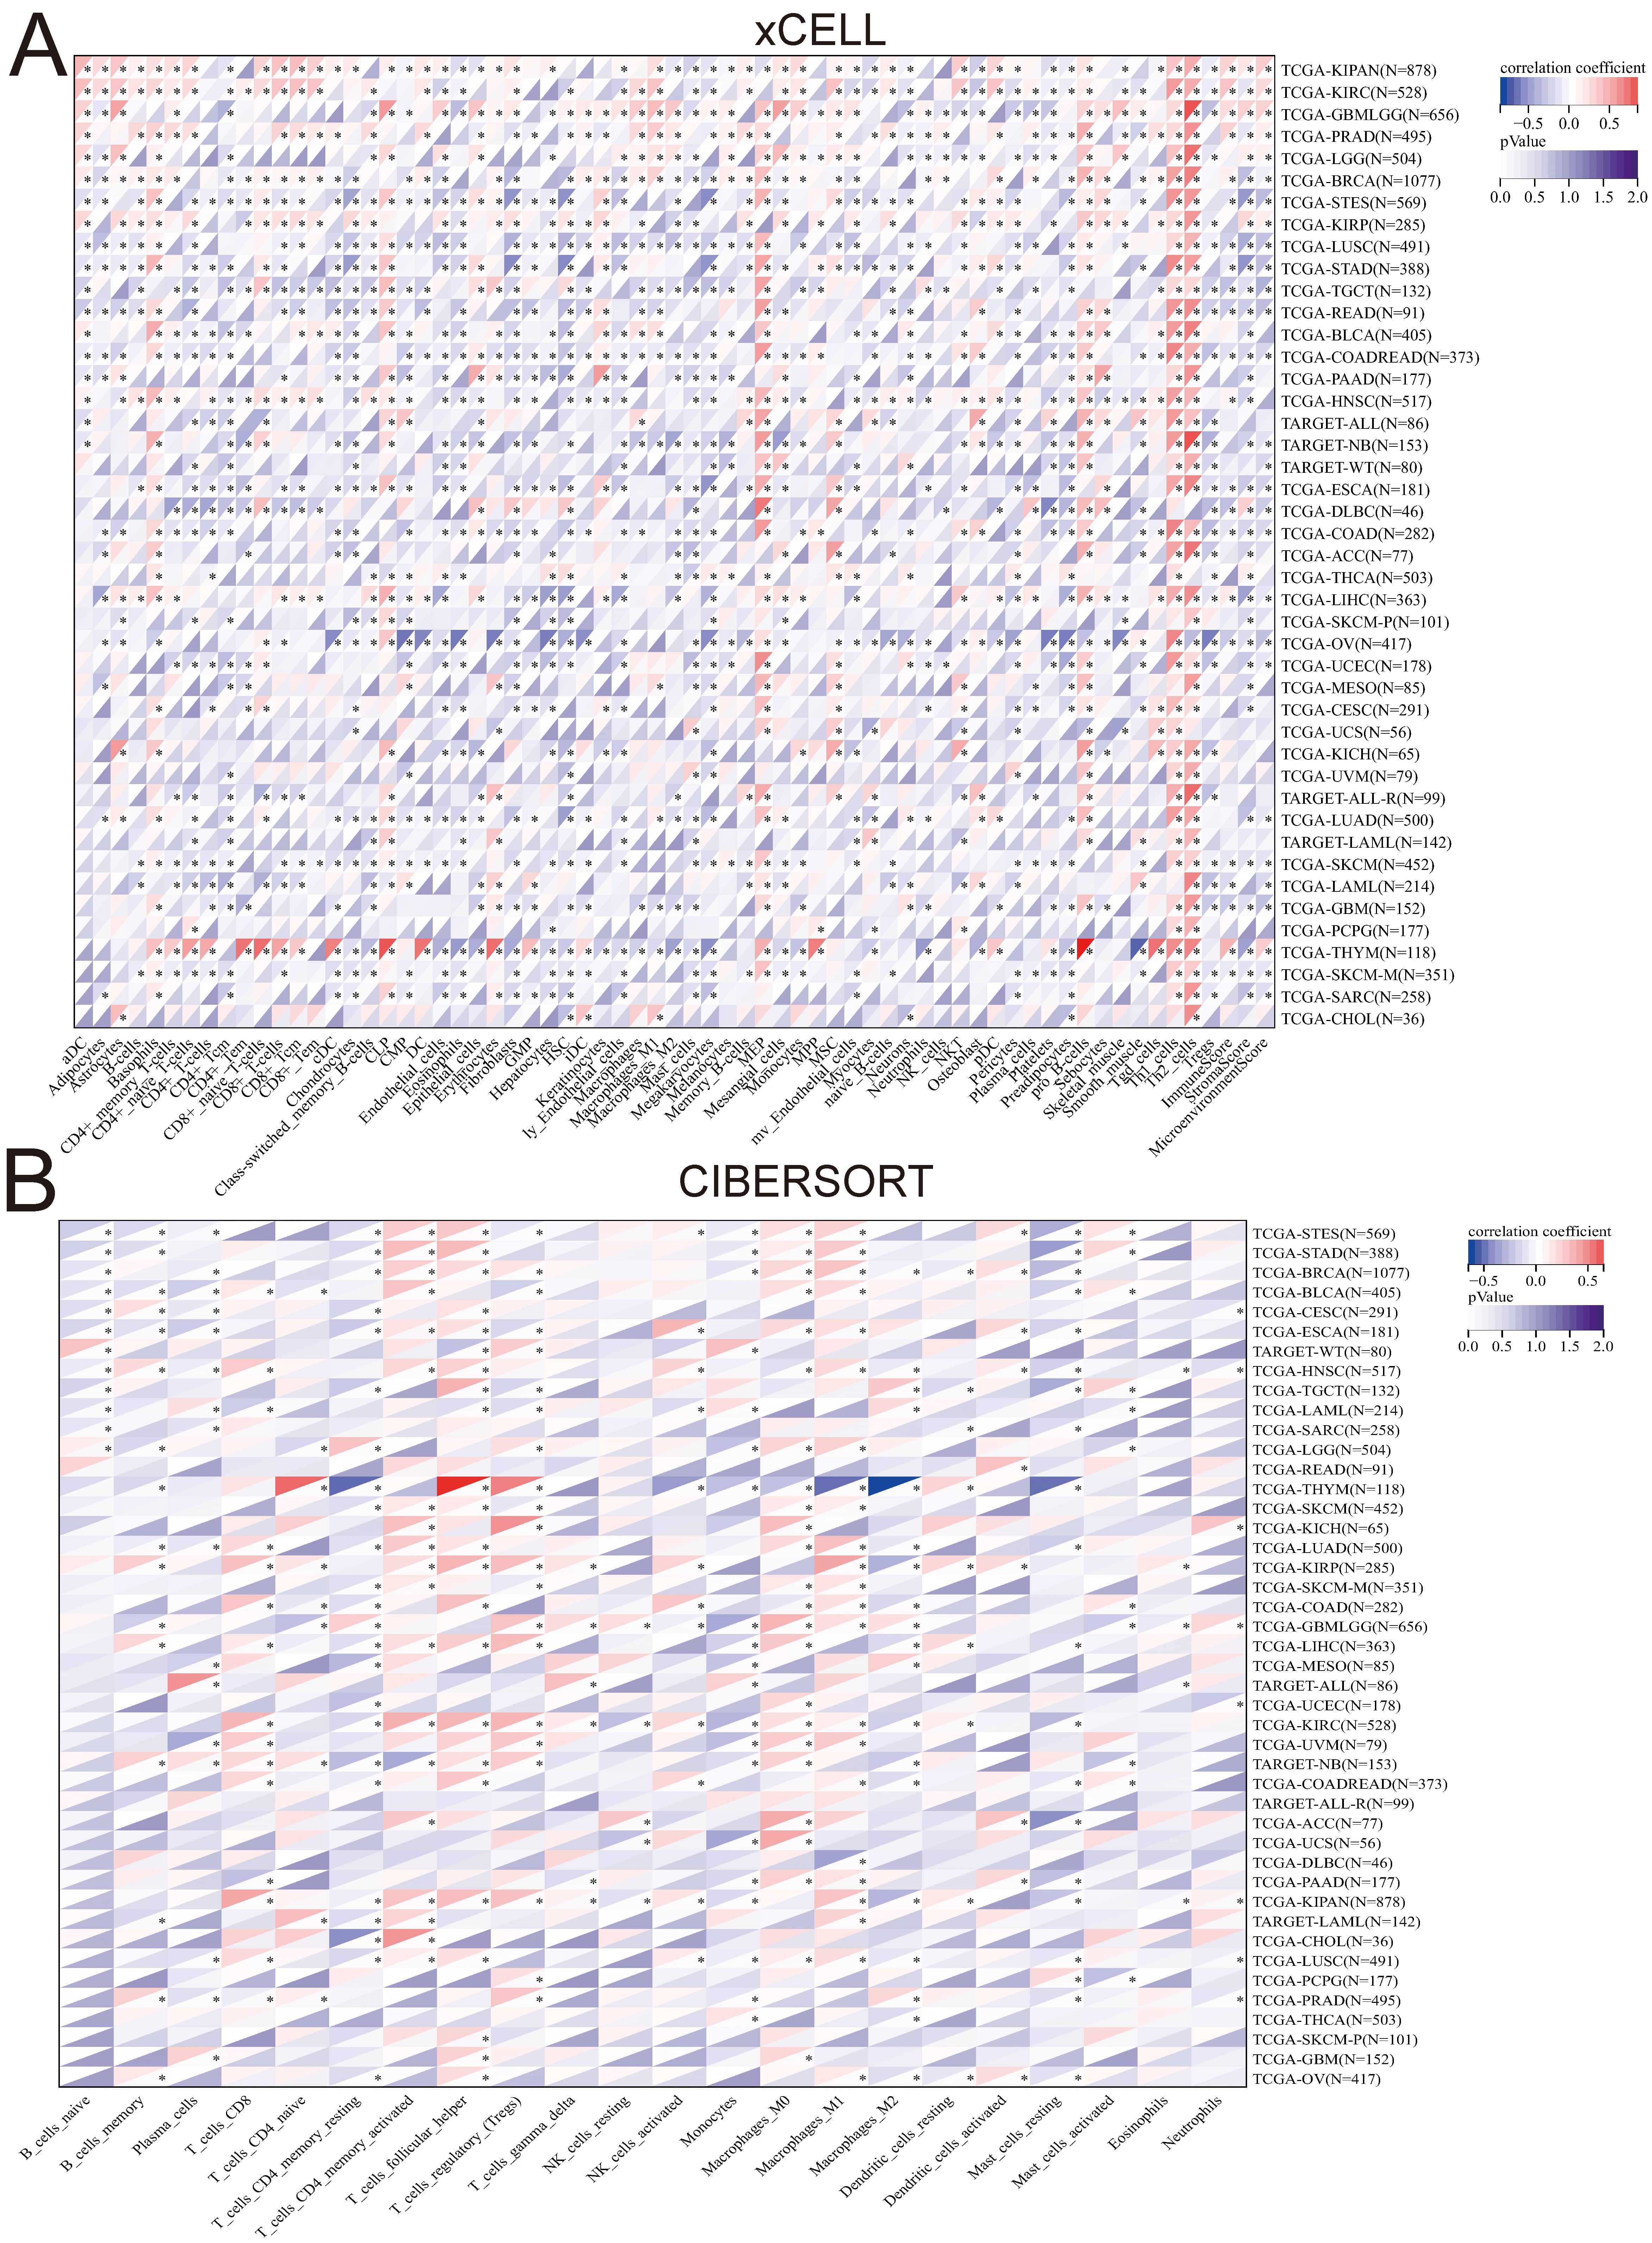 Fig. 6.
Correlation between PTTG1 and the level of
immune infiltrating Cells. (A) The association between PTTG1 and the level of
immune infiltrating cells in cancers was analyzed using xCELL algorithms. (B) The
correlation between PTTG1 and the level of immune infiltrating cells in cancers
was analyzed using CIBERSORT algorithms. Asterisks denote statistically
significant p-values calculated through Spearman’s correlation analysis
(*p
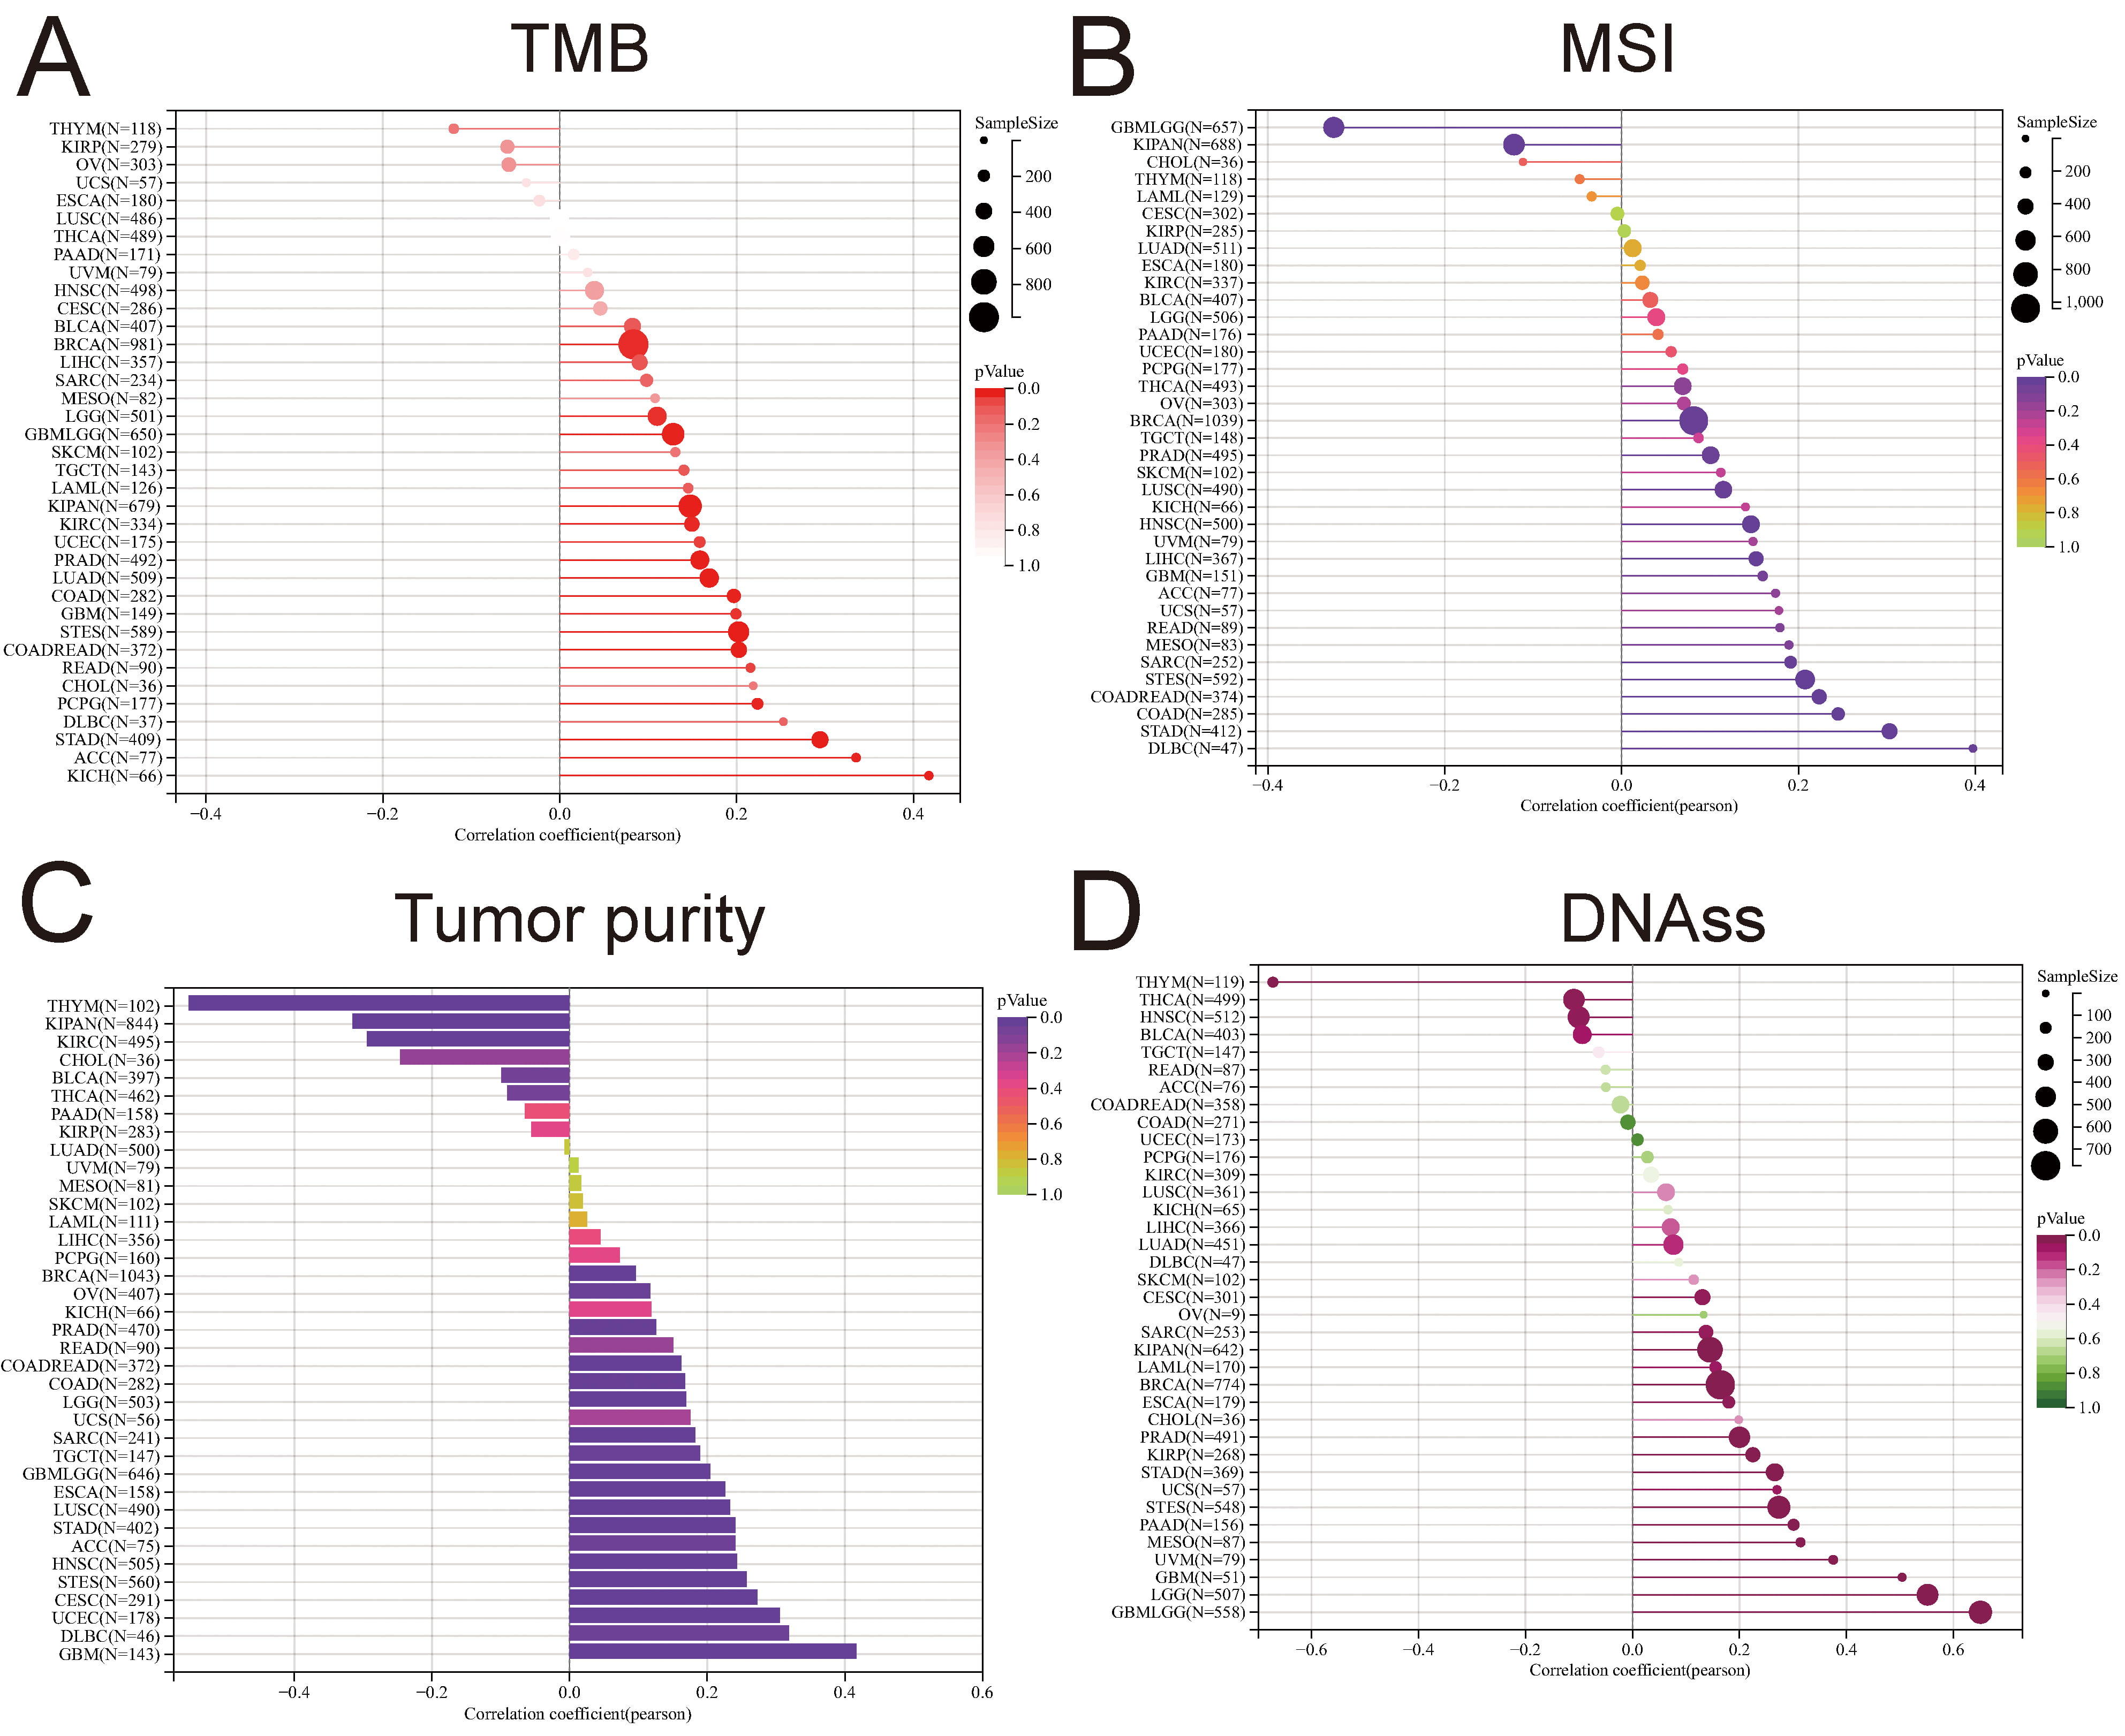
Checkpoint blockade (ICB) therapy, utilizing drugs, such as anti-programmed cell death protein 1 (PD-1), anti-programmed death-ligand 1 (PD-L1), and/or anti-cytotoxic T-lymphocyte-associated protein 4 (CTLA-4) [38, 39, 40], has demonstrated promising outcomes in a subset of cancer patients. Tumor mutational burden (TMB) has emerged as a pivotal biomarker for predicting responses to various cancers. Elevated TMB levels have been correlated with favorable responses to immune checkpoint blockade (ICB) therapy, establishing it as a crucial tool for identifying patients likely to benefit from such treatments [41]. Microsatellite instability (MSI), a diagnostic phenotype observed in gastrointestinal neoplasms, manifests as the spontaneous loss or gain of nucleotides in repetitive DNA strands [42]. This study delved into the relationship between PTTG1 expression, TMB, and MSI across diverse cancer types. In most cases, results unveiled a predominantly positive correlation between PTTG1 expression and TMB/MSI. Notably, in BRCA, GBMLGG, LGG, PRAD, LUAD, STES, and STAD, the strongest correlation surfaced between PTTG1 and TMB score (Fig. 7A). Conversely, the association between PTTG1 and MSI was more pronounced in patients with DLBC, STAD, COAD, GBMLGG, and STEC (Fig. 7B). The biology of solid tumors is significantly shaped by tumor purity, a factor that also influences the efficacy of immune checkpoint inhibitor (ICI) therapy [43], and PTTG1 displayed a significant correlation with purity, which was more prominent in THYM, KIPAN, KIRC, GBM, DLBC, UCEC and others, with some similarity to TMB and MSI (Fig. 7C). The correlation between stemness scores, drug resistance, and tumor cell proliferation during the treatment of malignant tumors has been explored. The prognostic significance of mRNA-based stem index (mRNAsi) in different cancers has been previously documented [44, 45, 46]. To delve deeper into the connection between PTTG1 expression and stemness scores across various tumors, we conducted a Pearson correlation analysis. Our findings revealed a robust correlation between PTTG1 expression and stemness scores in THYM, GBMLGG, LGG, GBM, UVM, THCA, and ssDNA (Fig. 7D).
 Fig. 7.
Prediction of treatment response to immune checkpoint inhibitors (ICIS) by PTTG1. (A) Correlation analysis examining the relationship between PTTG1 expression and tumor mutational burden (TMB). (B) Correlation analysis investigating the association between PTTG1 expression and microsatellite instability (MSI). (C) Correlation analysis assessing the connection between PTTG1 expression and tumor purity. (D) Correlation analysis of the relationship between PTTG1 expression and stemness score.
In 2015, Noll et al. [47] reported an association between PTTG1 expression, hyperproliferation, and poor prognosis in multiple myeloma. Cho-Rok et al. [48], in 2006, demonstrated that adenovirus-mediated reduction of PTTG1 expression using siRNA inhibits the growth of liver cancer cells both in vitro and in vivo. Li et al. [49] revealed in 2013 that PTTG1 promotes the migration and invasion of human non-small cell lung cancer cells. Furthermore, Yoon et al. [19], in 2012, uncovered that the PTTG1 oncogene fosters tumor malignancy by inducing epithelial–mesenchymal transition and expanding the cancer stem cell population. Additionally, PTTG1 influences cell cycle arrest in breast cancer cells, whereby its overexpression results in a higher proportion of breast cancer cells in the S phase [50]. To substantiate the role of PTTG1, we employed the neuroblastoma cell line (SK-N-SH). Additionally, we conducted experiments after validating the interference efficiency through siRNA, confirmed by qPCR and Western blot analysis (Supplementary Fig. 8A,B). The CCK-8 assay was employed to monitor cell proliferation at 24-, 48-, 72-, and 96-hours post-transfection with siPTTG1. Our findings revealed that reducing PTTG1 expression in neuroblastoma cell lines significantly decreased cell viability, suggesting that inhibiting PTTG1 expression can impede the proliferation of neuroblastoma cells (Supplementary Fig. 8C). Results from the EdU experiment demonstrated a substantial decrease in the percentage of positive signals of EdU-labeled cells when PTTG1 expression was reduced. This reduction in positive signals indicates a decrease in the DNA replication activity of tumor cells and a weakening of their cell proliferation ability (Supplementary Fig. 8D). Apoptosis analysis revealed a significant increase in the average percentage of apoptotic cells following the knockdown of the PTTG1 gene (Supplementary Fig. 8E). Collectively, our results provide additional evidence supporting the wide-ranging tumorigenic effects of PTTG1 on multiple tumor types.
Tumors pose a significant threat to human life, and despite recent advancements in identifying effective biomarkers for some cancers, there remains a lack of ideal intervention methods, leading to unsatisfactory patient prognoses. Exploring shared biomarkers across tumors holds promise for treating cancer at the molecular level. PTTG1, identified as a pituitary-derived transforming gene, plays a pivotal role in tumor proliferation and may function as a pan-oncogene in cancer development. Through pan-cancer expression analysis using the TCGA database, we validated that PTTG1 expression was significantly elevated in various cancers, excluding PCPG. Cox regression analysis and Kaplan–Meier survival curves further affirmed that elevated PTTG1 expression correlates with poor prognosis, suggesting its potential as a reliable biomarker. In five distinct tumors—GBMLGG, LGG, LIHC, KIRP, and KIPAN—PTTG1 showed significant correlations with four prognostic indicators: OS, DSS, DFS, and PFS, indicating the necessity for further mechanistic exploration. For example, Zhi et al. [51] delved into the glioma context, revealing that ECT2 regulates PTTG1 expression by influencing the stability of E2F1, thereby impacting glioma cell proliferation. This underscores the need for in-depth investigations into the internal mechanisms involving PTTG1 across various cancer types. Teveroni et al. [52] found that nuclear localization of PTTG1 promotes seminoma migration and invasion by activating MMP-2. The expression of PTTG1 exhibited variations across distinct pathological stages within the same tumor, with higher expression levels detected in the advanced stages. This observation provides additional evidence supporting the potential of PTTG1 as a biomarker.
The tumor microenvironment encompasses non-cancerous components within the tumor and the molecules they release, exerting a pivotal influence on tumor initiation, progression, and metastasis. Recent research underscores the tumor microenvironment as a potential therapeutic target for cancers [53, 54, 55, 56, 57]. Chiriva-Internati et al. [14] similarly identified abnormal PTTG1 expression in multiple myeloma plasma cells, emphasizing its high immunogenicity as a promising target for multiple myeloma immunotherapy. Nevertheless, previous studies primarily focused on specific aspects and did not comprehensively analyze other immune features associated with PTTG1. Hence, our study aimed to investigate the relationship between PTTG1 and the immune microenvironment, providing insights into the role of PTTG1 in immune cell infiltration and its correlation with the TME. In the context of pan-cancer analysis, we initially evaluated PTTG1 using three immune scores—StromalScore, ImmuneScore, and EstimateScore. Overall, the associations between PTTG1 and immune scores were predominantly negative. For instance, in GBM, this negative correlation is more pronounced in the pan-cancer context, providing insights into the significant role of PTTG1 in GBM and suggesting its potential for effective immunotherapy in GBM patients. Similar observations were made in lung squamous cell carcinoma, aligning with existing studies on PTTG1 in this cancer type. These findings imply that differences in the correlation among the three scores may elucidate variations in the distribution of immune and stromal cells in different tumors, contributing to the distinct prognostic outcomes associated with PTTG1 in diverse cancer patients. Immunotherapy, particularly immune checkpoint blockade (ICB), has revolutionized cancer treatment by focusing on genes such as PD-1 and PD-L1 [58]. Our study revealed a significant positive correlation between PTTG1 and ICI-related genes in most cancers. This suggests that PTTG1, functioning as a pan-oncogene, may intensify malignancy by upregulating the expression of specific immune checkpoint genes, facilitating tumor cells to evade immune surveillance. Consequently, targeting PTTG1 could be a promising avenue for precision medicine. Furthermore, our analysis extended to examining the correlation between PTTG1 and the infiltration of various immune cells. We observed significant correlations between PTTG1 expression levels and various immune cell types, including T cells, B cells, neutrophils, and macrophages, among others. This provides the groundwork for future investigations into the underlying mechanisms. Notably, our study uncovers that elevated PTTG1 expression is linked to diverse immune cell populations. Importantly, the degree of immune cell infiltration is known to impact the prognosis of various tumors. Furthermore, our findings highlight that PTTG1 expression can influence the function of immune cells, adding a layer of complexity to its role in the TME.
Previous research indicates that TMB, MSI, and tumor purity are all recognized factors that influence the effectiveness of immune checkpoint therapy [59, 60, 61]. We analyzed the correlation between PTTG1 and ICI therapeutic markers. The findings revealed a significant correlation in tumors, such as GBMLGG, LGG, KIRC, and KIPAN, indicating the potential for further subclassification of tumors based on their ICI therapeutic markers. These results emphasize the need for expanded clinical trials to validate the impact of PTTG1 expression levels on the prognosis of patients undergoing immunotherapy. Additionally, we explored the association between the stemness index and PTTG1, uncovering a significant link in pan-cancer scenarios, thereby suggesting that PTTG1 plays a role in influencing stemness progression. Neuroblastoma is a tumor originating from the sympathetic nervous system, which exhibits a diverse clinical course that spans from localized or spontaneous regression to widespread metastatic disease [62]. To corroborate the significance of PTTG1, we employed the neuroblastoma cell line (SK-N-SH) as a starting point and conducted an analysis, establishing PTTG1 as a potential independent prognostic factor for neuroblastoma patients. In addition, the outcomes from the EdU assay revealed a significant reduction in the percentage of positive signals within Edu-labeled cells upon the downregulation of PTTG1 expression. This decrease in positive signals implies a diminished DNA replication activity in tumor cells, weakening cell proliferation ability. These findings further underscore the pivotal role of PTTG1 in tumorigenesis.
A comprehensive multi-omics analysis indicates that PTTG1 could emerge as a novel prognostic marker for tumors and a potential therapeutic target for immune infiltration. However, further extensive experiments are warranted to validate its association with immune infiltration in the TME.
ACC, adrenocortical carcinoma; BLCA, bladder urothelial carcinoma; BRCA, breast invasive carcinoma; CESC, cervical squamous cell carcinoma and endocervical adenocarcinoma; CHOL, cholangiocarcinoma; COAD, colon adenocarcinoma; COADREAD, colon adenocarcinoma/rectum adenocarcinoma esophageal carcinoma; DLBC, lymphoid neoplasm diffuse large B-cell lymphoma; ESCA, esophageal carcinoma; FPPP, FFPE pilot-phase II; GBM, glioblastoma multiforme; GBMLGG, glioma; HNSC, head and neck squamous cell carcinoma; KICH, kidney chromophobe; KIPAN, pan-kidney cohort (KICH+KIRC+KIRP); KIRC, kidney renal clear cell carcinoma; KIRP, kidney renal papillary cell carcinoma; LAML, acute myeloid leukemia; LGG, brain lower-grade glioma; LIHC, liver hepatocellular carcinoma; LUAD, lung adenocarcinoma; LUSC, lung squamous cell carcinoma; MESO, mesothelioma; OV, ovarian serous cystadenocarcinoma; PAAD, pancreatic adenocarcinoma; PCPG, pheochromocytoma and paraganglioma; PRAD, prostate adenocarcinoma; READ, rectum adenocarcinoma; SARC, sarcoma; STAD, stomach adenocarcinoma; SKCM, skin cutaneous melanoma; STES, stomach and esophageal carcinoma; TGCT, testicular germ cell tumors; THCA, thyroid carcinoma; THYM, thymoma; UCEC, uterine corpus endometrial carcinoma; UCS, uterine carcinosarcoma; UVM, uveal melanoma; OS, osteosarcoma; ALL, acute lymphoblastic leukemia; NB, neuroblastoma; WT, high-risk Wilms tumor.
The datasets utilized in this study are accessible from various sources, including The Cancer Genome Atlas (https://portal.gdc.cancer.gov/), the PROTTER database (https://wlab.ethz.ch/protter/start/), the Human Protein Atlas (HPA) database (https://www.proteinatlas.org/), the cBioPortal website (https://www.cbioportal.org/), the UCSC database (https://xenabrowser.net/), and the GTEx expression dataset (V7.0). The original contributions of this study are presented in the article and Supplementary Material. For any additional inquiries, please contact the corresponding author.
LW initiated the study, formulated the manuscript, and conducted the analysis. XL interpreted the data, extensively reviewed the manuscript, and contributed to editorial refinements. Both authors actively participated in editing the manuscript. They have collectively reviewed and endorsed the final manuscript. Both authors have substantially contributed to the project, assuming public responsibility for specific content portions, and have committed to being accountable for the overall accuracy and integrity of the work.
Not applicable.
We sincerely appreciate the contributions of the author teams behind the open-source software utilized in this study, such as R Studio and Sangerbox. Our gratitude also extends to the providers of the R packages and online databases referenced in our research.
This research received no external funding.
The authors declare no conflict of interest.
References
Publisher’s Note: IMR Press stays neutral with regard to jurisdictional claims in published maps and institutional affiliations.