
- Academic Editor
†These authors contributed equally.
Background: Lactic acid, previously regarded only as an endpoint of glycolysis, has emerged as a major regulator of tumor invasion, growth, and the tumor microenvironment. In this study, we aimed to explore the reprogramming of lactic acid metabolism relevant to osteosarcoma (OS) microenvironment by decoding the underlying lactic acid metabolic landscape of OS cells and intercellular signaling alterations. Methods: The landscape of OS metabolism was evaluated using single-cell gene expression data, lactic acid metabolism clustering, and screening of the hub genes in lactic acid metabolism of OS samples using transcriptome data. The role of the hub gene NADH:Ubiquinone Oxidoreductase Complex Assembly Factor 6 (NDUFAF6) was validated with in vitro studies and patient experiments. Results: Single-cell RNA sequencing data validated a lactic acid metabolismhigh subcluster in OS. Further investigation of intercellular communications revealed a unique metabolic communication pattern between the lactic acid metabolismhigh subcluster and other subclusters. Next, two lactic acid metabolic reprogramming phenotypes were defined, and six lactic acid metabolism-related genes (LRGs), including the biomarker NDUFAF6, were screened in OS. In vitro studies and patient experiments confirmed that NDUFAF6 is a crucial lactic acid metabolism-associated gene in OS. Conclusions: The patterns of lactic acid metabolism in OS suggested metabolic reprogramming phenotypes relevant to the tumor microenvironment (TME) and identified NDUFAF6 as an LRG prognostic biomarker.
Osteosarcoma (OS) is one of the most common malignant bone tumor worldwide [1]. Notably, OS is characterized by the presence of transformed osteoblasts that produce poorly differentiated bones and osteoids. The pathology of OS has a high degree of heterogeneity, and different histological types of OS exhibit distinct biological and molecular characteristics [2]. The pathogenesis of OS has not been clearly clarified; however, multiple genetic and environmental risk factors, such as age, radiation, and gene mutations, have been found to be associated with osteosarcomagenesis and tumor progression [3]. OS exhibits a high propensity for local invasion and distant metastasis (most commonly in the lungs), as well as recurrence. The 5-year survival rate of OS has reached 70% in the nonmetastatic stage since the introduction of chemotherapy [4]. However, the overall survival rate among patients with metastasis remains at approximately 20% and has not improved over the past fourty years [5, 6]. Therefore, a better understanding of the molecular mechanisms uncovering OS progression is critical for the development of customized treatment strategies.
Metabolic reprogramming of tumor cells in response to stress facilitates tumor progression, and the inhibition of metabolic reprogramming of tumor cells has been shown to reduce cell proliferation and invasion [7]. Tumor metabolic reprogramming dynamically changes during cancer progression, participates in the reprogramming of the tumor microenvironment, and leads to the metabolic reprogramming of immune cells in the microenvironment [8]. For example, the glycolytic conversion (Warburg effect) of tumor cells to the regulatory adaptation of lactic acid metabolism contributes to the epithelial–mesenchymal transformation of tumor cells and activation of T cells. It is also regulated by multiple factors in the microenvironment, including cytokines [9, 10, 11]. Therefore, it is necessary to map tumor metabolic reprogramming from the perspective of tumor microenvironment.
Tumors exhibit high metabolic heterogeneity [12]. However, the interaction between metabolic phenotypes and the tumor microenvironment is not comprehensively understood. Notably, it has not yet been determined whether the heterogeneity of tumor metabolism can be used to classify OS. Single-cell transcriptomics provides a platform for exploring the cellular heterogeneity of metabolism and characteristics of the microenvironment. The construction of intercellular communication features enables systematic elucidation of the regulatory mechanisms of metabolic reprogramming in the tumor microenvironment. In this study, the landscape of lactic acid metabolic communication in OS was revealed and hub genes involved in this biological process were screened.
To research the single-cell level metabolism features of and their communications patterns, the single cell RNA (scRNA) sequencing datasets from the Gene Expression Omnibus database (https://www.ncbi.nlm.nih.gov/geo/query/acc.cgi?acc=GSE152048) were integrated. OS transcriptome sequencing data with updated clinical data were downloaded from The Cancer Genome Atlas (TARGETs) (https://ocg.cancer.gov/programs/target) and the GEO database (https://www.ncbi.nlm.nih.gov/gds/?term=GSE16088).
The scran R package (version 4.3) was utilized for normalization, and standard log-normalization was conducted on multiple scRNA datasets to identify variable features in each individual [13, 14]. Anchors between datasets were determined using the FindIntegrationAnchors (Seurat v5) function and returned as Seurat objects for downstream analysis. The subtypes of OS and immune cells were individually identified using SingleR (version 3.1.7) [15]. The Monocle2 (version 2.4.0) algorithm was used to construct a single-cell pseudo-time trajectory and identify the expression of genes that changed as the cells underwent differentiation. The interaction between different OS subclusters was investigated using NicheNet (version 1.0) [16], which utilizes an incident ligand-based method to identify ligand activity in receiving cells.
We performed a consensus clustering algorithm for the unsupervised classification of OS samples using the ConsensusClusterPlus R package (v1.50.0) based on LAMGs [17]. K-means (km) cluster method was performed with repeated iterations of 1000 to ensure dependability, and the Gene Set Variation Analysis (GSVA) package (v1.34.0) [18] was used to illustrate the differential biological functions among the two clusters. Single-sample gene set enrichment analysis (ssGSEA) was used to elucidate the infiltration of immune cells and different subclusters of OS in each sample.
Multiple machine learning algorithms, including the random forest (RF) and
support vector machine (SVM)-recursive feature elimination (RFE), were used to
construct prediction signatures and screen candidate diagnostic genes. The
“randomForest” R package (version 4.7-1.1) were used to further screen genes,
the RF screens gene features based on Gini coefficient [19]. SVM-RFE is a support
vector machine that uses a backward sequential selection algorithm. It ranks each
feature by its score and removes the feature with the lowest score until the
required number of features are screened. Weighted gene co-expression network
analysis (WGCNA) was subsequently performed on the OS cohort A data using the
corresponding R package to identify the modules associated with interesting
features [20], and a topological overlap matrix (TOM) was first obtained using
the adjacency matrix. Next, genes were split into various gene modules, outliers
were removed by clustering analysis, and the optimal value of the soft threshold
The 143B human OS cell line were required and were cultured as previously
described [21]. The 143 cell line was validated by STR profiling and tested
negative for mycoplasma. Cells were all cultured in a humidified incubator at 37
°C and 5% CO
143B cells (1
The Transwell system was applied for the cell invasion experiment. 143B cells were seeded into the upper chamber with extracellular matrix (Cat. No: 354243, BD Biosciences, San Jose, CA, USA) coated. The cells trapped the filter were fixed and stained with crystal violet solution after incubation. The cells were photographed using a phase-contrast microscope (Cat. No: CX43, Olympus, Tokyo, Japan), and the cell numbers were counted.
Seahorse XF24 Analyzer (Cat. No: XF24, Agilent Technologies, Santa Clara, CA, USA) were used to assess the metabolic status of the cells. To measure the extracellular acidification rate (ECAR), the Mito Stress Test kit (Cat. No: 103010-100 Agilent Technologies, #103,015, Santa Clara, CA, USA) was applied after siRNA treatment. After enableing the cells to acclimate to the temperature and pH equilibration, the cells were loaded into the XF24 Analyzer and measurements from T = 0 to T = 100 min were recorded. The injection procedure was as follows: first, oligomycin (Cat. No: 103010-100 Agilent Technologies, #103,015, Santa Clara, CA, USA) at the concentration of 1 µM; next, carbonyl cyanide m-chlorophenylhydrazone (Cat. No: 103010-100 Agilent Technologies, #103,015, Santa Clara, CA, USA) at the concentration of 1 µM; then, rotenone (Cat. No: 103010-100 Agilent Technologies, #103,015, Santa Clara, CA, USA) and antimycin A (Cat. No: 103010-100 Agilent Technologies, #103,015, Santa Clara, CA, USA) at the concentration of 0.5 µM.
OS tissues were all surgically resected from 12 patients at Honghui Hospital between January 2023 and March 2023. The inclusion criteria were as follow: a pathological diagnosis of OS and tumor resection, while the exclusion criteria were as follow: metastasis, recurrence, incomplete clinical data, or an unknown diagnosis. Adjacent tissues (n = 12) were collected from the same patients. Informed consent was obtained from all patients in this study. This study was approved by the Ethics Committee of Honghui Hospital (Approval Number: 202303051) and was conducted with the Declaration of Helsinki in accordance.
Total RNA was isolated from 143B cells and human tissues by applying a UNIQ-10
column RNA Extraction Kit (Cat. No: B511321-0020, Sangon Biotech, China). Reverse
transcription was performed by the RR047 cDNA Synthesis Kit (Cat. No: K1621,
TaKaRa, China). The qRT-PCR was conducted on a 7500 Real-Time PCR System (Cat.
No:4362143 Applied Biosystems, Foster City, CA, USA) using 2
Surgical specimens of tissues were cut to the thickness of 4 µm and prepared on slides. Immunohistochemistry (IHC) were conducted to evaluate NDUFAF6 expression as follows: Dewaxing and endogenous horseradish peroxidase was inactivated, then the tissues were subjected to antigen repair. The tissue was then closed with Blocking Buffer contained phosphate-buffered solution. then a rabbit anti-NDUFAF6 antibody (ab150975, abcam, 152 Grove Street, Waltham, MA 02453, USA) was diluted and incubated. Finally, the tissues were washed and were murined with secondary antibody HRP (ab97051, abcam,152 Grove Street, Waltham, MA 02453, USA).
To reveal the diversity of cellular components in OS, analysis of OS scRNA-seq results was conducted. Single-cell transcriptome data were firstly clustered into 20 major clusters with the resolution of 0.5; combining with the chromosomal copy number variation (CNV) results that were calculated by inferCNV, malignant cells were identified [22] (Fig. 1A), and seven main segregated cell clusters, including cancer-associated fibroblasts (CAFs), dendritic cells, endothelial cells, malignant cells, tumor-associated macrophages (TAMs), T cells, and regulatory T cells (Tregs), were identified (Fig. 1B) using unbiased clustering of cells by using t-distributed stochastic neighbor embedding (t-SNE) analyses; the cell type of clusters were defined by singleR [15]. Next, we scanned the seven major metabolism processes that reportedly to play vital roles in the tumor progression, including lactate metabolism (Fig. 1C) [23], which refers to the metabolic process that osteosarcoma use lactate as their nutritional source and obtain energy through the tricarboxylic acid cycleas, fatty acid metabolism (Fig. 1D) [24], retinoic acid metabolism (Fig. 1E) [25], cholesterol metabolism (Fig. 1F) [26], butyrate metabolism (Fig. 1G) [27], aspartate metabolism (Fig. 1H) [28], and glycolysis (Fig. 1I) [29], which refers to the metabolism process thatproduce lactic acid through glycolysis metabolism , by evaluating the overall expression levels of related gene sets in each cell. The expression levels of genes that related to lactate, fatty acid, glycerolipid, butyrate, and glycolysis metabolism were relatively high; however, the expression levels of cholesterol metabolism-related genes were relatively low. Subsequently, we focused on non-malignant stromal and immune cells in the OS microenvironment and found that the level of lactate metabolism was relatively low in T cells and dendritic cells, level of fatty acid metabolism was relatively high in dendritic cells, level of retinoic acid metabolism was relatively high in dendritic cells, level of cholesterol metabolism was relatively high in Tregs and TAMs, level of butyrate metabolism was relatively high in dendritic cells, level of aspartic acid metabolism was relatively high in Tregs, and level of glycolytic metabolism was relatively high in TAMs and Tregs.
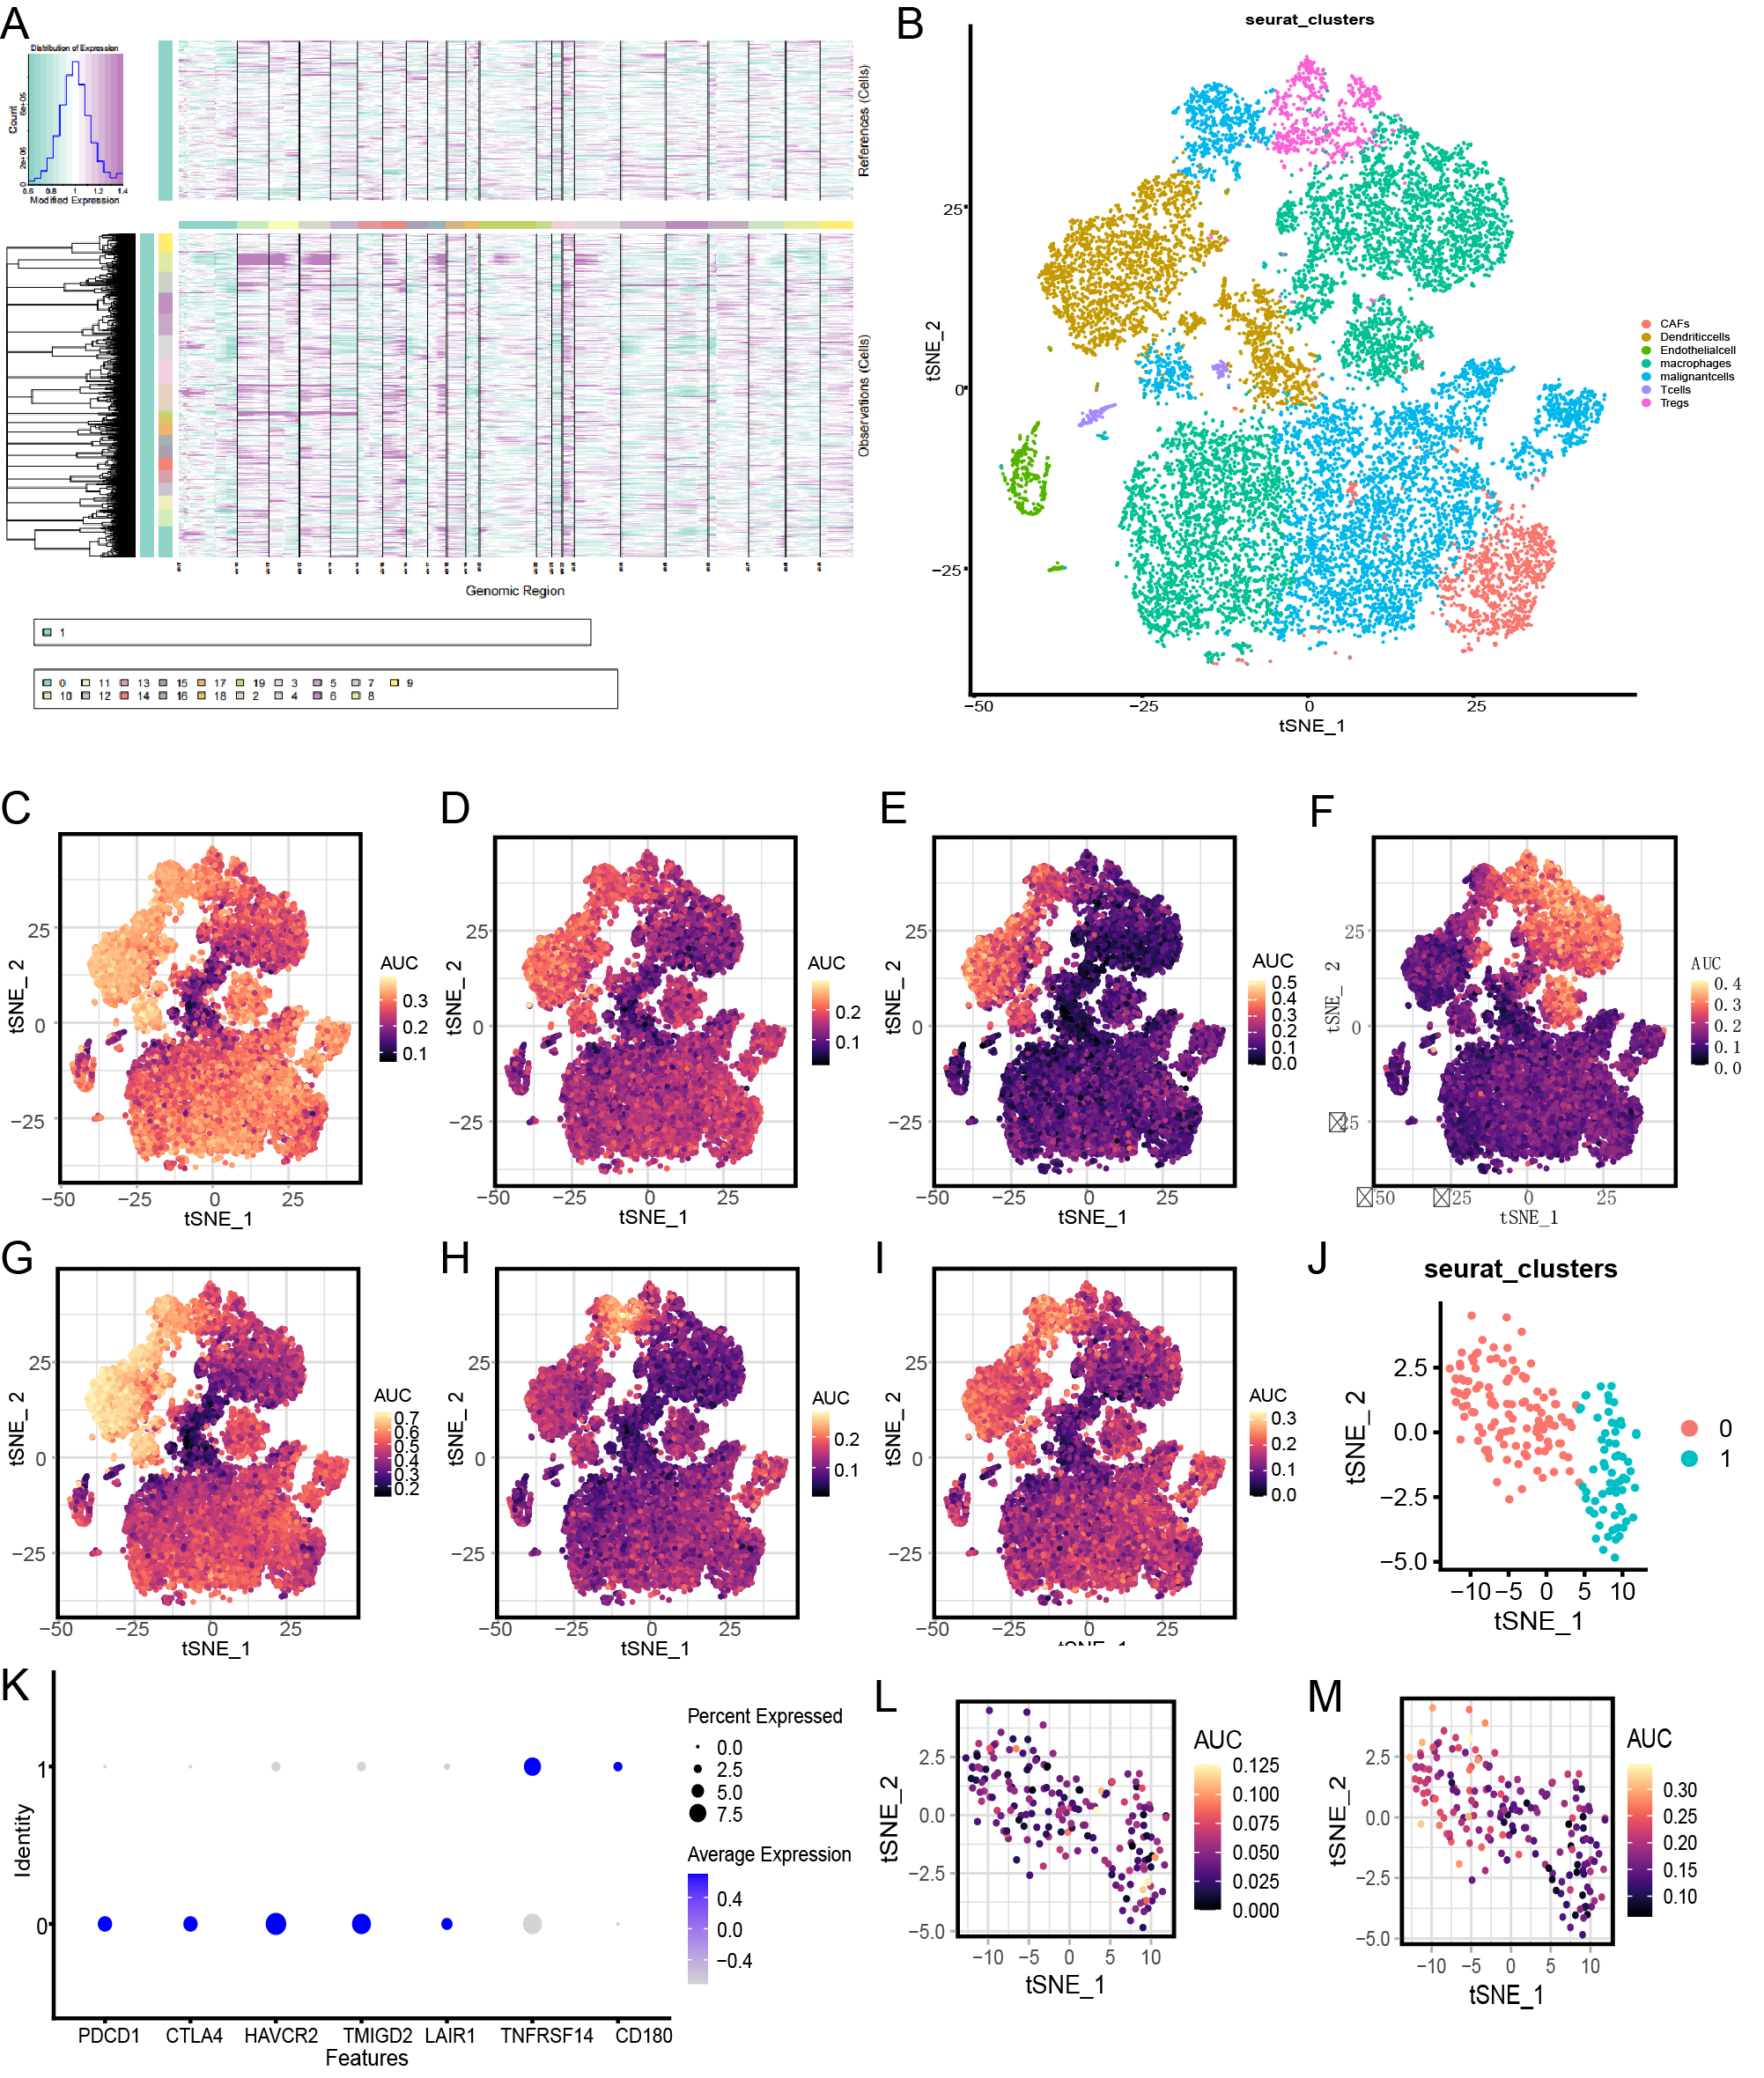 Fig. 1.
Osteosarcoma tumor microenvironment (TME) and metabolism analysis. (A) The hierarchical heatmap shows copy number variation (CNV) from the osteosarcoma sample. (B) t-distributed stochastic neighbor embedding (t-SNE) plot shows the six cell clusters from the osteosarcoma sample. (C) t-SNE plot shows the lactate metabolism from the osteosarcoma sample. (D) t-SNE plot shows the fatty acid metabolism from the osteosarcoma sample. (E) t-SNE plot shows the retinoic acid metabolism from the osteosarcoma sample. (F) t-SNE plot shows the cholesterol metabolism from the osteosarcoma sample. (G) t-SNE plot shows the butyrate metabolism from the osteosarcoma sample. (H) t-SNE plot shows the aspartic metabolism from the osteosarcoma sample. (I) t-SNE plot shows the glycolysis metabolism from the osteosarcoma sample. (J) t-SNE plot shows the two T cell subclusters. (K) Dot plots showing the T cell signature gene expression across the two T cell subclusters. (L) t-SNE plot shows the lactic acid metabolism across the two T cell subclusters. (M) t-SNE plot shows the glycolysis metabolism across the two T cell subclusters. AUC, area under the curve; CAFs, cancer-associated fibroblasts.
Based on the previously reported key role of metabolism in the functional activation of T cells and Tregs [30, 31], we further subdivided these two cell types. The results showed that T cells could be divided into two subclusters (Fig. 1J). As shown in Fig. 1K, cluster 0 T cells were defined as depletion T cells, according to the high expression levels of T cell depletion-related markers, including programmed cell death protein 1 (PDCD1), cytotoxic T-lymphocyte-associated protein 4 (CTLA4), and hepatitis A Virus Cellular Receptor 2 (HAVCR2) [32], and cluster 1 T cells were recognized as functional T cells based on the high expression level of TNF Receptor Superfamily Member 14 (TNFRSF14), which is known as a marker of antigen-presenting cell (APC) T cell activation [33]. Next, combined with previous description of the T cell metabolism features in TME [34], the key metabolic characteristics of these two T cell subsets were observed, including lactic acid, glycolysis, and hypoxia metabolism [35]. The level of lactic acid metabolism was relatively low in depletion T cell and functional T cell clusters (Fig. 1L). The glycolysis metabolism level was relatively high in depletion T cells and relatively low in functional T cells (Fig. 1M). The hypoxia metabolism level of was relatively high in depletion T cell and functional T cell clusters (Fig. 2A). Tregs also were divided into two subclusters (Fig. 2B). As shown in Fig. 1, cluster 0 Treg cells were defined as Interleukin 10 (IL10) +Tregs, according to the highly expression of IL10. Cluster 0 Treg cells were defined as CD52 +Tregs (Fig. 2C), according to the high expression level of CD52. The level of lactic acid metabolism was relatively high (Fig. 2D), level of glycolysis metabolism was relatively low (Fig. 2E), and level of hypoxia metabolism had a high degree of heterogeneity in Tregs (Fig. 2F).
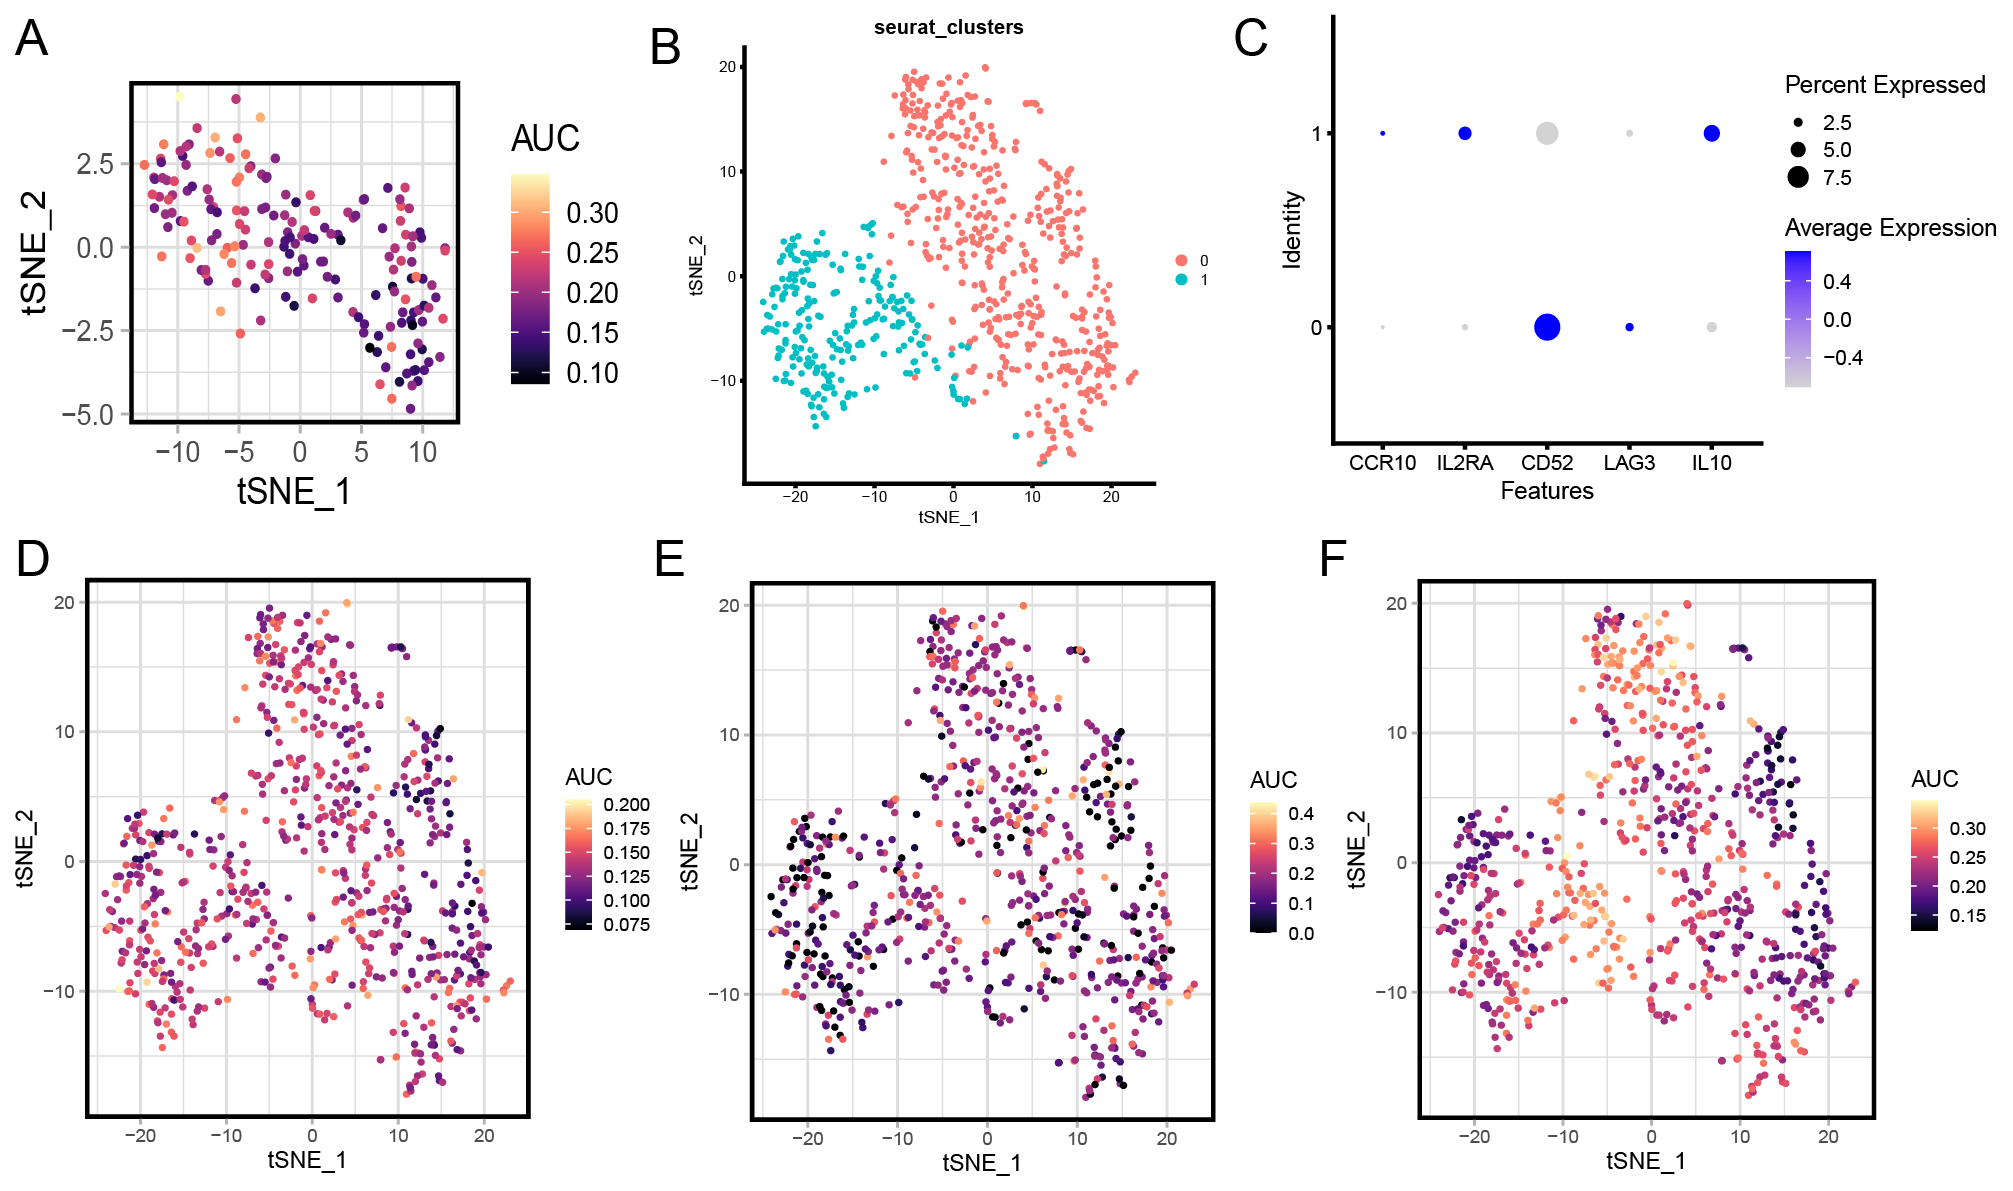 Fig. 2.
Metabolism analysis of regulatory T cells (Tregs). (A) t-SNE plot shows the hypoxia metabolism across the two T cell subclusters. (B) t-SNE plot shows the two Treg cell subclusters. (C) Dot plots showing the Treg cell signature gene expression across the two T cell subclusters. (D) t-SNE plot shows the lactic acid metabolism across the two Treg cell subclusters. (E) t-SNE plot shows the glycolysis metabolism across the two Treg cell subclusters. (F) t-SNE plot shows the hypoxia metabolism across the two Treg cell subclusters.
Previous studies have shown that lactate regulates biological functions of tumor cells and multiple types of immune cells in the tumor microenvironment through histone lactylation [36]. Therefore, we also examined the expression profiles of histone lactylation-related regulatory genes, including Histone Deacetylase 1 (HDAC1) and Histone Deacetylase 3 (HDAC3) [37]. The results showed that HDAC1 expression level was relatively high in endothelial cells, whereas HDAC3 expression level was relatively high in Tregs (Fig. 3A). To further observe the heterogeneity of lactic acid metabolism in tumor cells, we first extracted tumor cells and divided them into five subclusters (Fig. 3B), combined with the expression of cell markers and singleR results (Fig. 3C), OS cluster 1 was defined as TIMP3+MMP13+ cluster, OS cluster 2 was defined as MMP9+HMGA1+ cluster, OS cluster 3 was defined as BIRC5+STMN1+ cluster, OS cluster 4 was defined as SPARCL1+NDUFA4L2+ cluster, and OS cluster 5 was defined as CTSK+CD68+ cluster. Additionally, the results of pseudo-differentiation analysis showed that OS cluster 1 was a relatively low differentiation cluster. The OS cluster 2 was defined as a relatively highly differentiated cluster (Fig. 3D,E). The overall evaluation results for lactic acid-related genes showed that in cluster 2 the overall level was higher, whereas in cluster 1, the overall level was low (Fig. 3F). Further, a pseudo-differentiation heatmap showed that multiple lactic acid metabolism-related genes, including PER2, BCKDHA, ETHE1, HMGCL, MPC1, LYRM4, PNKD, and SOD1, were highly expressed at the end stages of differentiation, while genes including SCU, NDUFS8, CHCHD10, CLPB, NDUFA10, and NDUFAF4 were highly expressed at the early stage of differentiation (Fig. 3G). In addition, the distribution of lactic acid metabolism-related genes on the chromosomes was observed. The results showed that these genes were evenly expressed on each chromosome, and relatively more expressed on chromosomes of 1, 2, and 12 (Fig. 3H). Subsequently, we conducted an intercellular communication analysis targeting lactate metabolism-related genes. The results showed that the top 20 most relevant cytokines targeted lactate metabolism-related genes in cluster 2 OS cells (Fig. 3I). Interestingly, MIF was universally highly correlated with all the target genes (Fig. 3J). In addition, the dot plot results also showed a higher expression level of MIF gene in OS cluster 2; the results also show that the expression level of TIMP1 was higher in OS cluster 1, and that the expression levels of ITGAM, CXCL2, PTDSS1, PTPRC, and MIF were also higher in OS cluster 2 (Fig. 3K).
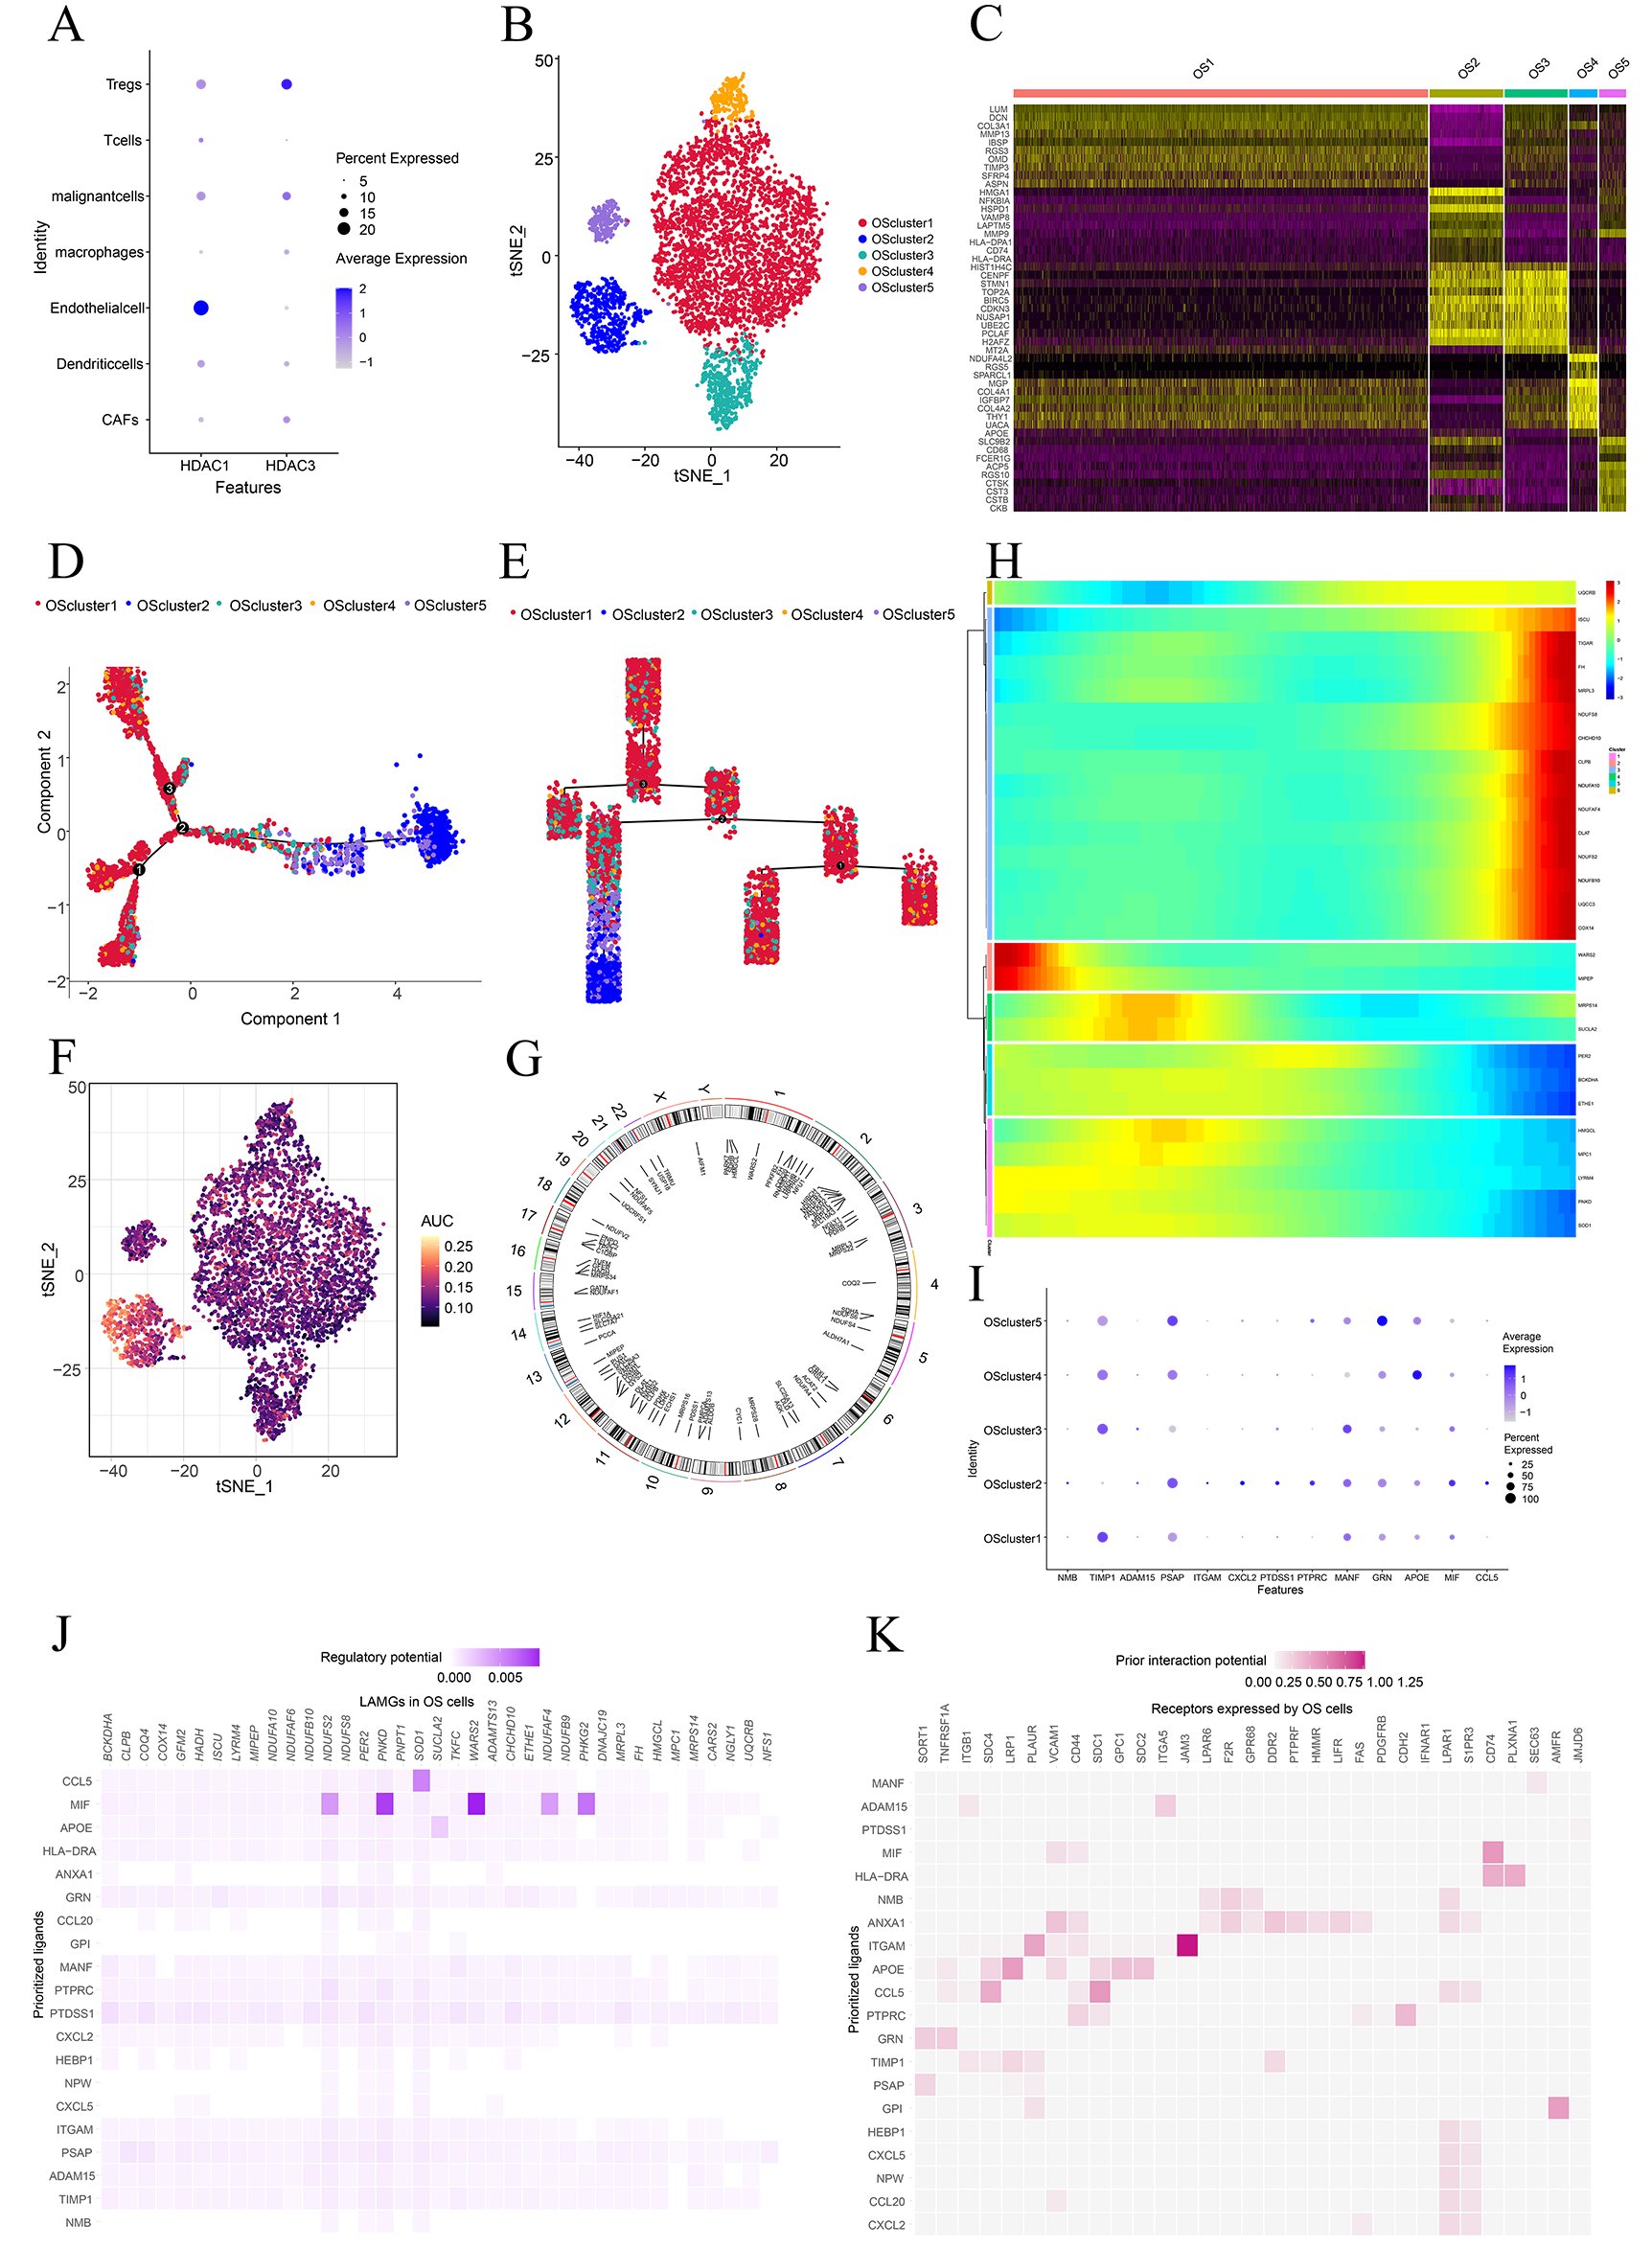 Fig. 3.
Lactic acid metabolism characteristics of osteosarcoma (OS) malignant cell subclusters. (A) Dot plots shows the lactylation-related regulatory genes expressed across the osteosarcoma sample. The size of dots indicates the proportion of cells expressing the marker, the spectrum of color represents the mean expression levels of the markers. (B) t-SNE plot shows the five OS subclusters. (C,D) Cell trajectory plot shows the five OS subclusters. (E) Heatmap shows the top differentially expressed genes in OS subclusters. (F) t-SNE plot shows the Lactate Metaibolism Genes (LAMGs) from the osteosarcoma sample. (G) Pseudo-temporal differentiation locus of the LAMG expression in OS clusters. (H) Chromosome locus analysis of genes in LAMGs. (I) Heatmap of ligand–target LAMG interactions in the niche cell-OS cluster 2 cell communication. (J) Top ligand–receptor interaction pairs in the niche cell-OS cluster 2 cell communication. (K) Dot plots show the LAMG interaction-related genes expressed across the osteosarcoma sample.
Based on the high heterogeneity in lactate metabolism among different cell clusters at the single-cell level, we further used lactate metabolism-related genes for the unsupervised molecular typing of OS transcriptome samples and divided them into three subtypes, two of which were determined because a group with a small sample size was eliminated (Fig. 4A–C). We further verified the results of the single cell analysis by analyzing the infiltration of various cell types in transcriptome samples by firstly extracting markers of various cell subtypes including OS cluster 1, OS cluster 5, Tregs, and T cells (Fig. 4D–J). Functional enrichment result of OS cluster included ribosomal large subunit, ribosomal RNA (rRNA) metabolic process, rRNA processing, cellular respiration, oxidative phosphorylation, cytoplasmic translation, aerobic respiration, ribosome biogenesis, ribonucleoprotein complex, Adenosine triphosphate (ATP) metabolic process, mitochondrial matrix, large ribosomal subunit, collagen-containing, extracellular matrix, inner mitochondrial membrane, protein complex, cell-substrate junction, focal adhesion, ribosome, mitochondrial inner membrane, electron transfer activity, ribonucleoprotein complex binding, oxidoreduction-driven active, transmembrane transporter activity, proton transmembrane transporter activity, cadherin binding, unfolded protein binding, and collagen binding. These marker genes were utilized for ssGSEA to further compare the tissue content of various cell types in different molecular subtypes of OS samples, and the results show that cluster 2 exhibited significantly higher proportions of OS cluster 4 cells, OS cluster 5 cells, OS cluster 2 cells, and T cells, whereas the abundance of OS cluster 3 cells and Tregs was relatively greater in cluster 1 (Fig. 4K). To further explore the molecular characteristics between clusters, we comprehensively assessed the differences in the immune microenvironment by conducting an immune infiltration analysis between lactate metabolism clusters 1 and 2. Cluster 2 exhibited significantly higher proportions of multiple types of immune cells, including activated dendritic cells, eosinophils, gamma delta T cells, immature B cells, myeloid-derived suppressor cells (MDSCs), natural killer cells (NK cells), plasmacytoid dendritic cells, regulatory T cells, T follicular helper cells, and type II T helper cells (Fig. 4L). Thus, we defined cluster 2 as immune-hot cluster and cluster 1 as immune-cold cluster. GSVA was consistently used to further explore the functional differences associated with cluster-specific differentially expressed genes (DEGs) between the two clusters. Furthermore, the GSVA enrichment results showed significant functional differences between the two groups. Specifically, the GSVA-GO results showed that differentially enriched functions included messenger RNA (mRNA) 3-end processing, ruffle membrane, positive regulation of organelle organization, regulation of supramolecular fiber organization, negative regulation of cytoskeleton organization, phospholipid translocating ATPase complex, structural constituent of nuclear pore, nuclear export signal receptor activity, positive regulation of RNA splicing, regulation of clathrin-dependent endocytosis, regulation of receptor-mediated endocytosis, and regulation of endocytosis (Fig. 4M). The GSVA-KEGG results showed that the differentially enriched functions included nitrogen metabolism, Fc gamma R-mediated phagocytosis, Erbb signaling pathway, adherens junction, small cell lung cancer, inositol phosphate metabolism, endocytosis, sulfur metabolism, histidine metabolism, primary bile acid biosynthesis, biosynthesis of unsaturated fatty acids, and oxidative phosphorylation (Fig. 4N).
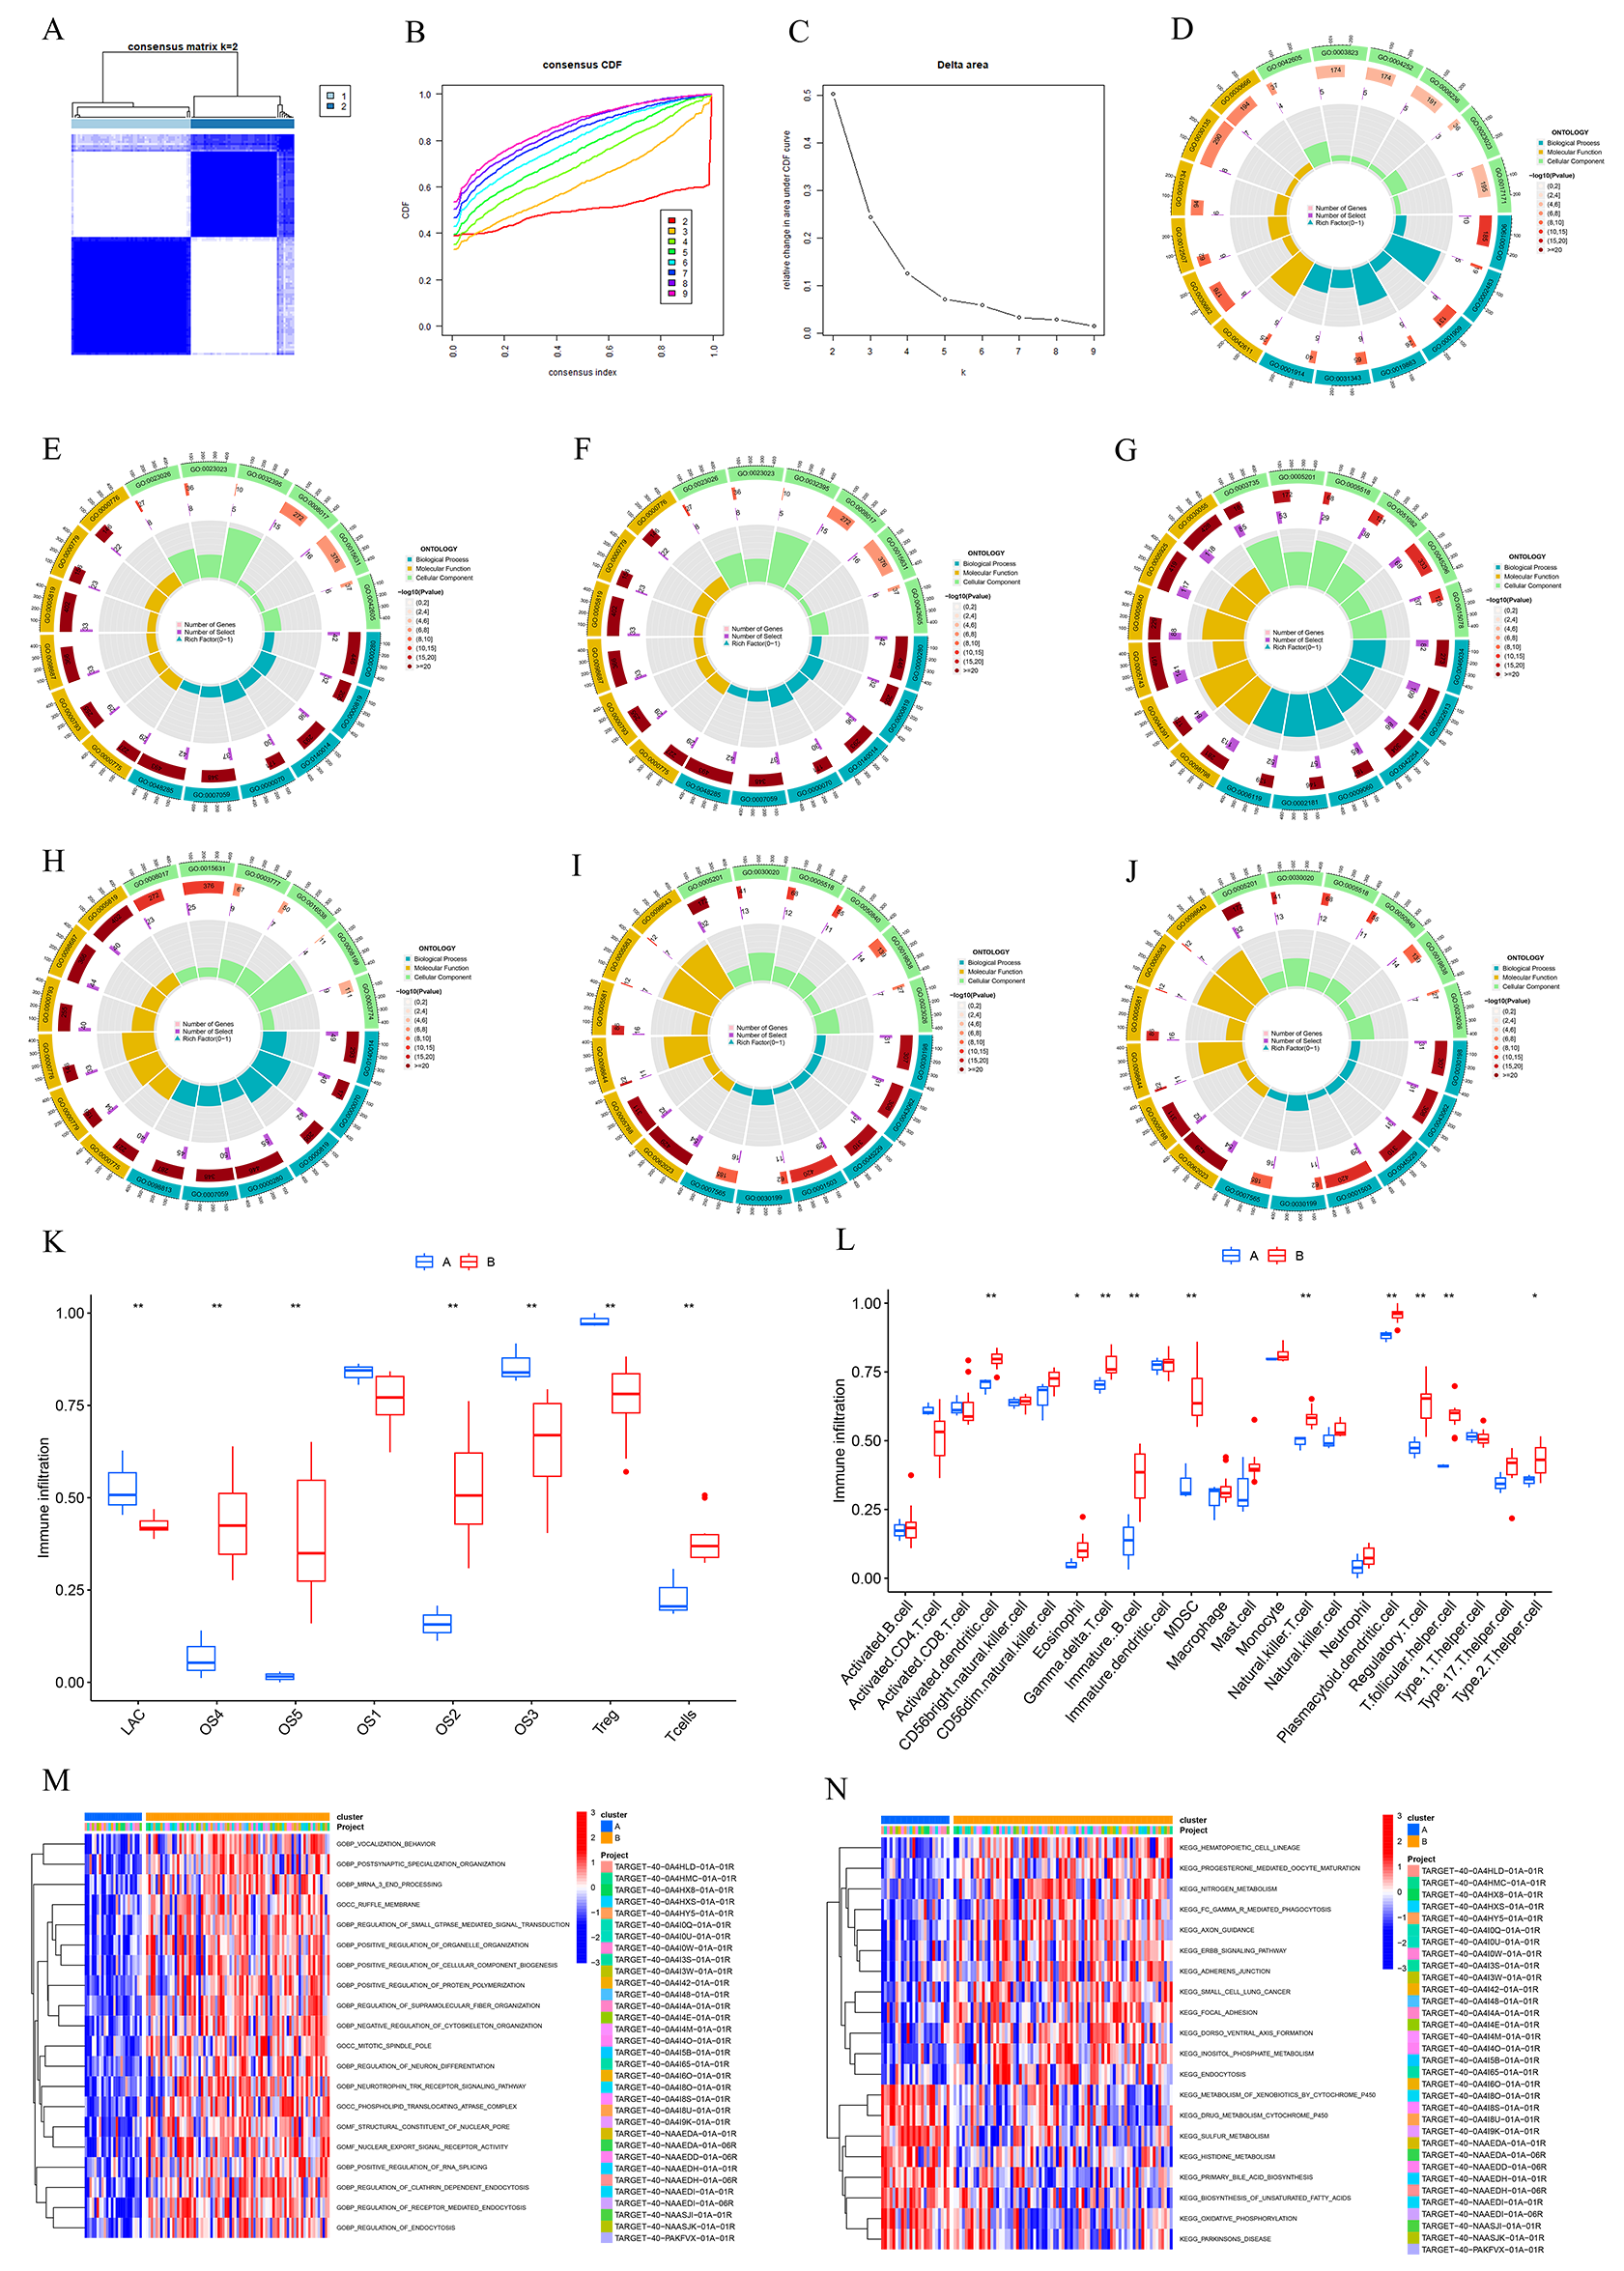 Fig. 4.
Clustering different microenvironment subtypes of osteosarcoma based on LAMGs. (A–C) Consensus clustering identified three distinct clusters of OS with different LAMG expression patterns. (D) Circle plot of Gene Ontology (GO) pathway activities of the T cells cluster markers. (E) Circle plot of GO pathway activities of the Tregs cluster markers. (F) Circle plot of GO pathway activities of the OS cluster 1 markers. (G) Circle plot of GO pathway activities of the OS cluster 2 markers. (H) Circle plot of GO pathway activities of the OS cluster 3 markers. (I) Circle plot of GO pathway activities of the OS cluster 4 markers. (J) Circle plot of GO pathway activities of the OSCs subcluster 5 markers. (K) Single-sample gene set enrichment analysis (ssGSEA) scoring and differential analysis of marker genesets. (L) ssGSEA scoring and differential analysis of 22 immune cells. (M) GSVA-GO analysis of LAMG clusters. (N) GSVA-KEGG analysis of LAMG clusters. “*” represents for p value under 0.05 and “**” represents for p value under 0.01. GSVA, Gene Set Variation Analysis; KEGG, Kyoto Encyclopedia of Genes and Genomes; OSC, osteosarcoma cells.
To identify the high diagnostic value of LAMGs, two proven machine learning
models, the RF and SVM models, were utilized based on the expression profiles of
the OS cohort. The results show that we constructed an SVM prediction model that
included 40 LAMGs (Fig. 5A) and an RF prediction model with LAMG expression of
TIMMDC1, NDUFAF1, NDUFAF6, CARS2, and NDUFAF3 (Fig. 5B,C).
Subsequent pseudo-time trajectory analysis showed that LAMGs, including
NDUFAF6 and NDUFAF3, were highly expressed at the end stage of
OS differentiation (Fig. 5D). The cell cycle-related expression analysis results
showed a relatively low expression level of NDUFS8 in the G1 phase, but
it was high in the G2M and S phases (Fig. 5E). Expression levels of
CARS2 and NDUFAF6 were relatively high in OS cluster 2 (Fig. 5F). Moreover, all were used to construct the WGCNA (Fig. 5G,H, and Fig. 6A–C).
The network was constructed using a soft threshold
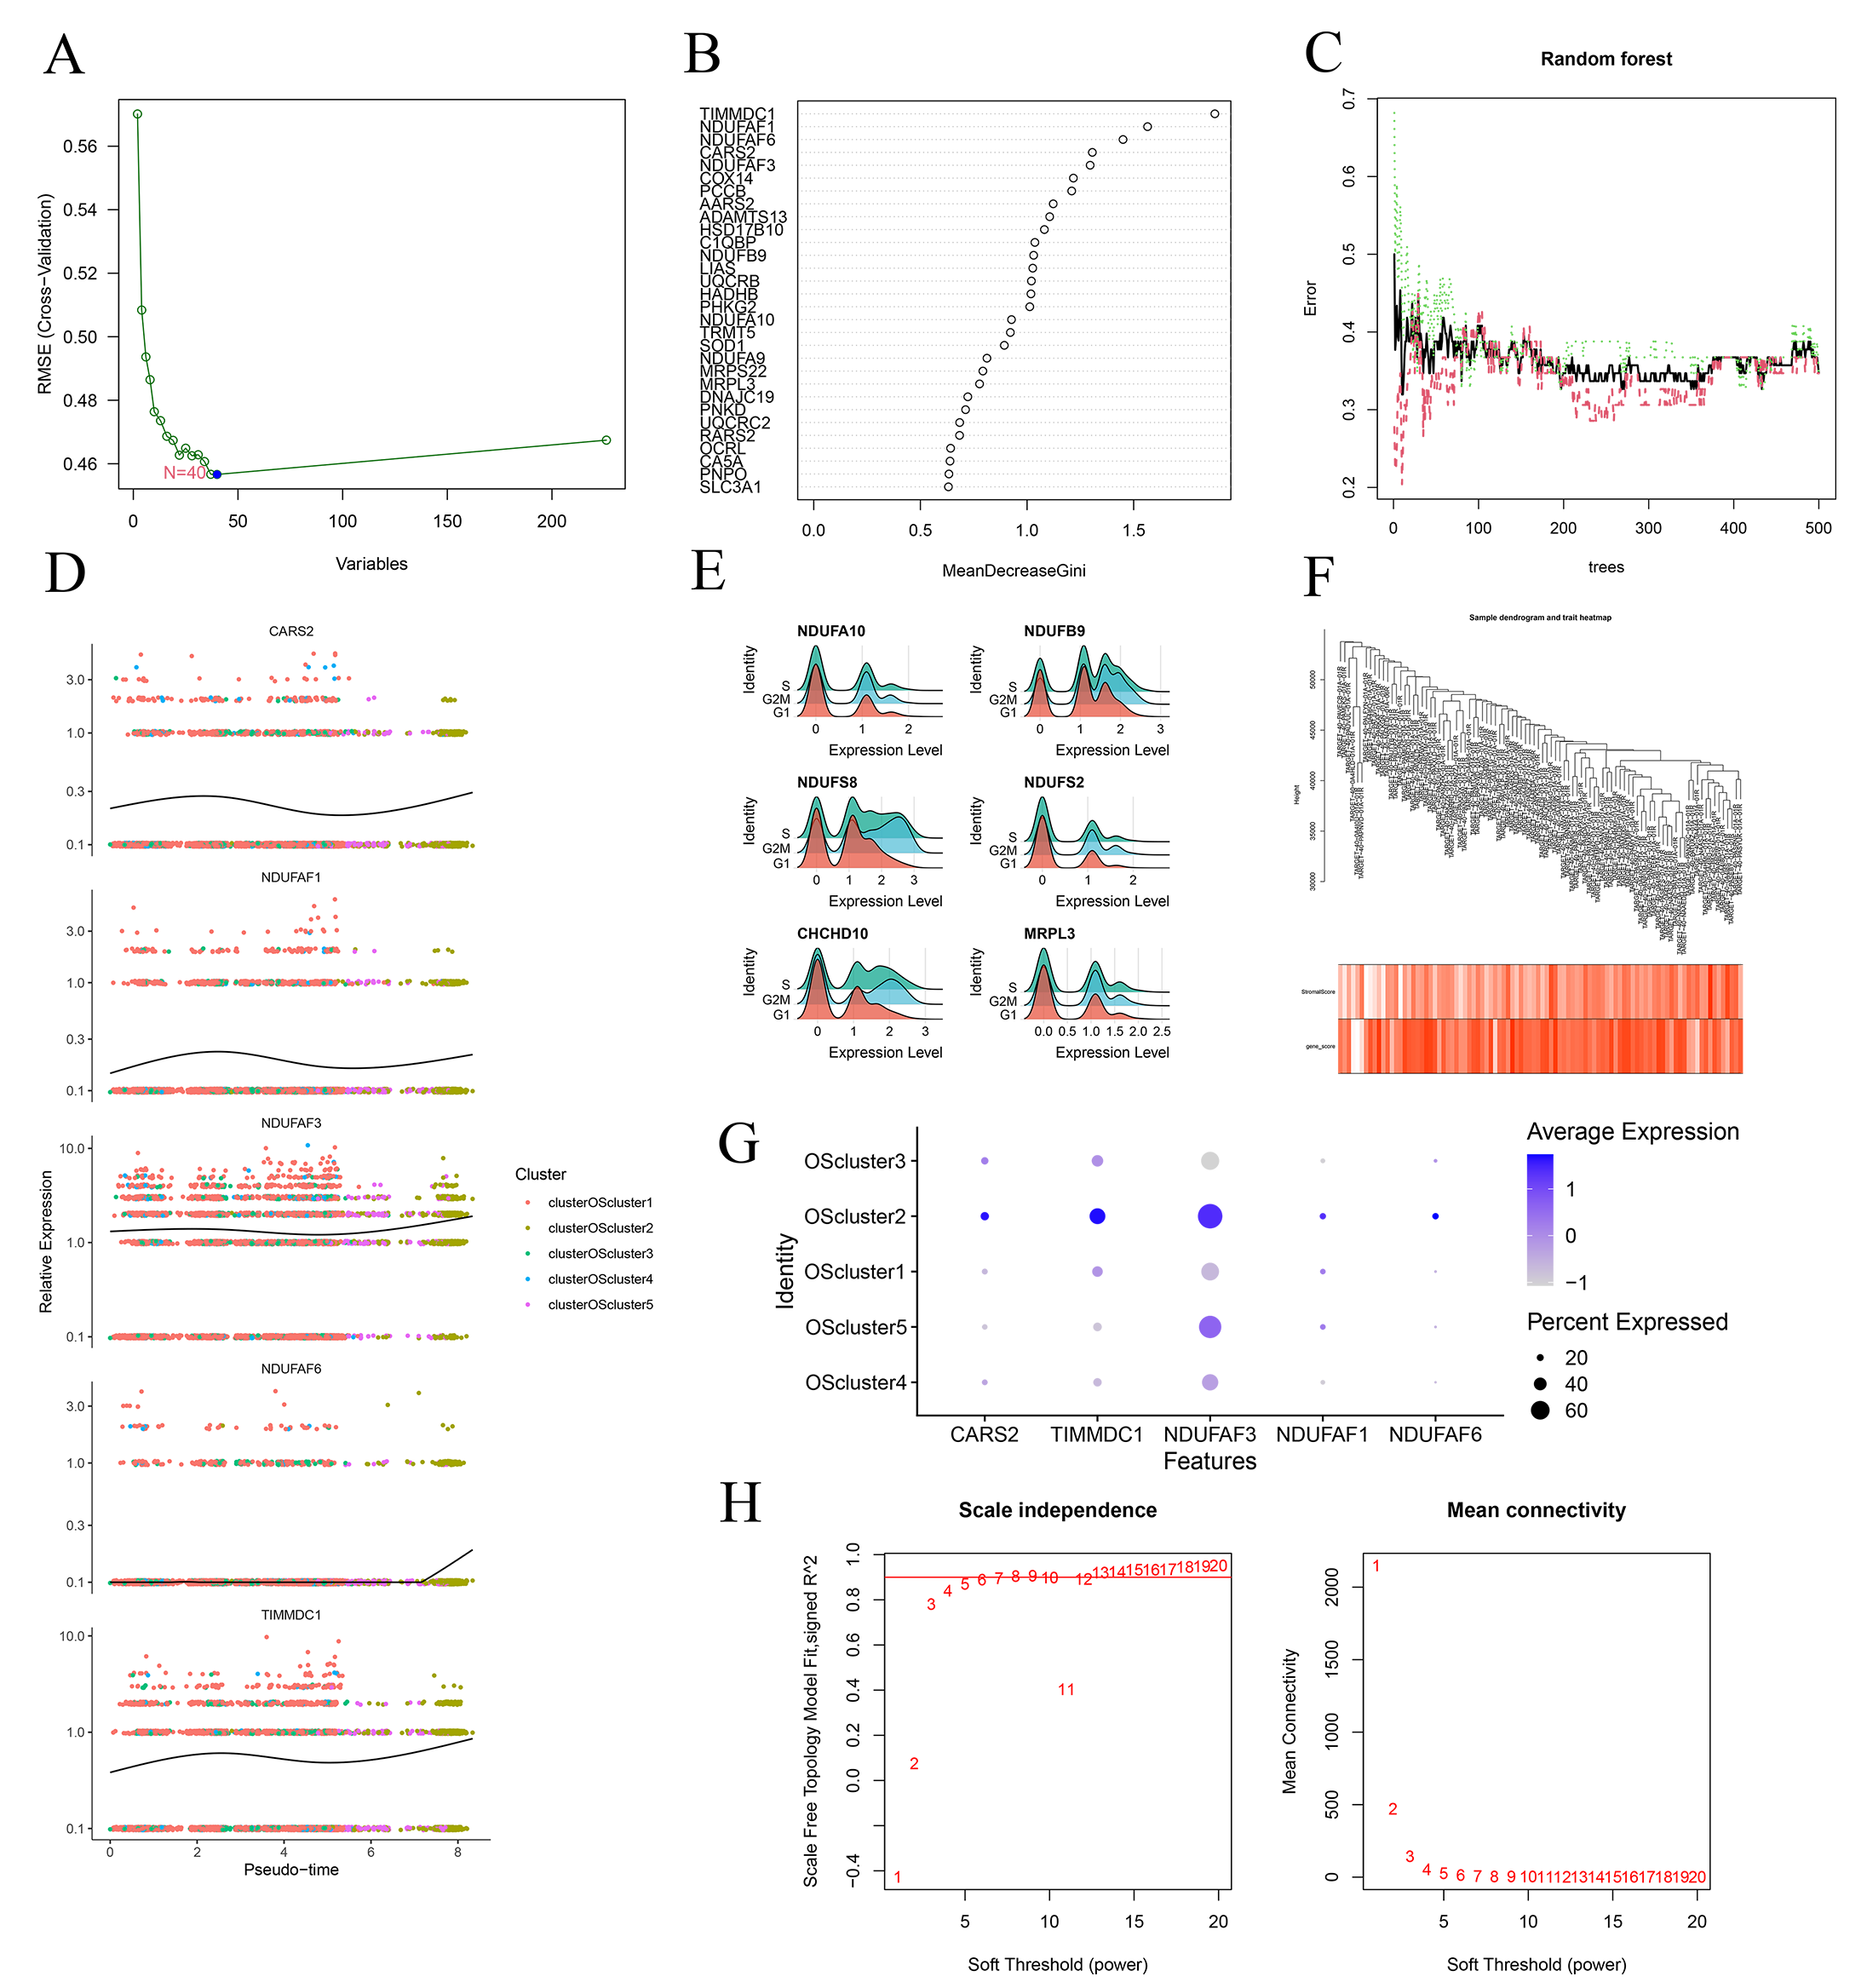 Fig. 5.
Screening of the hub genes. (A) SVM-RFE screening of candidate diagnostic genes. (B,C) Error graph of the random forest (RF) models. (D) Pseudo-temporal differentiation locus of the hub genes in OS. (E) The RidgePlot illustrating the correlation between the hub gene expression and cell cycle. (F) Dot plots shows the hub gene expression across from the OS clusters. (G) Sample clustering heatmap of weighted gene coexpression network analysis (WGCNA) analysis. (H) Scale independence analysis of WGCNA. SVM, support vector machine; RFE, recursive feature elimination; RMSE, root mean square error.
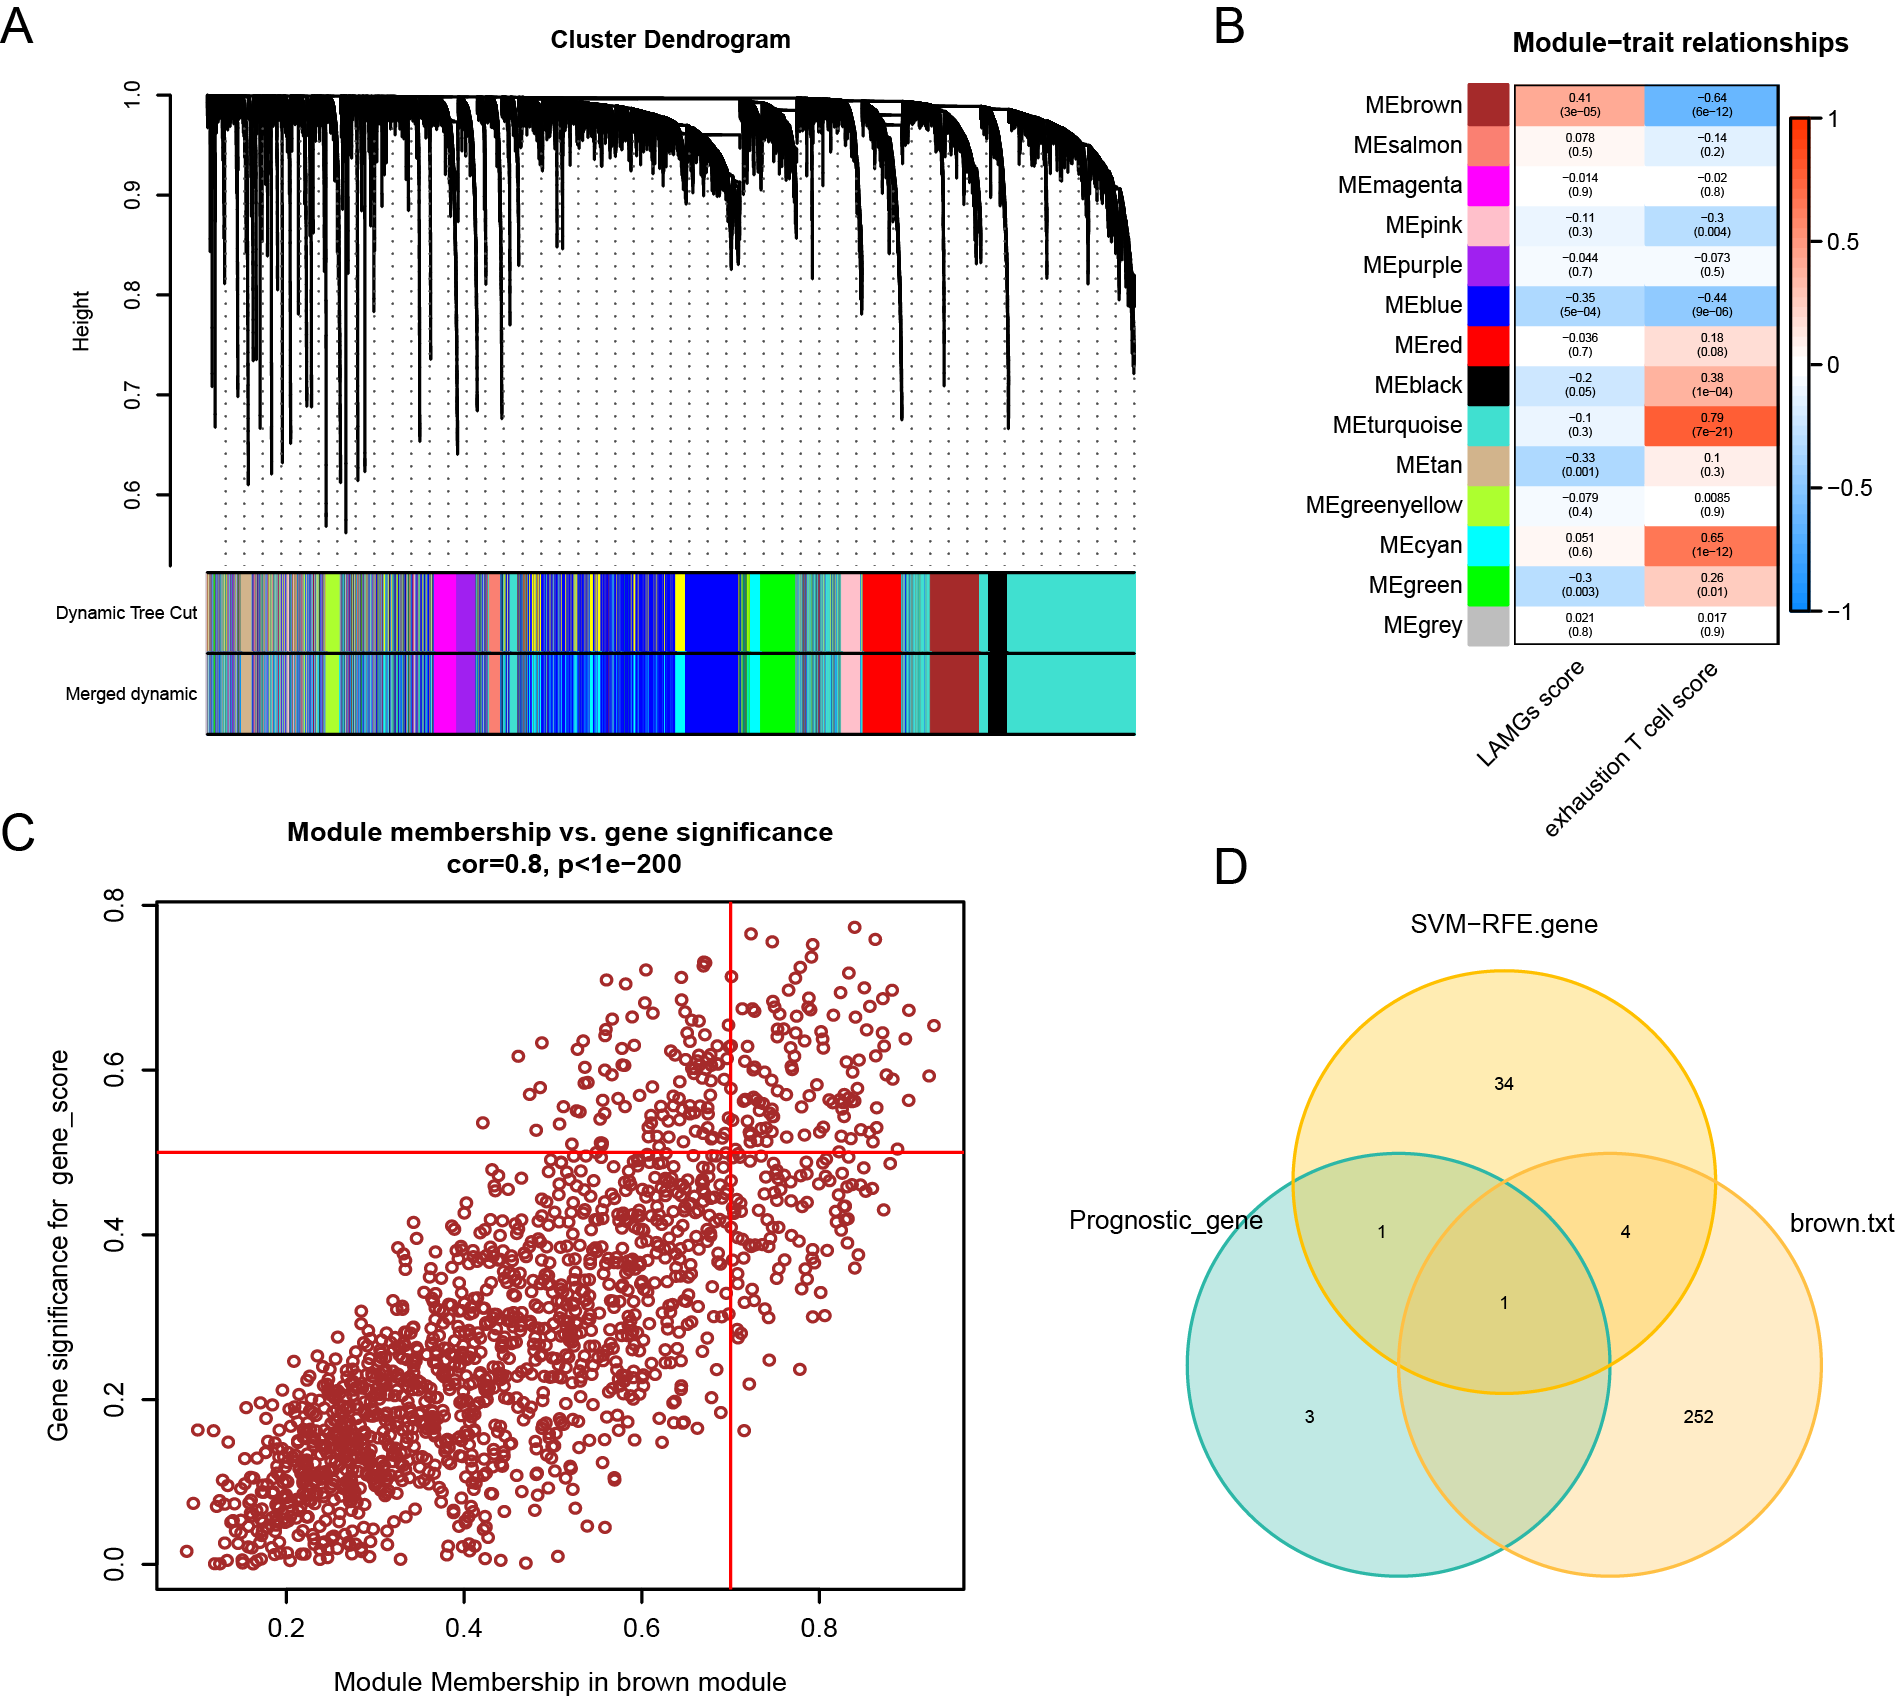 Fig. 6.
WGCNA analysis. (A) Merged dynamic analysis of WGCNA. (B) Module trait of WGCNA analysis. (C) Screening of genes in brown module. (D) The Venn diagram displays the intersection of the results of the three gene sets.
We validated the correlation between hub genes and immune cell infiltration, revealing that the expression of NDUFAF6 was negatively correlated with monocytes (R = –0.29, p = 0.0031; Fig. 7A,B). Furthermore, the correlation between NDUFAF6 and potential drugs was validated. Chelerythrine, ifosfamide, methylprednisolone, nelarabine, PX-316, ribavirin, and vorinostat were screened as potential drugs targeting NDUFAF6 in OS (Fig. 7C–I). Afterwards, a differential functional annotation analysis was performed between the NDUFAF6-high and NDUFAF6-low expression groups of the transcriptome data. The top GSEA-GO enrichment analysis results included negative regulation of map kinase activity, regulation of receptor recycling, renal system vasculature development, ribosomal large subunit assembly, substantia nigra development, cell body membrane, exoribonuclease complex, MHC protein complex, sequence-specific DNA binding of core promoter, and sodium channel activity (Fig. 7J). The top GSEA-KEGG enrichment analysis results included alanine aspartate and glutamate metabolism, antigen processing and presentation, arachidonic acid metabolism, base excision repair, drug metabolism, cytochrome p450, xenobiotic metabolism by cytochrome p450, retinol metabolism, ribosomes, RNA degradation, and spliceosomes (Fig. 7K).
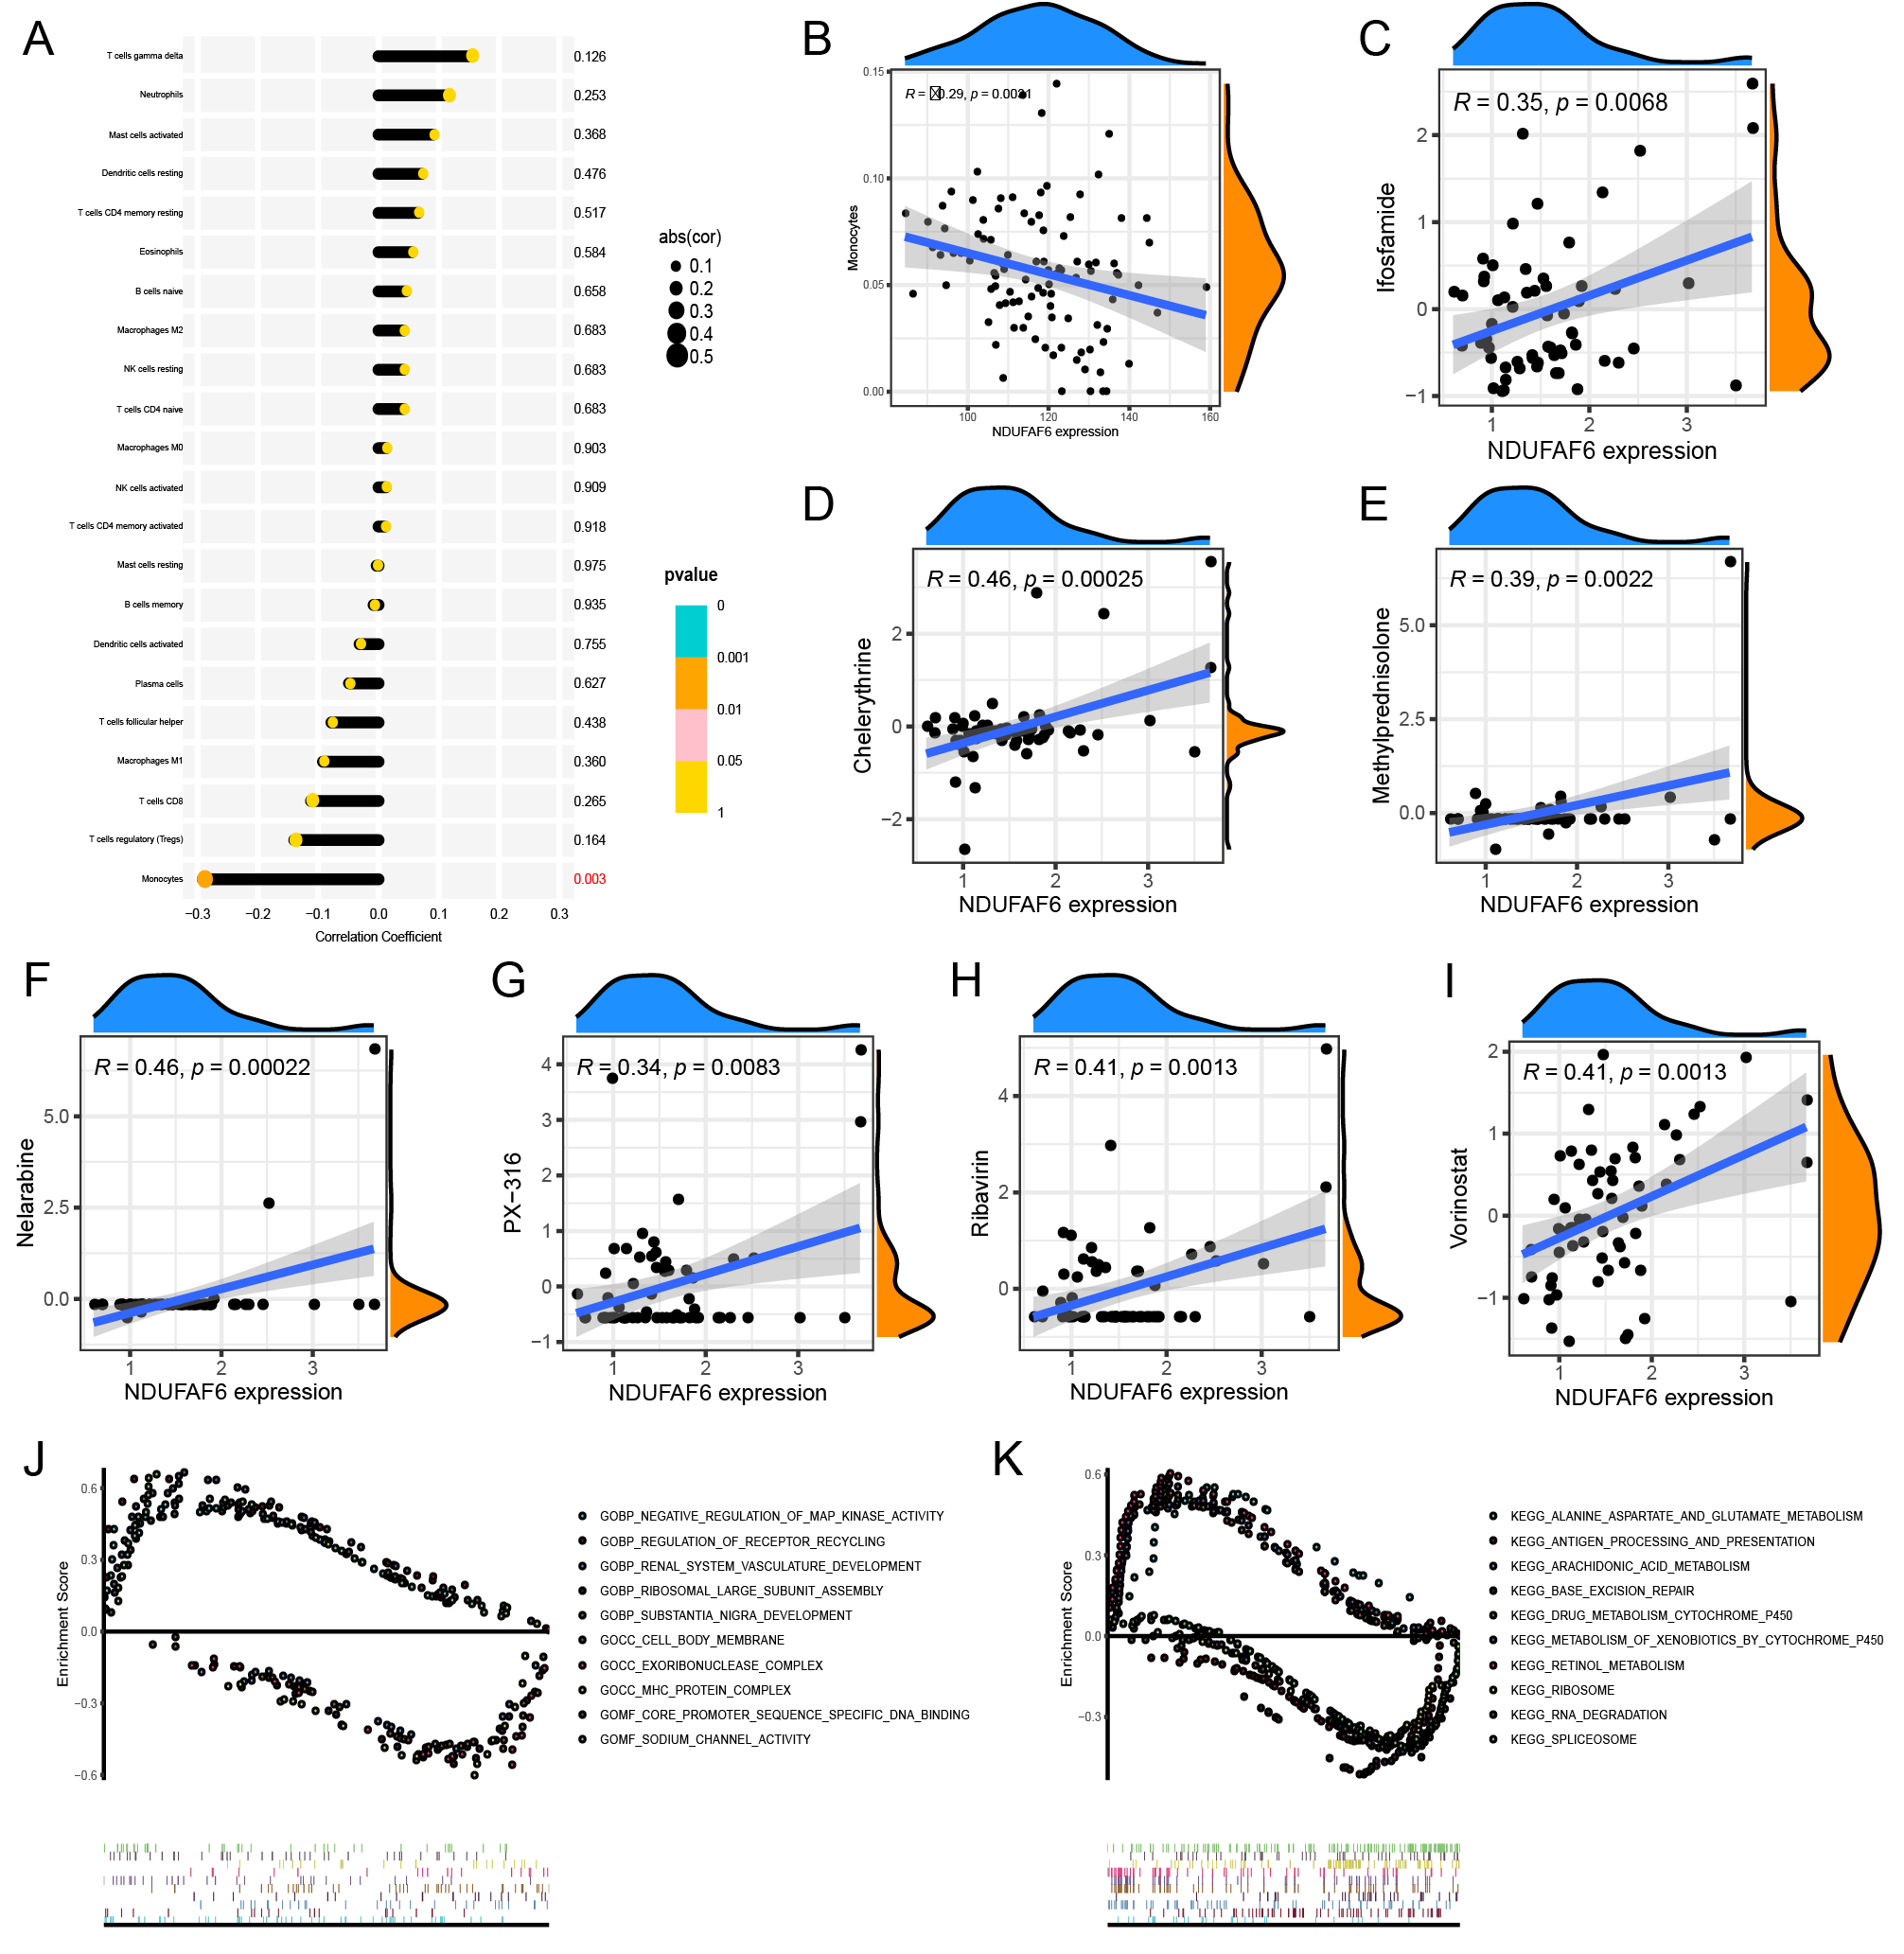 Fig. 7.
Immune, drug sensitive, and function enrichment analysis of NDUFAF6. (A,B) Correlation analysis between NDUFAF6 and infiltration scores of immune cells. (C–I) Correlation analysis between NDUFAF6 and drug sensitive scores. (J) GSEA-GO analysis of NDUFAF6. (K) GSEA-KEGG analysis of NDUFAF6. GSEA, gene set enrichment analysis.
To determine whether lactate expression and exogenous siNDUFAF6 were involved in the OS cells survival , lactate and siNDUFAF6 were separately treated with lactate 143B cells (Fig. 8). The CCK-8 assay showed that the viability of 143B cells decreased after siNDUFAF6 treatment and decreased under LA+siNDUFAF6 treatment (Fig. 8A,B). Transwell assays showed that cell invasiveness was significantly decreased in the LA+siNDUFAF6 treatment group (Fig. 8C,D). We further examed the role of NDUFAF6 in metabolic reprogramming under the condition of TME by evaluating the changes of Extracellular Acidification (ECAR) parameters. The results showed that the glycolytic ability and glycolytic reserve of osteosarcoma cells decreased after the siNDUFAF6 treatment (Supplementary Fig. 1A). qRT-PCR results indicate that the NDUFAF6 and TIMMDC1 expression levels significantly decreased after LA+siNDUFAF6 treatment (Fig. 8E), it is also find that the expression of NDUFAF6 in OS cells reduced after adding chelerythrine (Supplementary Fig. 1B).
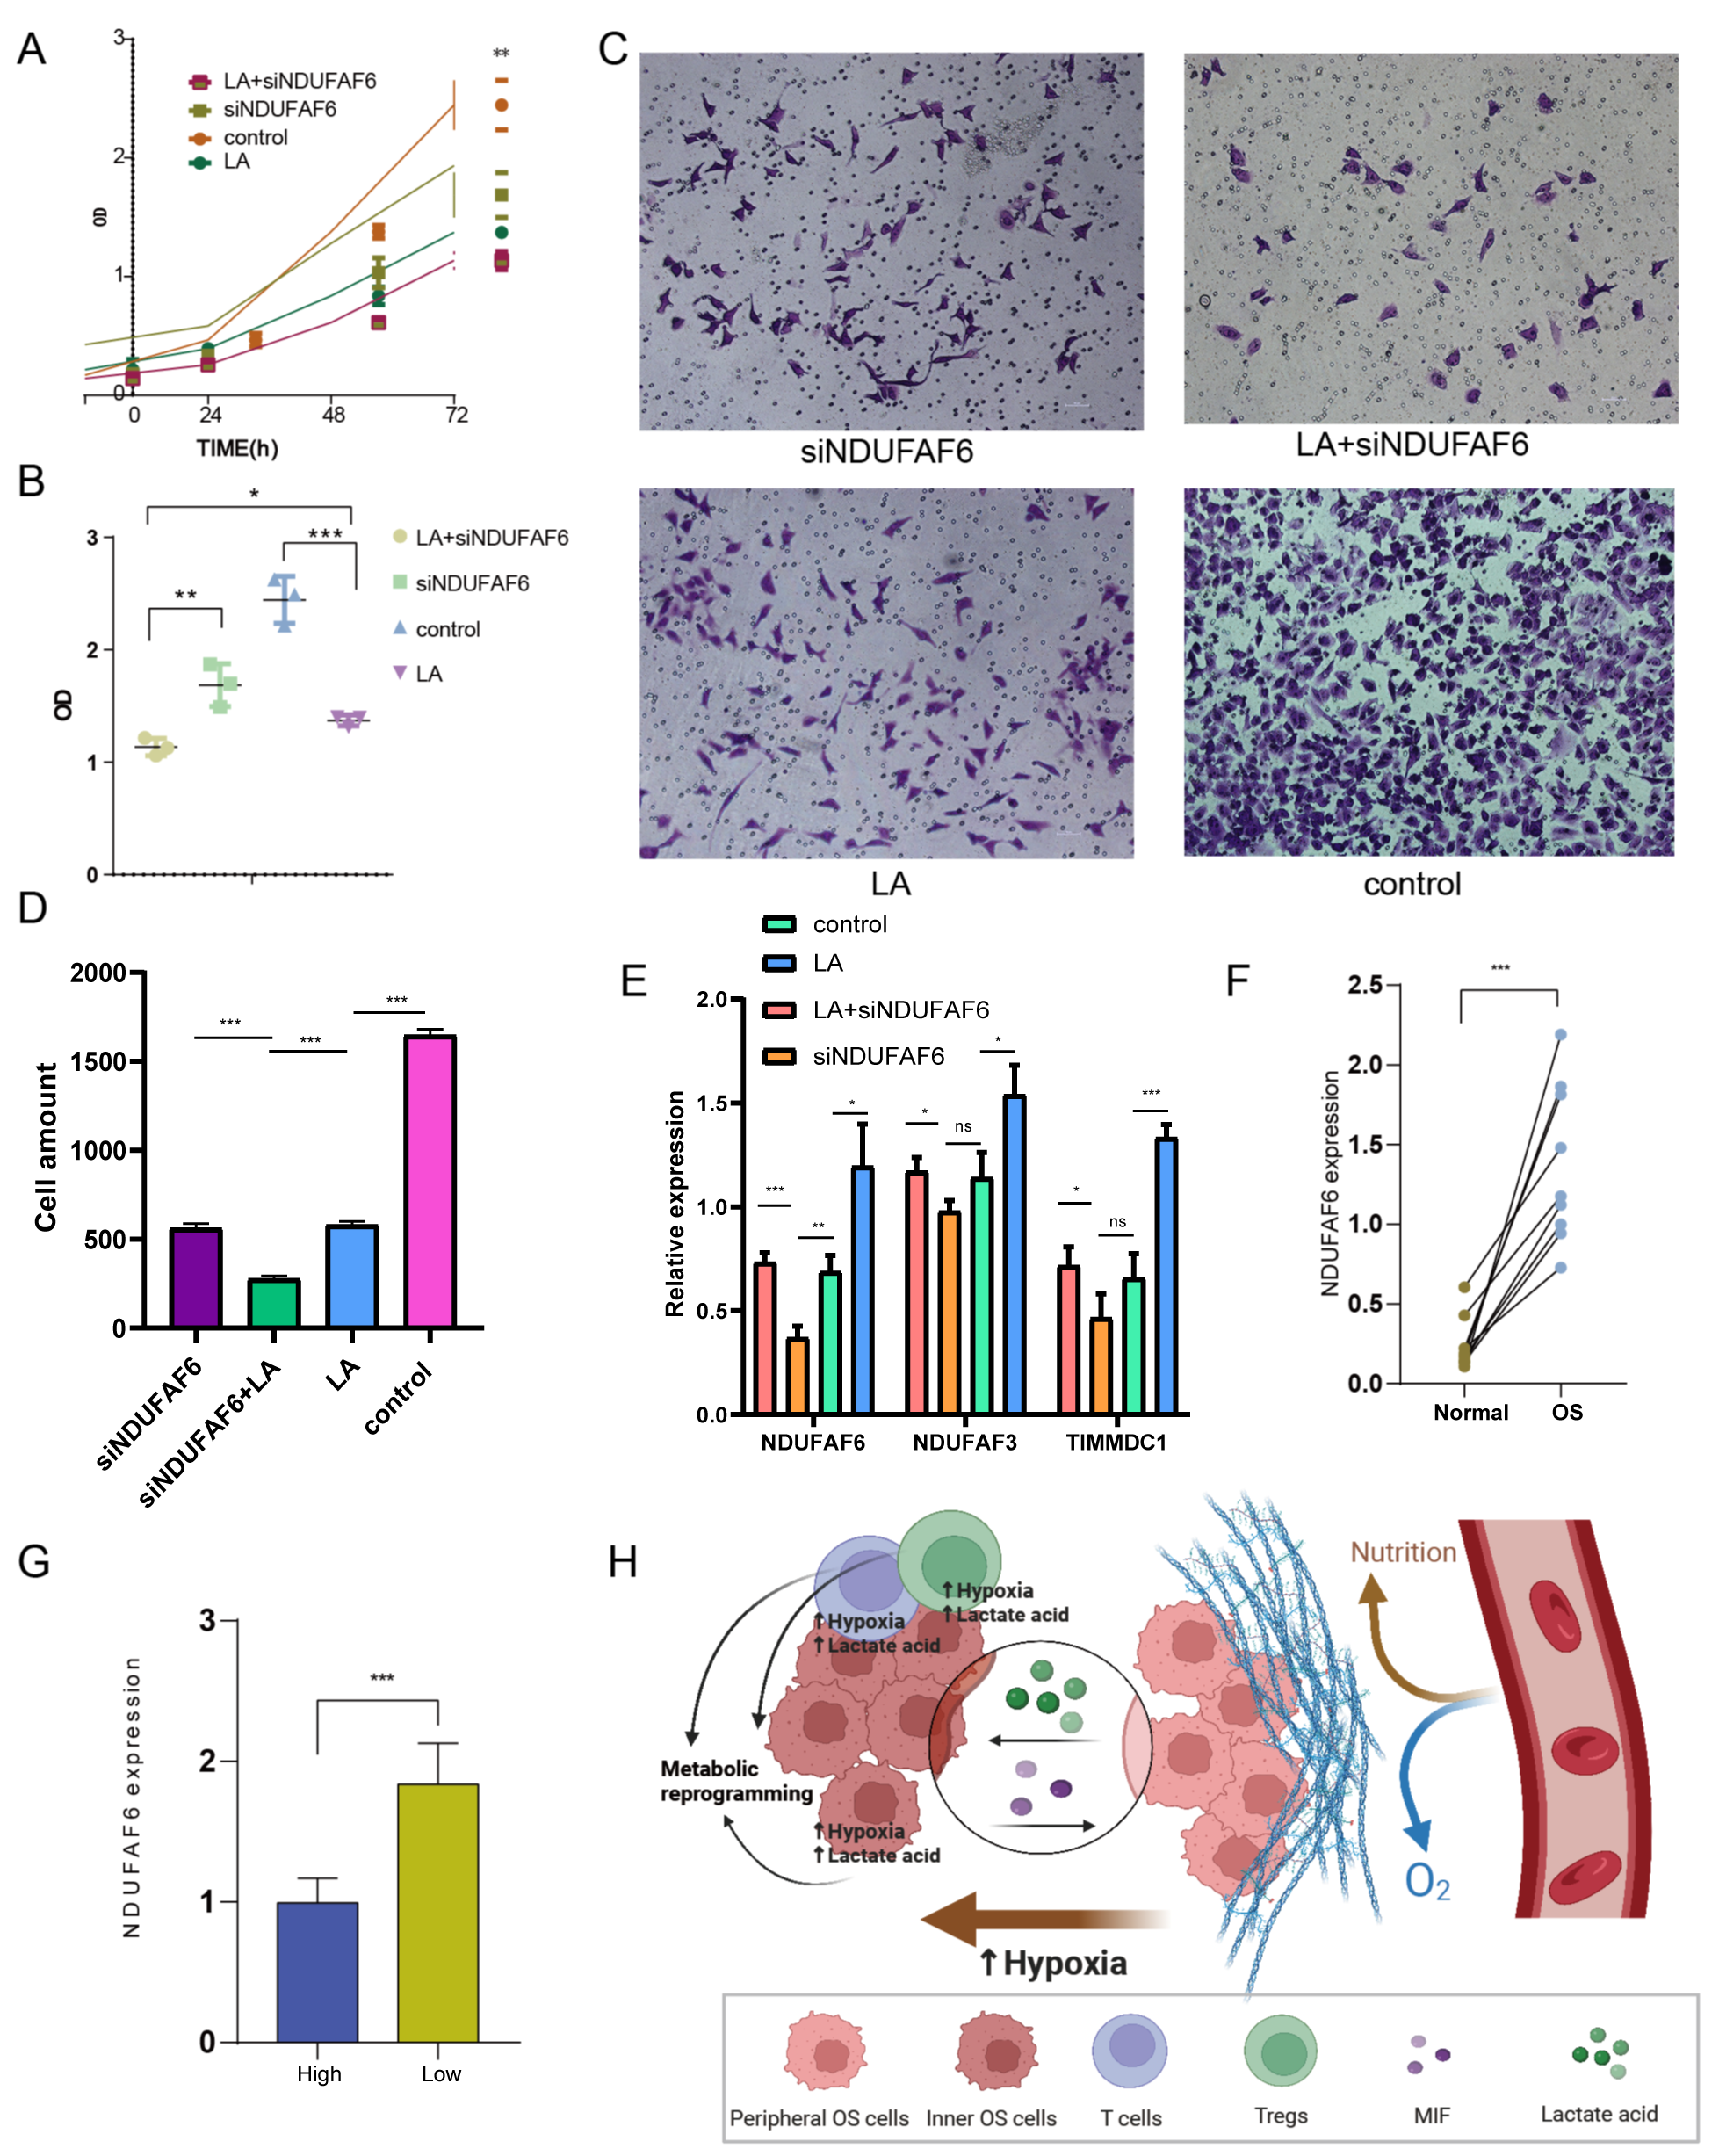 Fig. 8.
In vitro and patient experiment. (A,B) 143B cell viability after treatment with siNDUFAF6 or LA. (C,D) Transwell experiment treatment with siNDUFAF6 or LA. (E) qRT-PCR validate the expression of NDUFAF6, TIMMDC1, and NDUFAF3 with different treatment. (F) The NDUFAF6 expression level in OS and normal tissue. (G) NDUFAF6 expression levels in different patient groups. (H) Mechanism diagram. “*” represents for p value under 0.05, “**” represents for p value under 0.01,“***” represents for p value under 0.001, and “ns” represents for p value over 0.05. qRT-PCR, quantitative reverse transcriptase polymerase chain reaction. LA, lactic acid.
The NDUFAF6 expression level in each patient was determined using qRT-PCR and IHC. The expression level of NDUFAF6 in OS tissue group and lower immune score group were respectively higher than that in the adjacent tissue group (nine cases, Fig. 8F) and higher immune score group (five cases, Fig. 8G). IHC results also confirmed that the protein expression levels of NDUFAF6 OS tissue group were respectively higher than that in the adjacent tissue group (Supplementary Fig. 1C).
Metabolic reprogramming is a hallmark of cancer cells and has recently been identified as a key factor in tumor progression [38]. However, the metabolic profile of OS remains unclear [39]. Various metabolic markers, including elaidic acid, docosahexaenoic acid, and octadecanoic acid, were expressed differentially between OS lung metastases development and nonmetastatic state, as a consequence of hypoxia and the shift from consumption of carbohydrates and amino acids to lipids [40], concomitantly, the levels of glucose, glucose phosphate, and gluconolactone were decreased, while uridine and uracil increased during the metastatic phase as a consequence of metabolic shunting towards ribose [41]. OS also illustrates the role of glutathione pathway downregulation and high hypoxic levels during metastasis [42]. In this study, we found that the genes expression levels related to lactic acid, fatty acid, glycolic metabolism, butyric acid metabolism, and glycolysis metabolism were relatively high in malignant OS cells. This is consistent with previous findings that glycolysis promotes tumor invasion and metastasis [43]. cholesterol metabolism and its metabolites can also promote tumor invasiveness [44]. Butyrate affects the metabolism of OS cells by regulating cell differentiation and the expression of anti-inflammatory mediator-related genes [45]. At present, increasing evidence shows that multiple types of immune cells in the tumor microenvironment are similar to tumor cells, and the abnormal metabolism of cells is caused by the combined action of various factors that have a profound influence on tumor immunity [46]. Our results show that T cells in OS tissues are composed of activated T cells and exhausted T cells. These two subtypes show distinct metabolic profiles, including lactic acid, glycolysis, and hypoxia metabolism, indicating that lactic acid metabolism is highly involved in the biological processes of activation and exhaustion of T cells and that lactic acid dampens the function of T cells by suppressing T cell cytokine production and restraining the redox system of T cells [47]. Hypoxic metabolism also shows high heterogeneity in Treg cells, and it has been proven that hypoxia favors Tregs in terms of differentiation, suppressive recruitment, and function [48].
Similar to other fatty acids, L-lactic acid can also form the corresponding fatty acyl-CoA and L-lactyl-CoA. Zhao et al. [49] first reported that lactic acid is an important epigenetic regulatory molecule; histones can undergo lactate modification K (L-la) and regulate the expression of genes related to macrophage polarization during immune activation [50, 51]. Previous studies have also examined the potential regulatory effects of HDACs on lactate modification and found that Class I HDACs (HDAC 1-3) are the most effective lysine lactate modification erasers, in which HDAC1 and 3 play a role in cell de-lactate activity [37]. Our results also revealed highly heterogeneous expression of HDAC1 and 3 in the OS microenvironment. Our results on tumors and tumor-infiltrating T cells suggest that lactic acid metabolism in OS and lactic acid itself in the microenvironment may play an important role in the progression of OS. The role of lactic acid in oncogenesis and progression has long been underestimated because it is primarily considered as a waste product of glycolysis or a marker of poor prognosis [42, 52]. In recent years, lactic acid has been found to play a key role in promoting tumor growth, angiogenesis, immune escape, invasion, metastasis, metabolic regulation, and cell interactions in the TME [53, 54]. For example, tumor cells produced lactic acid can be secreted into the extracellular environment to promote cancer progression [7]. The proton-coupled lactate efflux system in tumor and tumor-associated stromal cells regulates survival signaling and prevents immune surveillance of tumor cells to promote tumor progression. Extracellular acidosis inhibits T cell-mediated immunity, and neutralization of tumor acidity may enhance the antitumor effects of immunotherapy [55]. To further explore the key role of lactic acid metabolism in OS cells, we divided malignant OS cells into five subgroups. OS cluster 2 had significantly high glycolysis and lactic acid metabolism levels, and the results of marker genes functional enrichment in OS cluster 2 showed that functions including mitochondrial matrix, inner mitochondrial membrane, and oxidoreduction-driven activity were highly enriched, suggesting that lactic acid metabolism is related to the functions of mitochondrial metabolism. The high metabolic heterogeneity within solid tumors may be caused by vascular integrity and proximity to the vasculature that transports oxygen and nutrients [56]. Well-vascularized tumor subregions can access a variety of nutrients, whereas poorly perfused areas utilize glucose as their main carbon source [57]. Lactic acid metabolism can affect the oxidation state of cells, leading to the conversion of glucose to pentose phosphate pathway and the biosynthesis of hexosamine. The innermost cells of the tumor are in a state of high oxygen deficiency and high lactic acid concentration, resulting in high lactic acid metabolism in the tumor cell population in this region. Therefore, we suggest OS cluster 2 as the cell cluster in this position. In addition, research has shown that tumor cells within tumors cooperate in a metabolic “symbiosis”. For example, tumor cells in hypoxic regions consume glucose by anaerobic glycolysis and release lactic acid, which is then utilized by tumor cells in adjacent oxygen-containing tumor regions to fuel the tricarboxylic acid cycle and form a biological process called lactate shuttles [58]. We also found that amino acid levels in the core of the tumor were higher than those in the periphery, and it is assumed that peripheral cancer cells release these amino acids as an energy source for internal tumor cells [57]. The role of cytokines in the regulation of tumor metabolism has been gradually discovered, for example, IL4 and IL13 in pancreatic cancer promote glucose utilization. Our research suggests that MIF plays a crucial role in the metabolic communication of OS cells. MIF, as an autocrine growth factor, has been discovered to be involved in cholesterol metabolism in a variety of diseases. The expression of MIF has a vital influence on adipocyte metabolism and immune regulation [59]. MIF is involved in the regulation of malignant phenotypes in various types of cancers by activating a variety of signaling pathways. An abnormal increase in MIF expression level improves the migration, proliferation, and invasiveness of gastric, breast, and lung cancer cells [60, 61, 62, 63]. CXCL2/MIF-CXCR2 signaling activation in bladder cancer cells intensifies the accumulation and expansion of MDSC in the TME [64].
GSVA results showed that differentially enriched functions include nitrogen
metabolism and the Erbb signaling pathway. The metabolites of glycolytic
metabolism on the one hand have basic functions as major energy and biosynthetic
sources, and on the other hand are also involved in the regulation of immune cell
reprogramming metabolic pathways to meet energy and biosynthetic requirements
during immune cell activation. Various lymphocytes in tumor cells, including
inflammatory M1 macrophages, transition from oxidative phosphorylation to
glycolysis to adapt to the TME [65]. Oncogene ErbB2 has been shown to
enhance the Warburg effect by activating heat shock factor 1 and regulating
lactate dehydrogenase A [49]. ErbB2 overexpression increases glucose uptake and
lactic acid production [66]. To further explore the molecular characteristics
between clusters, we comprehensively assessed the differences in the immune
microenvironment by conducting an immune infiltration analysis between lactate
metabolism cluster 1 and cluster 2. Cluster 2 exhibited significantly higher
proportions of multiple types of immune cells, including activated dendritic
cells, eosinophils, gammadelta T cells, immature B cells, MDSCs, NK cells,
plasmacytoid dendritic cells, regulatory T cells, T follicular helper cells, and
type II T helper cells. Thus, we defined cluster 2 as immune-hot cluster and
cluster 1 as immune-cold cluster. We further validated the results of the
single-cell analysis by analyzing the infiltration of various cell types in the
transcriptome samples and show that cluster 2 exhibited significantly higher
proportions of OS cluster 4 cells, OS cluster 5 cells, OS cluster 2 cells, and T
cells, whereas the abundance of OS cluster 3 cells and Tregs was relatively
greater in cluster 1. These results suggest that lactate metabolism is involved
in the TME regulation. Insights into LAMGs may facilitate the discovery of the
mechanisms regulating tumor immunity and pave the way for future TME studies.
Although numerous studies support a relationship between tumor lactate metabolism
and immune escape in the tumor microenvironment [23], the specific molecules
responsible for this relationship have not been identified. Genes including
TIMMDC1 and NDUFAF1 were screened as hub genes. TIMMDC1
(C3orf1) is a four-pass membrane protein located in the mitochondrial inner
membrane. It is suggested that TIMMDC1 is associated with multiple members of
mitochondrial complex I assembly factors, reduced mitochondrial respiration,
reduced glycolysis activity, and the AKT/GSK3
Our in vitro expression results showed that knockdown of
NDUFAF6 decreased OS cell viability and invasiveness. It is reported
that mitochondria can actively migrate to certain subcellular regions with high
energy requirements along cytoskeleton filaments and undergo mitochondrial
fission to meet the needs of cell migration, invasion and cell proliferation, so
we assume that NDUFAF6 can enhance the invasion and growth ability of
osteosarcoma cells through these mechanisms [69]. The patient experiment showed
that expression level of NDUFAF6 is higher in OS tissue. The expression
level of NDUFAF6 significantly correlated with the monocyte infiltration
level. One subtype of monocytes, also known as patrolling monocytes (PMos), has
been recognized as potentially relevant to OS; unlike classical monocytes that
promote tumorigenesis and metastasis, nonclassical PMos have been shown to
decrease breast metastasis [70]. Although there is limited research on how
NDUFAF6 regulates immune processes in OS, our results suggest that
molecules involved in lactic acid metabolism and immune processes in OS may be
potential targets for the development of new therapeutic strategies. Lactate
accumulation has been shown to be associated with increased cancer resistance and
malignancy [71]; thus, screening drugs that target lactate metabolism for
combination therapy has a key potential role in the efficacy of chemotherapy for
OS. We identified chelerythrine and vorinostat as potential drugs that target
NDUFAF6. Chelerythrine, an IL-2 inhibitor, selectively inhibits the
interaction between IL-2 and IL-2R
Lactic acid metabolism patterns in OS revealed metabolic reprogramming phenotypes relevant to the tumor microenvironment, and NDUFAF6 was identified as an LRG biomarker (Fig. 8H).
The datasets generated and analyzed during the current study are available from the corresponding authors upon reasonable request.
LW, XD, JL and XL designed the research study. LW, XD and LX performed the research. YL provided help and advice on methodology. LW, XD, LX and XZ analyzed the data. LW, XD, XZ, JL and XL wrote the manuscript. All authors contributed to editorial changes in the manuscript. All authors read and approved the final manuscript. All authors have participated sufficiently in the work to take public responsibility for appropriate portions of the content and agreed to be accountable for all aspects of the work in ensuring that questions related to its accuracy or integrity.
The experiments were performed under a project license granted by the Ethics Committee of Honghui Hospital, Xi’an Jiaotong University (protocol code 202303051). Informed consent was obtained from all patients in this study.
Not applicable.
This research was funded by the Beijing Municipal Science & Technology Commission, Administrative Commission of Zhongguancun Science Park to XL, grant number Z191100007619023 and the National Natural Science Foundation of China to XL, grant number: 81972103, 82372451.
The authors declare no conflict of interest.
Publisher’s Note: IMR Press stays neutral with regard to jurisdictional claims in published maps and institutional affiliations.