
- Academic Editor
Background: Contaminants of emerging concern (CECs) have garnered
significant attention due to their potential impacts on ecology, wildlife, and
human health. The interest in these contaminants arises from their inadequate
regulation or lack of routine monitoring in natural environments. Among them,
per- and polyfluoroalkyl substances (PFAS) are of particular concern due to their
notable propensity to accumulate within the kidney, significantly influencing the
excretion of these pollutants. Rodlet cells (RCs) have emerged as promising
indicators of immunotoxicity in response to chemical stressors. A prior
comprehensive study extensively detailed the effects of sub-chronic exposure to
perfluorooctanoic acid (PFOA), a well-known PFAS compound, on RCs located in the
hematopoietic tissue of the common carp kidney. Even at concentrations commonly
found in the environment, PFOA exhibited a significant impact on the distribution
patterns of RCs, concurrently enhancing exocytosis activity. Methods:
The assessment of PFOA-induced RC degranulation employed texture analysis
combined with linear discriminant analysis (LDA) to differentiate between various
experimental exposure groups. The investigation encompassed three fish groups: an
unexposed group, a group exposed to an environmentally relevant PFOA
concentration (200 ng L
Contaminants of emerging concern (CECs) hold a paramount position in the realm of environmental science due to their potential ecological, wildlife, and human health implications, primarily stemming from their limited regulation and insufficient routine monitoring within natural environments [1]. Among the significant categories of CECs, per- and polyfluoroalkyl substances (PFAS) emerge as a central concern [2]. These substances can accumulate in renal tissues at substantial concentrations, prominently influencing their excretory function and manifesting potential nephrotoxicity [3, 4, 5, 6]. Furthermore, PFAS compounds have been recognized for their immunotoxic effects [7, 8, 9].
Perfluorooctanoic acid (PFOA), a well-known member of the PFAS group, is characterized by its amphiphilic nature, featuring a hydrophobic seven-carbon chain with fluorine atom substitutions for hydrogen and a hydrophilic carboxylic group [10]. Its exceptional solubility in water, recalcitrance, and prolonged half-lives within biological systems have raised considerable concerns in aquatic ecosystems [11, 12].
Fish, as a crucial component of aquatic ecosystems, experience consistent exposure to PFOA, resulting in its bioaccumulation within their tissues [13, 14]. This situation raises concerns about potential human exposure to PFOA through the consumption of fish within the food supply chain [15]. Therefore, fish species serve as valuable subjects for researching the toxicologic and environmental pathologic effects of PFOA according to the holistic One Health perspective [16, 17].
Although research on PFOA effects has largely focused on cyprinids like zebrafish (Danio rerio) [18], the common carp (Cyprinus carpio) stands as a robust model for studying the impact of this pollutant on fish communities in nature. Its availability for research, ease of maintenance, significance as a food source, abundance in freshwater ecosystems, and role as an “ecological engineer” [19] make it an ideal candidate for assessing emerging pollutants’ effects. Its effectiveness has been demonstrated in both experimental and field research concerning PFAS compounds [5, 7, 8, 20, 21, 22].
The common carp’s kidney, comprising various histological components such as nephrons, hematopoietic tissue, and thyroid follicles [23], has garnered attention as a versatile and multipurpose biomarker organ. This recognition extends to its relevance in environmental pathology, toxicological research, and translational medicine due to its potential to assess the impacts of toxic exposures on various functionalities [5, 7, 8, 22].
Rodlet cells (RCs), a unique feature found in teleosts, were initially documented by Thélohan in 1892. Subsequent to this discovery, extensive literature reviews have examined the characteristics, origin, structure, and functionality of these distinct cells. These studies highlight their potential as biomarkers for chemical exposure [24, 25]. RCs primarily reside in the epithelia of various organs in fish species from both freshwater and saltwater habitats [24, 25]. Morphologically, mature RCs exhibit a distinct polarized profile, featuring a peripheral cytoplasmic area with aligned microfilaments, rod-shaped granules known as rodlets, and the remaining section of the cytoplasm displaying conspicuous vesiculations. Furthermore, the nucleus is positioned at one extremity [8, 24, 25].
In recent decades, mounting evidence has highlighted the integral role of RCs in
the innate immune system of fish, demonstrating their capacity to respond to
different noxae [7, 8, 24, 26, 27, 28]. This assertion finds support in various aspects:
First, the resemblance and shared features observed between RCs and leukocytes,
notably their perivascular positioning and the presence of villous projections,
which exhibit structural similarities, potentially resembling T cell microvilli
[8, 25, 29, 30]. Second, RCs demonstrate aggregation at sites affected by both
micro- and macroparasites [25, 31]. Third, RCs exhibit close associations with
other immune cells [7, 24, 29]. Fourth, the immunolocalization of immune-active
components within RCs, such as tumor necrosis factor
RCs were shown to react to diverse noxae, encompassing parasites and environmental pollutants, showcasing alterations in their cellular functions, including secretion patterns and recruitment [7, 8, 31]. Recent studies have highlighted the potential of RCs to serve as valuable biomarkers for evaluating immunotoxicity resulting from exposure to chemical stressors [7, 8].
In a previous study involving fish from the same experimental cohort as the
present research, an investigation was conducted to assess the effects of varying
concentrations of PFOA. This analysis encompassed a comprehensive evaluation
utilizing both structural and ultrastructural methodologies to examine the
distribution of RCs within the tissue and their exocytosis patterns.
Additionally, quantitative assessment through biometric analysis was employed to
determine the abundance of RCs within the hematopoietic tissue [8]. The outcomes
of that investigation demonstrated that PFOA exerted a significant influence on
the distribution patterns of RC. This held true even at a 200 ng L
These findings elucidate the immunotoxic effects of PFOA on fish and imply the potential of RCs to serve as sentinel cells in responding to environmental pollutants within the immune system [8].
The term “texture” encompasses various patterns and sub-patterns of brightness, color, and other visual attributes [35, 36]. The initial step in image texture analysis involves feature extraction, which quantitatively describes the texture using structural, statistical, model-based, and transformation-based methods [35, 36, 37]. Subsequently, the objective is texture discrimination, with the goal of identifying and categorizing image regions with consistent texture properties, such as distinguishing between normal and pathological areas [37, 38].
In the context of this study, the primary objective is to provide a quantitative
characterization of PFOA-induced degranulation within RCs in common carp exposed
to an environmentally relevant PFOA concentration (200 ng L
The kidney specimens used in this investigation were derived from a previous
study conducted by Giari et al. (2016) [42]. While a summarized version
is presented here, detailed information regarding fish selection, maintenance,
and the specific experimental framework concerning PFOA exposure is available in
the aforementioned publication. Thirty-one adult common carp (Cyprinus
carpio), two years old, were obtained from a local fish farm and acclimatized
over a four-week period. Throughout the exposure test, these specimens were
maintained under a 14:10 h light–dark cycle and fed thrice weekly with pellet
food (Tetra Pond Pellets Mini, Tetra, Melle, Germany). The subjects were divided
into three groups: a control group unexposed to PFOA (n = 10), a group exposed to
an environmentally relevant PFOA concentration (200 ng L
In the current investigation, 15 representative kidney specimens were collected
from 15 common carp, comprising 5 samples each from unexposed carp, carp exposed
to an environmentally relevant PFOA concentration (200 ng L
High-resolution color (RGB) images with dimensions of 2560
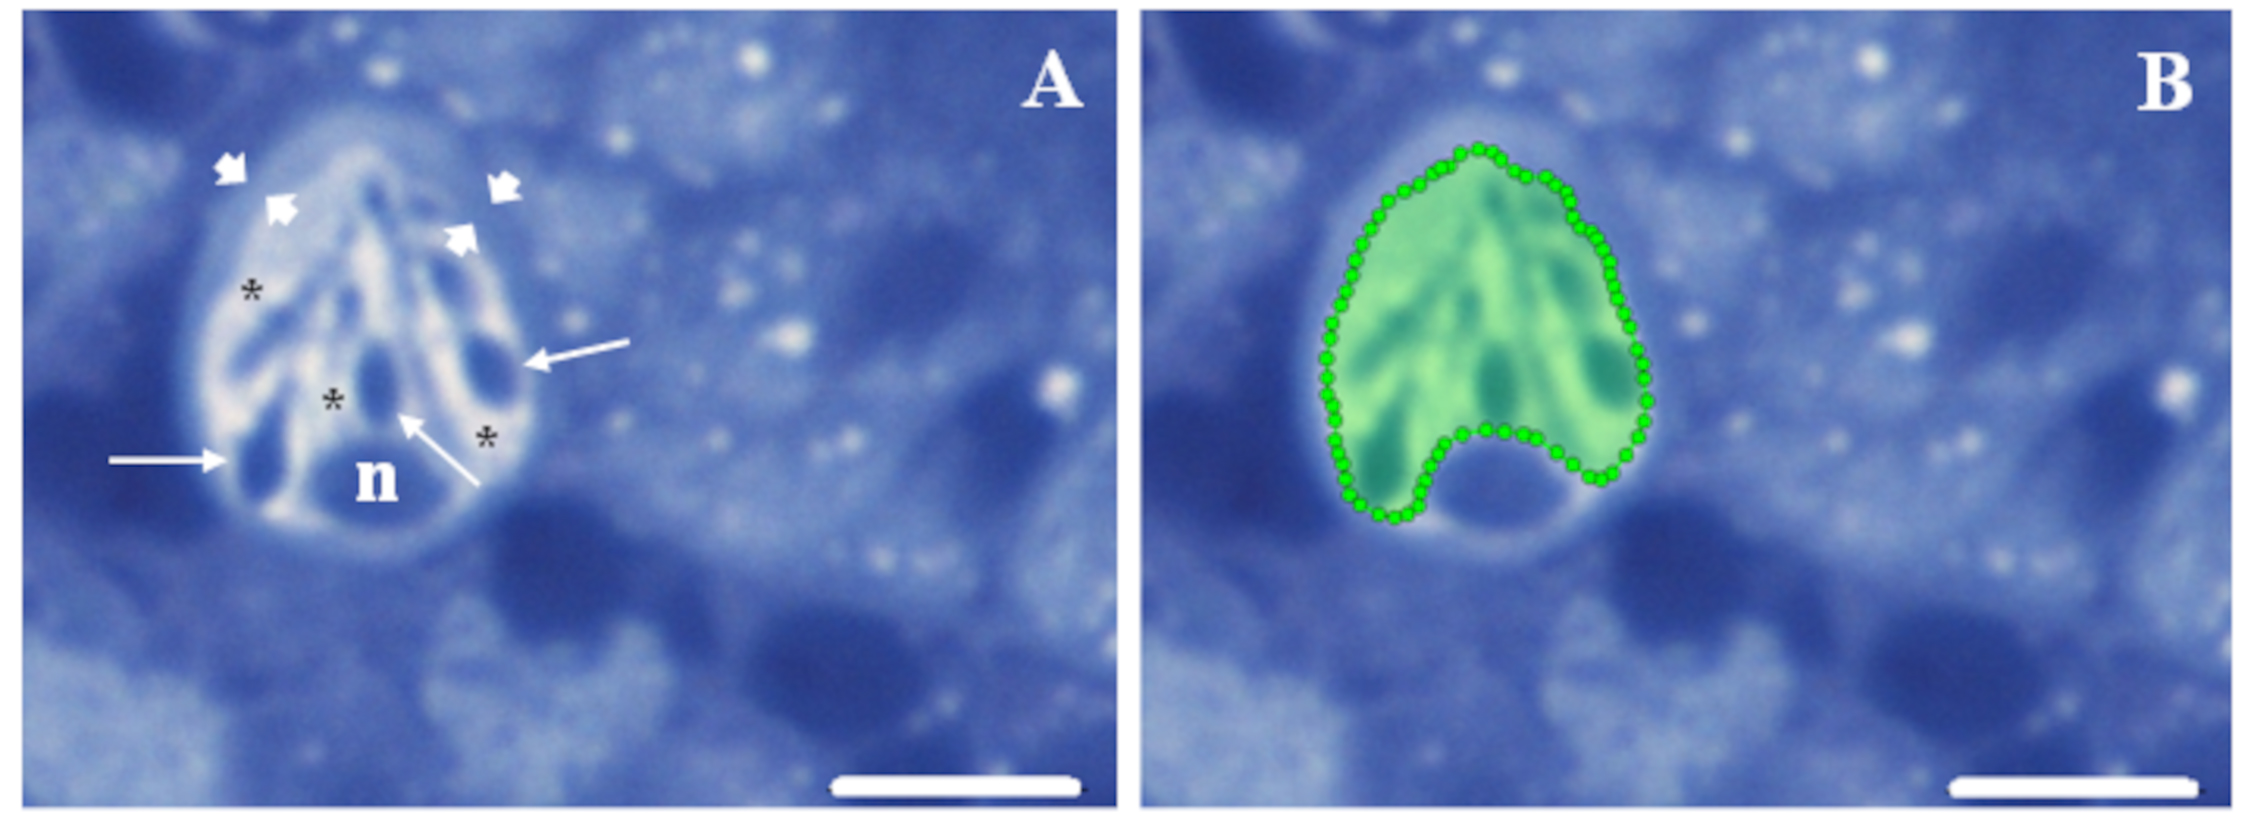 Fig. 1.
Region of interest selection procedure. (A) The peculiar
structural features of mature rodlet cells facilitate their detection within the
hematopoietic tissue. Key features include a polarized pear shape with the
nucleus (n) located at one extremity, typical rod-shaped granules, the so-named
rodlets (thin arrows), pointing towards the opposite extremity, and a notable
peripheral thickening of the cytoplasm, resembling a “capsule” (arrowheads).
These features are easily visible, along with the vesiculated aspect (asterisks)
of the rest of the cytoplasm, which is enhanced by perfluorooctanoic acid (PFOA)
exposure. (B) A region of interest (ROI) can be easily delineated using the
polygon selection tools in Icy, with the “capsule” serving as a guide to
encompass the cytoplasm while excluding the nucleus. Semithin kidney sections
from a fish exposed to 2 mg L
The selection of both first-order and second-order texture analysis methods was based on their complementary nature and their ability to provide comprehensive insights into cell degranulation, as reported in previous research [39, 40, 41].
Texture feature datasets underwent assessment for normal distribution and equality of variance using the Shapiro–Wilk test and Levene test, respectively. Subsequently, these features underwent linear discriminant analysis (LDA), stepwise analysis, and Mahalanobis distance using SPSS 14.0.2 (SPSS Inc., Chicago, IL, USA). LDA relies on the categorization of data into different classes or groups. By categorizing data, LDA can identify the most discriminative features or dimensions that separate these categories, leading to more accurate and efficient classification results [43]. Given that some texture features exhibited slight deviations from normality and/or homogeneity of variance, it’s worth noting that LDA is generally considered robust enough to accommodate such deviations. However, as a precaution, the dataset was reevaluated and confirmed following normalization transformations (including square-root and logarithmic transformations). Additionally, both a pooled covariance matrix and separate covariance matrices were employed, as suggested by Norušis (2005) [43].
The outcomes of the LDA applied to texture features are summarized visually in
Fig. 2 and detailed in Tables 1–3. These tables present classification results
for both the original and cross-validated cases. The LDA method achieved 98%
accuracy in correctly classifying cases, with only one false positive instance.
Specifically, one unexposed case was misclassified as exposed to 200 ng L
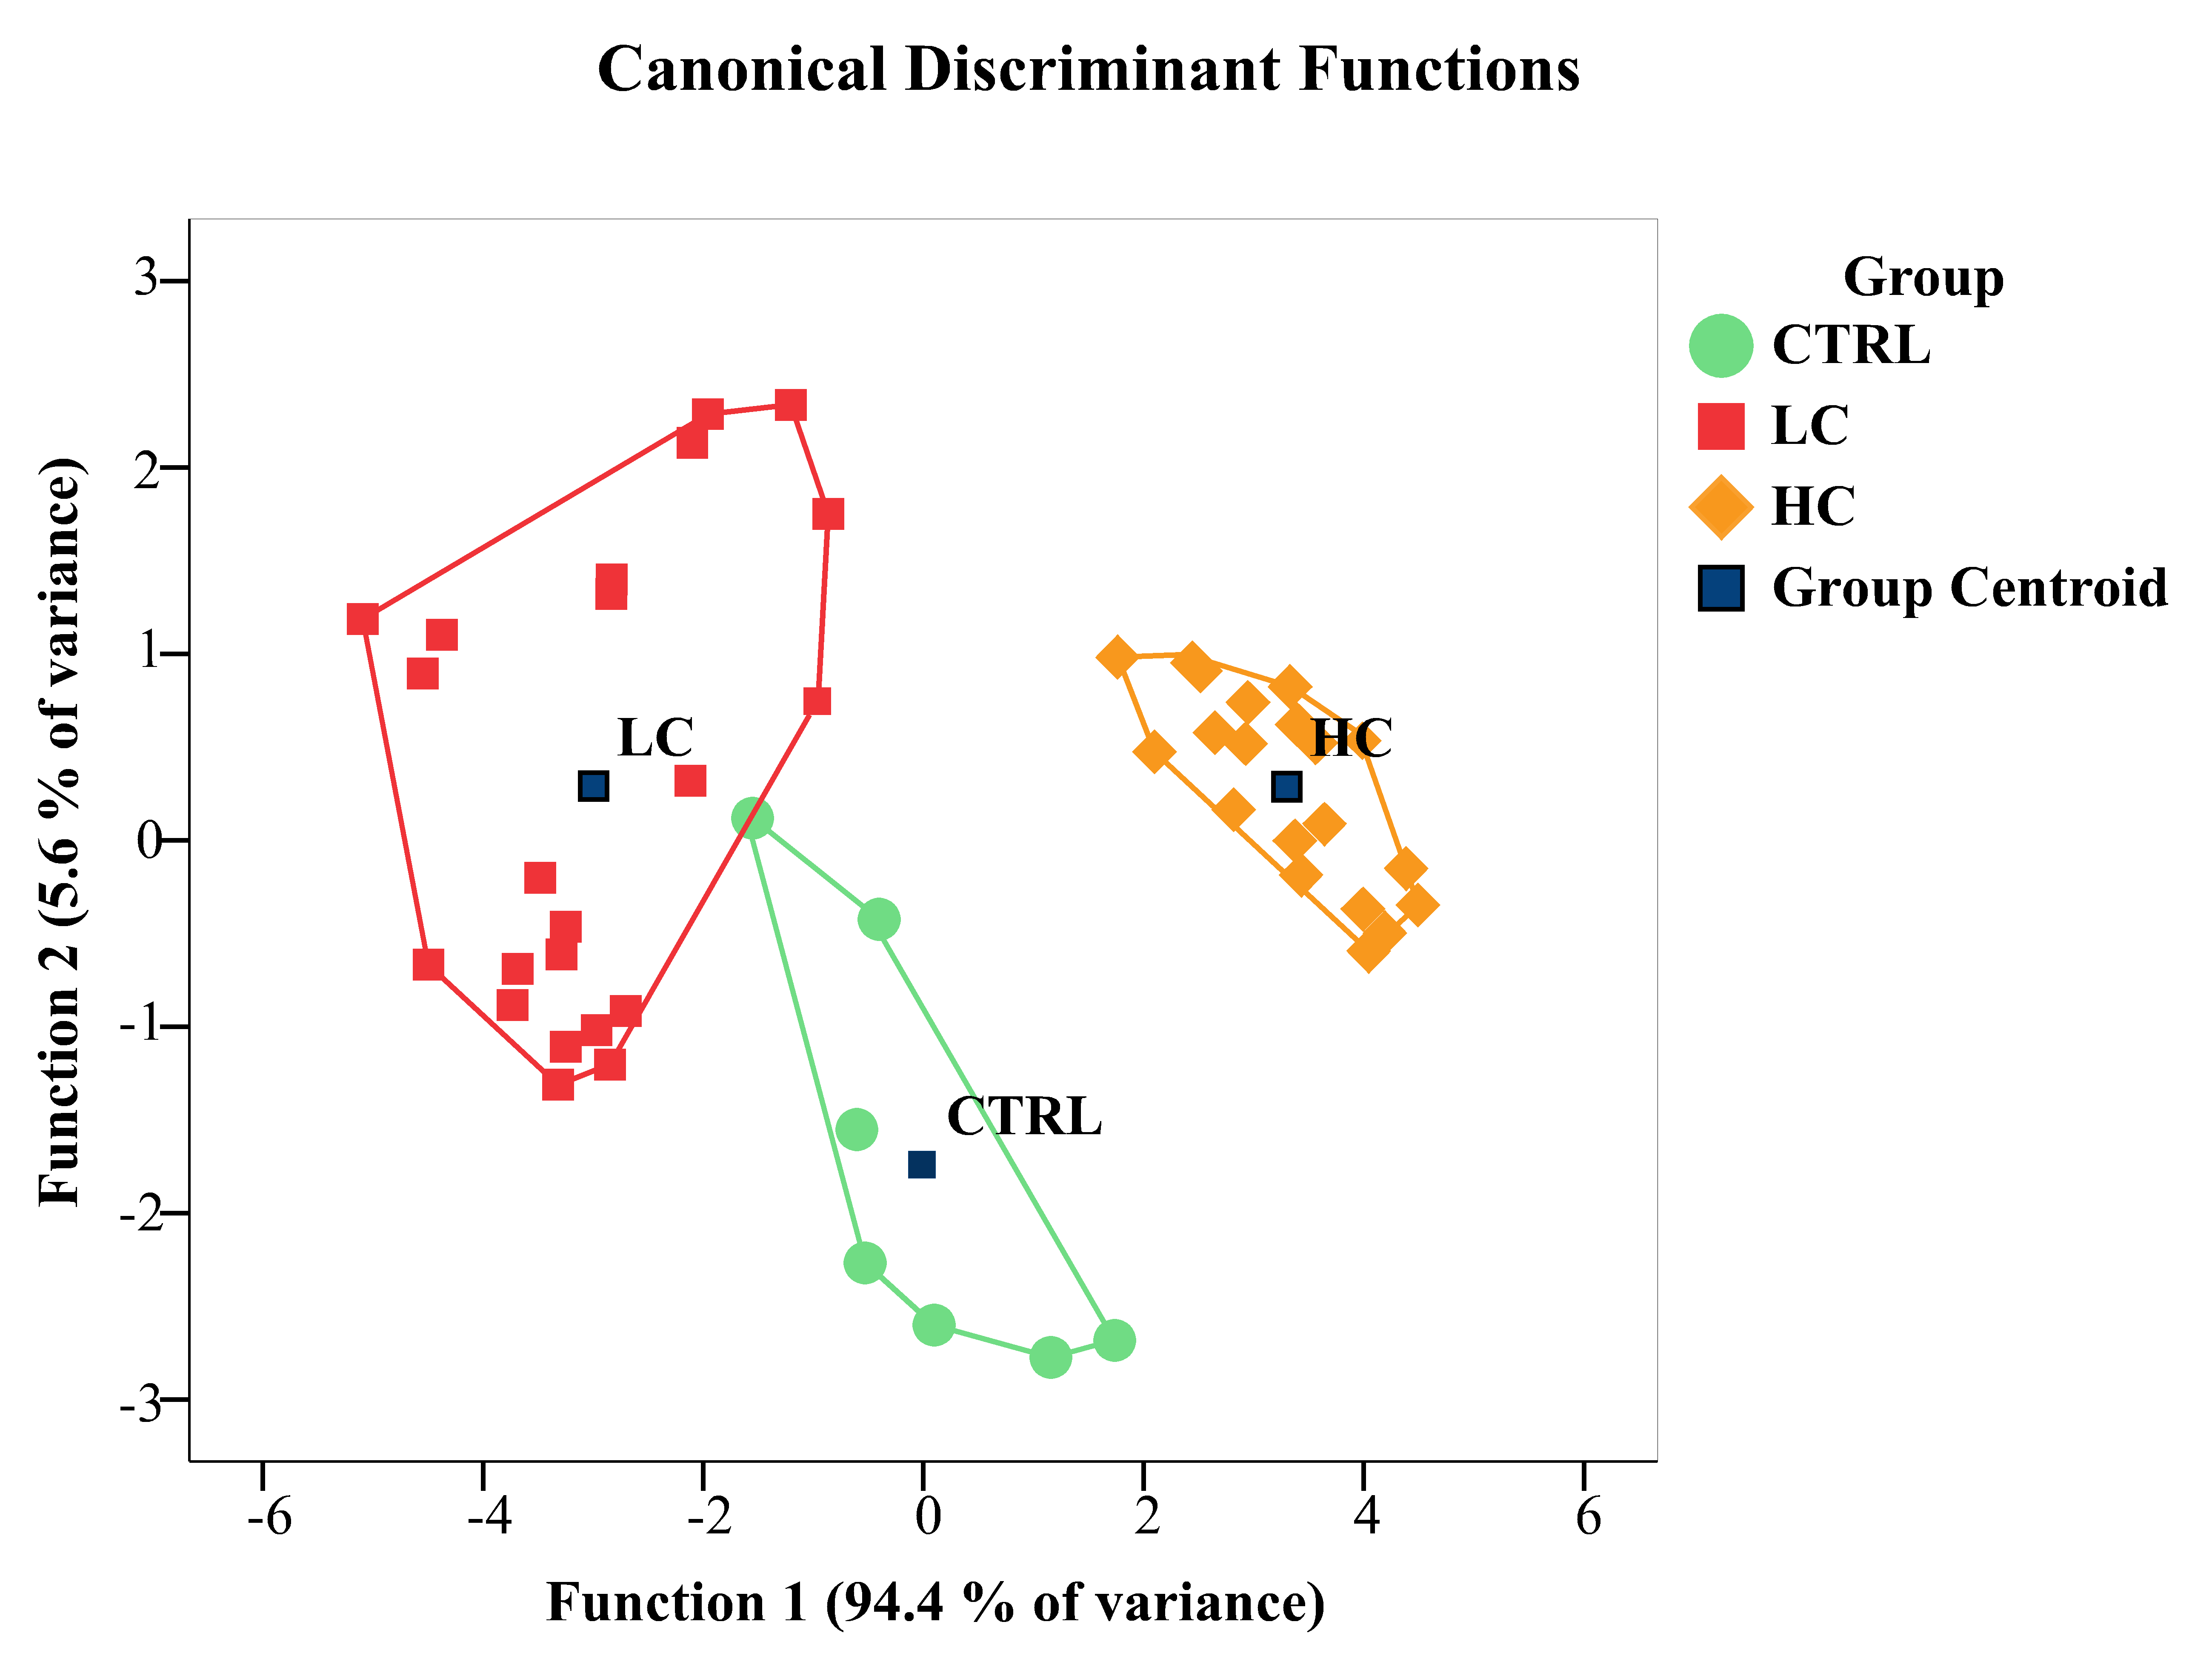 Fig. 2.
Canonical discriminant function plot. Group centroids are
represented as black squares. Individual samples, representing the cytoplasm
screened for texture features from each rodlet cell (RC), are indicated using
distinct symbols and colors, corresponding to their respective experimental
groups. Notably, the unexposed group’s convex hull partially overlaps with that
of the 200 ng L
| Step | Tolerance | F-to-Remove | Min. D Squared | Between Groups | |
| 1 | Max Intensity (ch 1) | 1.000 | 10.340 | ||
| 2 | Max Intensity (ch 1) | 0.263 | 35.547 | 0.005 | Ctrl and HD |
| Max Intensity (ch 2) | 0.263 | 71.044 | 0.190 | LD and HD | |
| 3 | Max Intensity (ch 1) | 0.259 | 15.230 | 3.895 | Ctrl and HD |
| Max Intensity (ch 2) | 0.249 | 54.387 | 3.145 | LD and HD | |
| Mean Intensity (ch 1) | 0.684 | 8.405 | 4.865 | Ctrl and LD | |
| 4 | Max Intensity (ch 1) | 0.225 | 7.323 | 8.835 | Ctrl and HD |
| Max Intensity (ch 2) | 0.217 | 59.681 | 3.246 | Ctrl and HD | |
| Mean Intensity (ch 1) | 0.485 | 17.692 | 6.478 | Ctrl and LD | |
| Standard Deviation (ch 1) | 0.396 | 11.580 | 5.939 | Ctrl and LD | |
| 5 | Max Intensity (ch 1) | 0.215 | 7.485 | 9.253 | Ctrl and HD |
| Max Intensity (ch 2) | 0.188 | 70.323 | 3.264 | Ctrl and HD | |
| Mean Intensity (ch 1) | 0.452 | 20.063 | 7.376 | Ctrl and LD | |
| Standard Deviation (ch 1) | 0.130 | 14.977 | 6.742 | Ctrl and LD | |
| Texture contrast (ch 0) | 0.187 | 4.261 | 10.651 | Ctrl and LD |
In this table, the variables retained at each step of the analysis, as
determined through stepwise analysis and Mahalanobis distance, are presented. The
table also includes the F value for the change in Wilk’s lambda. The default
values for F-to-enter and F-to-remove are set at 3.84 and 2.71, respectively. Ctrl signifies the control group without exposure to perfluorooctanoic acid (PFOA), LD denotes the low dosage group (200 ng L
| Step | Group | Unexposed | 200 ng L |
2 mg L | |
| 1 | Unexposed | F | 20.662 | 12.237 | |
| Sig. | 0.000 | 0.001 | |||
| 200 ng L |
F | 20.662 | 1.994 | ||
| Sig. | 0.000 | 0.165 | |||
| 2 mg L |
F | 12.237 | 1.994 | ||
| Sig. | 0.001 | 0.165 | |||
| 2 | Unexposed | F | 12.638 | 24.543 | |
| Sig. | 0.000 | 0.000 | |||
| 200 ng L |
F | 12.638 | 70.832 | ||
| Sig. | 0.000 | 0.000 | |||
| 2 mg L |
F | 24.543 | 70.832 | ||
| Sig. | 0.000 | 0.000 | |||
| 3 | Unexposed | F | 10.055 | 20.230 | |
| Sig. | 0.000 | 0.000 | |||
| 200 ng L |
F | 10.055 | 69.378 | ||
| Sig. | 0.000 | 0.000 | |||
| 2 mg L |
F | 20.230 | 69.378 | ||
| Sig. | 0.000 | 0.000 | |||
| 4 | Unexposed | F | 13.218 | 16.727 | |
| Sig. | 0.000 | 0.000 | |||
| 200 ng L |
F | 13.218 | 79.531 | ||
| Sig. | 0.000 | 0.000 | |||
| 2 mg L |
F | 16.727 | 79.531 | ||
| Sig. | 0.000 | 0.000 | |||
| 5 | Unexposed | F | 12.621 | 14.295 | |
| Sig. | 0.000 | 0.000 | |||
| 200 ng L |
F | 12.621 | 75.835 | ||
| Sig. | 0.000 | 0.000 | |||
| 2 mg L |
F | 14.295 | 75.835 | ||
| Sig. | 0.000 | 0.000 |
The pairwise group comparison at each step during the stepwise analysis is
reported, showing the improvement in discrimination at each step. PFOA, perfluorooctanoic acid.
| Group | Predicted Group Membership | Total | ||||
| Unexposed | 200 ng L |
2 mg L | ||||
| Original | Count | Unexposed | 6 | 1 | 0 | 7 |
| 200 ng L |
0 | 22 | 0 | 22 | ||
| 2 mg L |
0 | 0 | 20 | 20 | ||
| % | Unexposed | 85.7 | 14.3 | 0.0 | 100.0 | |
| 200 ng L |
0.0 | 100.0 | 0.0 | 100.0 | ||
| 2 mg L |
0.0 | 0.0 | 100.0 | 100.0 | ||
| Cross-validated |
Count | Unexposed | 6 | 1 | 0 | 7 |
| 200 ng L |
0 | 22 | 0 | 22 | ||
| 2 mg L |
0 | 0 | 20 | 20 | ||
| % | Unexposed | 85.7 | 14.3 | 0.0 | 100.0 | |
| 200 ng L |
0.0 | 100.0 | 0.0 | 100.0 | ||
| 2 mg L |
0.0 | 0.0 | 100.0 | 100.0 | ||
In this table, the classification results achieved through the Mahalanobis
distance stepwise method are presented. The results demonstrate a 98% correct
classification rate for both original and cross-validated cases, with only one
false positive case. Specifically, an unexposed case was misclassified as exposed
to 200 ng L
The exploration of RC degranulation in response to toxic exposure remains
relatively unexplored in the scientific literature, barring a prior qualitative
structural and ultrastructural study conducted in carp from the current
experimental cohort [8]. This earlier investigation specifically examined RC
distribution and exocytosis patterns using light and transmission electron
microscopy, along with biometric measurements quantifying RCs within the
hematopoietic tissue [8]. The findings from that study revealed that even at a
concentration as low as 200 ng L
In the present investigation, the aforementioned qualitative findings were validated through an objective approach utilizing texture analysis of cytoplasm and subsequent statistical analysis employing LDA. The grayscale variations from all three RGB channels, represented by the most discriminatory texture features, effectively summarized the structural and ultrastructural variations among the experimental groups, as documented in the preceding study [8]. More specifically, the ultrastructural changes induced by PFOA in RC cytoplasm, which manifest as the clearer and more vesiculated aspect observable under light microscopy, gave rise to a distinctive grayscale distribution pattern, commonly referred to as texture. This texture pattern was unique to each experimental group and served as a reliable discriminative feature among them.
As previously mentioned, the fish in this study were derived from a prior experimental cohort that used toluidine blue as the staining method for ultrathin sections. Intriguingly, despite the application of a predominantly monochromatic stain, all three RGB channels contributed to the discrimination among experimental groups, suggesting potential avenues for further research involving polychromatic staining techniques and/or testing across multiple wavelengths spanning a wide spectral range, as seen in hyperspectral microscopy. Nevertheless, it is imperative to emphasize that the primary objective of this study was not to identify absolute discriminant values for use as reference points. Rather, it aimed to propose a dependable and objective method for comparing samples against a known control, facilitating the objective characterization of changes induced by degranulation in RC cytoplasm, to be used in toxicologic and environmental pathology studies.
RCs have been acknowledged as essential components of the fish’s innate immune system, as evidenced by previous studies [7, 24, 27, 28]. Furthermore, degranulation of RCs has been observed in association with various noxious agents, including toxic substances [7, 8, 44, 45]. As degranulation is a crucial mechanism through which immune cells interact with their environment, encompassing host cells, tissues, and pathogens [46], its induction by toxics deserves considerable attention, especially concerning its potential impact on immunocompetence [7, 8]. This underscores the importance of employing reliable tools to assess RC degranulation. Notably, texture analysis and LDA have previously demonstrated their effectiveness in characterizing mast cell degranulation in fish [39, 40, 41].
In conclusion, this study has focused on exploring RC degranulation in response to PFOA exposure, employing texture analysis in combination with LDA to objectively characterize grayscale differences in RC cytoplasm among experimental groups. The quantitative analyses conducted have demonstrated the efficacy of these methods in discerning subtle changes induced by RC degranulation due to PFOA exposure.
Significantly, the findings underscore the unique capability of LDA in distinguishing among experimental groups based on distinctive texture features derived from RC cytoplasm. These observations highlight discernible variations in RC characteristics consequent to PFOA exposure, aligning with known immunotoxic effects associated with such contaminants.
The results of this study suggest that texture analysis coupled with LDA serves as a powerful tool for objectively assessing contaminant-induced alterations in cellular structures. By providing insights into immunotoxicity mechanisms, this research potentially contributes to the development of robust methodologies applicable to toxicological and environmental pathology research.
Ultimately, this research has the potential to impact public health policies by enhancing the ability to objectively evaluate the effects of environmental contaminants on cellular morphology, thereby contributing significantly to the broader field of environmental health and toxicology.
The datasets used and/or analyzed during the current study are available from the corresponding author on reasonable request.
The single author had the sole role in designing, data collecting, analyzing, and writing the manuscript. MM read and approved the final manuscript. MM has participated sufficiently in the work and agreed to be accountable for all aspects of the work.
Not applicable, as fish samples were sourced from a prior experiment [42], adhering to the Italian regulations for animal research in place at that time, with a primary aim of reducing suffering, stress, and discomfort. Consequently, no fish were deliberately sacrificed for the present study.
The author is grateful to Luisa Giari for technical help.
This research received no external funding.
The author declares no conflict of interest. Given the role as Guest Editor, Maurizio Manera had no involvement in the peer-review of this article and has no access to information regarding its peer-review. Full responsibility for the editorial process for this article was delegated to Gea Oliveri Conti.
Publisher’s Note: IMR Press stays neutral with regard to jurisdictional claims in published maps and institutional affiliations.