IMR Press / FBL / Volume 29 / Issue 2 / DOI: 10.31083/j.fbl2902049
Open Access Original Research
Myogenin Regulates DUSP13 to Inhibit Apoptosis Induced by Reactive Oxygen Species
Show Less
1 Department of Cardiovascular Surgery, Guangdong Cardiovascular Institute, Guangdong Provincial People’s Hospital, Guangdong Academy of Medical Sciences, 510080 Guangzhou, Guangdong, China
2 Guangdong Provincial Key Laboratory of South China Structural Heart Disease, 510080 Guangzhou, Guangdong, China
3 School of Medicine South China University of Technology, 510006 Guangzhou, Guangdong, China
4 School of Medical Imaging, Tianjin Medical University, 300203 Tianjin, China
5 Guangdong Beating Origin Regenerative Medicine Co., Ltd., 528231 Foshan, Guangdong, China
6 Pen-Tung Sah Institute of Micro-Nano Science and Technology, Xiamen University, 361102 Xiamen, Fujian, China
7 Guangdong Provincial First Disabled Veterans Hospital, 510260 Guangzhou, Guangdong, China
*Correspondence: jamesofsolar@163.com (Jianzheng Cen); zhuangjian5413@163.com (Jian Zhuang)
These authors contributed equally.
Front. Biosci. (Landmark Ed) 2024, 29(2), 49; https://doi.org/10.31083/j.fbl2902049
Submitted: 21 June 2023 | Revised: 21 November 2023 | Accepted: 11 December 2023 | Published: 4 February 2024
Copyright: © 2024 The Author(s). Published by IMR Press.
This is an open access article under the CC BY 4.0 license.
Abstract

Background: Myogenin is well known as a crucial transcription factor in skeletal muscle development, yet its other biological functions remain unexplored. Previous research showed that myogenin suppresses apoptosis induced by angiotensin II in human induced pluripotent stem cell-derived cardiomyocytes, and offered a new perspective on myogenin’s role in cardioprotection. However, the detailed mechanism of this cardioprotection, especially under oxidative stress, is still unclear. Methods: In this study, hydrogen peroxide (H2O2) was used to generate reactive oxygen species in myogenin-overexpressing cardiomyocytes. The apoptosis was examined by flow cytometry. Transcriptome sequencing (RNA-seq) was performed to identify genes regulated by myogenin. Western blotting was used to detect the protein level of DUSP13 and the phosphorylation level of p38 mitogen-activated protein kinase (MAPK). The dual-luciferase reporter assay and ChIP assay were used to confirm the binding of myogenin to the promoter region of DUSP13. DUSP13 overexpression and knockdown assays were performed to study its anti-apoptotic role. Results: Flow cytometry analysis of apoptosis showed that overexpressing myogenin for 24 and 48 hours decreased the apoptotic ratio by 47.9% and 63.5%, respectively, compared with untreated controls. Transcriptome sequencing performed on cardiomyocytes that expressed myogenin for different amounts of time (6, 12, 24, and 48 hours) identified DUSP13 as being up-regulated by myogenin. Western blotting showed that overexpression of myogenin increased the expression of DUSP13 and decreased the phosphorylation level of p38 MAPK. A dual-luciferase reporter assay proved that myogenin bound directly to the promoter region of DUSP13 and led to strong relative luciferase activity. Direct expression of DUSP13A and DUSP13B significantly reduced the rates of apoptosis and necrosis in cells treated with H2O2. Knockdown of DUSP13B significantly increased the rate of apoptosis in cells treated with H2O2. Conclusions: The present findings suggest that myogenin might attenuate apoptosis induced by reactive oxygen species by up-regulating DUSP13 and inactivating the p38 MAPK pathway.

Keywords
myogenin
DUSP13
reactive oxygen species
p38 MAPK pathway
apoptosis
cardiomyocyte
1. Introduction

Oxidative stress plays a critical role in the development and progression of cardiovascular disease [1]. In myocytes under oxidative stress, increased intracellular production of reactive oxygen species (ROS) causes cardiac pathogenic effects including apoptosis [2, 3], autophagy [4], aging [5], hypertrophy [6], fibrosis [7], and myocardial remodeling [8]. Accumulating evidence suggests that ROS are involved in the pathophysiology of heart failure [8]; elevated ROS levels were detected in patients with heart failure [9, 10]. Indeed, ROS mediate many heart failure-related pathways [11]. For example, the angiotensin II (Ang II) signaling pathway promotes NAD(P)H oxidase-dependent ROS generation through binding to the type 1 Ang II receptor. The increased ROS activates the Ca2+/calmodulin-dependent protein kinase II delta [12, 13], which in turn triggers the p38 MAPK pathway and eventually leads to cardiomyocyte apoptosis [11, 14].

Myogenin, a basic helix-loop-helix myogenic transcription factor, is known to play an essential role in skeletal muscle development, and most studies have focused on its function in myoblast or satellite cells during myogenesis and muscle regeneration [15]. Myogenin is indispensable: MyoG-null mice suffer severe muscle disruption and perinatal lethality [16]. On the other hand, myogenin-overexpressed mice also show high rates of neonatal mortality, although mice that survive into adulthood show no obvious muscle abnormalities [17]. Our previous studies demonstrated that myogenin inhibited apoptosis induced by Ang II in human induced pluripotent stem cell-derived cardiomyocytes [18]. Although RNA-seq data revealed that the expression levels of inflammatory response-related genes were downregulated by a 6-day induction with myogenin [18], the detailed mechanism of its anti-apoptotic effect is not well understood. It is known that excess intracellular ROS causes DNA strand breaks and mitochondrial damage followed by activation of protein kinases, such as MAPK, to initiate apoptosis-related signaling pathways [8, 19]. Therefore we hypothesize that myogenin might exert its cardioprotective effects via ROS-related pathways.

To investigate this hypothesis, cardiomyocytes overexpressing myogenin were treated with hydrogen peroxide (H2O2) and then apoptosis was examined. Differentially expressed genes (DEGs) were detected by RNA-seq and compared across different myogenin expression times (6, 12, 24, and 48 hours) to identify key genes regulated by myogenin. The results support a mechanism by which myogenin protects cardiomyocytes from ROS-induced apoptosis through the upregulation of dual specificity phosphatase 13 (DUSP13).

2. Materials and Methods
2.1 Cell Culture

Human cardiomyocytes (hCMs) (BFN608007121, Bluefbio Biotechnology Development Co., Ltd., Shanghai, China) were plated on gelatin-coated plates (V900863, Sigma, Darmstadt, Germany), and then cultured in D10 medium: DMEM medium (C22400500BT, Gibco, Shanghai, China) supplemented with 10% fetal bovine serum (fsp500, Excell BIO, Shanghai, China), 1× Nonessential Amino Acid (N1250, Solarbio, Beijing, China), and 1× Penicillin-Streptomycin Solution (P1400, Solarbio). The culture medium was changed every two days. Cells were passaged until they reached 80–90% confluence and were then digested in a trypsin-EDTA solution (T1320, Solarbio) at a ratio of 1:2–1:3. Doxycycline hyclate (Dox, 2 µg/mL) (D9891, Sigma, St. Louis, MO, USA) was used to induce myogenin expression, and an equal volume of dimethyl sulfoxide (DMSO) was added to the culture medium of controls. To induce apoptosis, cells were exposed to 1 mM H2O2 for 4 hours. In the knockdown assay, cells were exposed to 500 µM H2O2 for 4 hours. All cell lines were validated by STR profiling and tested negative for mycoplasma. Cells were all cultured in a humidified incubator at 37 °C and 5% CO2.

2.2 Generation of hCMMYOG Cell Lines

The plasmid pCW-Cas9-Blast (83481, Addgene, Watertown, MA, USA) was modified by removing Cas9 cDNA and replacing the blasticidin S resistance gene with a puromycin resistance gene. Then human MYOG cDNA and an enhanced green fluorescent protein (EGFP) gene, which was linked by a T2A sequence, were subcloned into the plasmid. Lentivirus was prepared using a third-generation lentivirus packaging system as described elsewhere [18]. After 24 hours of transduction, the medium was replaced with fresh D10 medium supplemented with Dox (to induce myogenin expression) or DMSO (controls). After 2 days of induction, EGFP expression was observed by fluorescence microscopy, and the EGFP-positive cells were sorted by flow cytometry (FACSAria III, BD Biosciences, San Jose, CA, USA) and cultured further in D10 medium. After 5–7 days of incubation, single clones were picked at random for further expansion, to be used in the following experiments.

2.3 Immunofluorescence Staining

Cells were fixed with 4% paraformaldehyde at room temperature for 20 minutes and washed three times with 1×PBS, then permeabilized with 1×PBS containing 0.25% Triton X-100 at room temperature for 10 minutes. After incubating in the blocking buffer (1×PBS with 10% goat serum) at 37 °C for 1 hour, cells were incubated with recombinant anti-myogenin antibody (ab124800, Abcam, Cambridge, MA, USA; 1:250 dilution) at 4 °C overnight. After washing three times with 1×PBS containing 0.1% Triton X-100, cells were incubated with goat anti-rabbit IgG (H+L) cross-adsorbed secondary antibody (A-21428, Invitrogen, Eugene, OR, USA; 1:500 dilution) at 37 °C for 1 hour. Nuclei were labeled with Hoechst 33342 (C1022, Beyotime, Shanghai, China; final concentration: 5 µg/mL) in the dark for 5 minutes. Images were obtained using an inverted fluorescence microscope (MF52-N, Mshot, Guangzhou, China).

2.4 Reverse Transcription and Quantitative Real-Time PCR

Total RNA was isolated from cells using the EZ-10 Total RNA Mini-Preps Kit (B618583-0100, Sangon Biotech, Shanghai, China) followed by treatment with RNase-Free DNase (B618253, Sangon Biotech). cDNA was synthesized using the Hifair®Ⅲ 1st Strand cDNA Synthesis Kit (11139ES60, YEASEN, Shanghai, China). Quantitative real-time PCR was performed using a Light Cycler® 480 (Roche) with TB Green® Fast qPCR Mix (RR430B, Takara, Beijing, China). Data were analyzed by the relative standard curve method and normalized to GAPDH. Quantitative PCR primers and their sequences, designed by Primer3 [20], are listed below (from 5 to 3):

MYOG-RT-F: GCCCAAGGTGGAGATCCT;

MYOG-RT-R: GGTCAGCCGTGAGCAGAT;

FOXA3-RT-F: TGGGCTCAGTGAAGATGGAG;

FOXA3-RT-R: GGGGATAGGGAGAGCTTAGAG;

ATOH8-RT-F: GAGATCAAAGCCCTGCAGC;

ATOH8-RT-R: TCGGCACTGTAGTCAAGGTC;

DUSP13-RT-F: CTTCCCCAACCGAGGCTT;

DUSP13-RT-R: CAGGGAGTAAGGACCAGCTC;

GAPDH-RT-F: CGCTCTCTGCTCCTCCTGTT;

GAPDH-RT-R: CCATGGTGTCTGAGCGATGT.

2.5 Apoptosis Detection

Apoptosis was detected using APC annexin V (640920, Biolegend, San Diego, CA, USA). Cells were seeded into 6-well plates with 5 × 10⁵ cells per well. After treatment, cells were digested by a trypsin-EDTA solution (T1320, Solarbio) and then washed twice with cold cell-staining buffer (420201, Biolegend). Cells were then resuspended in 100 µL annexin V binding buffer (422201, Biolegend) containing 5 µL APC annexin V, and incubated at room temperature for 15 minutes. After adding 400 µL of annexin V binding buffer to each tube, samples were analyzed on the NovoCyte D2040R (Agilent, Beijing, China).

2.6 Western Blotting

Cells were washed twice with ice-cold 1×PBS, then lysed using RIPA buffer (R0010, Solarbio, Beijing, China) supplemented with 1×phosphatase inhibitor cocktail (B15001, Bimake, Houston, TX, USA) and 1×protease inhibitor cocktail (B14001, Bimake, Houston, TX, USA). Lysates were scraped from the plates, then centrifuged at 12,000 ×g at 4 °C for 15 minutes. Protein concentration was determined using a modified Bradford protein assay kit (C503041, Sangon, Shanghai, China). Equal amounts of protein were separated by SDS-PAGE and transferred onto polyvinylidene fluoride membranes (ISEQ00010, Merck-Millipore, Darmstadt, Germany). The membranes were blocked with 5% nonfat milk at room temperature for 1 hour. Next, membranes were incubated with an appropriate dilution of primary antibodies at 4 °C overnight, followed by incubation with secondary antibodies. Protein expression levels were measured using the StarSignal Plus Chemiluminescent Assay Kit (E170, GeneStar, Beijing, China), and bands were observed using a gel detection system (Tanon 5200, Shanghai, China). The following antibodies were used [dilution, species, catalog number, company, city, country]: DUSP13-M1 (N-term) [1:1000, rabbit, AP8455a, Abcepta, Suzhou, China], GAPDH [1:2500, rabbit, AF1186, Beyotime], p38 MAPK (D13E1) [1:1000, rabbit, 8690T, CST, Danvers, MA, USA], Phospho-p38 MAPK (Thr180/Tyr182) (D3F9) [1:1000, rabbit, 4511T, CST, Danvers, MA, USA], Beta Actin [1:50,000, mouse, 66009-1, Proteintech, Rosemont, IL, USA], and HRP-conjugated affinipure goat anti-rabbit IgG (H+L) [1:5000, goat, SA00001-2, Proteintech, Rosemont, IL, USA].

2.7 Dual Luciferase Reporter Assay

Potential binding sites of myogenin in the DUSP13 promoter region (–2500 to 0 bp) were predicted by the JASPAR database [21]. Fragments with different lengths of DUSP13 promoter were amplified from the genomic DNA of hCMs via PCR. The mutant (Mut) sequence of the DUSP13 promoter was synthesized by Sangon Biotech. These DNA fragments were then subcloned into the pGL6-TA luciferase reporter vector (D2105, Beyotime). MYOG cDNA was subcloned into the expression vector pCMV-N-Myc-Puro (D2791, Beyotime). HEK293T cells were transfected with luciferase reporter vectors, Renilla pRLTK control reporter vector (D2760, Beyotime), and MYOG expression vector using the EZ-Trans transfection reagent (AC04L071, Life-iLab, Shanghai, China). After 48 hours of transfection, Dual-Lumi™ Luciferase Reporter Gene Assay Kit (RG089S, Beyotime) was used to detect luciferase activity. Each experiment was performed in triplicate. Results are shown as firefly luciferase activity normalized to Renilla luciferase activity. The PCR primers are listed below (from 5 to 3):

DUSP13-HindIII-R: GTAAGCTTGTCATTTCTCCTTCCCAG;

DUSP13-500-XhoI-F: TACTCGAGCCTGACCTCCGTAATTCAGAG;

DUSP13-1000-XhoI-F: AACTCGAGCGTCTCCCCATTTGACAT;

DUSP13-1350XhoI-F: AACTCGAGCGACTTCAATGGTTCTGA;

DUSP13-1500-XhoI-F: AACTCGAGCTGTATTTTCCTCACTCC;

DUSP13-2500-XhoI-F: AACTCGAGAGTTCGACAACCTCCATTTG.

2.8 ChIP Assay

ChIP assay was performed using the Pierce™ Magnetic ChIP Kit (26157, Thermo Scientific, Eugene, OR, USA). Cells were first treated with 2 µg/mL Dox for 72 hours to induce myogenin expression, then cross-linked with 1% formaldehyde for 10 minutes at room temperature and incubated with a final concentration of 0.2 M glycine for 5 minutes to terminate cross-linking. After washing with PBS, cells were collected and resuspended in Membrane Extraction Buffer on ice for 10 minutes. The cell lysates were resuspended in MNase Digestion Buffer Working Solution supplemented with MNase (10 U/µL) for chromatin digestion (37 °C, 15 minutes), and the digestion was terminated by adding MNase Stop Solution for 5 minutes on ice. Lysates were sonicated on ice using 3 W power for three 20 s-pulses (JY92-IIN, SCIENTZ, Ningbo, China). One-tenth of supernatant was used as Input. The remaining solution was divided into 3 fractions and incubated with antibodies overnight at 4 °C (Negative control IP: 1–2 µL of Rabbit IgG (included in the kit); Target-specific IP: 10 µg Myogenin Rabbit pAb (A17427, Abclonal, Wuhan, China). Magnetic beads (20 µL) were added to each IP sample and incubated at 4 °C for 2 hours. The beads were collected by a magnetic scaffold, washed three times with IP Wash Buffer I, once with IP Wash Buffer II, then mixed with IP Elution Buffer. Sodium chloride (5 M) and Proteinase K (20 mg/mL) were added to the supernatant to remove staining and protein cross-linking. DNA was purified using a DNA Clean-Up column. ChIP DNA was detected by qPCR using TB Green® Fast qPCR Mix (RR430A, TaKaRa). The primers specific for PBS3, PBS4, and PBS5 are as followed (from 5 to 3):

PBS3-F: TGTCAGACCCAGCATGTCCT;

PBS3-R: TGCAAGTCAGCTACCACCCT;

PBS4-F: CCTCTGCACCCTGGATCTCT;

PBS4-R: AAGGACATGCTGGGTCTGAC;

PBS5-F: GGTCTTGTCCACTCCAGAGGC;

PBS5-R: CCTCTGTGGTCACTCCTCTCT.

2.9 Cell Viability and Apoptosis Assay

DUSP13A and DUSP13B cDNA were subcloned into the expression vector pcDNA3.1 (HG-VPI0001, HonorGene, Changsha, China). HCMs were seeded into 6-well plates with 2.5 × 10⁵ cells per well and cultured for 24 hours. The cells were transiently transfected with DUSP13 expression vectors or an empty vector using the TransIT®-LT1 transfection reagent (MIR2300, Mirus, Madison, WI, USA). After H2O2 treatment, cells were trypsinized, washed twice with cold cell-staining buffer (420201, Biolegend), and then stained with APC annexin V (640920, Biolegend, San Diego, CA, USA) and 7-AAD (420403, Biolegend). Samples were incubated with a staining reagent for 15 minutes in the dark at room temperature, then analyzed by NovoCyte D2040R (Agilent). The PCR primers are listed below (from 5 to 3):

DUSP13A-NheI-F: TATAGCTAGCACCATGGCTGAGACCTCTCTCC;

DUSP13A-BamhI-R: TATAGGATCCTCAGCTCTGGCCGGCAC;

DUSP13B-NheI-F: TAGCTAGCACCATGGACTCACTGCAGAAGCAG;

DUSP13B-BamhI-R: TATAGGATCCTCAGAACCGCCCCGTCTCC.

2.10 RNA-Seq

RNA-seq was performed by Novogene Co., Ltd., in three biological replicates for each group. 150-bp paired-end RNA-seq reads were obtained from the Illumina sequencing platform. First, adaptors and low-quality bases were trimmed by Trim Galore (https://www.bioinformatics.babraham.ac.uk/projects/trim_galore/). Then, gene expression was quantified by Kallisto [22] and the GENCODE database (v32). DESeq2 [23] was used to identify DEGs. The list of significant DEGs was defined at a false discovery rate (FDR) <0.05 and |log2(Fold Change)| >1. Toppfun [24] was used to detect enriched gene ontology (GO) terms for each DEG list. Raw RNA-seq data have been submitted to GEO, and the accession number is pending.

2.11 siRNA Silencing

According to the mRNA sequence of human DUSP13B gene (Accession number: NM_016364.3), we obtained three small interfering RNA (siRNA). The sequences are shown in Supplementary Table 1. All sequences were synthesized by Genomeditech Company (Shanghai, China) Co., Ltd. Knockdown efficiency was evaluated by western blotting and siRNA-1 was selected to perform the knockdown assay.

HCMMYOG were seeded into 6-well plates with 2 × 10⁵ cells per well and cultured for 24 hours. The cells were transfected with siRNA-1 or negative control siRNA using the TransIT®-LT1 transfection reagent (MIR2300, Mirus, Madison, WI, USA). After 72 hours of siRNA transfection, the cells were treated with 500 µM H2O2 for 4 hours. After treatment, cells were trypsinized, washed twice with cold cell-staining buffer (420201, Biolegend), and then stained with APC annexin V (640920, Biolegend). Samples were incubated with a staining reagent for 15 minutes in the dark at room temperature, then analyzed by NovoCyte D2040R (Agilent).

2.12 Statistics

Values are expressed as mean ± standard deviation. Statistical significance was calculated in SPSS Statistics (v.21, IBM, Armonk, NY, USA) using one-way ANOVA with Bonferroni correction, or Student’s t-test. p < 0.05 was considered statistically significant.

3. Results
3.1 Myogenin Suppresses Apoptosis Induced by H2O2 in Cardiomyocytes

To obtain stable cell lines expressing myogenin, an hCM cell line in which the expression of myogenin could be modulated by a Tet-On system (hCM
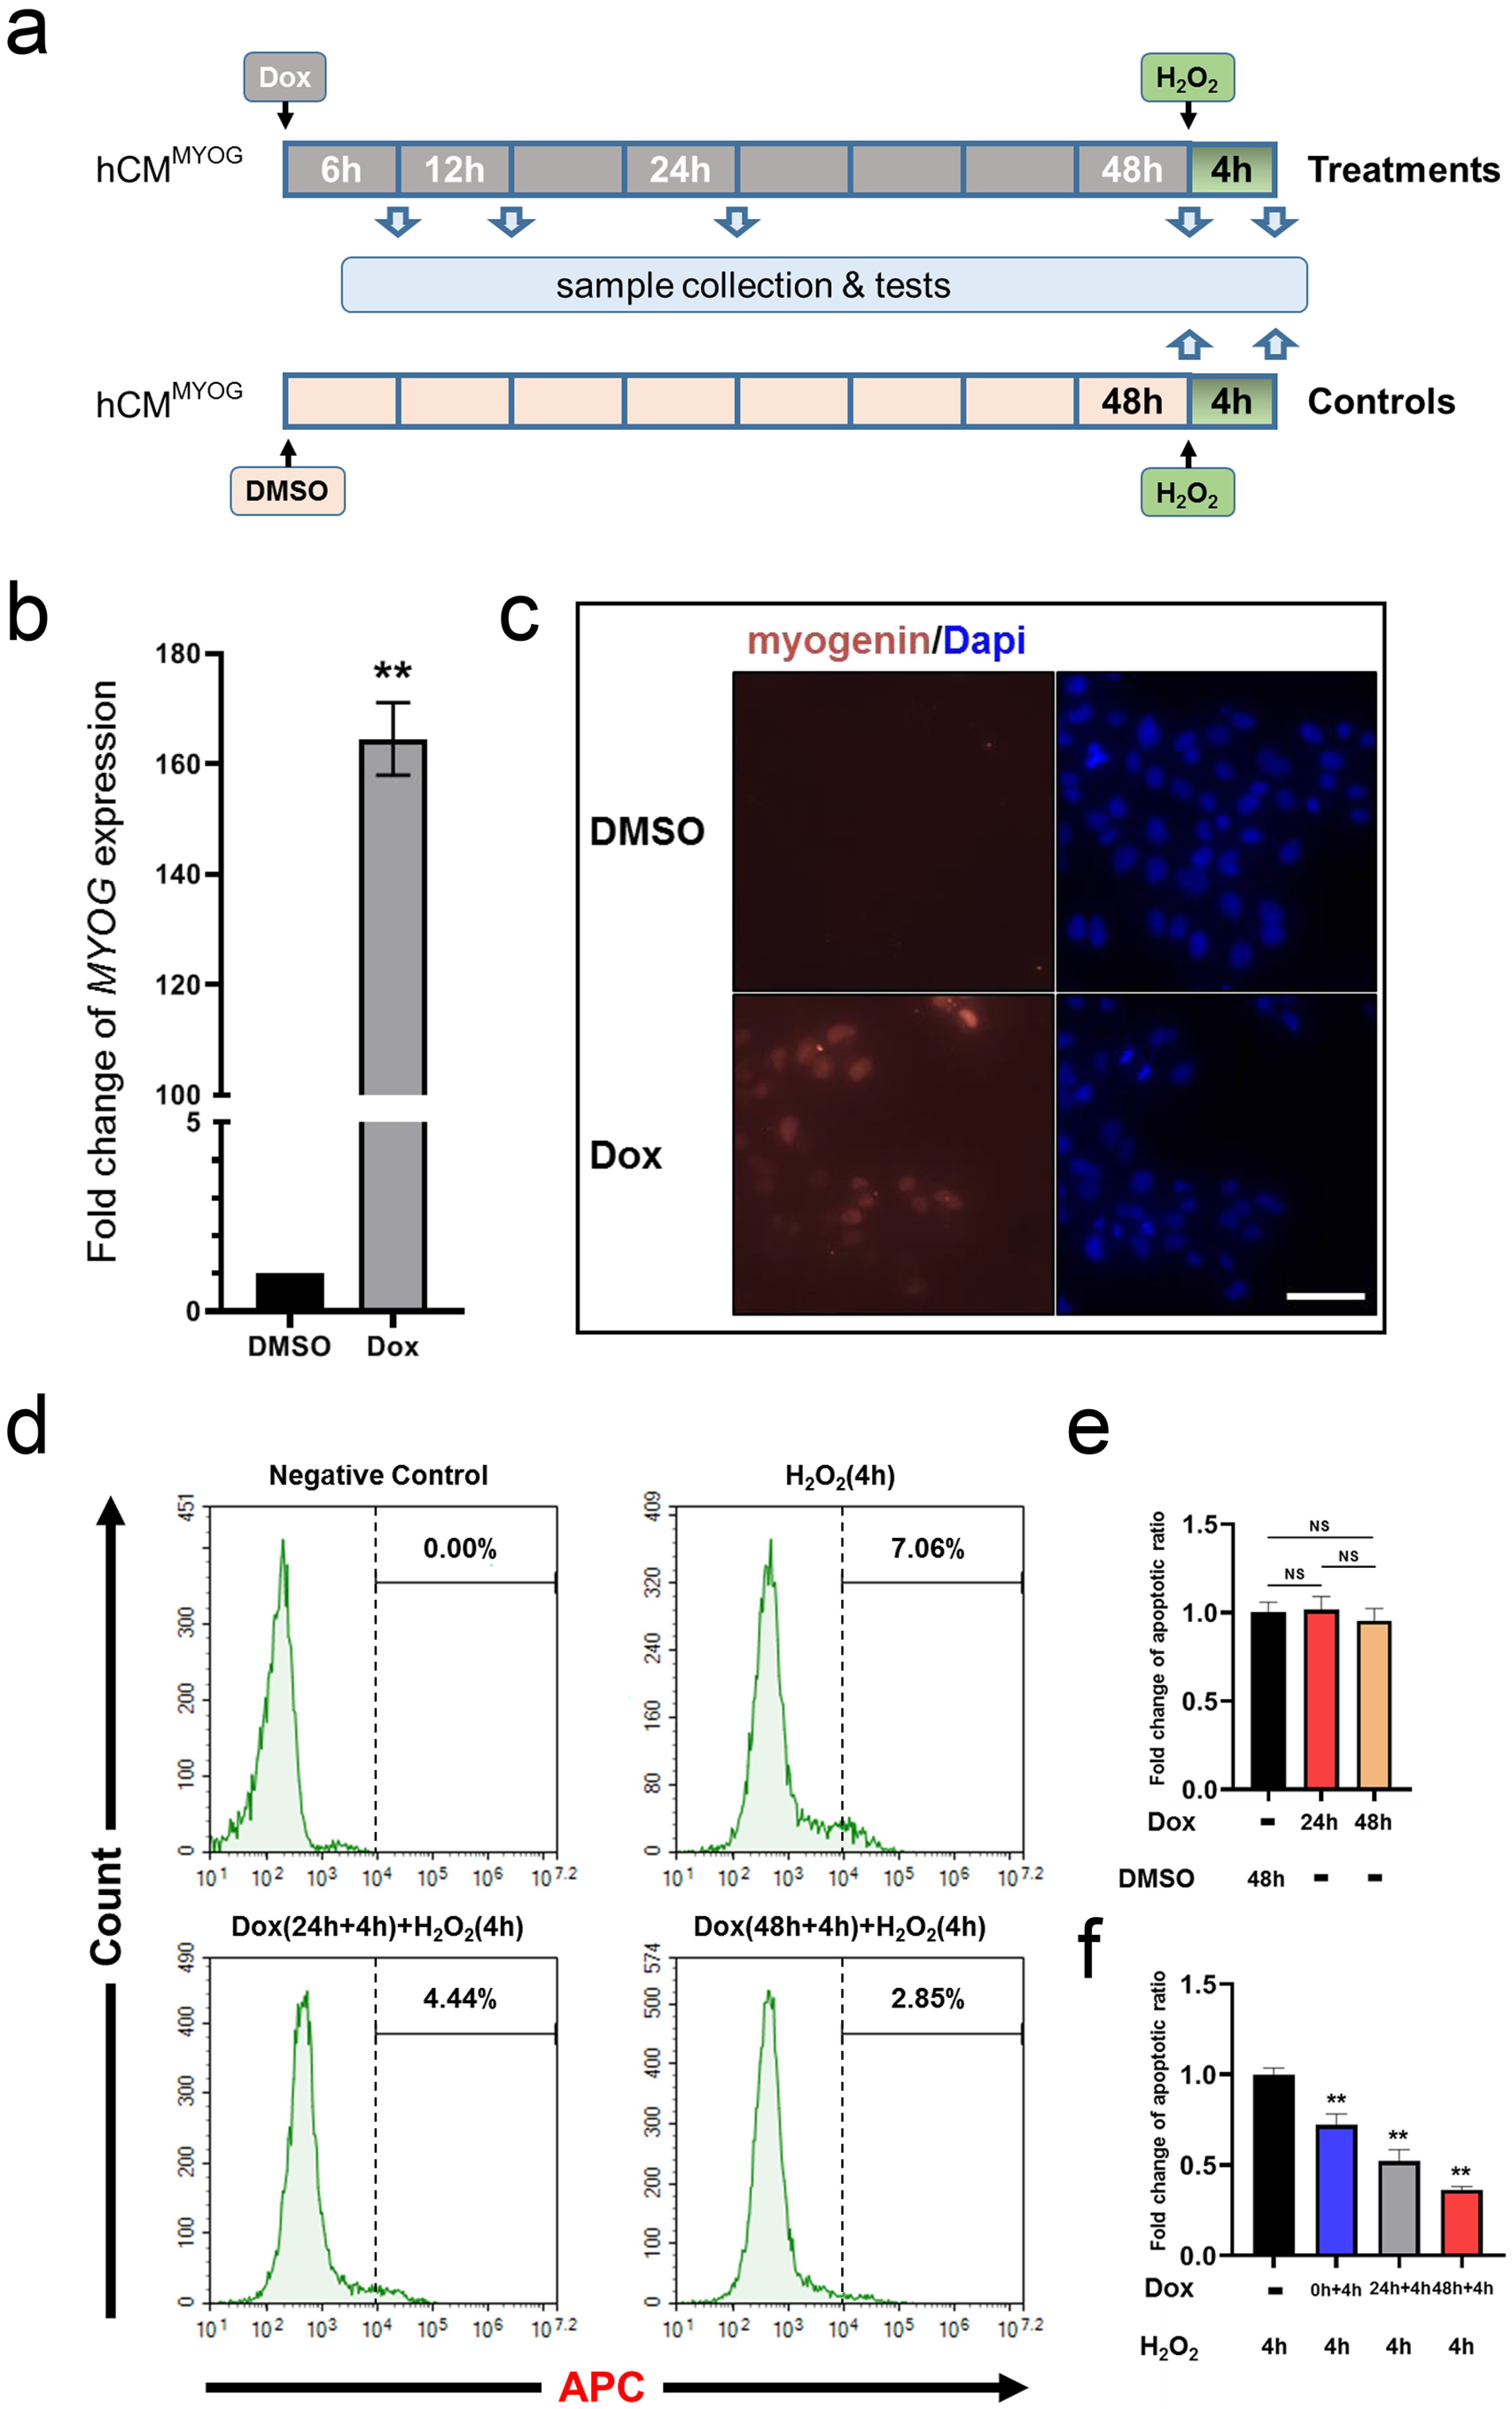
MYOG) was generated by lentiviral expression. In this Tet-On system, Dox interacts with the reverse tetracycline-controlled transactivator and makes it bind to the TRE element to initiate the transcription of target genes. Hence, myogenin expression was dependent on supplementation with Dox in hCMMYOG. Real-time PCR and immunofluorescence both demonstrated markedly low expression of myogenin in uninduced hCMMYOG, and a 164.6-fold increase in expression after 2 days of Dox induction (Fig. 1b,c). Next, myogenin-induced apoptosis was examined in cardiomyocytes. Annexin V, an early apoptotic marker, was used to evaluate the apoptotic ratio in a flow cytometry assay. Neither a 24-hour nor a 48-hour Dox induction increased the apoptotic ratio compared with the control group (Fig. 1e). ROS-mediated damage was induced by H2O2, a commonly used reagent that induces cellular oxidative stress [25]. Apoptotic cells were detected at a rate of 7.4% in the cardiomyocytes exposed to H2O2 for 4 hours (Fig. 1d). Next, effects of myogenin overexpression on H2O2-induced apoptosis were tested. MYOG expression was induced for 0, 24, or 48 hours prior to 4-hour H2O2 treatments. Myogenin induction continued throughout the H2O2 treatments. All three experimental groups exhibited a significantly lower apoptotic ratio compared with the control group: 24-hour and 48-hour induction reduced the apoptotic ratio by 47.9% and 63.5%, respectively (Fig. 1d,f). These results suggest that the anti-apoptotic effect of myogenin in H2O2-treated cardiomyocytes is time-dependent.

Fig. 1.

Overexpression of myogenin decreased the rate of apoptosis after hydrogen peroxide (H2O2) treatment. (a) Schematic diagram illustrating the experimental design. After expansion from single clones, hCMMYOG cells were cultured until green fluorescence disappeared, then myogenin expression was induced by Dox, or controls were supplemented with DMSO. (b) MYOG expression was significantly increased after a two-day induction (n = 3). (c) Representative immunofluorescence images of myogenin (red) in Dox- and DMSO-treated hCMMYOG. Cell nuclei were stained by 4,6-diamidino-2-phenylindole (DAPI, blue). (d) Representative fluorescence-activated cell sorting (FACS) analysis of the apoptosis marker annexin V (conjugated with Allophycocyanin (APC)) in hCMMYOG after various treatments. In the negative control group, DPBS buffer was used instead of the annexin V staining reagent. (e) The apoptotic ratio was unchanged after 24 or 48 hours of Dox induction. (f) The apoptotic ratio declined in myogenin-overexpressing hCMMYOG after H2O2 treatment. The incubation times with Dox alone and in conjunction with H2O2-treatment are separated by a plus sign. **, p < 0.001 compared to the no-induction control group. NS, no significant difference. Scale bar: 50 µm.

3.2 Myogenin Directly Upregulates the Expression of DUSP13

As a transcription factor, myogenin regulates the expression of a series of genes, including several key components of transcriptional machinery [26]. Some of the DEGs observed after long-term expression of myogenin may be due to its regulation of other transcription factors. Therefore it is necessary to monitor changes in gene expression profile during the early period of myogenin expression. To this end, hCMMYOG were induced by Dox for 6, 12, 24, or 48 hours and compared to DMSO-treated controls (Fig. 1a). A subset of hCMMYOG were also treated with H2O2 after a 48-hour Dox induction and compared to uninduced hCMMYOG that were treated with H2O2. RNA-seq was used to obtain transcriptome data.

Only protein-coding genes with FDR <0.05 and |log2(fold change)| >1 were considered. Under these criteria, 84 up-regulated and seven down-regulated genes were differentially expressed between 48-hour Dox induction and control groups (Fig. 2a). GO enrichment analysis of the up-regulated genes showed that “chemokine receptor binding” was one of the most significant molecular functions (Fig. 2b). The upregulated genes DUSP13 (25.99-fold increase), ATOH8 (5.94-fold increase), and FOXA3 (5.77-fold increase) were selected to validate the RNA-seq data using quantitative real-time PCR (Fig. 2d). Upregulation of DUSP13 was also verified at the protein level (Fig. 2e,f).

Fig. 2.

DUSP13 expression was elevated in myogenin-overexpressing hCM𝐌𝐘𝐎𝐆. (a) Volcano plot of differentially expressed genes between hCMMYOG induced by Dox for 48 hours and control samples. Red and blue dots represent up- and down-regulated genes, respectively, in the 48 h Dox group. (b) Gene ontology (GO) enrichment analysis of the up-regulated genes in the 48 h Dox group (GO term: molecular function). (c) Heatmap of upregulated genes with continuously increased expression from 6- to 48-hour Dox induction. Genes are listed in descending order by values of log2 (fold change) from the 48 h Dox group. The rightmost column shows expression data for cells that were treated with Dox for 48 h and then with H2O2 for 4 h (as compared to cells that were treated with DMSO for 48 h, and then with H2O2 for 4 h). (d) Quantitative real-time PCR confirmed the mRNA expression levels of selected genes (FOXA3, ATOH8, and DUSP13) indicated by the RNA-seq data (n = 3). #, p < 0.05; *, p < 0.01; **, p < 0.001. (e,f) Western blotting indicated that the protein level of DUSP13 was elevated in myogenin-overexpressing hCMMYOG. #, p < 0.05; *, p < 0.01; **, p < 0.001, compared to DMSO-treated controls. (g,h) Western blotting indicated that the level of phosphorylated p38 MAPK was decreased significantly in myogenin-overexpressing hCMMYOG under H2O2-treatment. #, p < 0.05, compared to DMSO-treated controls.

Next, the DEGs that increased in expression from 6- to 48-hour induction were analyzed to identify candidate genes directly regulated by myogenin (Fig. 2c). Among these genes, ATOH8, ASCL2, and ID3 encoded transcription factors or transcriptional regulators, and the 6-hour induction only slightly increased their expression (1.42-fold, 1.13-fold, and 1.29-fold, respectively). By contrast, PHGR1, DUSP13, and VWA5B2, the top three up-regulated genes after 48-hour induction, exhibited about 2-fold increased expression after the 6-hour induction. There are few studies about the molecular functions of PHGR1 and VWA5B, while it has been reported that DUSP13 dephosphorylates JNK1 and p38α and decreases AP-1-dependent gene expression [27]. Considering that p38 phosphorylation is a key event in p38 MAPK-mediated apoptosis, it is possible that myogenin suppresses the p38 MAPK pathway by directly initiating DUSP13 expression. To evaluate this hypothesis, we first detected endogenous levels of phosphorylated p38 MAPK (p-p38) and p38 MAPK in hCMMYOG with or without H2O2-treatment (Fig. 2g,h). The western blotting showed that hCMMYOG with or without myogenin expression exhibited very low levels of p-p38 expression in the absence of H2O2, however, expression of myogenin decreased the phosphorylation level of p38 significantly after H2O2-treatment (for the ratio of p-p38/p38, Dox + H2O2 vs. DMSO + H2O2 is 0.846 vs. 0.568, p = 0.035). Next, we continued to test whether myogenin directly regulated the expression of DUSP13.

HEK 293T cells were used to examine whether myogenin bound to the promoter region of DUSP13. A 2500-bp sequence upstream of the 5
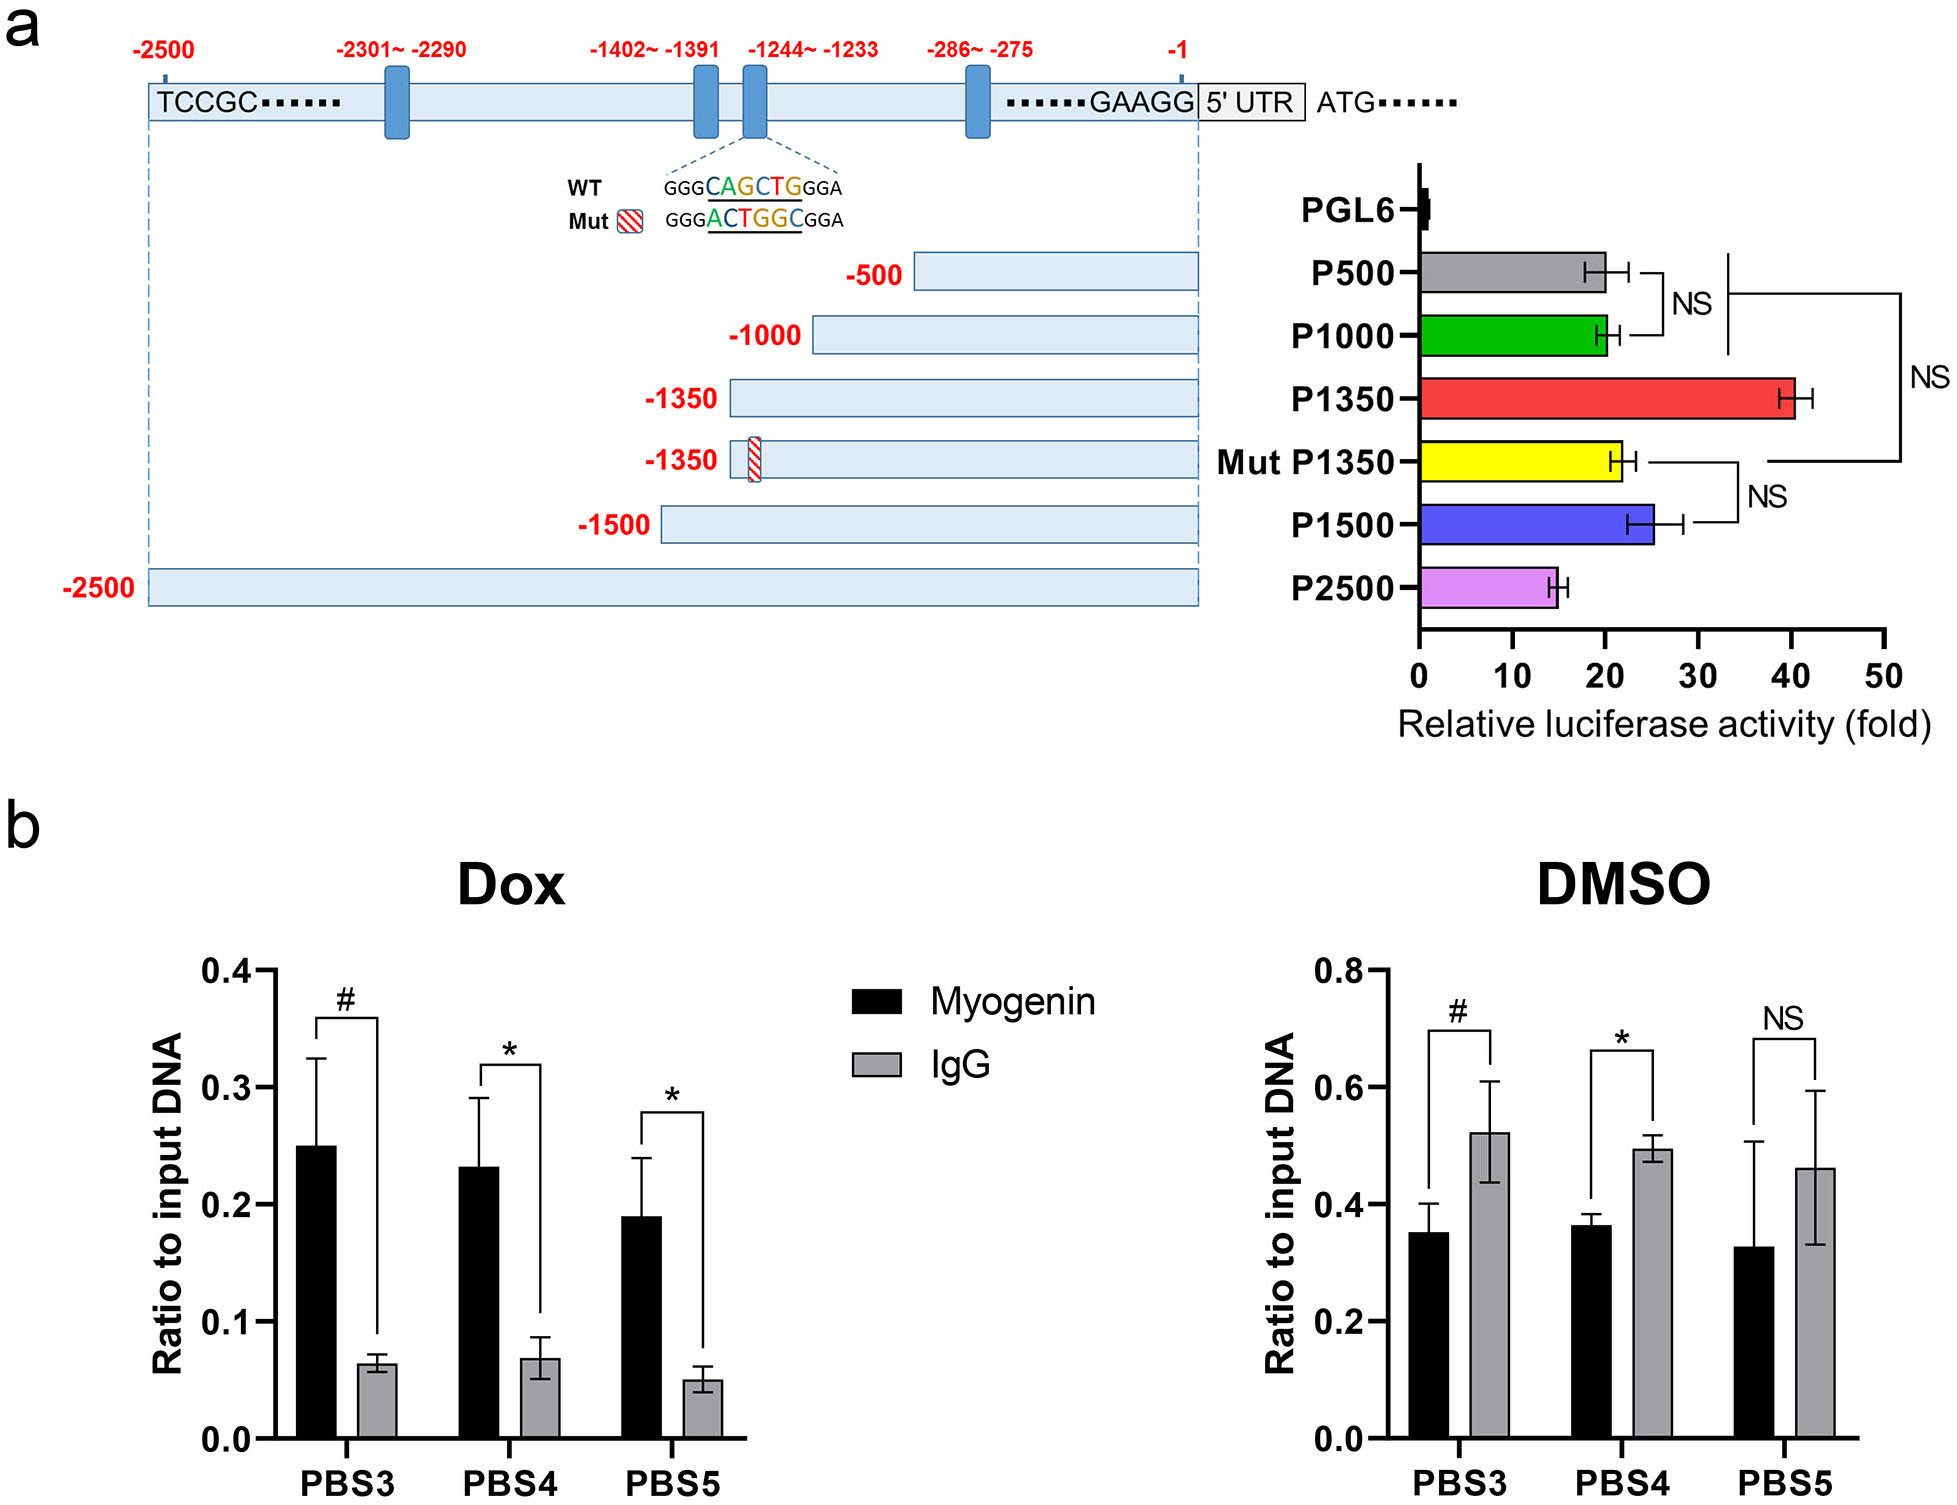
UTR of DUSP13 was analyzed in JASPAR database [21] to predict the binding sites of myogenin (Fig. 3). According to the distribution of putative binding sites, five DUSP13 promoter regions with different lengths (500, 1000, 1350, 1500, and 2500 bp) were cloned into a firefly luciferase reporter vector (PGL6). These vectors were named P500, P1000, P1350, P1500, and P2500, respectively. Then these firefly luciferase reporter vectors, Renilla luciferase reporter vectors, and MYOG expression vectors were co-transfected into HEK 293T cells. The dual-luciferase reporter assay showed that, compared to control cells transfected with the PGL6 vector, P1350 cells exhibited the strongest relative luciferase activity (40.5-fold). P500, P1000, and P1500 cells exhibited lower relative luciferase activity (20.2-fold, 20.3-fold, and 25.4-fold, respectively). Because P500 cells still showed strong relative luciferase activity, it was reasonable to speculate that the core binding sites of myogenin were located in the 500-bp sequence upstream of the 5UTR of DUSP13. We then used multiple online tools, such as TFBIND, JASPAR, and Lasagna-Search 2.0, to predict potential binding sites in this 500-bp region. Five predicted binding sites (PBS1–5) were identified (Supplementary Table 2). Chromatin immunoprecipitation (ChIP) assay was performed to confirm myogenin binding to these PBSs. We observed substantial recruitment of myogenin to PBS3, PBS4, and PBS5 only upon Dox treatment (Fig. 3b, left panel). In the absence of myogenin, we observed no recruitment of myogenin to these PBSs (Fig. 3b, right panel). Negative results were obtained from ChIP assay for PBS1 and PBS2 (data not shown). These in vitro data demonstrated that myogenin could directly bind to the promoter region of DUSP13 and upregulate its expression.

Fig. 3.

Myogenin bound the DUSP13 promoter. (a) Different DUSP13 promoter regions (500, 1000, 1350, 1500, and 2500 bp) and a mutated promoter sequence (Mut p1350) were cloned into luciferase reporter vectors. Cells transfected with the PGL6 vector were used as the control group. Luciferase activity was measured 48 hours after transfection. p-values for the comparisons between each experimental group can be found in Supplementary Table 3. NS: no significant difference. (b) ChIP analysis of Dox-treated hCMMYOG and DMSO-treated hCMMYOG, followed by qPCR analysis of myogenin occupancy at PBS3, PBS4, and PBS5. Each panel is representative of at least three independent experiments. #, p < 0.05; *, p < 0.01; NS, no significant difference.

3.3 DUSP13 Suppressed Apoptosis Induced by H2O2 in Cardiomyocytes

To further demonstrate that myogenin inhibited H
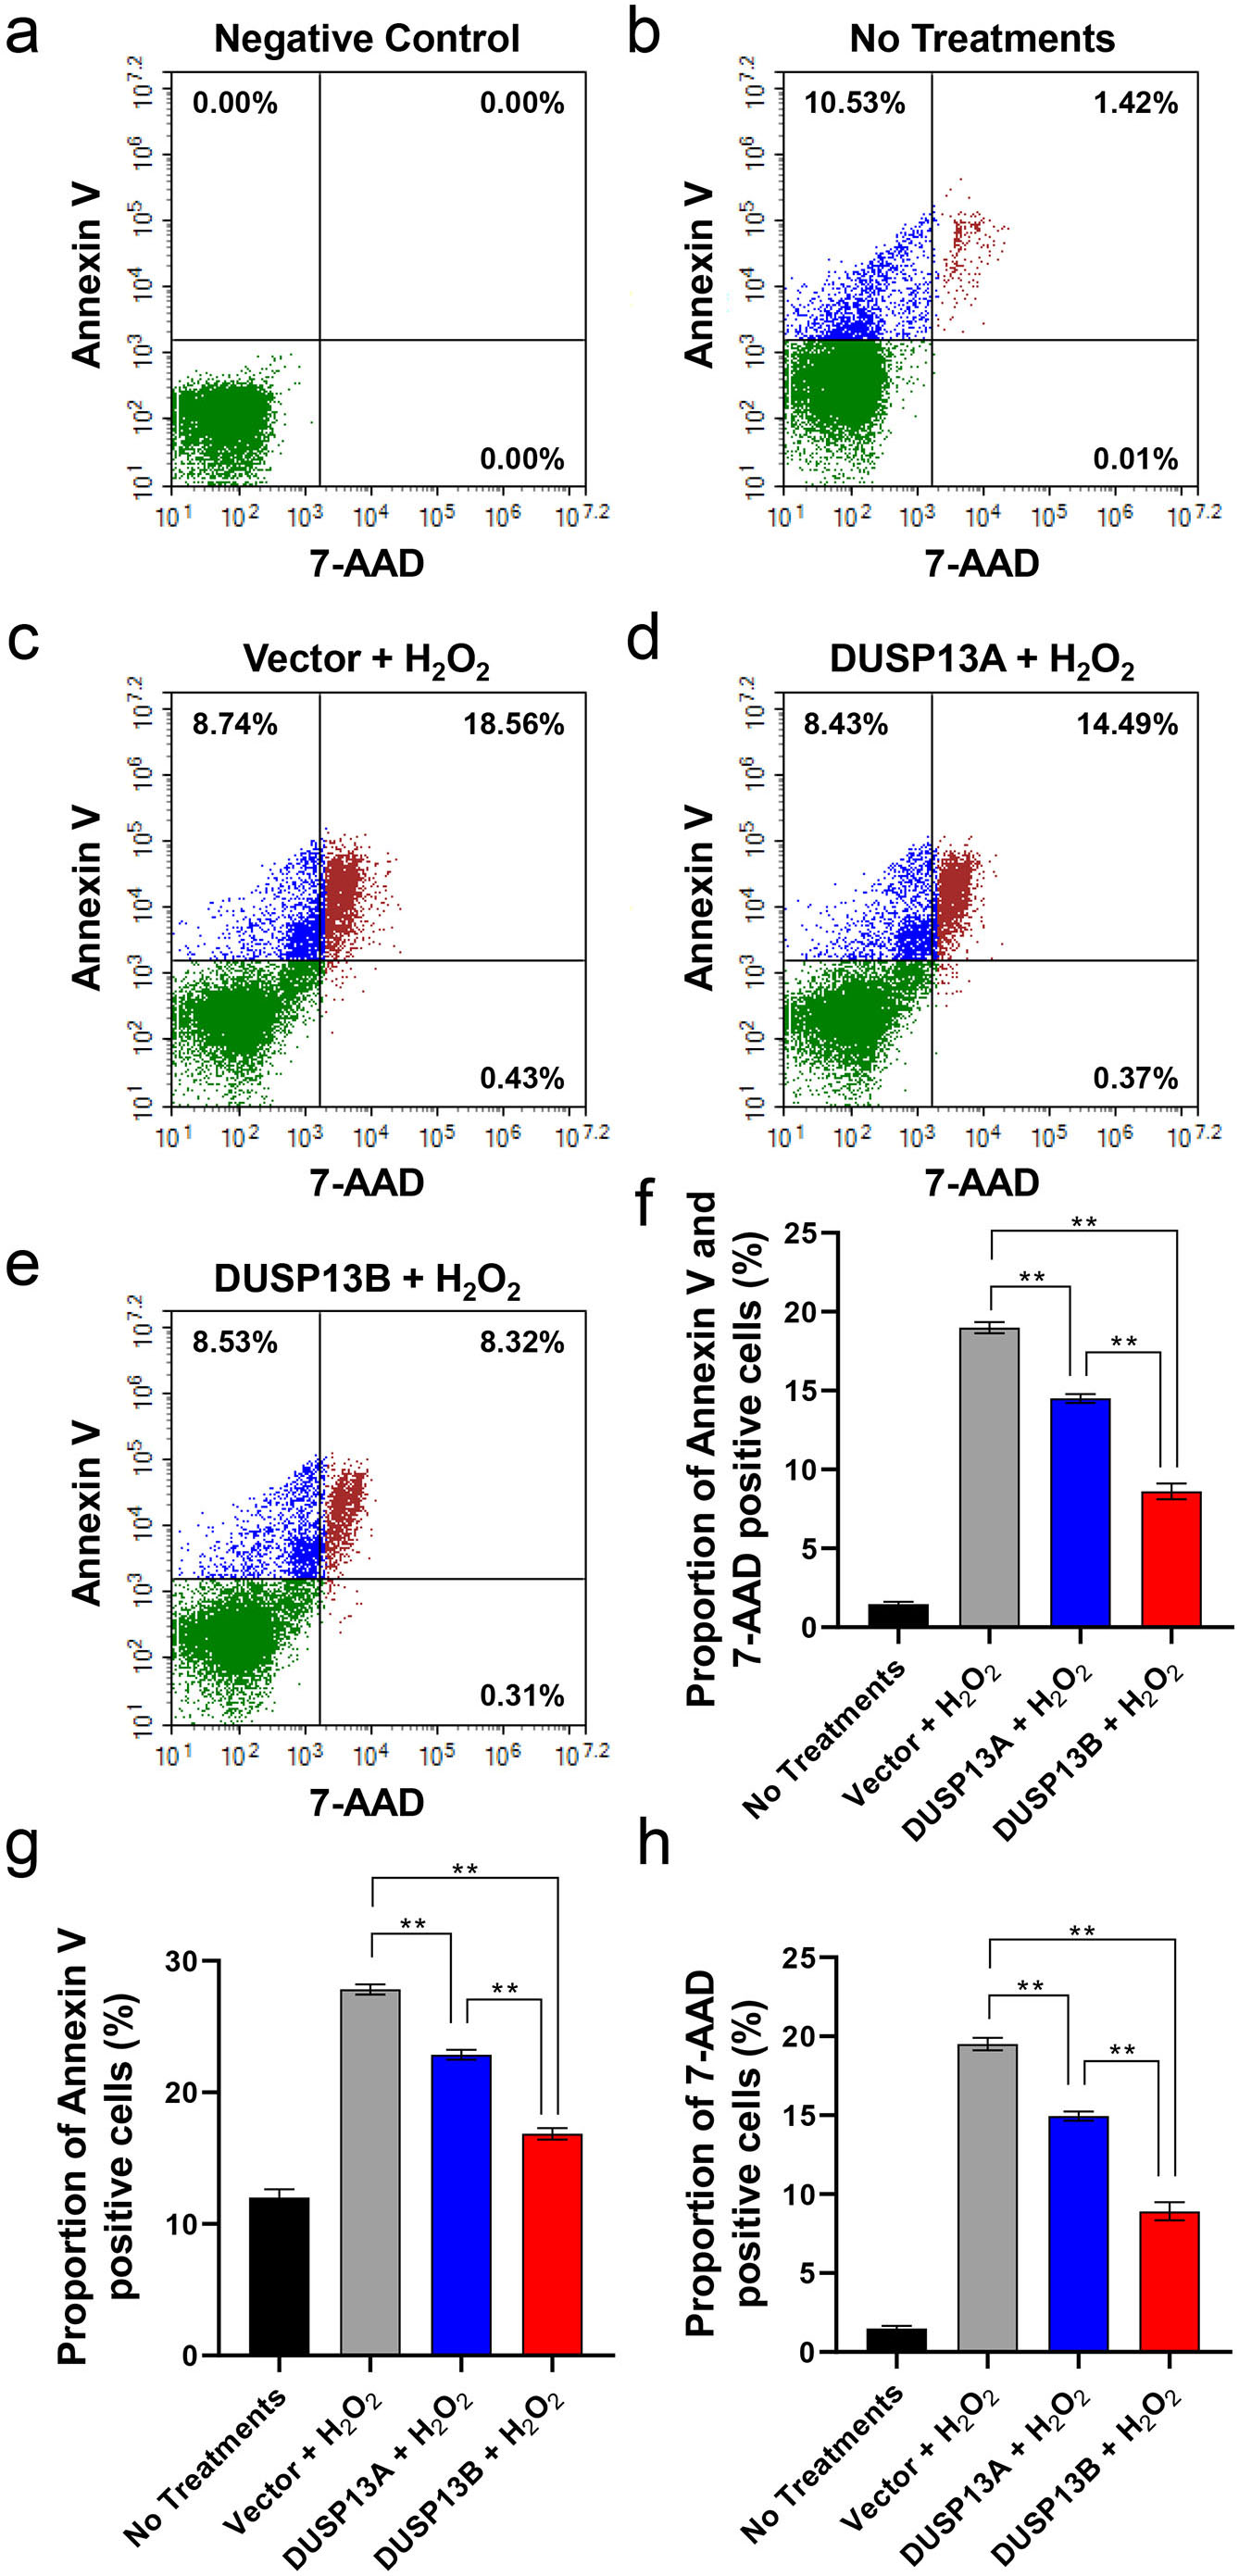
2O2-induced apoptosis by increasing the expression of DUSP13, cardiomyocytes were transiently transfected with DUSP13 expression vectors (including two isoforms of DUSP13: DUSP13A and DUSP13B) or an empty vector, then treated with H2O2 and analyzed by flow cytometry. Annexin V and 7-AAD were used to detect apoptotic and necrotic cells, respectively. Compared with empty-vector controls, cells expressing DUSP13A and DUSP13B had significantly lower rates of apoptosis and necrosis (Fig. 4). The rate of annexin V and 7-AAD double-positive cells in the DUSP13B group was reduced by 54.7% compared with the control group (8.6% vs. 19.0%, p < 0.001), while the rate of double-positive cells in the DUSP13A group only decreased by 23.7% (14.5% vs. 19.0%, p < 0.001; Fig. 4f), indicating that DUSP13B possessed stronger anti-apoptotic ability than DUSP13A. These results were consistent with a previous study showing that DUSP13B, not DUSP13A, had MAPK phosphatase activity in COS-7 and HEK 293 cells [27].

Fig. 4.

DUSP13 decreased the apoptotic and necrotic ratios of H2O2-treated cardiomyocytes. (a–e) Representative fluorescence-activated cell sorting analyses of the apoptotic marker annexin V (conjugated with APC) and necrotic marker 7-ADD in hCMMYOG after various treatments. In the negative control group, DPBS buffer was used instead of the annexin V or 7-ADD staining reagents. Across groups, the proportions of (f) annexin V and 7-ADD double-positive cells, (g) annexin V positive cells, and (h) 7-ADD positive cells vary significantly. **, p < 0.001.

We also knocked down DUSP13B by using siRNA in myogenin-expressing cardiomyocytes to confirm this conclusion. Three pairs of siRNA targeting DUSP13B gene were designed and synthesized. According to the knockdown efficiency evaluated by western blotting, siRNA-1 was selected to perform the knockdown assay. As shown in Supplementary Fig. 1, in the myogenin-expressing cardiomyocytes treated by H2O2, knockdown of DUSP13B significantly increased the apoptotic ratio compared with the controls (Supplementary Table 4), indicating that myogenin prevents H2O2-induced apoptosis through DUSP13B.

4. Discussion
4.1 Genes Regulated by Myogenin

At the cellular level, the genes regulated by myogenin overexpression have not been studied systematically. It has been variously reported that overexpression of myogenin downregulates the expression of Pax7 [28], and induces the expression of Mef2c [29], MuRF1 [30], Atrogin-1 [30], MEGF10 [31], and Ncam1 [32]. Most of these genes were not identified in our RNA-seq data, possibly because (i) Many studies were performed in a mouse myoblast cell line (C2C12) that exhibits epigenetic characteristics distinct from human cardiomyocytes; (ii) The present study only considered the first 48 hours of myogenin expression and may have missed genes that require long-term induction. The expression profiles of myogenin-overexpressed human induced pluripotent stem cell-derived cardiomyocytes were described in our previous work [18], in which myogenin-overexpressed cardiomyocytes were treated with Ang II for 6 days. The RNA-seq data from these two studies did not completely agree. For example, DUSP13 did not appear in the DEGs of the original work [18], probably because the gene regulatory networks influenced by complex external factors (such as Ang II treatment and incubation time) eliminated any changes in its expression. These results demonstrate the necessity of time-course analysis of gene expression at the early stages of myogenin expression.

4.2 Complexity of the DUSP13 Promoter

Based on the results from the dual-luciferase reporter assay, P1350 cells exhibited higher relative luciferase activity than P1000 cells, suggesting the existence of a certain motif in the –1350 bp to –1000 bp region that might enhance the transcriptional activity of myogenin. We speculated that this motif was the CAGCTG site in the –1244 to –1233 region. A mutated motif (CAGCTG to ACTGGC) was therefore generated, and its relative luciferase activity was found to be 46% lower when compared to unmutated P1350 cells, and was almost equal with P1000 cells (Fig. 3a). These data confirmed that the –1244 to –1233 region was a key motif that could increase the expression of a downstream gene (DUSP13). We further speculate that the reason that P1500 and P2500 cells had less activity than P1350 cells was due to the presence of repressor elements in the –1500 to –1350 bp or –2500 to –1500 bp regions. To identify these repressor elements, more delicate design experiments will be necessary to carry out in future studies. The lack of knowledge and the complexity of its promoter region are serious impediments to exploring the regulatory mechanisms of DUSP13 gene. For example, an online tool, Find Individual Motif Occurences (Version 5.5.4, FIMO, Seattle, WA, USA), was used to search the potential E-box motifs in the 2500-bp region, and in total 48 E-boxes were identified (Supplementary Table 5). What roles these motifs actually play is still undiscovered.

4.3 Therapeutic Potential of DUSP13 in Heart Disease

The p38 MAPK signaling pathway is involved in skeletal muscle development [33]. P38 directly phosphorylates MEF2A and MEF2C [34], and may induce MyoD through an indirect effect [33]. Although there is no evidence that p38 directly regulates myogenin, the p38 inhibitor SB203580 decreased the expression of myogenin and prevented myogenic differentiation [35]. The present study demonstrated that myogenin might reduce the phosphorylation of p38 by increasing expression of DUSP13, suggesting that there might be a feedback loop to regulate p38 MAPK signaling by myogenic regulatory factors. In addition, overexpression and knockdown assays illustrated the vital role of DUSP13 in the inhibition of apoptosis induced by H2O2. Considering the potential for therapeutic applications in heart diseases, DUSP13 might be a more appropriate candidate gene than MYOG. As a transcription factor, myogenin regulates many genes and would be more likely to have off-target effects. In contrast, DUSP13 has defined substrates, such as p38. Although a Japanese patent (JP5187875B2) claims that DUSP13 transgenic mice developed cardiac hypertrophy, which could be interpreted as a long-term effect of DUSP13 expression, we still propose that transient expression of DUSP13 might mitigate myocardial apoptosis induced by ROS in cardiac tissue.

5. Conclusions

In conclusion, DUSP13 was identified as a direct target of myogenin, and presented a new possible mechanism by which myogenin suppresses ROS-induced apoptosis in cardiomyocytes. Myogenin increased the expression of DUSP13, which in turn dephosphorylated p38 to inhibit ROS-activated MAPK, thereby obstructing apoptosis.

Availability of Data and Materials

The datasets generated and analysed during the current study are available from the corresponding author on reasonable request.

Author Contributions

JZ and JC contributed to the conception and design of the study. JL, QG, JZ, and JC prepared the study materials. JL, QG, HQ, SZ, WZ, PW, LZ, XL and BL performed the experiments. JL, QG, PW, LZ, BL, LL, FX, RZ, and DS analyzed and interpreted the data. All authors contributed to editorial changes in the manuscript. All authors read and approved the final manuscript. All authors have participated sufficiently in the work and agreed to be accountable for all aspects of the work.

Ethics Approval and Consent to Participate

Not applicable.

Acknowledgment

Not applicable.

Funding

This work was supported by the grants from the Guangdong Basic and Applied Basic Research Foundation (2021A1515111152), the National Natural Science Foundation of China (No. U2005214) and the National Key R&D Program of China (2022YFB4600600).

Conflict of Interest

The authors declare no conflict of interest. However, it should be noted that Lishi Zhou and Bin Lin are affiliated with Guangdong Beating Origin Regenerative Medicine Co., Ltd. Steps have been taken to ensure that their involvement in this research did not influence the objectivity and integrity of the study findings.

References
[1]
Pignatelli P, Menichelli D, Pastori D, Violi F. Oxidative stress and cardiovascular disease: new insights. Kardiologia Polska. 2018; 76: 713–722.
[2]
Kumar D, Jugdutt BI. Apoptosis and oxidants in the heart. The Journal of Laboratory and Clinical Medicine. 2003; 142: 288–297.
[3]
Zhao ZQ. Oxidative stress-elicited myocardial apoptosis during reperfusion. Current Opinion in Pharmacology. 2004; 4: 159–165.
[4]
Krylatov A, Maslov L, Tsibulnikov SY, Voronkov N, Boshchenko A, Downey J, et al. The Role of Reactive Oxygen Species, Kinases, Hydrogen Sulfide, and Nitric Oxide in the Regulation of Autophagy and Their Impact on Ischemia and Reperfusion Injury in the Heart. Current Cardiology Reviews. 2021; 17: e230421186874.
[5]
Narasimhan M, Rajasekaran NS. Exercise, Nrf2 and Antioxidant Signaling in Cardiac Aging. Frontiers in Physiology. 2016; 7: 241.
[6]
Seddon M, Looi YH, Shah AM. Oxidative stress and redox signalling in cardiac hypertrophy and heart failure. Heart. 2007; 93: 903–907.
[7]
Kong P, Christia P, Frangogiannis NG. The pathogenesis of cardiac fibrosis. Cellular and Molecular Life Sciences. 2014; 71: 549–574.
[8]
Tsutsui H, Kinugawa S, Matsushima S. Oxidative stress and heart failure. American Journal of Physiology. Heart and Circulatory Physiology. 2011; 301: H2181–H2190.
[9]
Shirakawa R, Yokota T, Nakajima T, Takada S, Yamane M, Furihata T, et al. Mitochondrial reactive oxygen species generation in blood cells is associated with disease severity and exercise intolerance in heart failure patients. Scientific Reports. 2019; 9: 14709.
[10]
Mallat Z, Philip I, Lebret M, Chatel D, Maclouf J, Tedgui A. Elevated levels of 8-iso-prostaglandin F2alpha in pericardial fluid of patients with heart failure: a potential role for in vivo oxidant stress in ventricular dilatation and progression to heart failure. Circulation. 1998; 97: 1536–1539.
[11]
Zablocki D, Sadoshima J. Angiotensin II and oxidative stress in the failing heart. Antioxidants & Redox Signaling. 2013; 19: 1095–1109.
[12]
Purohit A, Rokita AG, Guan X, Chen B, Koval OM, Voigt N, et al. Oxidized Ca(2+)/calmodulin-dependent protein kinase II triggers atrial fibrillation. Circulation. 2013; 128: 1748–1757.
[13]
Wu Y, Wang Q, Feng N, Granger JM, Anderson ME. Myocardial death and dysfunction after ischemia-reperfusion injury require CaMKIIδ oxidation. Scientific Reports. 2019; 9: 9291.
[14]
Dikalov SI, Nazarewicz RR. Angiotensin II-induced production of mitochondrial reactive oxygen species: potential mechanisms and relevance for cardiovascular disease. Antioxidants & Redox Signaling. 2013; 19: 1085–1094.
[15]
Castro-Mondragon JA, Riudavets-Puig R, Rauluseviciute I, Lemma RB, Turchi L, Blanc-Mathieu R, et al. JASPAR 2022: the 9th release of the open-access database of transcription factor binding profiles. Nucleic Acids Research. 2022; 50: D165–D173.
[16]
Bray NL, Pimentel H, Melsted P, Pachter L. Near-optimal probabilistic RNA-seq quantification. Nature Biotechnology. 2016; 34: 525–527.
[17]
Love MI, Huber W, Anders S. Moderated estimation of fold change and dispersion for RNA-seq data with DESeq2. Genome Biology. 2014; 15: 550.
[18]
Chen J, Bardes EE, Aronow BJ, Jegga AG. ToppGene Suite for gene list enrichment analysis and candidate gene prioritization. Nucleic Acids Research. 2009; 37: W305–W311.
[19]
Sies H, Belousov VV, Chandel NS, Davies MJ, Jones DP, Mann GE, et al. Defining roles of specific reactive oxygen species (ROS) in cell biology and physiology. Nature Reviews. Molecular Cell Biology. 2022; 23: 499–515.
[20]
Adhikari A, Kim W, Davie J. Myogenin is required for assembly of the transcription machinery on muscljj43je genes during skeletal muscle differentiation. PLoS ONE. 2021; 16: e0245618.
[21]
Katagiri C, Masuda K, Nomura M, Tanoue K, Fujita S, Yamashita Y, et al. DUSP13B/TMDP inhibits stress-activated MAPKs and suppresses AP-1-dependent gene expression. Molecular and Cellular Biochemistry. 2011; 352: 155–162.
[22]
Meadows E, Cho JH, Flynn JM, Klein WH. Myogenin regulates a distinct genetic program in adult muscle stem cells. Developmental Biology. 2008; 322: 406–414.
[23]
Nabeshima Y, Hanaoka K, Hayasaka M, Esumi E, Li S, Nonaka I, et al. Myogenin gene disruption results in perinatal lethality because of severe muscle defect. Nature. 1993; 364: 532–535.
[24]
Gundersen K, Rabben I, Klocke BJ, Merlie JP. Overexpression of myogenin in muscles of transgenic mice: interaction with Id-1, negative crossregulation of myogenic factors, and induction of extrasynaptic acetylcholine receptor expression. Molecular and Cellular Biology. 1995; 15: 7127–7134.
[25]
Gao Q, Wang P, Qiu H, Qiu B, Yi W, Tu W, et al. Myogenin suppresses apoptosis induced by angiotensin II in human induced pluripotent stem cell-derived cardiomyocytes. Biochemical and Biophysical Research Communications. 2021; 552: 84–90.
[26]
Cesselli D, Jakoniuk I, Barlucchi L, Beltrami AP, Hintze TH, Nadal-Ginard B, et al. Oxidative stress-mediated cardiac cell death is a major determinant of ventricular dysfunction and failure in dog dilated cardiomyopathy. Circulation Research. 2001; 89: 279–286.
[27]
Untergasser A, Cutcutache I, Koressaar T, Ye J, Faircloth BC, Remm M, et al. Primer3–new capabilities and interfaces. Nucleic Acids Research. 2012; 40: e115.
[28]
Olguin HC, Yang Z, Tapscott SJ, Olwin BB. Reciprocal inhibition between Pax7 and muscle regulatory factors modulates myogenic cell fate determination. The Journal of Cell Biology. 2007; 177: 769–779.
[29]
Ridgeway AG, Wilton S, Skerjanc IS. Myocyte enhancer factor 2C and myogenin up-regulate each other’s expression and induce the development of skeletal muscle in P19 cells. The Journal of Biological Chemistry. 2000; 275: 41–46.
[30]
Moresi V, Williams AH, Meadows E, Flynn JM, Potthoff MJ, McAnally J, et al. Myogenin and class II HDACs control neurogenic muscle atrophy by inducing E3 ubiquitin ligases. Cell. 2010; 143: 35–45.
[31]
Park SY, Yun Y, Kim MJ, Kim IS. Myogenin is a positive regulator of MEGF10 expression in skeletal muscle. Biochemical and Biophysical Research Communications. 2014; 450: 1631–1637.
[32]
Chiappalupi S, Riuzzi F, Fulle S, Donato R, Sorci G. Defective RAGE activity in embryonal rhabdomyosarcoma cells results in high PAX7 levels that sustain migration and invasiveness. Carcinogenesis. 2014; 35: 2382–2392.
[33]
Keren A, Tamir Y, Bengal E. The p38 MAPK signaling pathway: a major regulator of skeletal muscle development. Molecular and Cellular Endocrinology. 2006; 252: 224–230.
[34]
Zhao M, New L, Kravchenko VV, Kato Y, Gram H, di Padova F, et al. Regulation of the MEF2 family of transcription factors by p38. Molecular and Cellular Biology. 1999; 19: 21–30.
[35]
Wu Z, Woodring PJ, Bhakta KS, Tamura K, Wen F, Feramisco JR, et al. p38 and extracellular signal-regulated kinases regulate the myogenic program at multiple steps. Molecular and Cellular Biology. 2000; 20: 3951–3964.

Publisher’s Note: IMR Press stays neutral with regard to jurisdictional claims in published maps and institutional affiliations.

Share
Back to top