1. Introduction
Type 2 diabetes (T2D) is one of the
fastest-growing non-communicable chronic diseases and a serious threat to human
health with approximately 415 million people currently affected worldwide [1]. A
high-fat diet has been closely associated with the development of type 2
diabetes. Strong evidence indicates that long-term excessive consumption of foods
rich in animal fat significantly increases the serum concentration of saturated
fatty acids (SFAs), which leads to -cell dysfunction and eventually
accelerates the development of type 2 diabetes [2]. Stearic and palmitic acids
are two major saturated fatty acids. Although the proportion of stearic acid is
lower than palmitic acid in fatty foods and human serum, growing evidence shows
that the increase in circulating stearic acid in the profile of free fatty acids
is significantly higher, while its detrimental effect on -cells is
stronger than that of palmitic acid in patients with hyperlipidemia and mice fed
high-fat diets [3, 4, 5]. However, the understanding of the role of stearic acid in
-cell impairment remains incomplete.
The proposed mechanisms responsible for saturated fatty acid-induced
-cell failure mainly include endoplasmic reticulum stress, apoptosis,
inflammation, dedifferentiation, aging, and senescence [6, 7, 8, 9, 10]. Among them, the
contribution of -cell senescence to this process has attracted more
attention in recent years. Cellular senescence is a stress response that can
occur at any time and is sensitive to various stimuli, such as DNA damage,
endoplasmic reticulum stress, reactive oxygen species, and oncogene activation
[11, 12, 13, 14, 15]. It is characterized by a decline in cell proliferation [16] and
increases in senescence-associated -galactosidase activity and secretion
of senescence-associated secretory phenotype (SASP) factors [17, 18]. Senescent
-cells accumulate and increase in islets with age and
under certain conditions, including peripheral insulin resistance, a high body
mass index, and type 2 diabetes [19, 20]. Similarly, a high-fat diet significantly
increases the accumulation of senescent -cells, whereby decreasing the
number of senescent cells obviously improves -cell function [20]. These
findings imply that senescence is a promising target in saturated fatty
acid-induced -cell dysfunction during type 2 diabetes development.
However, the development of an effective drug for the management of
-cell senescence remains challenging.
Metformin is a first-line drug in the management of type 2 diabetes, mostly via
the inhibition of hepatic gluconeogenesis and promotion of glucose uptake in
skeletal muscles [21]. Researchers are also currently focusing on metformin use
in other fields because this drug has been shown to have pleiotropic effects,
such as weight loss, cancer prevention, and anti-aging and senescence [22].
Although metformin is an interesting candidate as an anti-aging treatment,
clinical evidence of this effect is still lacking and the precise mechanisms have
not been completely elucidated. In particular, evidence demonstrating the
potential role of metformin in the protection against -cell senescence
is at present quite limited [23, 24, 25]. There is no doubt that the identification of
novel potential targets of metformin that prevent -cell aging is
important for slowing type 2 diabetes development.
High-throughput sequencing technologies and bioinformatics analysis have
significantly expanded our knowledge about the important role of non-coding RNAs
in gene regulation at multiple levels and have provided a large number of novel
targets for the treatment of human diseases. MicroRNAs (miRNAs)—a class of
endogenous ~20 nucleotide RNAs—have been strongly suggested to
participate in the regulation of -cell function, such as miR-375, miR-7,
and miR-184 [26, 27, 28]. In our previous studies, we found that miR-297b-5p was
significantly downregulated in stearic acid-treated -TC6 cells and in
the islets of mice fed a high-fat diet. Overexpression of miR-297b-5p effectively
alleviates stearic acid-induced -cell dysfunction through its
anti-apoptotic and anti-inflammatory effects [29, 30]. However, whether
miR-297b-5p is also involved in the anti-senescence effect of metformin in
-cells exposed to stearic acid remains unknown.
In this study, we aimed to investigate the protective effect of metformin on
stearic acid-evoked -cell senescence in -TC6 cells and to
examine the involvement of miR-297b-5p in this process. We found that the
upregulation of miR-297b-5p promotes the anti-senescence effect of metformin on
stearic acid-treated -TC6 cells by decreasing the level of the
insulin-like growth factor-1 receptor (Igf1r). These results provide a
potential mechanism to not only prevent the induction of -cell
dysfunction by a high-fat diet but also for the therapeutic use of metformin to
prevent or delay the onset of type 2 diabetes.
2. Materials and Methods
2.1 Chemicals
Stearic acid (S4751) was obtained from Sigma (St. Louis, MO, USA). We prepared
its stock solution by dissolving stearic acid in ethanol and saponification with
sodium hydroxide. After drying, the sodium salt was resuspended in saline, and
then, heated at 80 °C until it was dissolved completely. Then, 20%
(wt/vol) BSA was added. Then, the complex was sterilized and aliquoted. The final
stock concentration was 3 mmol/L [29]. The working concentration of stearic acid
was 400 µmol/L. Metformin (CAS No. 1115-70-4, Biotopped, Beijing, China)
was dissolved in cell culture medium to prepare a stock solution of 100 mmol/L,
which was diluted in cell culture medium.
2.2 Cell Culture
Mouse -TC6 cells were purchased from the Shanghai Academy of Chinese
Sciences Cell Library and incubated in Dulbecco’s modified Eagle’s medium
(12800017, Gibco/Life Technologies, Carlsbad, CA, USA) supplemented with 15%
fetal bovine serum (Biological Industries, Kibbutz Beit Haemek, Israel), 1.5 g/L
NaHCO, and 100 IU/mL penicillin–streptomycin mix [29]. The cell line has
been authenticated by short tandem repeat, and mycoplasma testing has been done.
2.3 Cell Viability Assay
Cell viability was assessed using Cell Counting Kit 8 (C0038; Beyotime
Biotechnology, Shanghai, China). For this purpose, -TC6 cells were
seeded in a 96-well plate and 10 µL of Cell Counting Kit 8 reagents were
added to each well and incubated for 2 h at 37 °C. Absorbance was
detected at 450 nm with a microplate reader (SpectraMax M2; Molecular Devices,
San Jose, CA, USA), as described previously [29].
2.4 Transfection Procedure
-TC6 cells were transfected with miR-297b-5p mimics, anti-miR-297b-5p
oligonucleotides (AMO-297b-5p), siRNA-Igf1r, or their negative controls
using Lipofectamine 2000 (11668019; Invitrogen, Carlsbad, CA, USA), in accordance
with the manufacturer’s instructions and our previous study [29]. miR-297b-5p
mimics, anti-miR-297b-5p oligonucleotides, and their negative controls were
purchased from RiboBio Co. Ltd (Guangzhou, Guangdong, China). siRNA-Igf1r
(sc-35638)and its negative control (sc-37007) were obtained from Santa
Cruz Biotechnology, Inc. (Dallas, TX, USA). The sequences of these
oligonucleotides are displayed in Table 1.
Table 1.Sequences of oligonucleotides used for transfection.
| Oligonucleotides |
Sequences |
| miRNA mimic negative control |
|
|
Sense |
5-UUUGUACUACACAAAAGUACUG-3 |
|
Antisense |
3-AAACAUGAUGUGUUUUCAUGAC-5 |
| miRNA inhibitor negative control |
5-mCmAmGmUmAmCmUmUmUmUmGmUmGmUmAmGmUmAmCmAmAmA-3 |
| mmu-miR-297b-5p mimic |
|
|
Sense |
5-AUGUAUGUGUGCAUGAACAUGU-3 |
|
Antisense |
3-UACAUACACACGUACUUGUACA5 |
| mmu-miR-297b-5p inhibitor |
5-mAmCmAmUmGmUmUmCmAmUmGmCmAmCmAmCmAmUmAmCmAmU-3 |
|
IGF-IR/ siRNA (m) |
|
|
Sense (A) |
5-CCAUCAGGAUUGAGAAGAAtt-3 |
|
Antisense (A) |
5-UUCUUCUCAAUCCUGAUGGtt-3 |
|
Sense (B) |
5-GAAGAACCGAAUCAUCAUAtt-3 |
|
Antisense (B) |
5-UAUGAUGAUUCGGUUCUUCtt-3 |
|
Sense (C) |
5-CUACUGCUCCAAAGACAAAtt-3 |
|
Antisense (C) |
5-UUUGUCUUUGGAGCAGUAGtt-3 |
m represents 2-Ome (methylation modification).
IGF-IR/ siRNA(m) is a pool of three different siRNA duplexes.
2.5 Glucose-Stimulated Insulin Secretion (GSIS) Assay
-TC6 cells were preincubated in secretion buffer (129 NaCl, 4.8 KCl,
1.2 MgSO, 1.2 KHPO, 2.5 CaCl, 5.0 NaHCO, 10 HEPES
(all mmol/L) and 1 mg/mL bovine serum albumin, adjusted to pH 7.4) with 2.8 or 20
mmol/L glucose [5]. The supernatant was collected for insulin measurement and
-TC6 cells were, then, lysed to measure the total protein content using
a bicinchoninic acid (BCA) protein assay reagent kit (Cat. No. P0010, Beyotime Biotechnology).
Insulin levels were measured using a mouse/rat insulin ELISA kit (Cat. No.
EZRMI-13K, Millipore, Burlington, MA, USA). The supernatants obtained after
stimulation with 2.8 mmol/L and 20 mmol/L glucose were diluted at 1:10 and 1:30
for insulin measurement, respectively. Insulin levels were normalized to the
milligrams of protein present in each well.
2.6. Senescence-Associated -Galactosidase
(SA--gal) Staining
-TC6 cells were seeded into a 24-well plate at 6 10
cells/well and cultured at 37 °C in a 5% CO humidified incubator.
The senescence status was analyzed using a Senescence -Galactosidase
Staining Kit (Cat. No. C0602, Beyotime Biotechnology). Cells were washed with phosphate-buffered saline (PBS) and fixed in the
senescence-associated -galactosidase fixative solution for 15 min at
room temperature. After washing three times with PBS, the cells were incubated in
senescence-associated -galactosidase working solution overnight at
37 °C without CO. To calculate the number of senescent cells, five
images of each well were randomly selected and analyzed blindly. The percentage
of senescence-associated -galactosidase-positive cells (blue) was
determined by dividing the number of positive cells by the total number of cells
present in each image [31, 32], which was determined by Hoechst 33342 staining
(C1022, Beyotime Biotechnology).
2.7 Immunofluorescence
Immunocytofluorescence was performed as described [33]. Briefly, -TC6
cells were fixed with 4% paraformaldehyde for 15 min and then permeabilized with
PBS containing 0.1% Triton X-100 (P0096, Beyotime Biotechnology). After washing and blocking, the cells were incubated overnight at 4
°C with a primary antibody against the insulin-like growth factor-1
receptor (IGF1R) (AF6125, 1:250, Affinity Biosciences, OH, USA). Then, the cells
were incubated in the dark for 1 h at room temperature in the presence of the
secondary anti-rabbit IgG (#4413, 1:600, Cell Signaling Technology, Danvers, MA,
USA) and subsequently counterstained with Hoechst 33342 (C1022, Beyotime
Biotechnology) for counting. The slides were observed with a
laser confocal microscope. Five random images of each slide were selected to
quantify the fluorescence intensity.
2.8 Western Blotting
Cells were harvested in PBS and lysed with intermediate RIPA lysis buffer
(Cat. No. P0013C, Beyotime Biotechnology). Protein concentrations were measured using the bicinchoninic acid
(BCA) protein assay kit, Cat. No. P0012, Beyotime Biotechnology. Whole-cell lysates (50 µg/lane) were separated by
sodium dodecyl sulfate-polyacrylamide gel electrophoresis and transferred to a
polyvinylidene fluoride membrane [29]. Primary antibodies against insulin-like
growth factor-1 receptor (IGF1R) (AF6125, 1:1000, Affinity Biosciences, OH) and
-actin (#4970S, 1:1000, Cell Signaling Technology, Massachusetts) were
used. The secondary antibody was an anti-rabbit alkaline phosphatase-conjugated
antibody (S373B, 1:7500, Promega, Wisconsin). Proteins were visualized using
Stabilized Substrate for Alkaline Phosphatase (S3841, Promega) and the FluorChem
R system (ProteinSimple, San Jose, CA, USA).
2.9 Luciferase Activity Assay
pmiR-RB-REPORT dual luciferase reporter vectors carrying the 3-untranslated
region (UTR) of insulin-like growth factor-1 receptor containing wildtype or
mutated target sites for miR-297b-5p were constructed by RiboBio (Guangzhou,
Guangdong, China). Plasmids (200 ng) were cotransfected into human embryonic
kidney (HEK-293) cells (ATCC, Manassas, VA, USA) with miR-297b-5p mimics or the
negative control. After transfection for 24 h, a dual luciferase reporter assay
kit (E1910, Promega, Madison, WI, USA) was used to measure luciferase activity in
a GloMax20/20 Luminometer (Promega) [29].
2.10 Animal Experiments
Overall, 7-week-old male C57BL/6 mice were purchased from Beijing Vital River
Laboratory Animal Technology Company (Beijing, China). After adaptation, they
were randomly divided into two groups that were either fed a control diet or a
diet high in stearic acid (n = 15 per group). The compositions of normal and high
stearic acid diets were the same as described in our previous study [29]. After
12 weeks of feeding, the mice were sacrificed by CO asphyxiation followed
by the collection of pancreatic tissue and blood samples. Mouse islets were
isolated by Procell Life Science & Technology Co., Ltd. (Wuhan, Hubei, China).
2.11 Intravenous Glucose Tolerance Testing
After overnight fasting, the mice were administered glucose (0.75 g/kg) via the
tail vein, as described previously [5]. Serum insulin and glucose concentrations
were measured 0, 1, 5, 10, 20, 30, and 60 min after the administration of
glucose.
2.12 Serum Fatty Acid Profile Analysis and Lipid Measurements
Non-esterified fatty acid profile analysis of fasting serum was performed using
a TRACE gas chromatograph with a Polaris Q mass spectrometer (Thermo Finnigan,
Austin, TX, USA), as described previously [3]. Fasting glucose, total cholesterol
(TC), triacylglycerol (TG), high-density lipoprotein cholesterol (HDL-C), and
low-density lipoprotein cholesterol (LDL-C) levels were measured by an automatic
analyzer (Hitachi-7100, Hitachi, Tokyo, Japan). All kits were purchased from
Biosino Biotechnology (Beijing, China). Serum insulin levels were measured using
a mouse/rat insulin ELISA kit (Cat. No. EZRMI-13K, Millipore, Burlington, MA,
USA) with a standard curve ranging from 0.2–10 ng/mL. Inter- and intra-assay
variations of this kit were 6.0–17.9 and 0.9–8.4, respectively.
2.13 Immunohistochemical Analysis
Pancreatic tissues were fixed and then embedded in paraffin. Insulin-positive
-cells were immunostained with anti-insulin antibody (BM1621, Boster),
and glucagon-positive -cells were immunolabeled with anti-glucagon
antibody (3014S, Cell Signaling Technology) [5].
2.14 Real-Time Quantitative Polymerase Chain Reaction
Total RNA was extracted from -TC6 cells using TRIzol reagent (15596026,
Invitrogen, Carlsbad, CA, USA), as described in our previous study [29]. mirVana
miRNA Isolation Kit (AM1561, Ambion, Austin, TX, USA) was used for miRNA
isolation. Quantitative polymerase chain reaction was performed using SYBR Green
PCR Master Mix (4367659, Applied Biosystems, Foster City, CA, USA). Levels were
normalized to -actin for mRNA and U6 for miRNA. All primers were
synthesized by Sangon Biotech Co. Ltd. (Shanghai, China), and their sequences are
listed in Table 2.
Table 2.Primer sequences used for qPCR.
| Genes |
Sequences (5-3) |
| miR-297b-5p |
|
|
Reverse transcription |
GTCGTATCCAGTGCGTGTCGTGGAGTCGGCAATTGCACTGGATACGACACATGT |
|
Forward |
GGGGATGTATGTGTGCATGA |
|
Reverse |
GTATCCAGTGCGTGTCGTG |
| U6 |
|
|
Reverse transcription |
CGCTTCACGAATTTGCGTGTCAT |
|
Forward |
GCTTCGGCAGCACATATACTA |
|
Reverse |
CGCTTCACGAATTTGCGTGTC |
| Actb |
|
|
Forward |
TGACGATATCGCTGCGCTGGTC |
|
Reverse |
CATTCCCACCATCACACCCTGG |
| Ins1 |
|
|
Forward |
CTGTTGGTGCACTTCCTACCCC |
|
Reverse |
TTGTTCCACTTGTGGGTCCTC |
| Mafa |
|
|
Forward |
ATCCATGTCCGTGCGGGAGCTGAA |
|
Reverse |
TCGCTCTCCAGAATGTGCCGCT |
| Cat |
|
|
Forward |
CTTCAGGGCCGCCTTTTTGCCT |
|
Reverse |
ATAGTTGGGGGCACCACCCTGGTT |
| Ldha |
|
|
Forward |
ACAAGCAGGTGGTGGACAGTGCCT |
|
Reverse |
TGGGATGCACCCGCCTAAGGTT |
| Igf1r |
|
|
Forward |
TGGCCGACGAGTGGAGAAATCTGT |
|
Reverse |
TCGGCCTTGGAGATGAGCAGGA |
| Bambi |
|
|
Forward |
TGCCGAGCCAAACAGGCCCAAA |
|
Reverse |
ACCGGTTTCCTTGTCCTGAGGCT |
| Cdkn2a |
|
|
Forward |
CCCAACGCCCCGAACT |
|
Reverse |
GCAGAAGAGCTGCTACGTGAA |
| Trp53bp1 |
|
|
Forward |
CTGTGAAAGTTCTAGTGAAACTCC |
|
Reverse |
TTAGGTGCCCAATAAGAGGTGG |
| Cd99 |
|
|
Forward |
GCGGCGAGTGACGACTTCAA |
|
Reverse |
TCCAGGTCGAAGCCTCCTGA |
| Ccl2 |
|
|
Forward |
ATGCAGTTAACGCCCCACTCAC |
|
Reverse |
GAGCTTGGTGACAAAAACTACAGC |
| Il6 |
|
|
Forward |
AGTTCCTCTCTGCAAGAGACTTC |
|
Reverse |
AAGTCTCCTCTCCGGACTTGTG |
| Tnfa |
|
|
Forward |
TCATTCCTGCTTGTGGCAGGGG |
|
Reverse |
TCCACTTGGTGGTTTGTGAGTGT |
2.15 Statistical Analysis
All data were presented as mean standard deviation. SPSS version 21.0
(IBM Corp., Armonk, NY, USA) was used for statistical analysis. Differences
between two groups were analyzed using a two-tailed Student t-test.
One-way ANOVA followed by a Student-Newman–Keuls test was carried out to test
differences among multiple groups. A two-sided p value 0.05 was
considered statistically significant.
3. Results
Accumulated evidence indicates that -cell senescence is a promising
target to prevent -cell dysfunction elicited by a long-term high-fat
diet during type 2 diabetes development. However, the mechanism underlying
saturated fatty acid-induced -cell senescence is not yet understood and
there are currently no effective agents to prevent this effect. In this study, we
aimed to investigate the protective effect of metformin on stearic acid-promoted
-cell senescence and to explore the potential role of miR-297b-5p in
this process. We found that metformin dramatically ameliorates stearic
acid-evoked -cell senescence through the upregulation of miR-297b-5p,
which effectively reverses the increase in insulin-like growth factor-1 receptor
expression triggered by stearic acid. These results provide a potential target to
not only prevent high saturated fat diet-induced -cell dysfunction but
also for the therapeutic use of metformin to prevent or delay the onset of type 2
diabetes.
3.1 Metformin Ameliorates Stearic
Acid-Induced Senescence of Mouse -TC6 Cells
We assessed the effect of metformin on the survival rate of -TC6 cells
and we observed a significant destructive effect only at concentrations
400 µmol/L (Fig. 1A, Supplementary Fig. 1). Incubation of
-TC6 cells, for various times (6, 12, 24, and 48 h), with 50
µmol/L metformin, a concentration previously used by others [23, 34], showed that cell viability was significantly impacted only after 48 h
incubation (Fig. 1B). Treatment with 50 µmol/L metformin for 24 h
significantly reversed stearic acid-reduced -cell viability (Fig. 1C).
Moreover, stearic acid-impaired glucose-stimulated insulin secretion was
remarkably recovered upon metformin treatment (Fig. 1D). Additionally, metformin
reversed the upregulation of aging (Igf1r and Bambi) and
senescence markers (Cdkn2a and Trp53bp1), senescence-associated
secretory phenotype factors (Ccl2, Il6, Tnfa, and Cd99),
and forbidden genes (Cat and Ldha), and the
downregulation of -cell identity genes (Ins1 and Mafa)
(Fig. 1E) induced by stearic acid, along with the increase in
senescence-associated -galactosidase activity (Fig. 1F). Immunofluorescence analysis also demonstrated the ability of metformin to
attenuate the rise in fluorescence intensity of insulin-like growth factor-1
receptor observed in the presence of stearic acid (Fig. 1G).
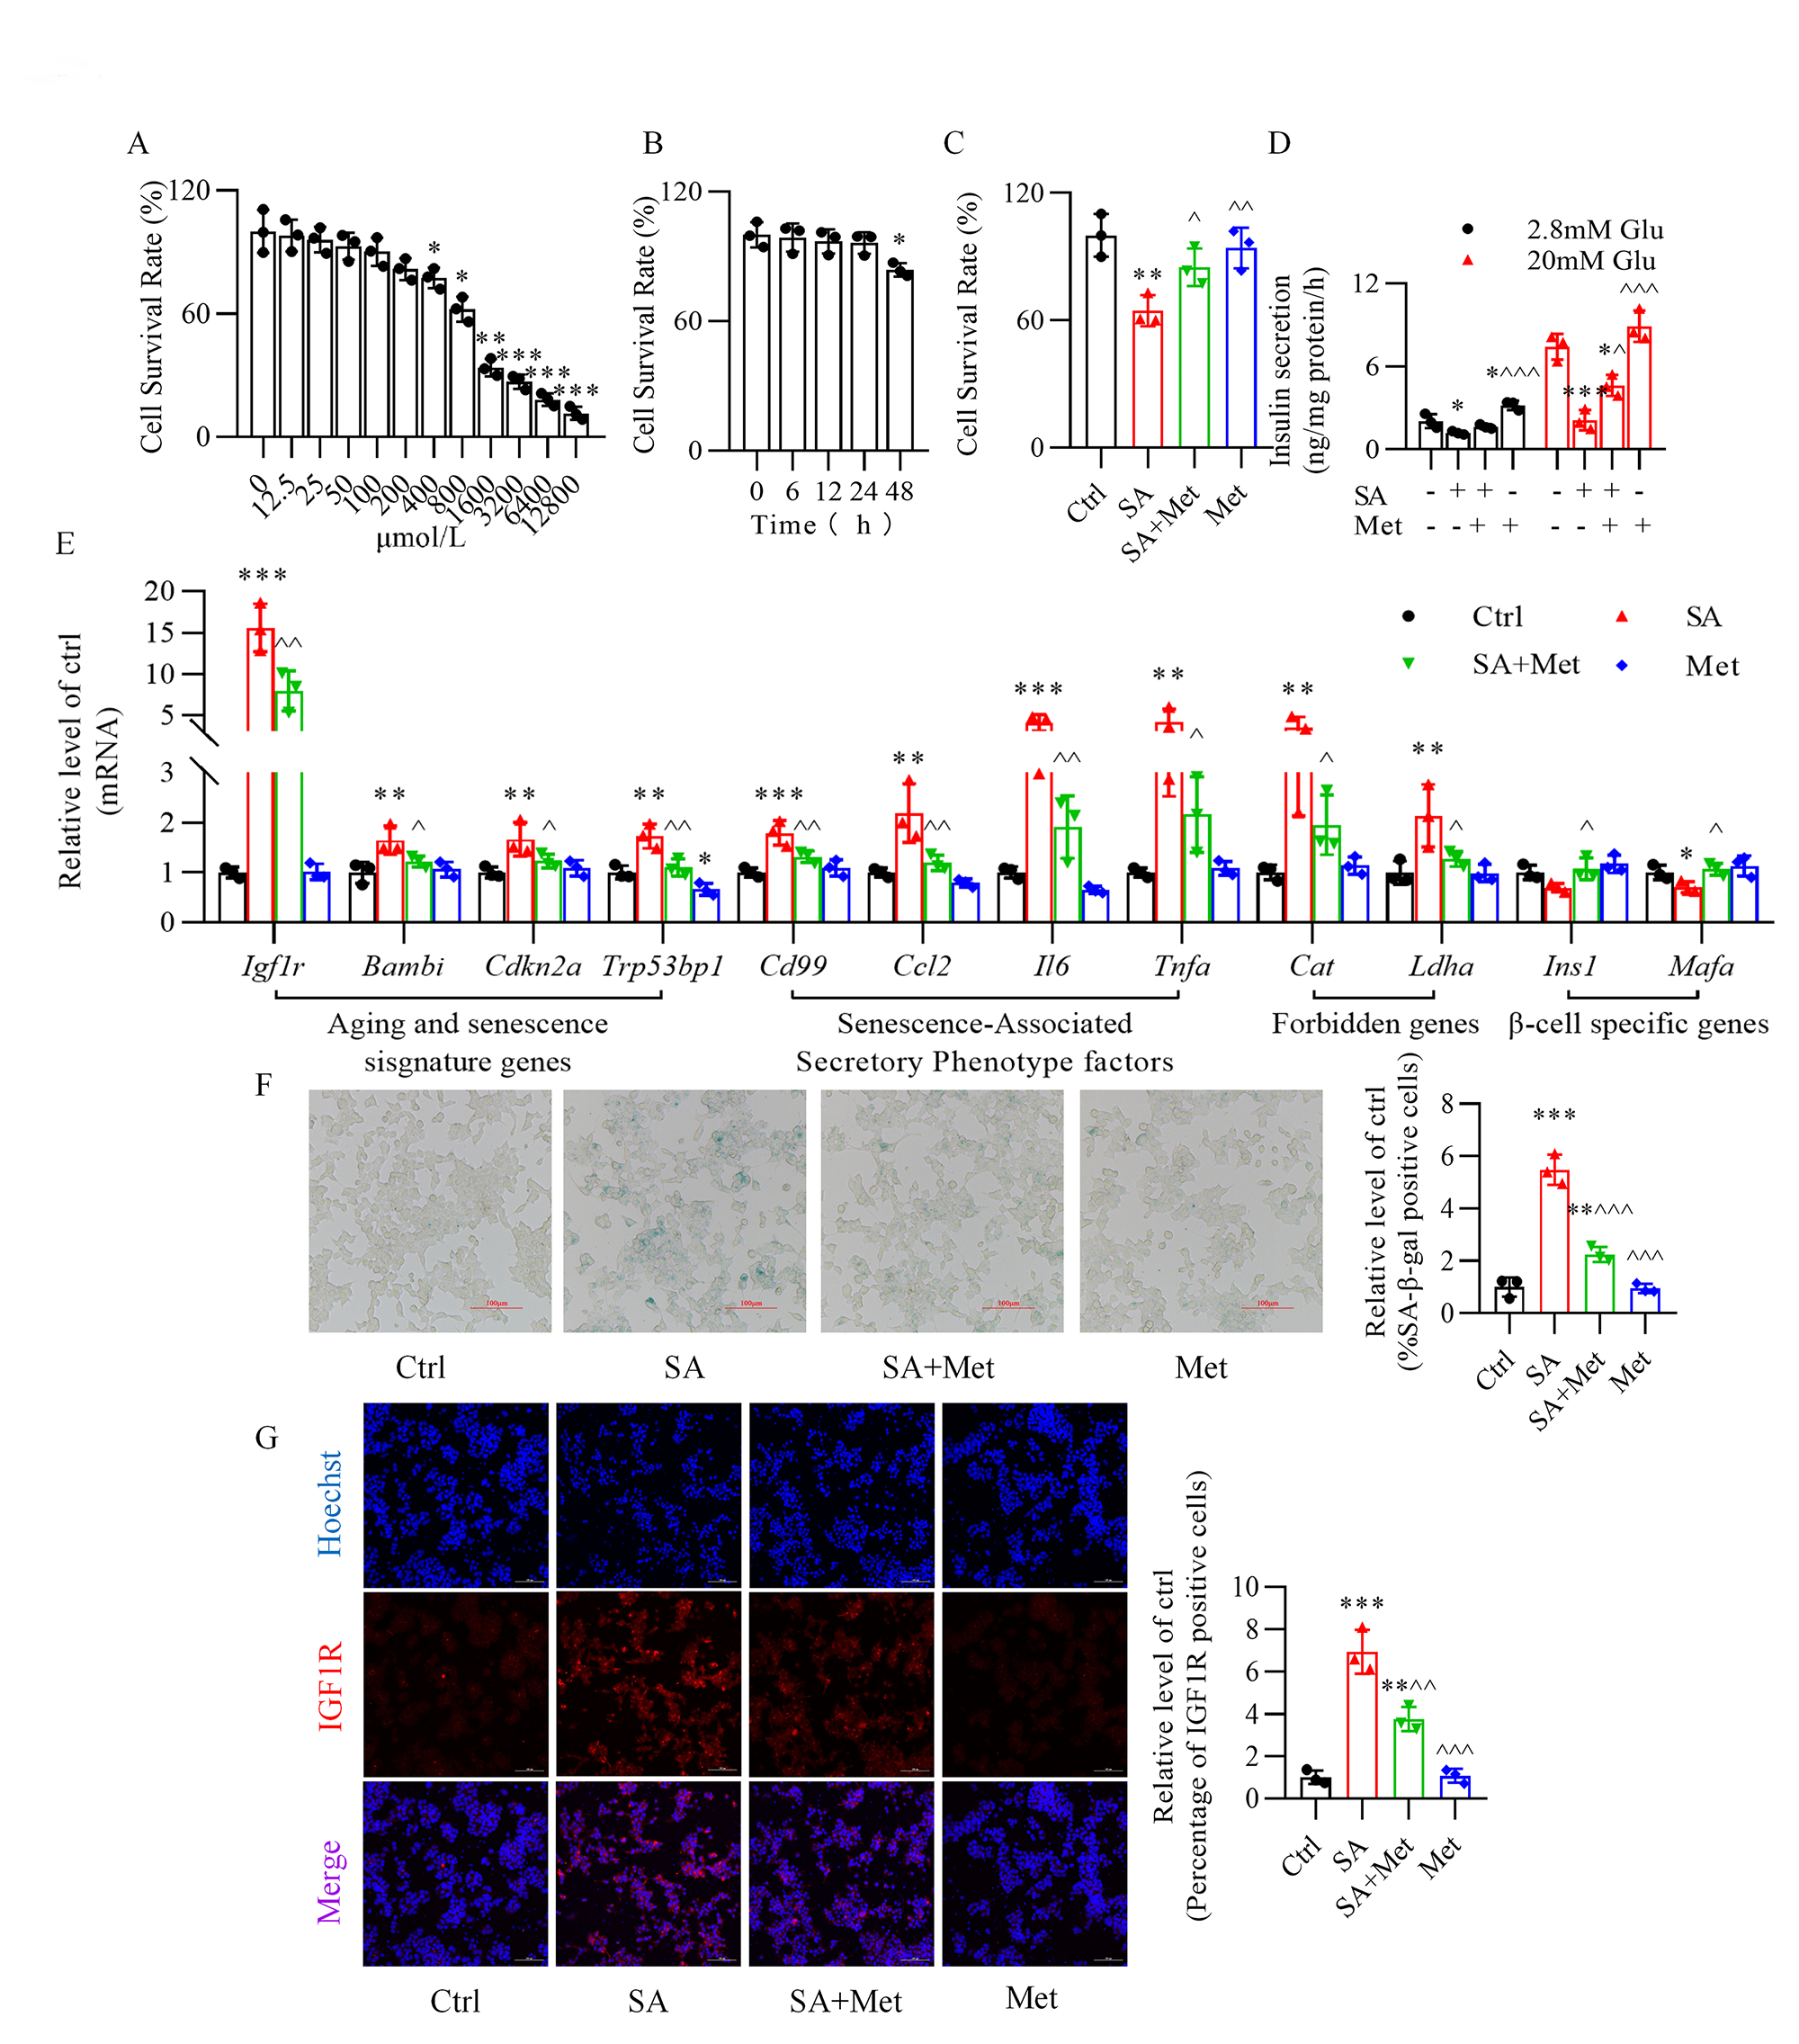 Fig. 1.
Metformin protects against stearic acid-induced senescence in
mouse -TC6 cells. (A) Cytotoxic effect of metformin on the survival
rate of -TC6 cells at various concentrations (0, 12.5, 25, 50, 100, 200,
400, 800, 1600, 3200, 6400, and 12800 µmol/L). p 0.05,
p 0.01, p 0.001 vs. 0 mmol/L
group. (B) Cytotoxic effect of 50 µmol/L metformin on -cell
viability at various times (0, 6, 12, 24, and 48 h). p 0.05
vs. 0 h group. (C,D) Protective effect of metformin on the cell
survival rate and glucose-stimulated insulin secretion in stearic acid-treated
-TC6 cells. (E) Changes in expression of senescence-related genes after
treatment of -TC6 cells with metformin in the presence or absence of
stearic acid. (F) Effect of metformin on -galactosidase activity with or
without stearic acid treatment. (G) Immunofluorescence analysis shows the
expression of insulin-like growth factor-1 receptor (IGF1R) in -TC6
cells treated with metformin in the presence or absence of stearic acid. Hoechst,
blue; IGF1R, red. For C–G, p 0.05, p 0.01, p 0.001 vs. Ctrl group;
p 0.05,
p 0.01,
p 0.001
vs. SA group. Ctrl, control group; SA, stearic acid; Met, metformin. For
F and G, scale bar: 100 µm. Each independent experiment was repeated three
times.
3.2 Metformin Reverses the Decrease in -Cell miR-297b-5p
Expression Caused by Stearic Acid
The level of miR-297b-5p was significantly decreased in stearic acid-treated
-TC6 cells (Fig. 2). The effect observed in -TC6 cells was
reversed by metformin. However, no change in miR-297b-5p expression was observed
after metformin treatment in the absence of stearic acid (Fig. 2).
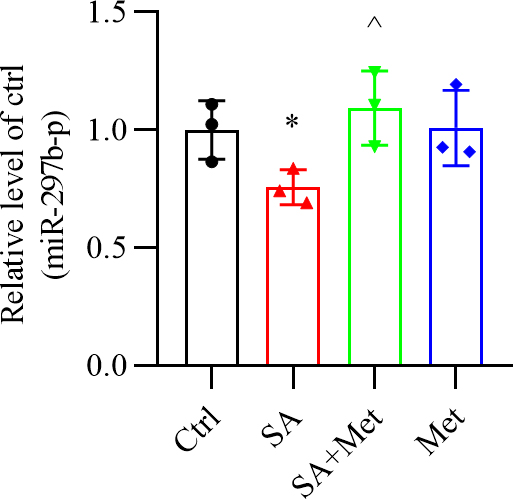 Fig. 2.
Alteration of miR-297b-5p expression in stearic acid-treated
-TC6 cells. miR-297b-5p expression in stearic acid-treated
-TC6 cells in the absence or presence of metformin. p
0.05 vs. Ctrl group, p 0.05
vs. SA group. n = 3. Ctrl, control group; SA, stearic acid; Met,
metformin.
3.3 Role of miR-297b-5p in the Impairment of Glucose-Stimulated
Insulin Secretion and in Senescence Induced by Stearic Acid
Transfection of miR-297b-5p mimics into pancreatic -TC6 cells resulted
in the upregulation of miR-297b-5p expression in the absence or presence of
stearic acid (Fig. 3A). Overexpression of miR-297b-5p improved
the survival rate of -TC6 cells (Fig. 3B) and
glucose-stimulated insulin secretion (Fig. 3C) in the presence of stearic acid.
Additionally, stearic acid induced the upregulation of
senescence-related genes (Cat, Ldha, Igf1r, Bambi,
Cdkn2a, Trp53bp1, Cd99, Ccl2, Il6, and Tnfa), while the downregulation
of Ins1 and Mafa largely returned to normal after the transfection of
miR-297b-5p mimics (Fig. 3D). Moreover, the increase in the percentage of
senescence-associated -galactosidase-positive cells and the fluorescence
intensity of the insulin-like growth factor-1 receptor caused by stearic acid was
reversed after overexpressing miR-297b-5p (Fig. 3E,F). Conversely,
transfection of the miR-297b-5p inhibitor decreased the level of this miRNA (Fig. 4A). In the absence of stearic acid, the inhibition of miR-297b-5p had no
significant effect on cell viability (Fig. 4B); however, it led to impaired
insulin secretion (Fig. 4C), abnormal changes in senescence-related genes
expression (Fig. 4D), increased senescence-associated -galactosidase
activity (Fig. 4E), and increased the fluorescence intensity of the insulin-like
growth factor-1 receptor (Fig. 4F), which were reversed by miR-297b-5p
overexpression.
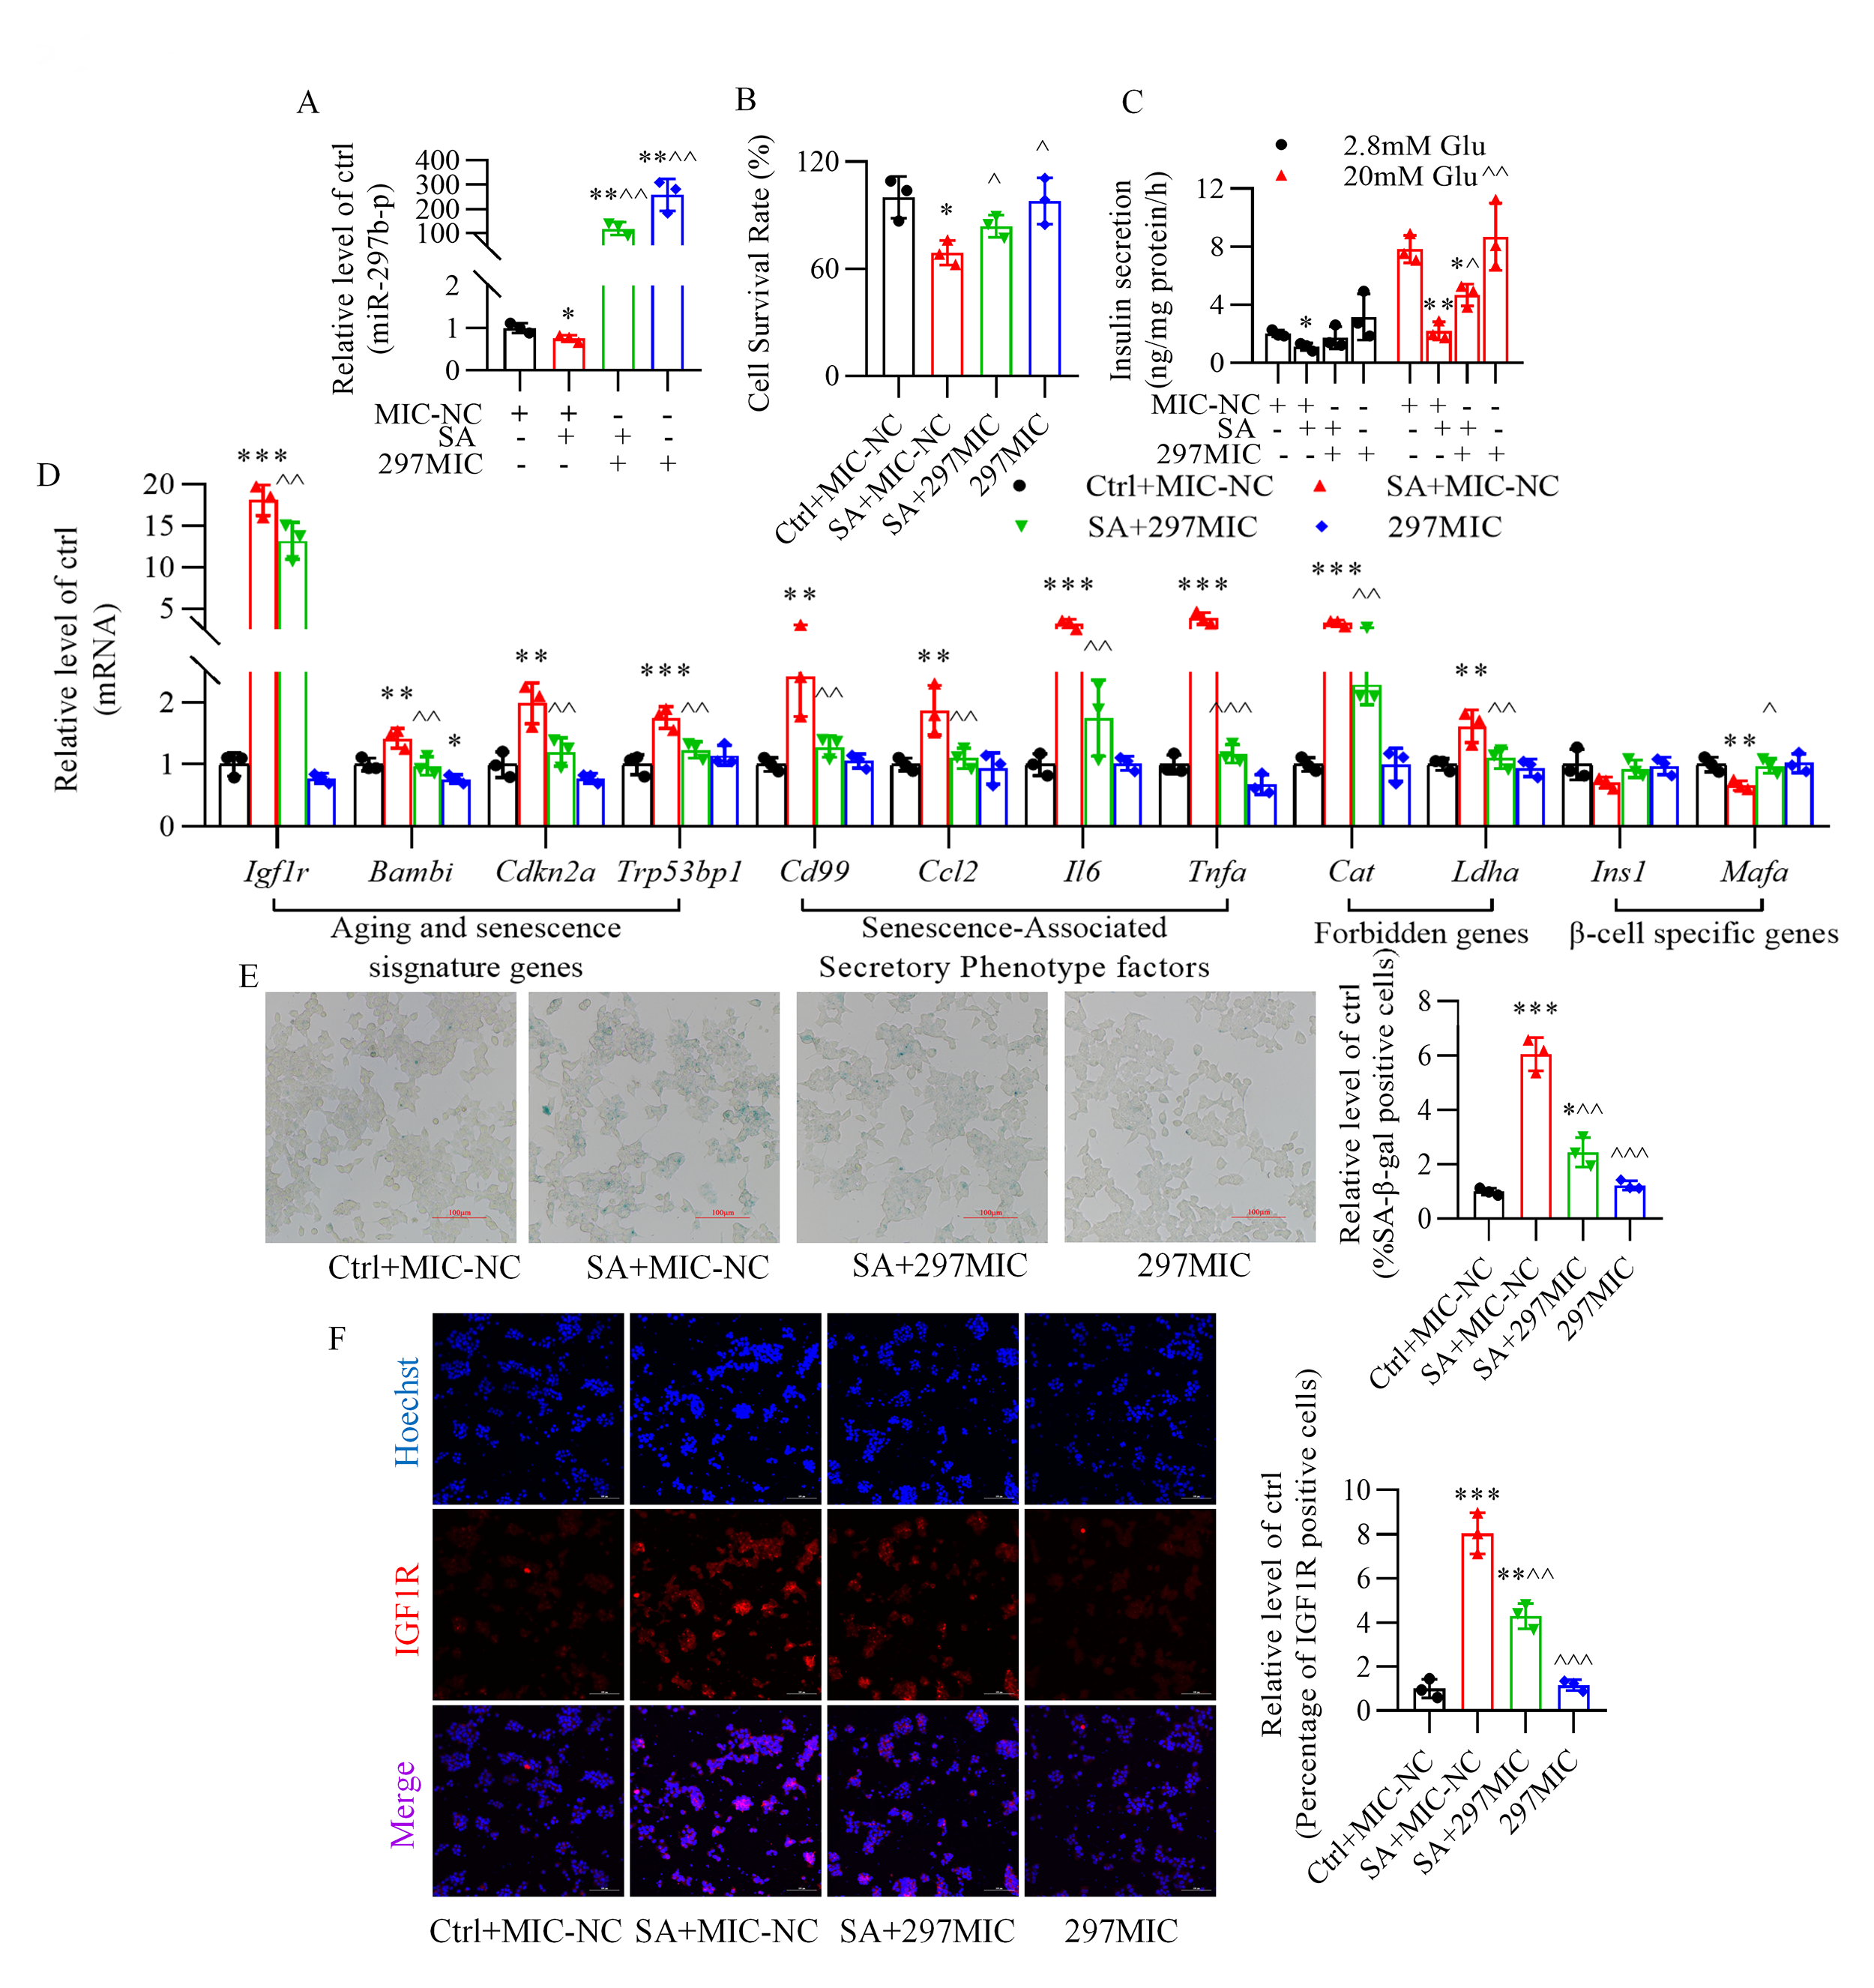 Fig. 3.
Role of miR-297b-5p in cellular senescence and impaired
glucose-stimulated insulin secretion induced by stearic acid in -TC6
cells. (A) Changes in miR-297b-5p expression after transfection of miR-297b-5p
mimics in the presence of stearic acid. (B,C) Effect of miR-297b-5p mimics on
the stearic acid-decreased cell survival rate and glucose-stimulated insulin
secretion. (D–F) miR-297b-5p overexpression reverses senescence-related genes
expression, -galactosidase activity, and the expression of insulin-like
growth factor-1 receptor (IGF1R) (red) in stearic acid-treated -TC6
cells. p 0.05, p 0.01, p 0.001 vs. Ctrl+MIC-NC group; p
0.05, p 0.01,
p 0.001
vs. SA+MIC-NC group. Ctrl, control group; MIC-NC, miR-297b-5p mimics
negative control; SA, stearic acid; 297MIC, miR-297b-5p mimic; Glu, glucose. For
(E) and (F), scale bar: 100 µm. Each independent experiment was repeated
three times.
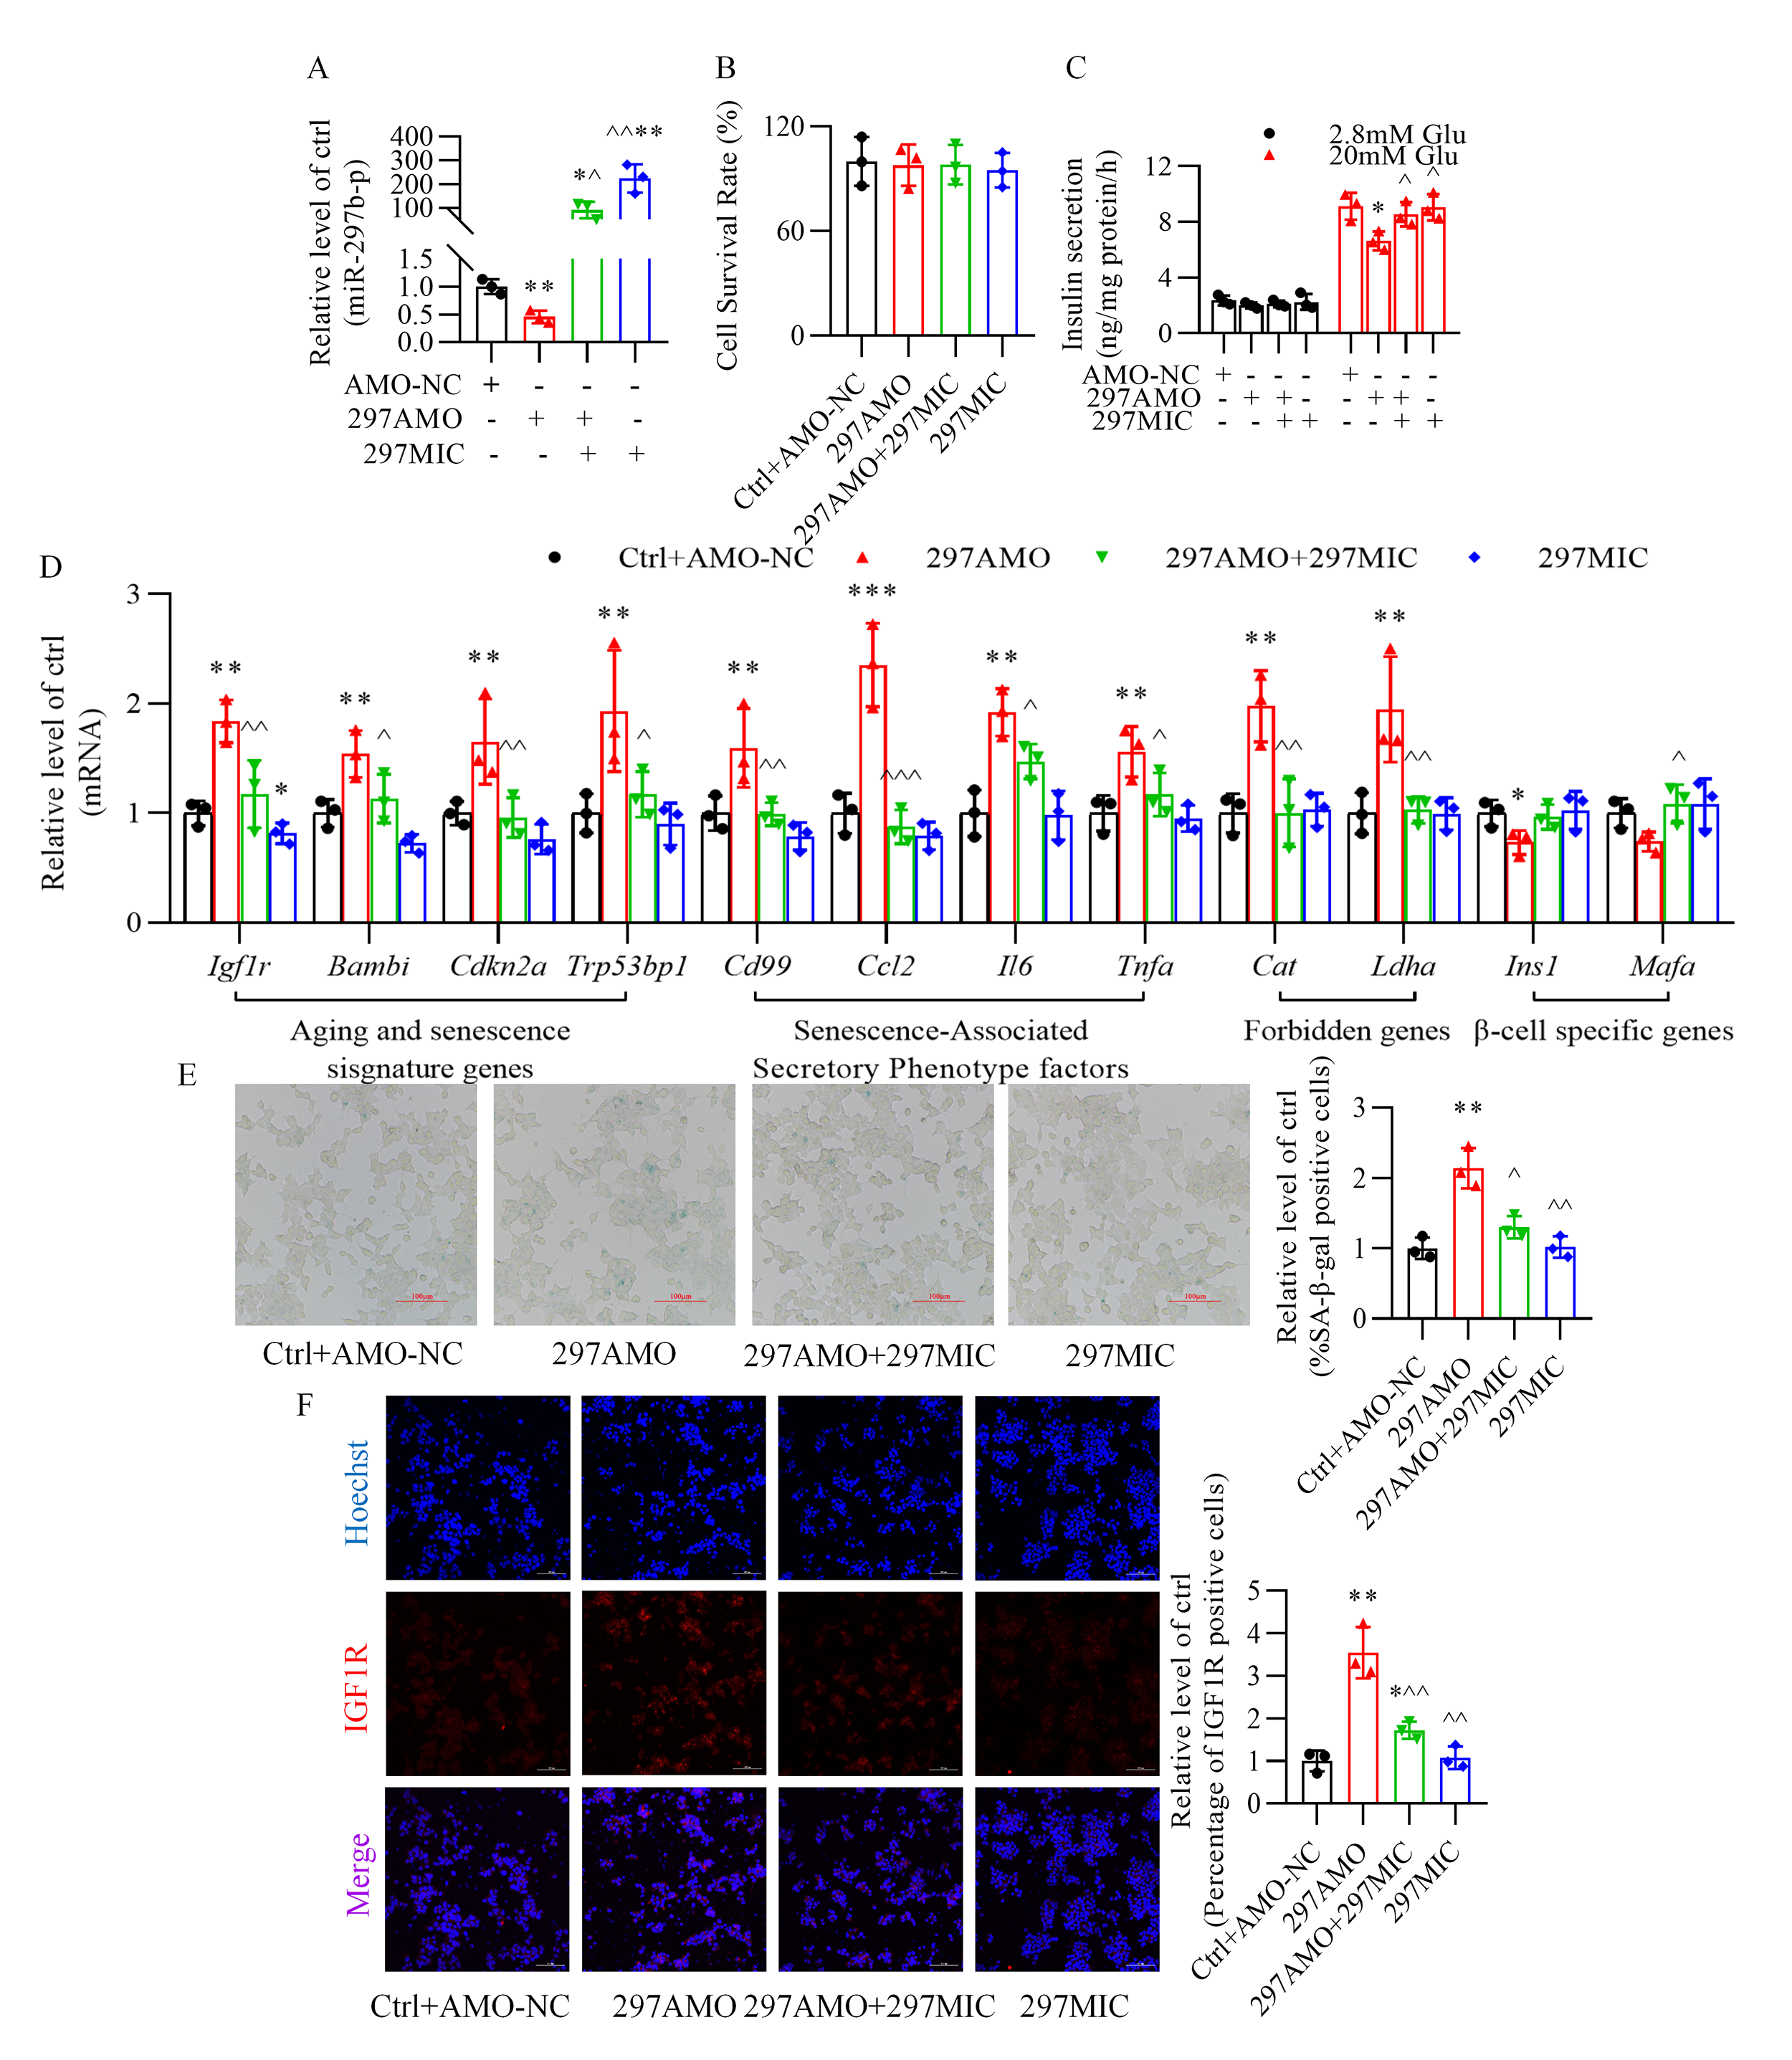 Fig. 4.
Role of miR-297b-5p in -TC6 cell senescence and
glucose-stimulated insulin secretion in the absence of stearic acid. (A) Changes
in miR-297b-5p expression upon transfection of anti-miR-297b-5p oligonucleotides
alone. (B,C) Effect of anti-miR-297b-5p oligonucleotides on cell viability
and glucose-stimulated insulin secretion in the absence of stearic acid. (D)
Alteration of senescence-related gene expression after inhibition of miR-297b-5p.
(E) X-galactosidase staining showing an increase in -galactosidase
activity after transfection of anti-miR-297b-5p oligonucleotides. (F)
Immunofluorescence of insulin-like growth factor-1 receptor was enhanced after
inhibition of miR-297b-5p. Hoechst, blue; IGF1R, red. p 0.05,
p 0.01, p 0.001 vs. Ctrl+AMO-NC
group; p 0.05,
p 0.01,
p 0.001
vs. 297AMO group. Ctrl, control group; AMO-NC, anti-miR-297b-5p
oligonucleotide negative control; 297AMO, anti-miR-297b-5p oligonucleotides;
297MIC, miR-297b-5p mimics; Glu, glucose. For (E) and (F), scale bar: 100
µm. Each independent experiment was repeated three times.
3.4 Validation of Insulin-Like Growth Factor-1 Receptor as the
Direct Target of miR-297b-5p
Prediction of the binding site of miR-297b-5p in the 3-untranslated region of
the insulin-like growth factor-1 receptor is shown in Fig. 5A. Insulin-like
growth factor-1 receptor expression at both the mRNA and protein levels was
significantly increased in the -TC6 cells by stearic acid, an effect
that was markedly reversed by miR-297b-5p mimics. Furthermore, overexpression of
miR-297b-5p alone inhibited insulin-like growth factor-1 receptor expression
(Fig. 5B,C). Conversely, inhibition of miR-297b-5p increased the level of
insulin-like growth factor-1 receptor (Fig. 5D,E). Moreover, miR-297b-5p
overexpression significantly decreased luciferase activity in human embryonic
kidney (HEK293) cells transfected with a plasmid carrying the wildtype
3-untranslated region of insulin-like growth factor-1 receptor (Fig. 5F).
Additionally, metformin prevented the rise of the insulin-like growth factor-1
receptor induced by stearic acid (Fig. 5G).
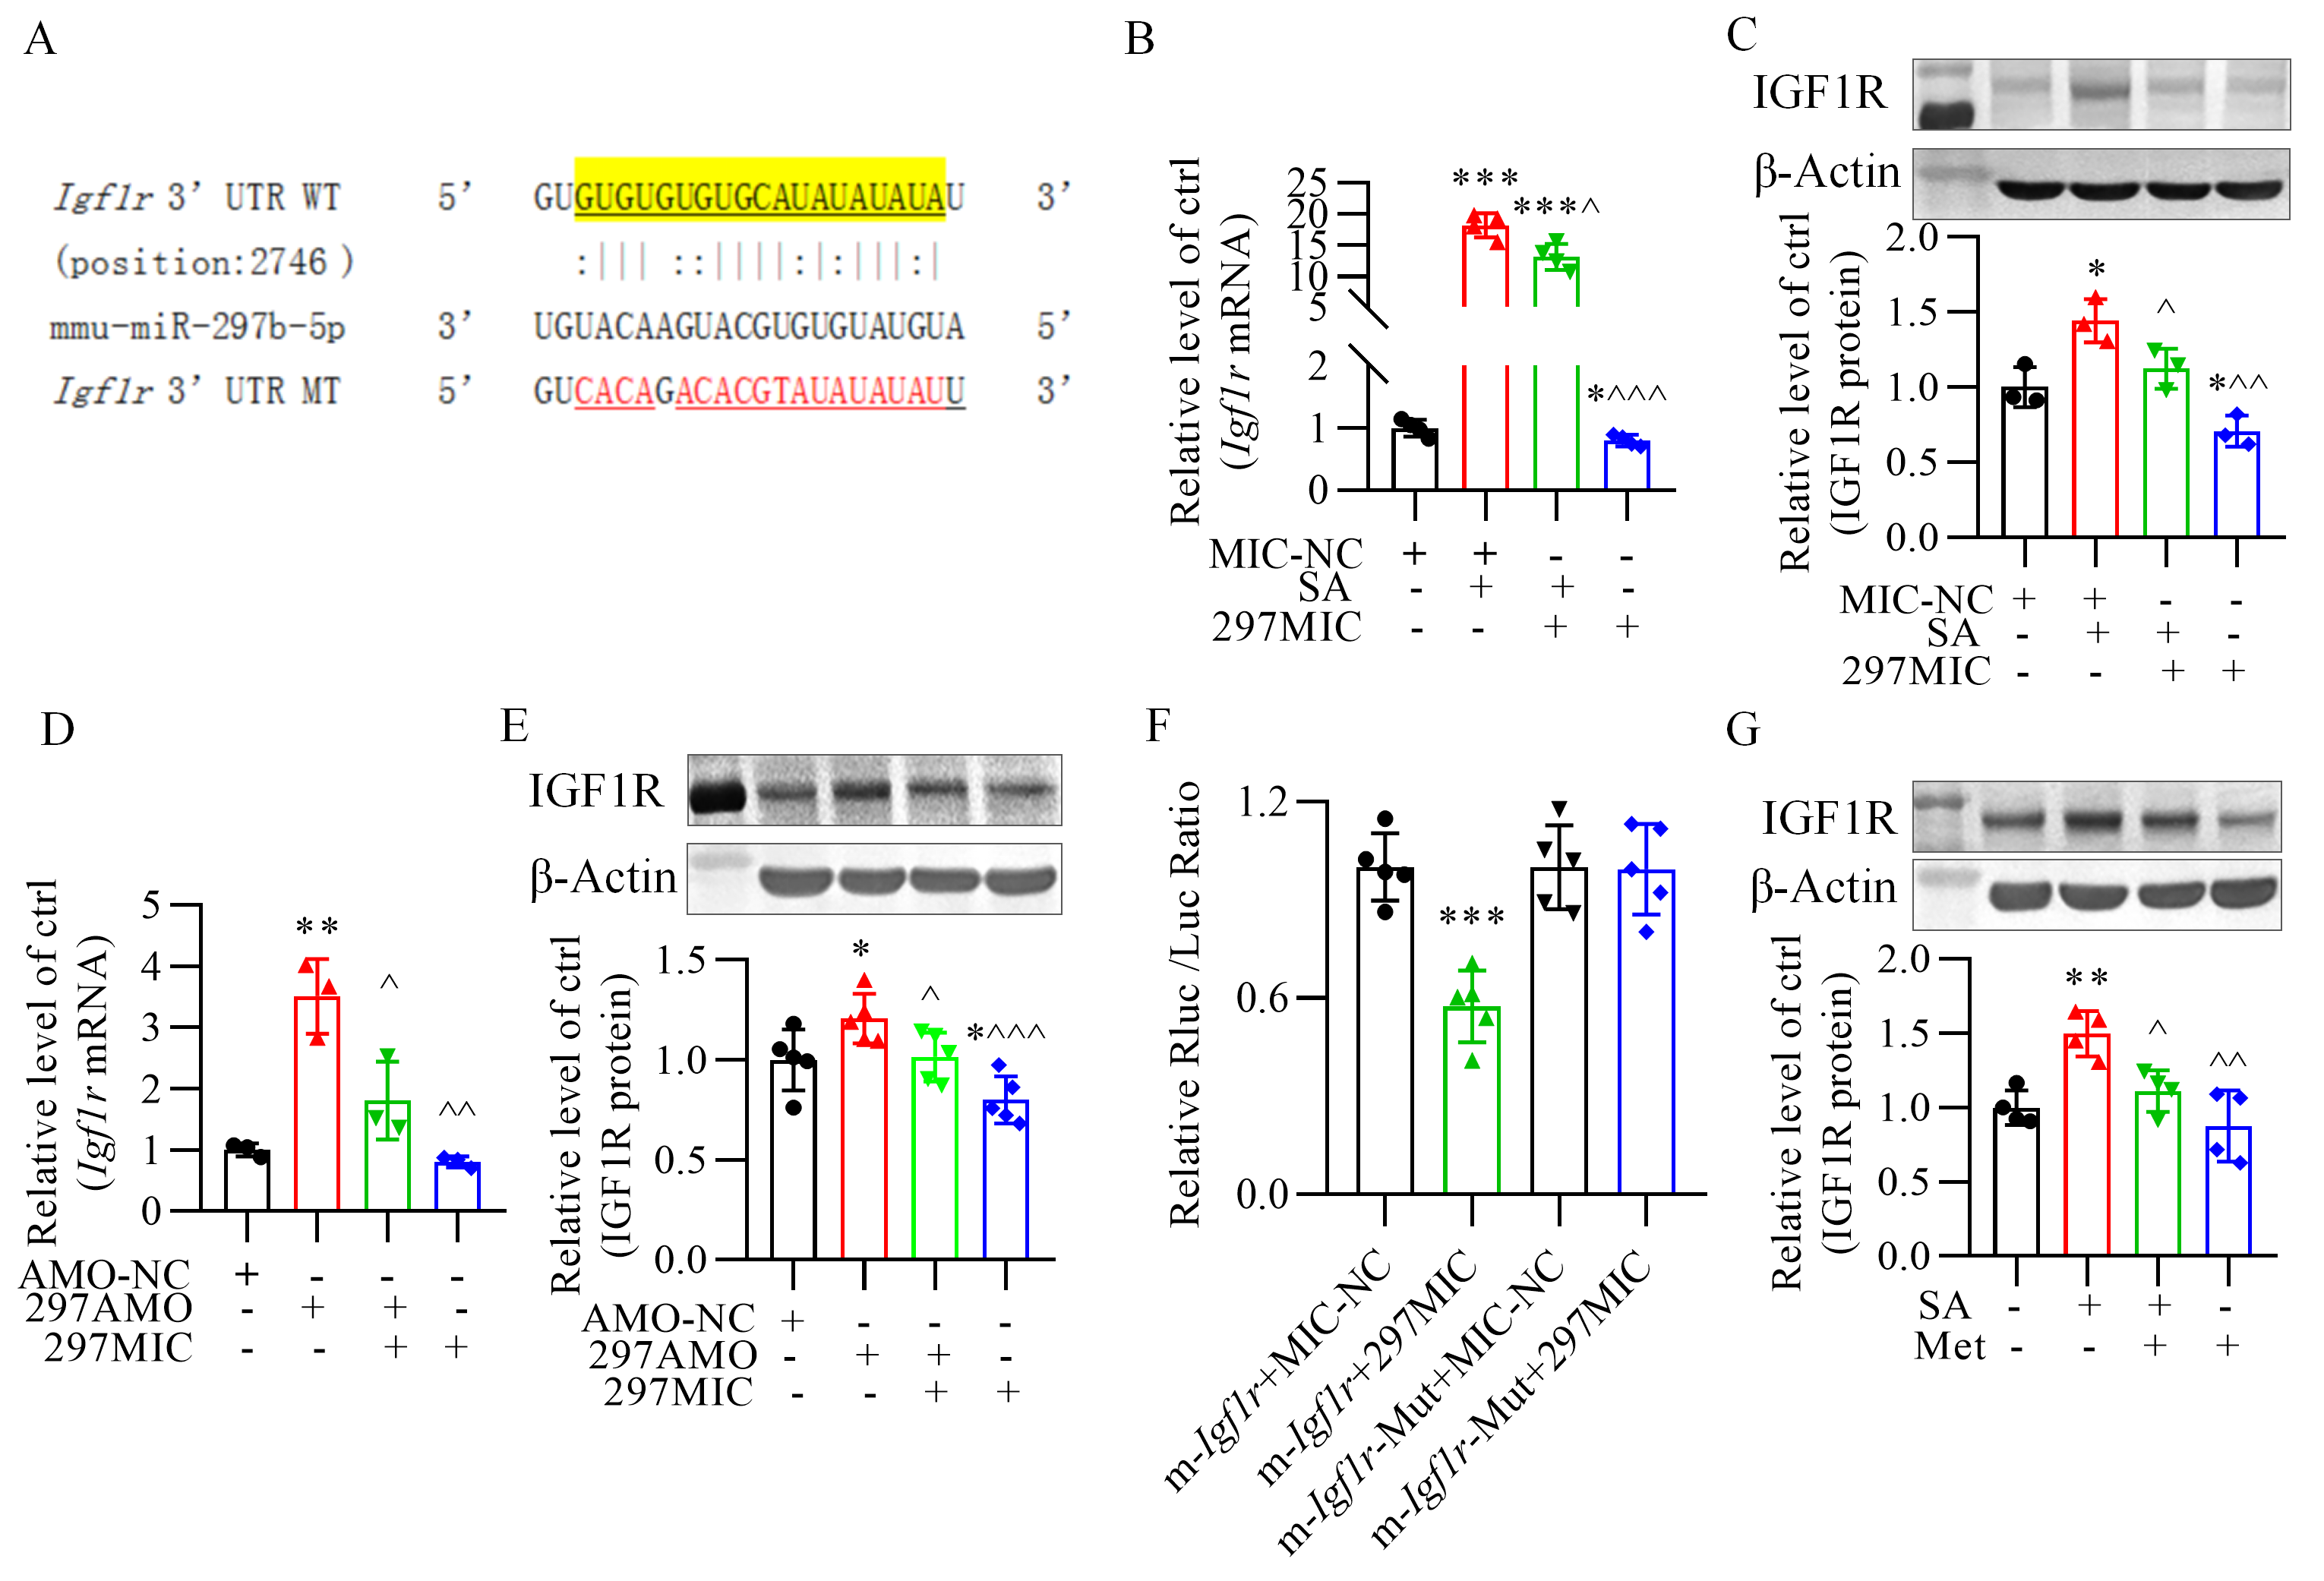 Fig. 5.
Insulin-like growth factor-1 receptor is the direct target of
miR-297b-5p. (A) Prediction of the binding site between 3-untranslated region
(UTR) of insulin-like growth factor-1 receptor and miR-297b-5p. (B,C) Effect
of miR-297b-5p on Igf1r expression at both mRNA and protein levels in
-TC6 cells treated with or without stearic acid. p
0.05, p 0.001 vs. Ctrl+MIC-NC group,
p 0.05,
p 0.01,
p 0.001
vs. SA+MIC-NC group. For (B), n = 4; For C, n = 3. MIC-NC, miR-297b-5p
mimics negative control; SA, stearic acid; 297MIC, miR-297b-5p mimic. (D,E)
Changes in insulin-like growth factor-1 receptor expression at mRNA and protein
levels after inhibition or overexpression of miR-297b-5p. p 0.05, p 0.01 vs. the Ctrl+AMO-NC group,
p 0.05,
p 0.01,
p 0.001
vs. 297AMO group. For (D), n = 3; For (E), n = 5. AMO-NC,
anti-miR-297b-5p oligonucleotide negative control; 297AMO, anti-miR-297b-5p
oligonucleotides; 297MIC, miR-297b-5p mimics. (F) Luciferase reporter assay
verifying the inhibitory effect of miR-297b-5p mimics on luciferase activity of a
plasmid carrying 3-untranslated region (UTR) of insulin-like growth factor-1
receptor (Igf1r) (wildtype). p 0.001 vs.
m-Igf1r+MIC-NC group. n = 5. m-Igf1r+MIC-NC, plasmid carrying
the wildtype 3-untranslated region (UTR) of the Igf1r gene +
miR-297b-5p mimics negative control; m-Igf1r-Mut+MIC-NC, plasmid
carrying a mutant 3-untranslated region (UTR) of the Igf1r gene +
miR-297b-5p mimics negative control. (G) Effect of metformin on insulin-like
growth factor-1 receptor (IGF1R) protein expression in the presence of stearic
acid. p 0.01 vs. Ctrl group.
p 0.05,
^^p 0.01 vs. SA group. n
= 4. Met, metformin; SA, stearic acid.
3.5 Inhibition of Insulin-Like Growth Factor-1 Receptor Ameliorates
Stearic Acid-Stimulated the Impairment in Glucose-Stimulated Insulin Secretion
and Prevents Senescence of -TC6 Cells
In -TC6 cells, transfection of siRNA-Igf1r efficiently
decreased insulin-like growth factor-1 receptor expression with or without
stearic acid treatment (Fig. 6A). Silencing insulin-like growth factor-1 receptor
significantly blocked the reduction in insulin secretion caused by stearic acid
(Fig. 6B), yet not the decrease in cell viability (Fig. 6C). Furthermore,
knockdown of insulin-like growth factor-1 receptor reversed the abnormal
expression of senescence-related genes (Fig. 6D), the increase in
senescence-associated -galactosidase-positive cells (Fig. 6E), and the
rise in fluorescence intensity of insulin-like growth factor-1 receptor (Fig. 6F), triggered by stearic acid.
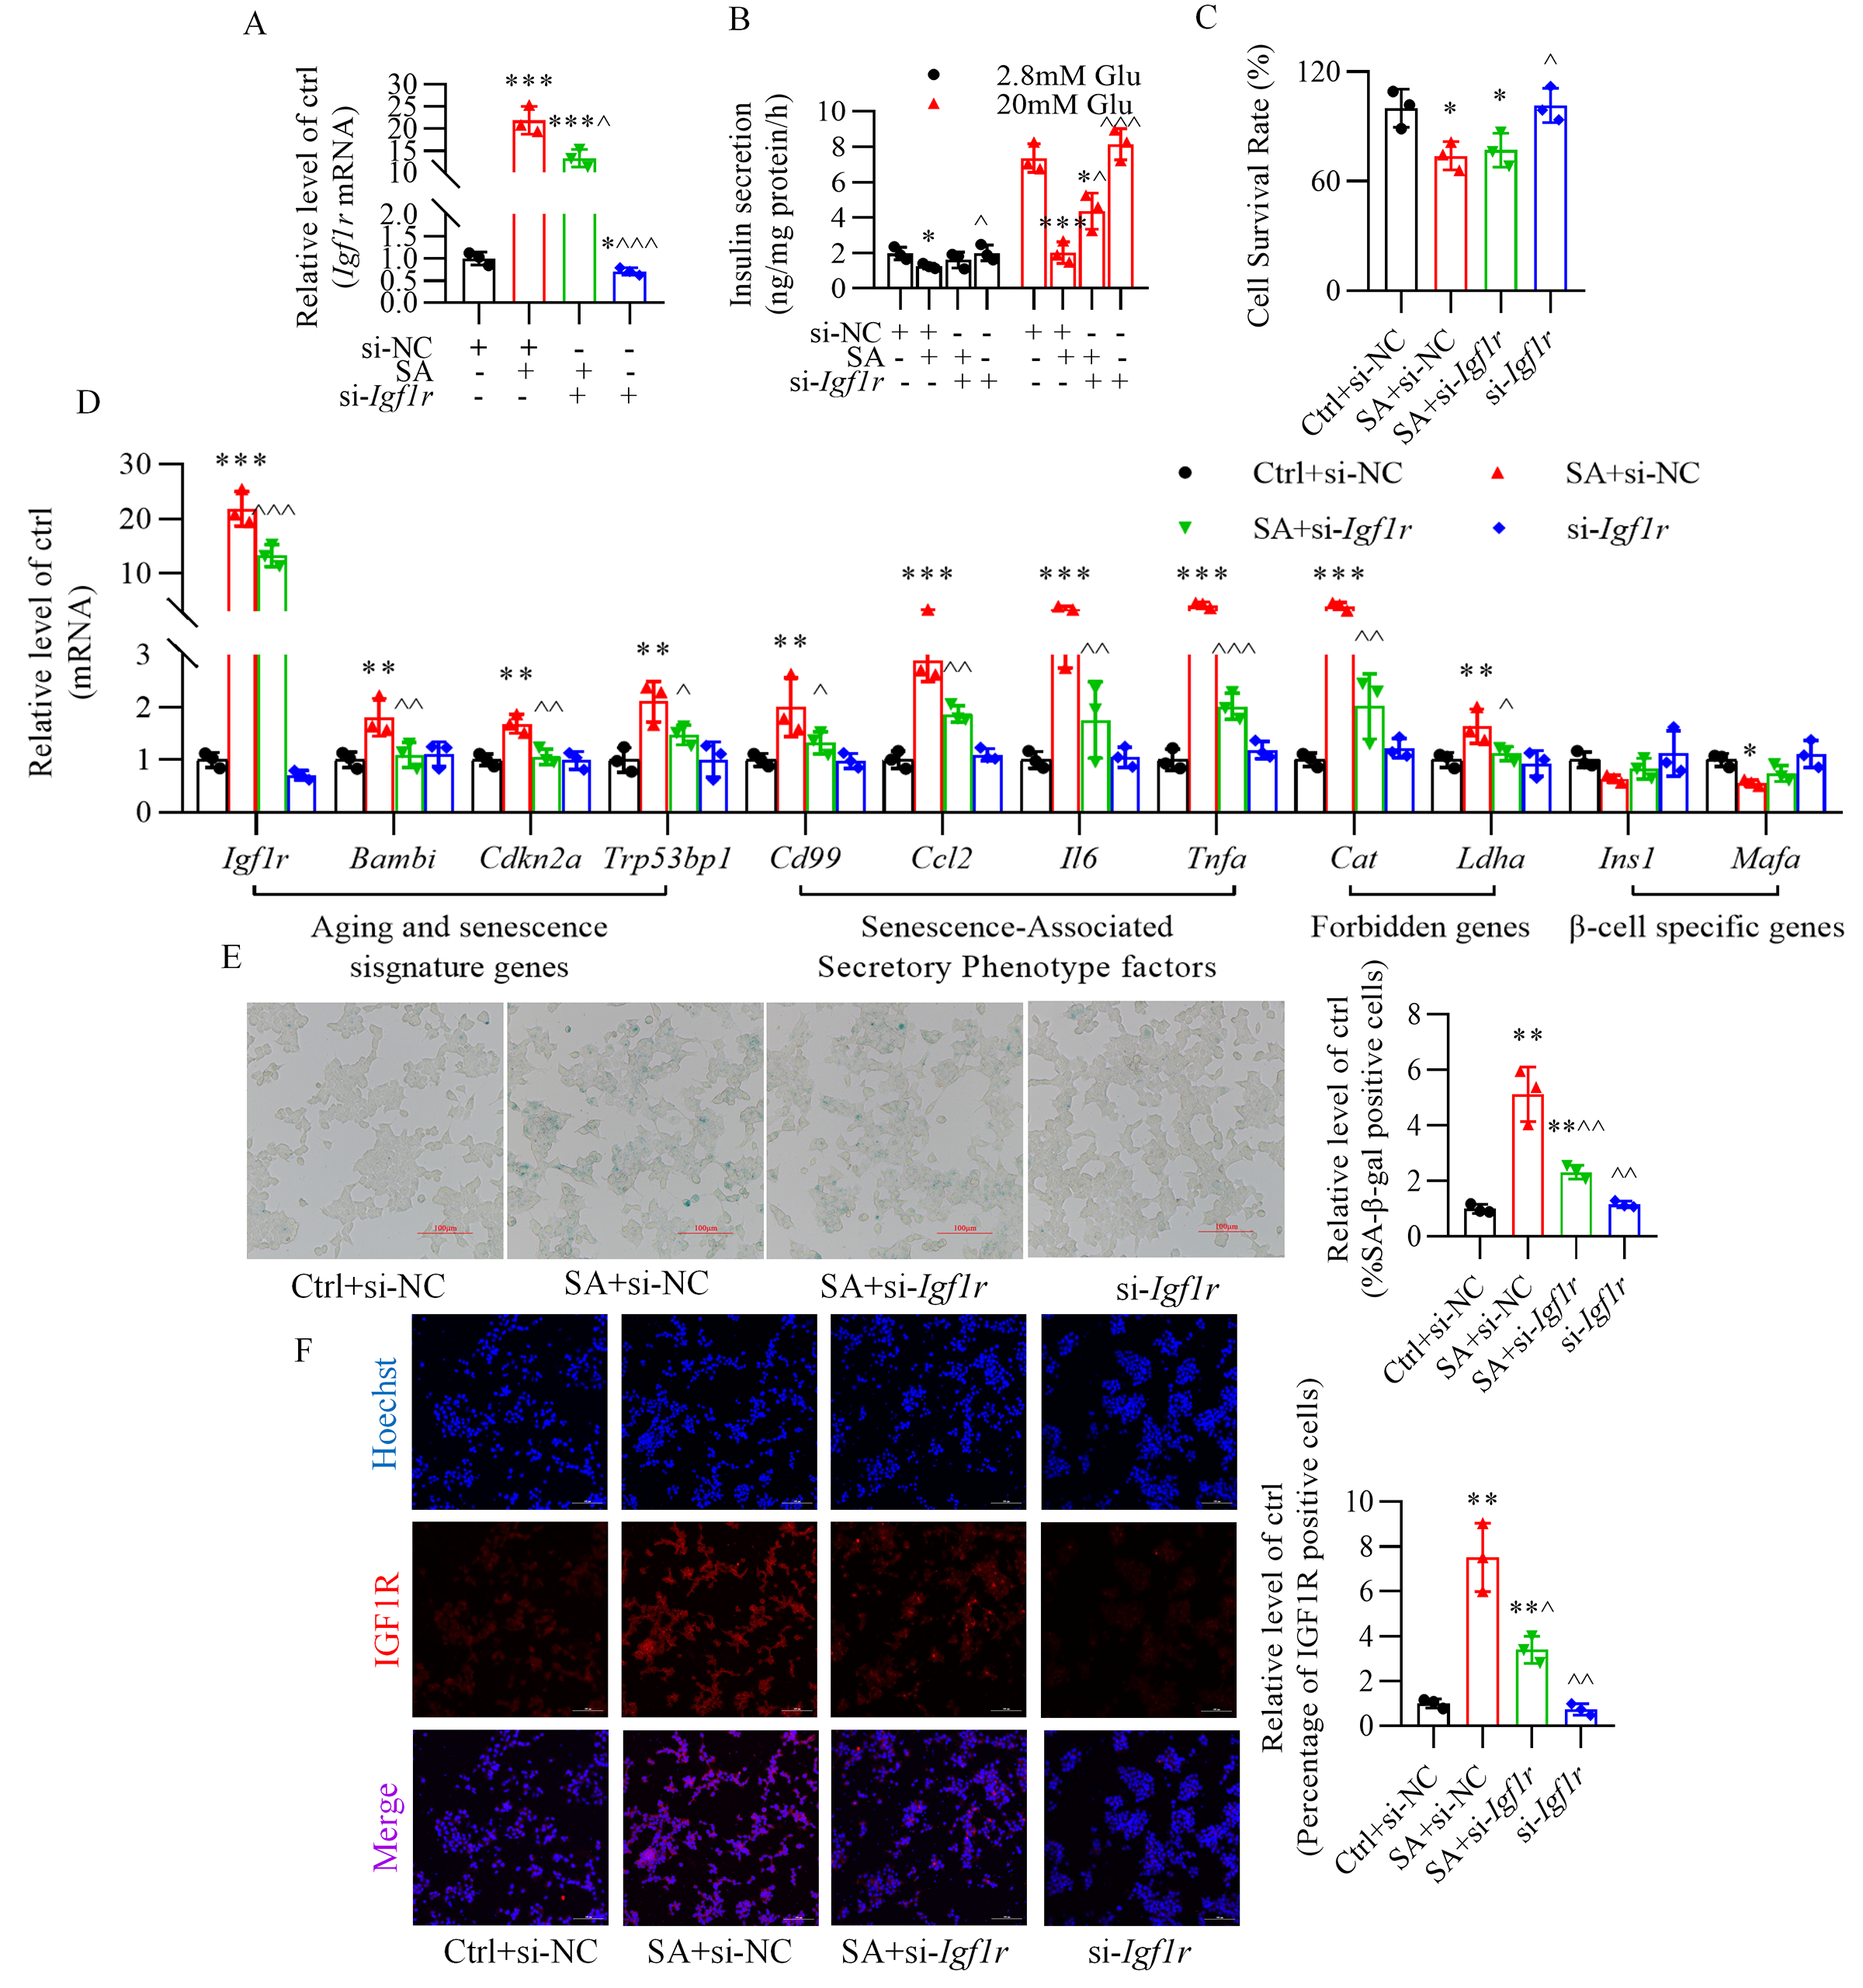 Fig. 6.
Inhibition of insulin-like growth factor-1 receptor
ameliorates stearic acid-stimulated glucose-stimulated insulin secretion
impairment and senescence of -TC6 cells. (A) Changes in insulin-like
growth factor-1 receptor expression in stearic acid-treated -TC6 cells.
(B,C) Effect of siRNA-Igf1r on insulin secretion and cell viability
in the presence of stearic acid. (D) Alteration of senescence-related gene
expression after silencing insulin-like growth factor-1 receptor in -TC6
cells treated with stearic acid. (E,F) Knockdown of insulin-like growth
factor-1 receptor alleviated stearic acid-increased percentage of
-galactosidase-positive cells and immunofluorescence intensity of IGF1R
(red). p 0.05, p 0.01, p 0.001 vs. Ctrl+si-NC group; p 0.05, p 0.01,
p 0.001
vs. SA+si-NC group. Ctrl, control group; si-NC, siRNA-Igf1r
negative control; SA, stearic acid; si-Igf1r, siRNA-Igf1r; Glu,
glucose. For (E) and (F), scale bar: 100 µm. Each independent experiment
was repeated three times.
3.6 Metformin Alleviates the Impairment of Anti-miR-297b-5p
Oligonucleotides in -TC6 Cells
Metformin markedly reversed the suppressive effect of anti-miR-297b-5p
oligonucleotides on miR-297b-5p expression (Fig. 7A) and glucose-stimulated
insulin secretion (Fig. 7B) in -TC6 cells. However, metformin had no
significant effect on cell viability after transfection of anti-miR-297b-5p
oligonucleotides (Fig. 7C). Moreover, metformin effectively improved
-cell senescence observed upon silencing of miR-297b-5p and reversed the
level of dysregulated senescence-related genes (Fig. 7D), the percentage of
senescence-associated -galactosidase-positive cells (Fig. 7E), and the
enhanced staining for insulin-like growth factor-1 receptor (Fig. 7F).
Additionally, metformin treatment was able to block the elevation in insulin-like
growth factor-1 receptor protein expression induced by the miR-297b-5p inhibitor
(Fig. 7G).
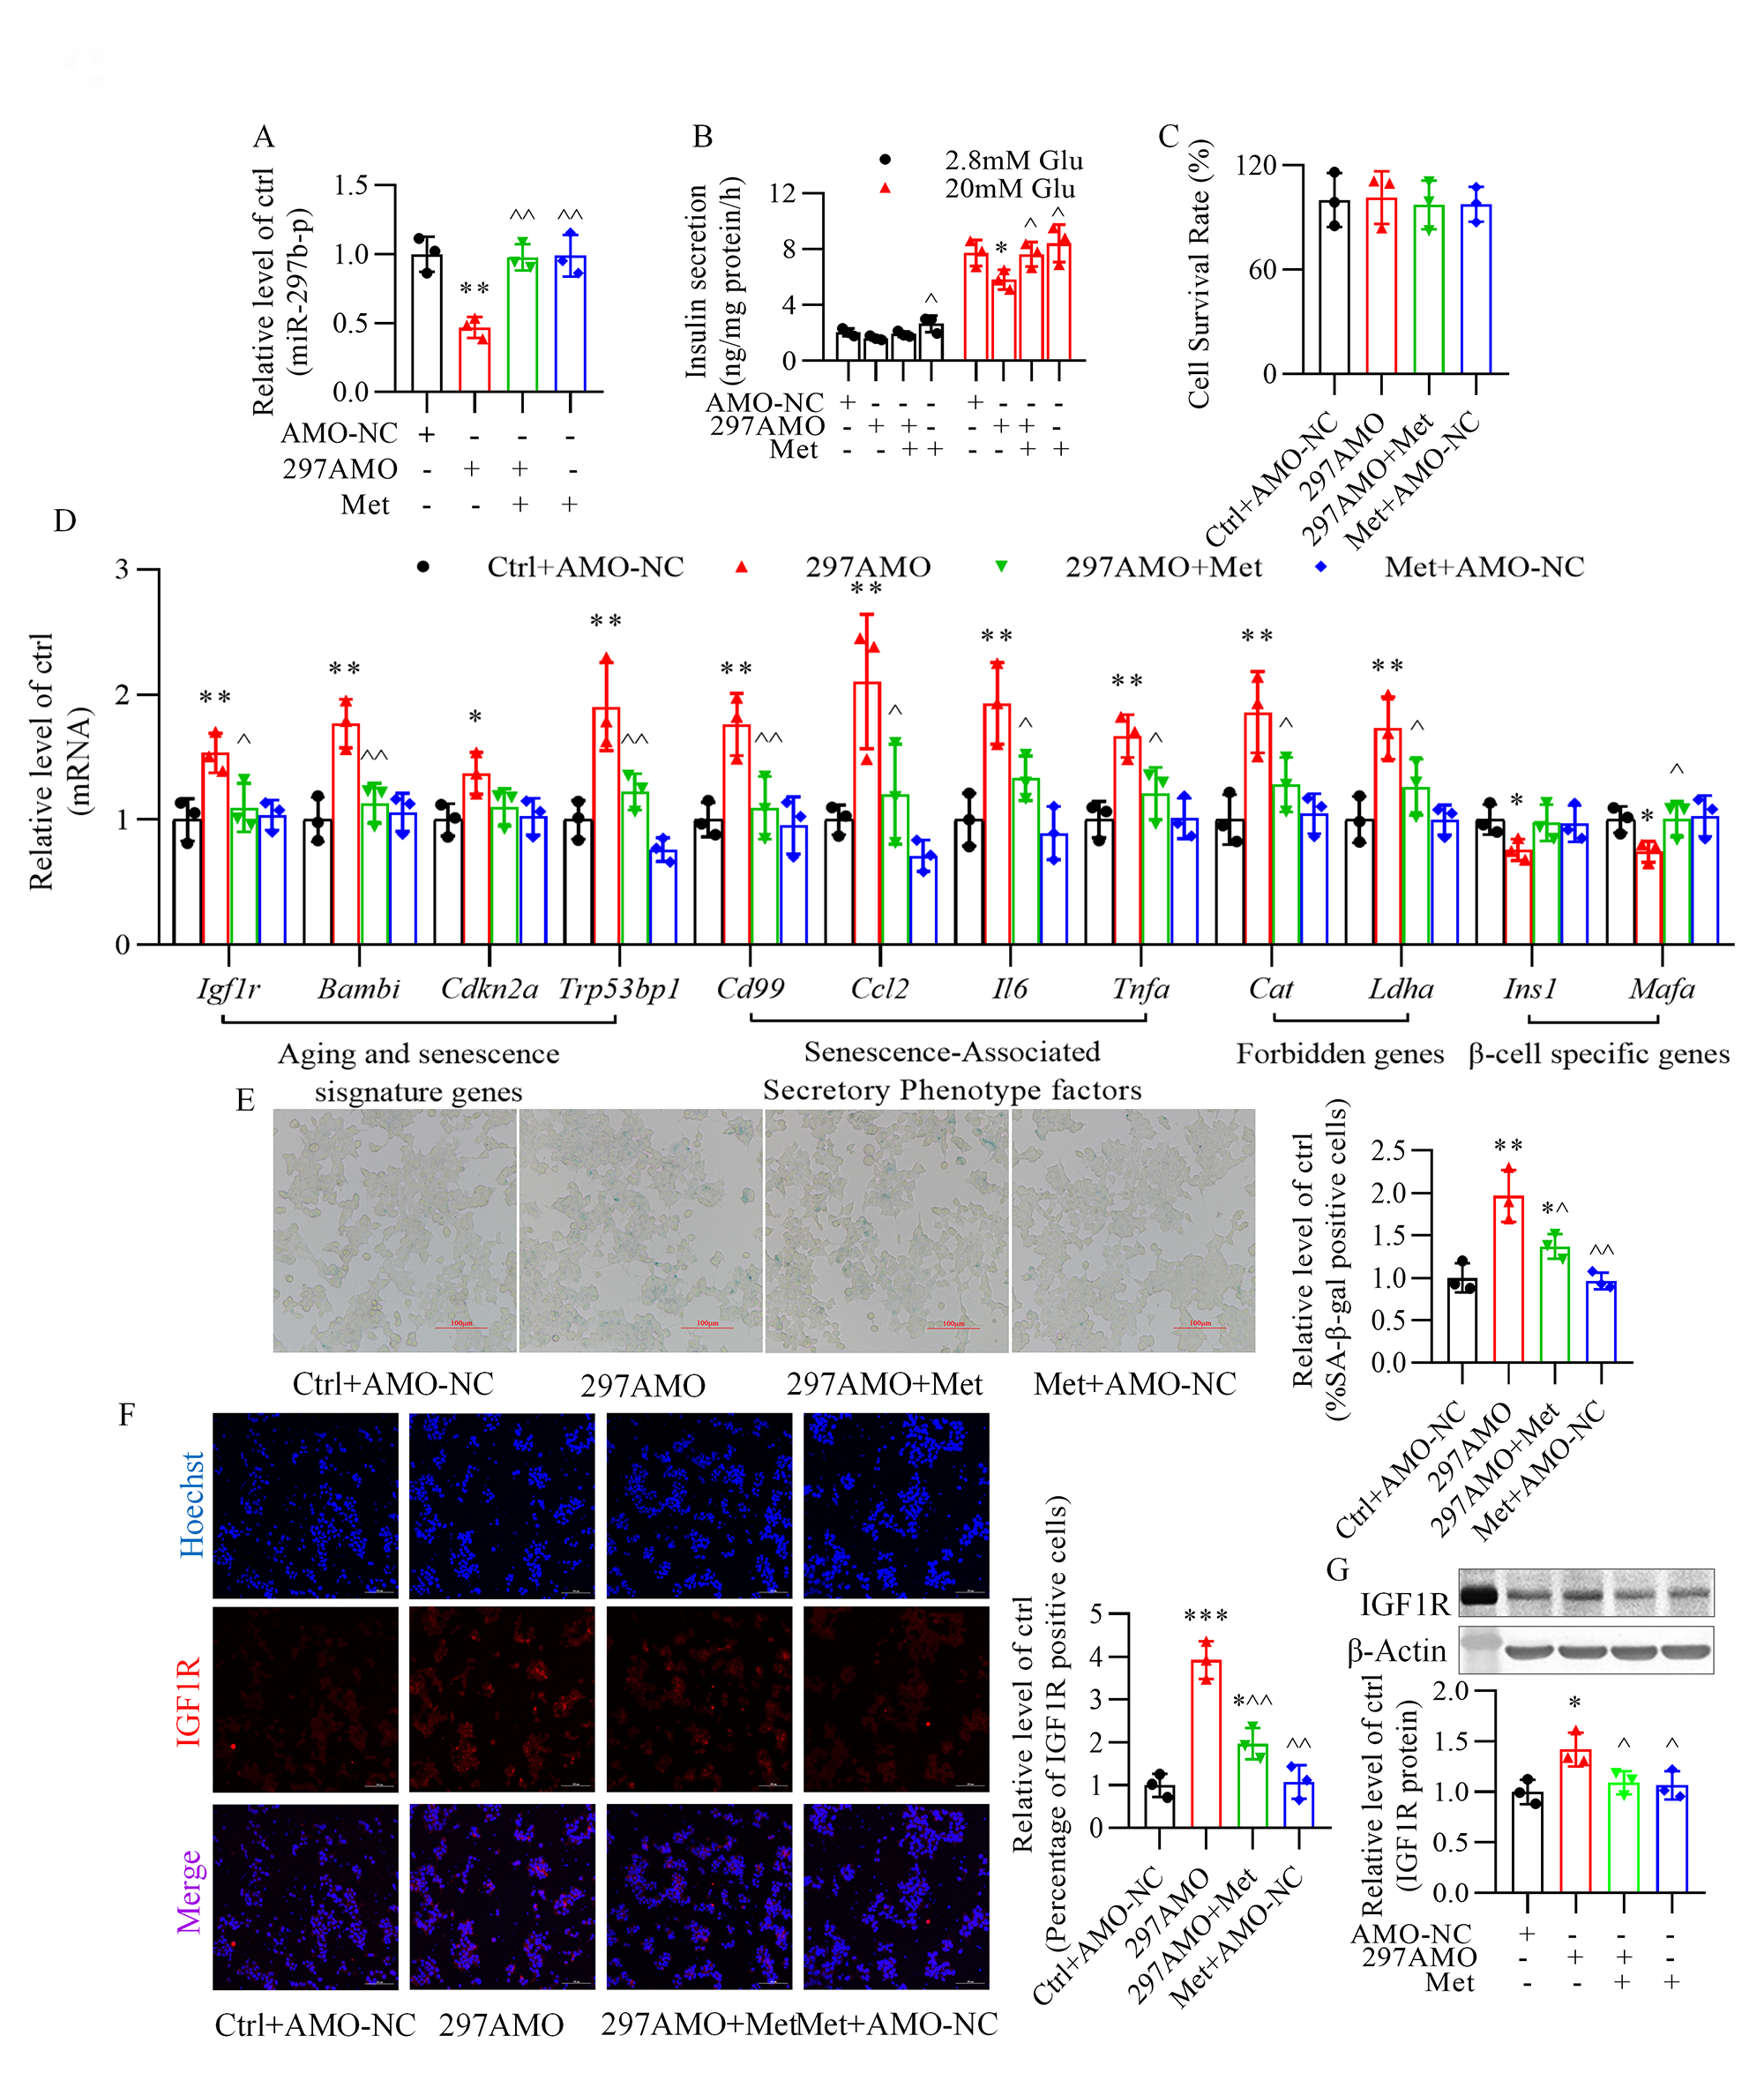 Fig. 7.
Metformin significantly alleviates anti-miR-297b-5p
oligonucleotides-induced senescence and glucose-stimulated insulin secretion
impairment of -TC6 cells. (A) Alteration of miR-297b-5p expression
after transfection of anti-miR-297b-5p oligonucleotides in the presence of
metformin. (B,C) Effect of metformin on the cell survival rate and
glucose-stimulated insulin secretion after inhibition of miR-297b-5p. (D–F)
Reversal effect of metformin on the expression of senescence-related genes,
-galactosidase activity, and immunofluorescence of insulin-like growth
factor-1 receptor (IGF1R) (red) after transfection of anti-miR-297b-5p
oligonucleotides. (G) Effect of metformin on insulin-like growth factor-1
receptor (IGF1R) protein expression in the presence of anti-miR-297b-5p
oligonucleotides in -TC6 cells. p 0.05,
p 0.01,p 0.001 vs. Ctrl+AMO-NC
group; p 0.05,
p 0.01 vs. 297AMO
group. Ctrl, control group; AMO-NC, anti-miR-297b-5p oligonucleotide negative
control; 297AMO, anti-miR-297b-5p oligonucleotides; Met, metformin; Glu, glucose.
For (E) and (F), scale bar: 100 µm. Each independent experiment was
repeated three times.
3.7 Long-Term Exposure to Stearic Acid Results in Impaired Insulin
Secretion and -cell Senescence in Mice
As evidenced by the profile of serum fatty acids (Table 3), mice fed with a high
stearic acid diet displayed high circulating levels of stearic acid. Table 4
summarizes the characteristics of the mice. Long-term feeding of a high stearic
acid diet led to a significant impairment of glucose tolerance (Fig. 8A) and
enhanced the second phase of insulin secretion in response to glucose (Fig. 8B).
Meanwhile, the -cell to -cell ratio was significantly higher
in the islets of mice fed with a high stearic acid diet than in mice fed with a
normal diet (Fig. 8C). Moreover, a high stearic acid diet dramatically
upregulated the expression of aging (Igf1r and Bambi) and
senescence markers (Cdkn2a and Trp53bp1), senescence-associated
secretory phenotype factors (Ccl2, Il6, Tnfa, and Cd99), and
forbidden genes (Cat and Ldha), while downregulating the level
of -cell identity genes (Ins1 and Mafa) in mouse
islets (Fig. 8D). Additionally, the expression of miR-297b-5p was significantly
reduced in the islets of mice fed a high stearic acid diet (Fig. 8E).
Table 3.The profile of fasting serum NEFAs in normal and HSD mice at 12
weeks.
| FFAs (µg/mL) |
Normal mice |
HSD mice |
| C14:0, MA (Myristic acid) |
4.25 0.65 |
6.93 0.92 |
| C16:0, PA (Palmitic acid) |
232 31.25 |
418.12 92.15 |
| C16:1, PLA (Palmitoleic acid) |
24.49 2.19 |
13.34 2.60 |
| C18:0, SA (Stearic acid) |
69.01 7.12 |
214.68 39.71 |
| C18:1, O (Oleic acid) |
150.56 14.69 |
196.71 41.73 |
| C18:2, LA (Linoleic acid) |
0.75 0.08 |
4.02 0.83 |
| -C18:3, -LNA (-Linolenic acid) |
6.85 0.72 |
8.67 0.91 |
| C18:3, LNA (Linoleic acid) |
69.99 7.24 |
29.49 6.67 |
| C20:2, EDA (Eicosadienoic acid) |
0.33 0.06 |
0.47 0.15 |
| C20:4, AA (Arachidonic acid) |
203.13 23.67 |
590.48 93.63 |
| C20:5, EPA (Eicosapentaenoic acid) |
188.24 27.73 |
421.98 58.66 |
| C22:5, DPA (Docosapentaenoic acid) |
1.61 0.55 |
2.87 0.85 |
| C22:6, DHA (Docosahexaenoic acid) |
481.26 55.08 |
518.75 54.46 |
| Saturated fatty acids |
325.71 66.48 |
626.04 62.28 |
| Total fatty acids |
1450.68 128.32 |
2899.15 300.44 |
| Percentage of SA (%) |
4.81 0.59 |
8.89 1.46 |
| Percentage of PA (%) |
13.78 1.46 |
17.35 2.46 |
| PA/SA ratio |
2.86:1 |
1.95:1 |
Values are mean SD. n = 5 mice per group. p 0.05, p 0.01, compared to the value in normal mice.
Table 4.Body weight and fasting serum analysis in normal and HSD mice
at 12 weeks.
| Characteristics |
Ctrl |
HSD |
| Body weight (g) |
29.9 2.56 |
37.03 4.61 |
| Glucose (mmol/L) |
3.49 0.89 |
7.17 1.24 |
| TC (mmol/L) |
3.2 0.25 |
5.74 0.8 |
| TG (mmol/L) |
0.52 0.09 |
0.72 0.22 |
| HDL-C (mmol/L) |
2.61 0.14 |
4.16 0.38 |
| LDL-C (mmol/L) |
0.28 0.13 |
1.21 0.4 |
| Insulin (pmol/L) |
84.35 7.13 |
165.42 16.18 |
| Food intake (g/d) |
3.948 0.469 |
3.661 0.923 |
Values are mean SD. n = 5 mice per group. p 0.05, p 0.01, p 0.001, compared to the
value in normal mice. HSD, high stearic acid diet.
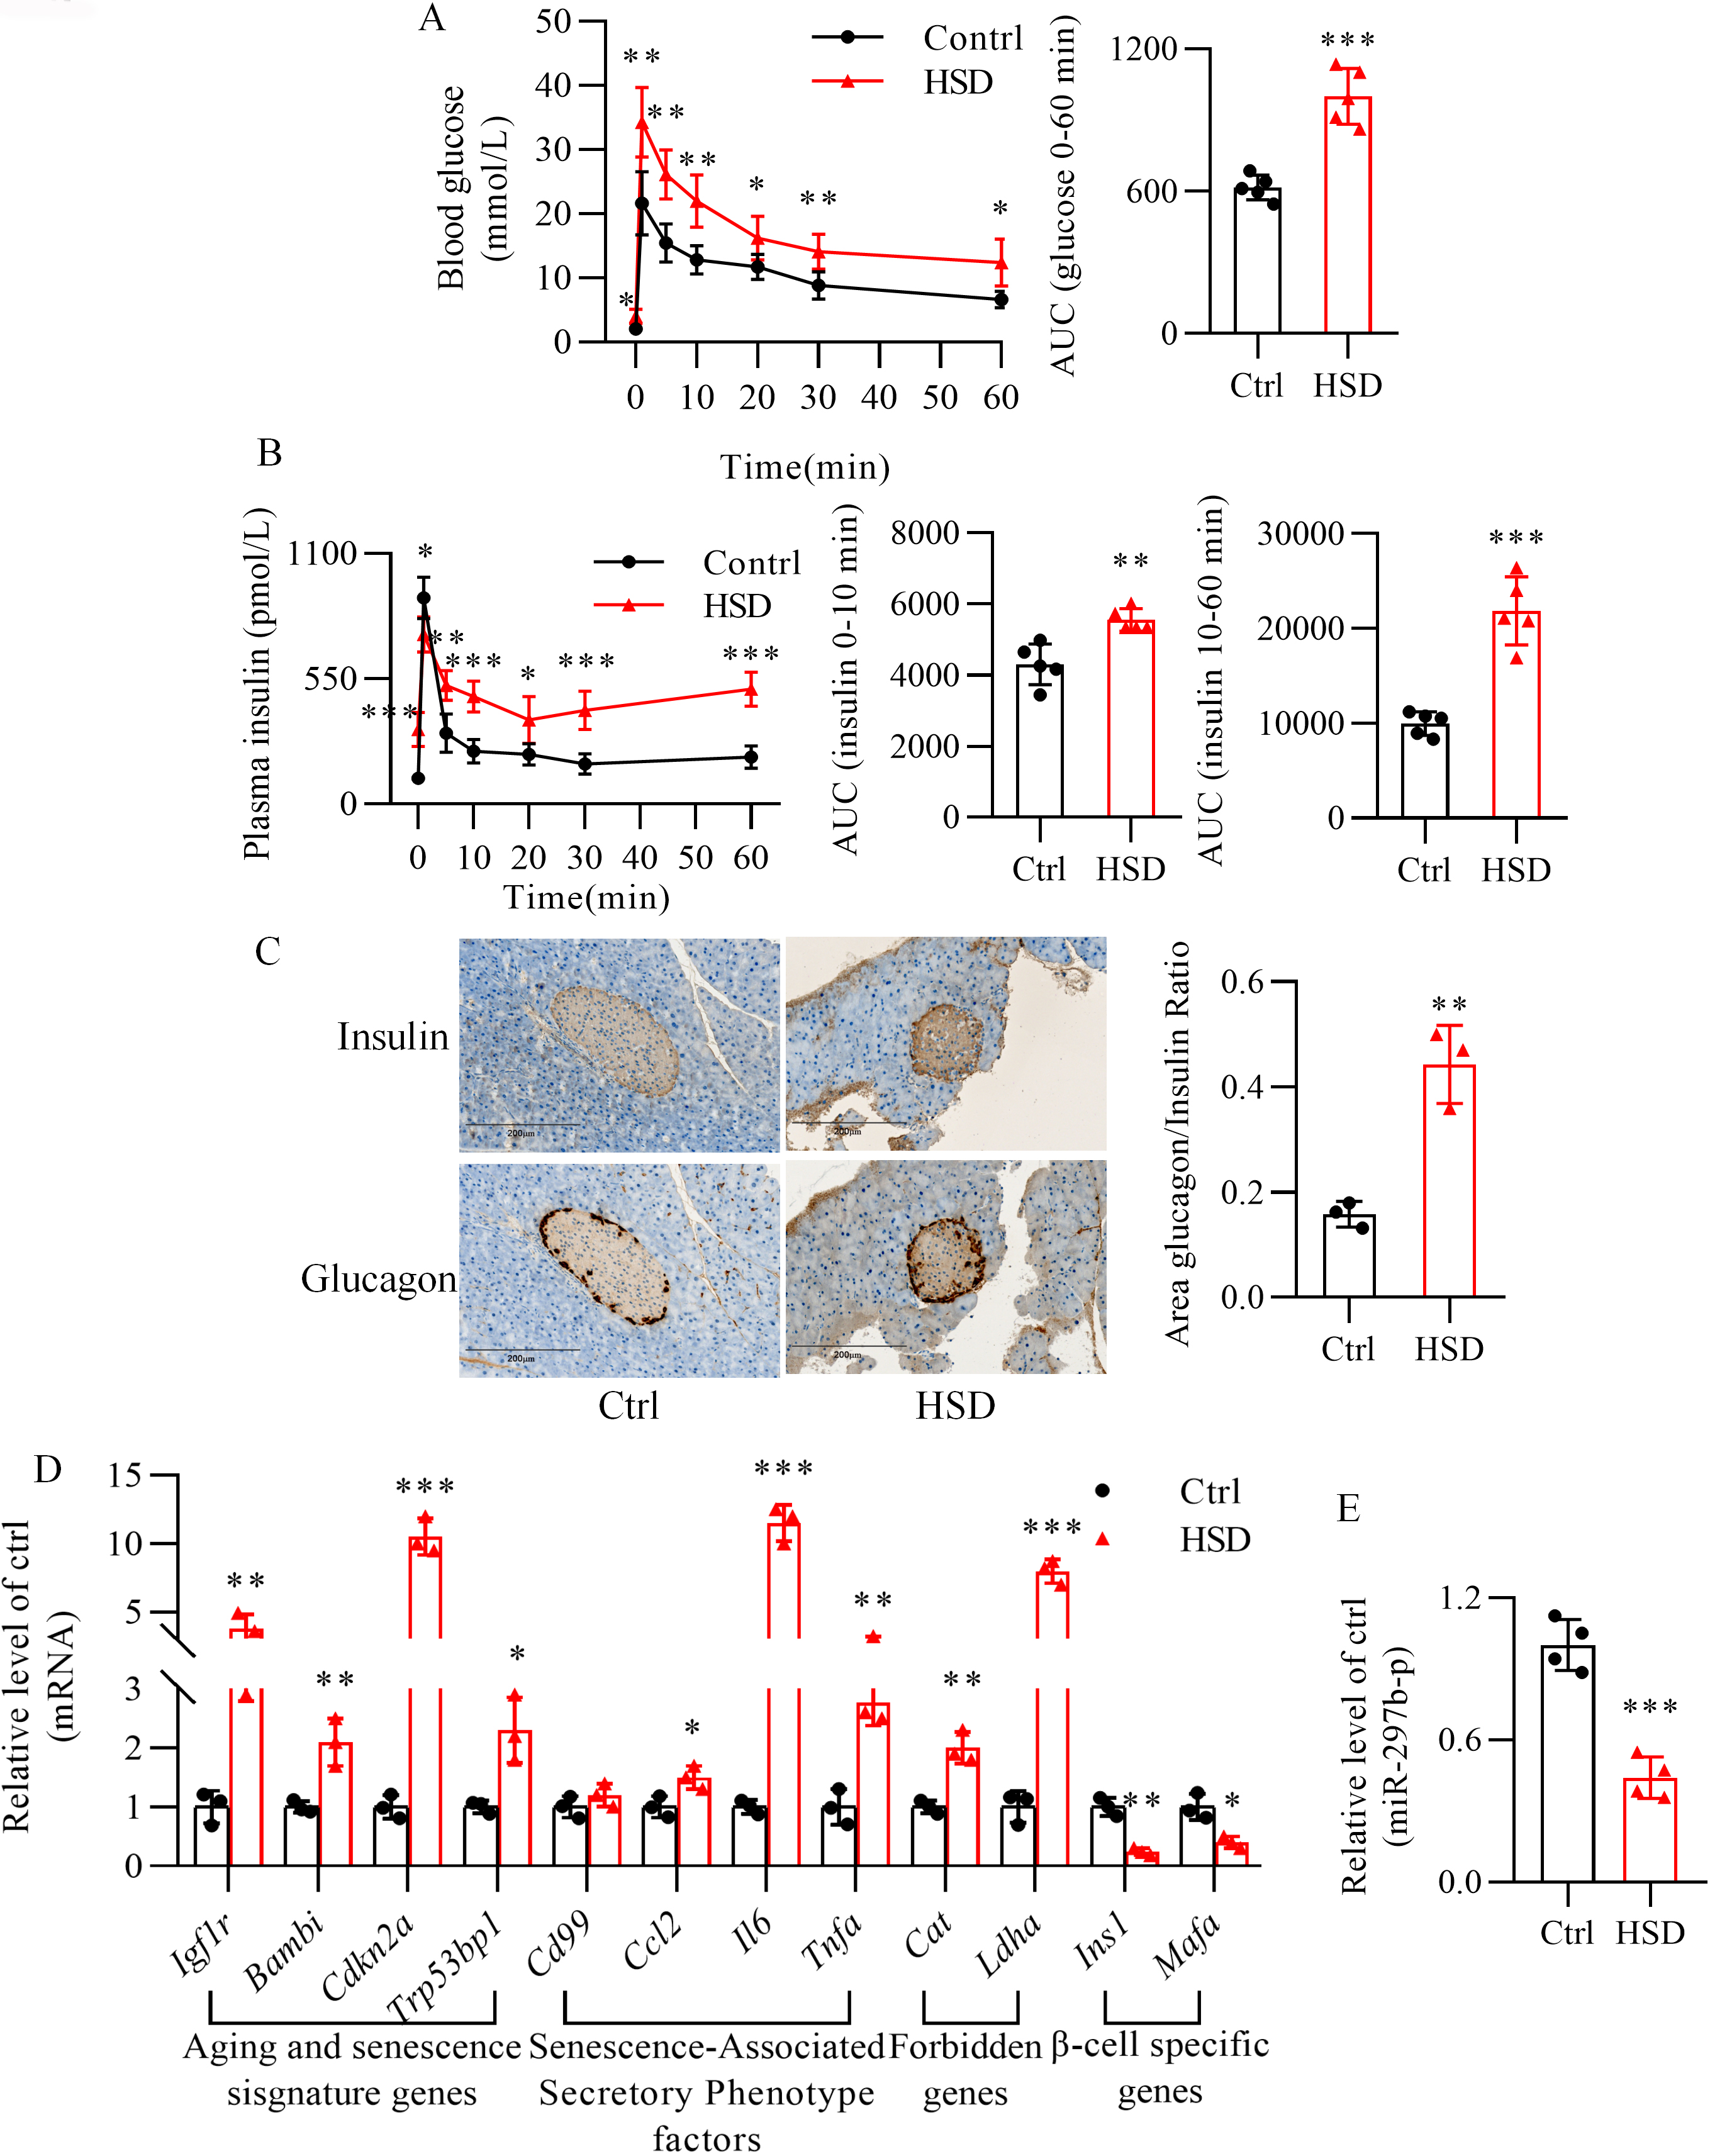 Fig. 8.
Long-term high stearic acid diet leads to senescence in mouse
islets. (A,B) Detection of impaired glucose tolerance and insulin secretion
by intravenous glucose tolerance testing. (C) Double immunohistochemical staining
for insulin and glucagon in islets of mice receiving a normal diet or high
stearic acid diet. Scale bar: 200 µm. (D) Alterations of the expression of
senescence-related genes in mouse islets after high stearic acid diet feeding.
p 0.05, p 0.01, p 0.001 vs. Ctrl group. For (A) and (B), n = 5 mice per group. For (C)
and (D), n = 3 mice per group. Ctrl, normal diet; HSD, high stearic acid diet.
(E) Downregulation of miR-297b-5p in high stearic acid diet-fed mouse islets.
p 0.001 vs. Ctrl group. n = 4. Ctrl, control group;
HSD, mice were fed a high stearic acid diet.
4. Discussion
Prolonged exposure of -cells to elevated concentrations of saturated
fatty acids results in the accumulation of senescent cells, which leads to a
progressive decline in insulin secretion. Exploring potential targets and
effective drugs capable of preventing -cell senescence represents a
promising strategy to overcome the deleterious effects of saturated fatty acids.
In our study, we found that metformin showed a remarkable protective effect
against the senescence of -cells caused by stearic acid. Our findings
highlight the involvement of miR-297b-5p in stearic acid-increased -cell
senescence.
Although miR-297b-5p was initially characterized in cancers [35], our recent
studies proposed a novel role of miR-297b-5p in stearic acid-induced
-cell dysfunction via inhibiting the expression of both proapoptotic and
proinflammatory factors. In this study, we found an alternative mechanism to
explain the anti-senescence effect by miR-297b-5p. Indeed, overexpression of
miR-297b-5p resulted in the considerable recovery of stearic acid-increased
senescence-related genes in -TC6 cells, including disallowed genes,
aging and senescence markers, and senescence-associated secretory phenotype
factors. These genes were selected based on previous studies [19, 36] and our
initial comparison analysis (Supplementary Fig. 2). There is strong
evidence indicating that miRNAs conduct their regulatory activity through
multiple targets [37]. Here, we confirmed by computational analysis and using a
luciferase reporter assay that insulin-like growth factor-1 receptor—an aging
marker in -cells that is associated with type 2 diabetes [36]—is a
downstream target of miR-297b-5p. We found that miR-297b-5p exerts a negative
effect on insulin-like growth factor-1 receptor expression. Additionally,
silencing this receptor effectively reversed -cell senescence induced by
stearic acid and the impairment in insulin secretion. These findings suggest that
stearic acid causes cellular senescence and dysfunction through the
miR-297b-5p/Igf1r axis in -TC6 cells. Future
studies will need to determine whether miR-297b-5p exerts a similar role in human
-cells.
Early lifestyle intervention and pharmacological treatment to restore
-cell function is a well-accepted strategy to prevent the onset and
progression of type 2 diabetes [38]. Metformin is a well-tolerated and safe drug
that delays type 2 diabetes [39]. However, its pleiotropic effects in various
tissues increase the difficulty of establishing specific targets, especially in
-cells. In this study, we observed a significant protective effect of
metformin on -cell function through the clearance of senescent cells. In
this process, metformin significantly restored stearic acid-decreased miR-297b-5p
expression and inhibited the upregulation of insulin-like growth factor-1
receptor expression caused by the fatty acid. Moreover, the reduction in cell
viability observed in the presence of stearic acid was partially reversed after
metformin treatment. These results indicate that miR-297b-5p likely mediates the
protective effect of metformin and that this drug may be useful in improving and
restoring -cell function in subjects who have developed type 2 diabetes
as a consequence of a long-term high-fat diet.
This study has several limitations. Firstly, further studies are needed to
confirm whether this conclusion remains in primary mouse and human
-cells. Secondly, it will be essential to confirm the protective effect
alongside the potential dose of metformin required to prevent -cell
senescence in mice fed a high stearic acid diet and to perform RNA-sequencing
analysis on mouse islets. Thirdly, the causal relationship between senescence and
inflammation in stearic acid-induced -cell dysfunction needs to be
determined because the release of senescence-associated secretory phenotype
proteins worsens surrounding cells leading to senescence [40] and inflammation
[41]. Additionally, whether metformin directly interacts with stearic acid and
how it increases miR-297b-5p expression are interesting points to be addressed
and can promote the use of metformin to prevent the induction of type 2 diabetes
by high-fat diets.


 , Shenghan Su 1,†
 , Huimin Lu 1,2,*
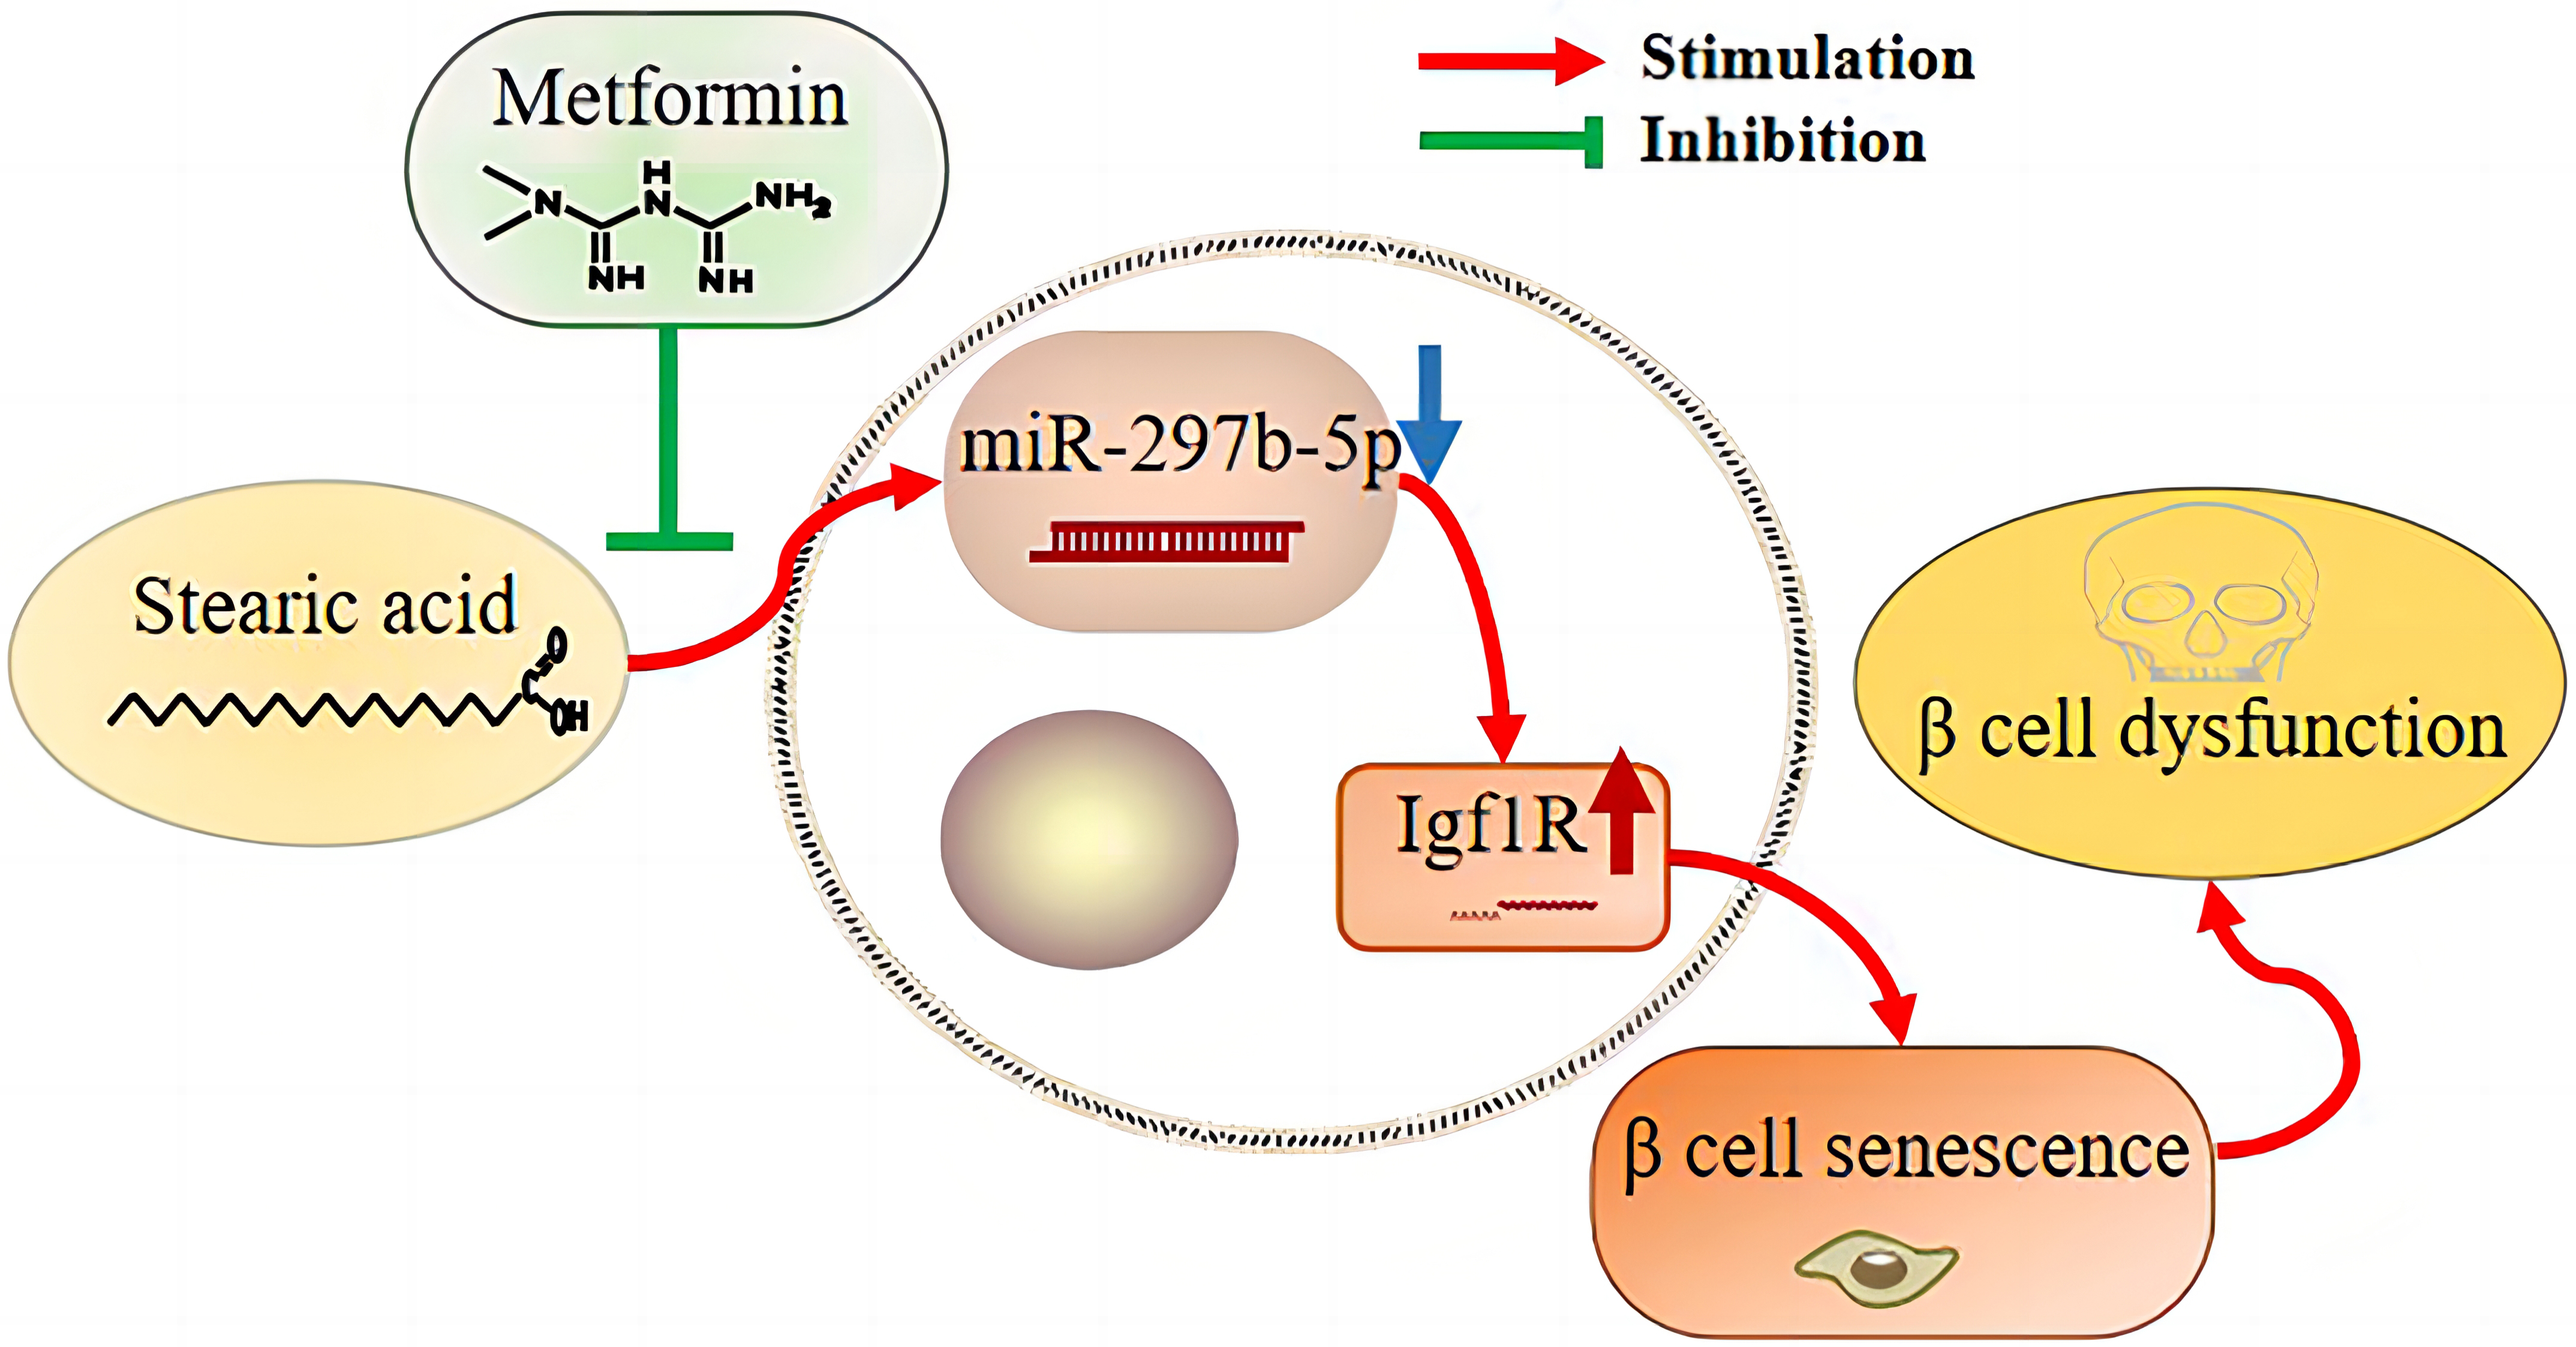 Fig. 9.