


1 Department of Cell Biology and Physiology and the Neuroscience Center, College of Life Sciences, Brigham Young University, Provo, UT 84602, USA
Abstract
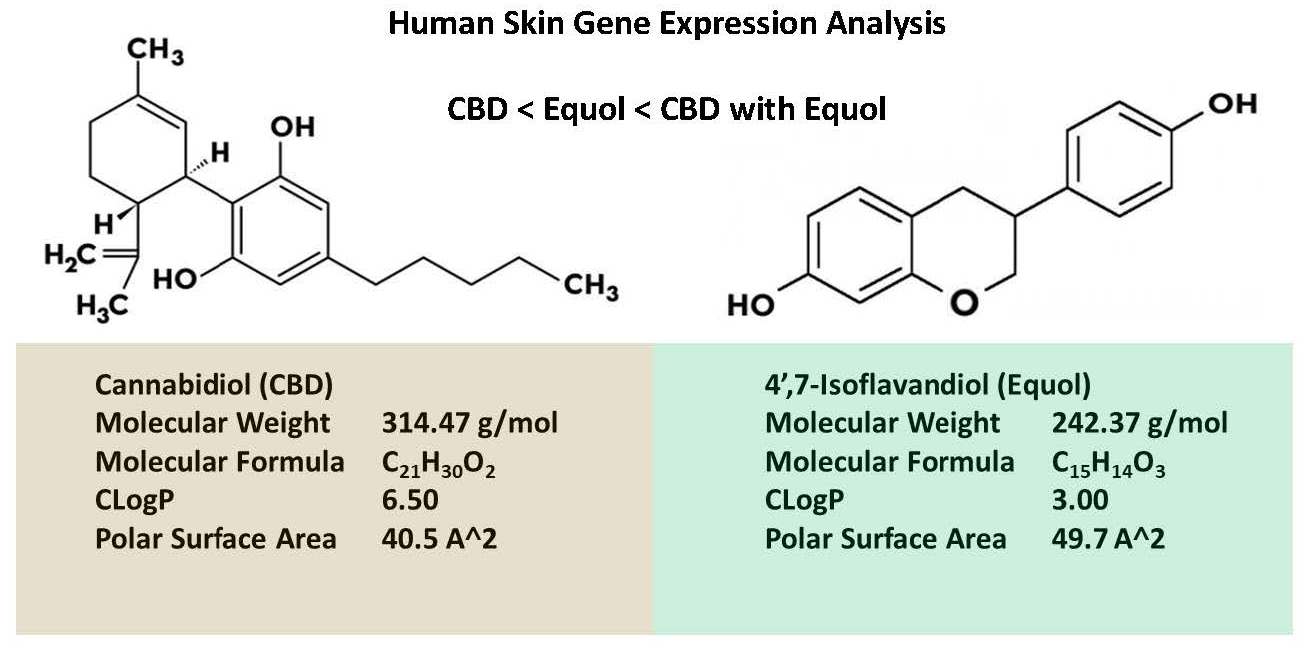
Background: While cannabidiol (CBD) and 4’,7-isoflavandiol (Equol) have been examined individually in various skin studies, the present investigation tested whether topically applied CBD with Equol may yield enhanced effects on human skin biomarkers. Methods: After 24 hours exposure human skin gene expression was measured by quantitative polymerase chain reaction-messenger ribonucleic acid (qPCR-mRNA) analysis across 9 functional skin categories covering 97 biomarkers. Results: In general, among the biomarkers analyzed the CBD with Equol treatment displayed greater efficacy compared to CBD only or the Equol treatment alone (e.g., 4 out 5 for anti-acne, 15 out of 17 for anti-aging [e.g., collagen, elastin, calcium binding protein A7, tissue inhibitor of matrix metalloproteinase 1 (TIMP 1), etc.], 19 out of 21 for anti-inflammatory (pain), 10 out of 11 for antioxidants to protect against oxidative stress, 6 out of 6 for circadian rhythm regulation for cell repair/restoration, 10 out of 15 for anti-pigmentation properties, 4 out of 5 for skin hydration, 6 out of 6 for tissue integrity, and 11 out of 12 for wound healing properties). Conclusions: CBD with Equol displayed synergistic effects that may be an effective topical treatment for dermatology and cosmetic applications to improve human skin health and reduce photo-aging.
Graphical Abstract
Keywords
- cannabidiol (CBD)
- isoflavandiol
- Equol
- human
- skin
- gene expression
- microarray
- photo-aging
- antioxidant
Cannabis has been used for medicinal purposes for centuries, and to date more than 500 biologically active compounds have been identified [1]. In brief, Cannabis sativa is composed of two different strains: (a) marijuana that has high tetrahydrocannabinol (THC), the psychoactive phytocannabionoid responsible for the intoxicating euphoric “high”, whereas, (b) hemp contains high amounts of cannabidiol (CBD), the biologically active anti-inflammatory/antioxidant phytocannabinoid that has less than 0.3% of THC and therefore not intoxicating with low abuse potential [1].
CDB was first isolated in 1940 by Roger Adams at the University of Illinois, and the level of research interest was a non-entity until the first journal report was published in 1963 on CBD [1]. Thereafter, published journal reports on CBD remained very low until 2010, but after 2018 (coninciding with the 2018 United States Farm Bill that made hemp an ordinary agricultural commodity), there has been a dramatic increase in CBD research. In 2021 and 2022 more than 1000 journal reports were published on this topic (Fig. 1, Ref. [2]).
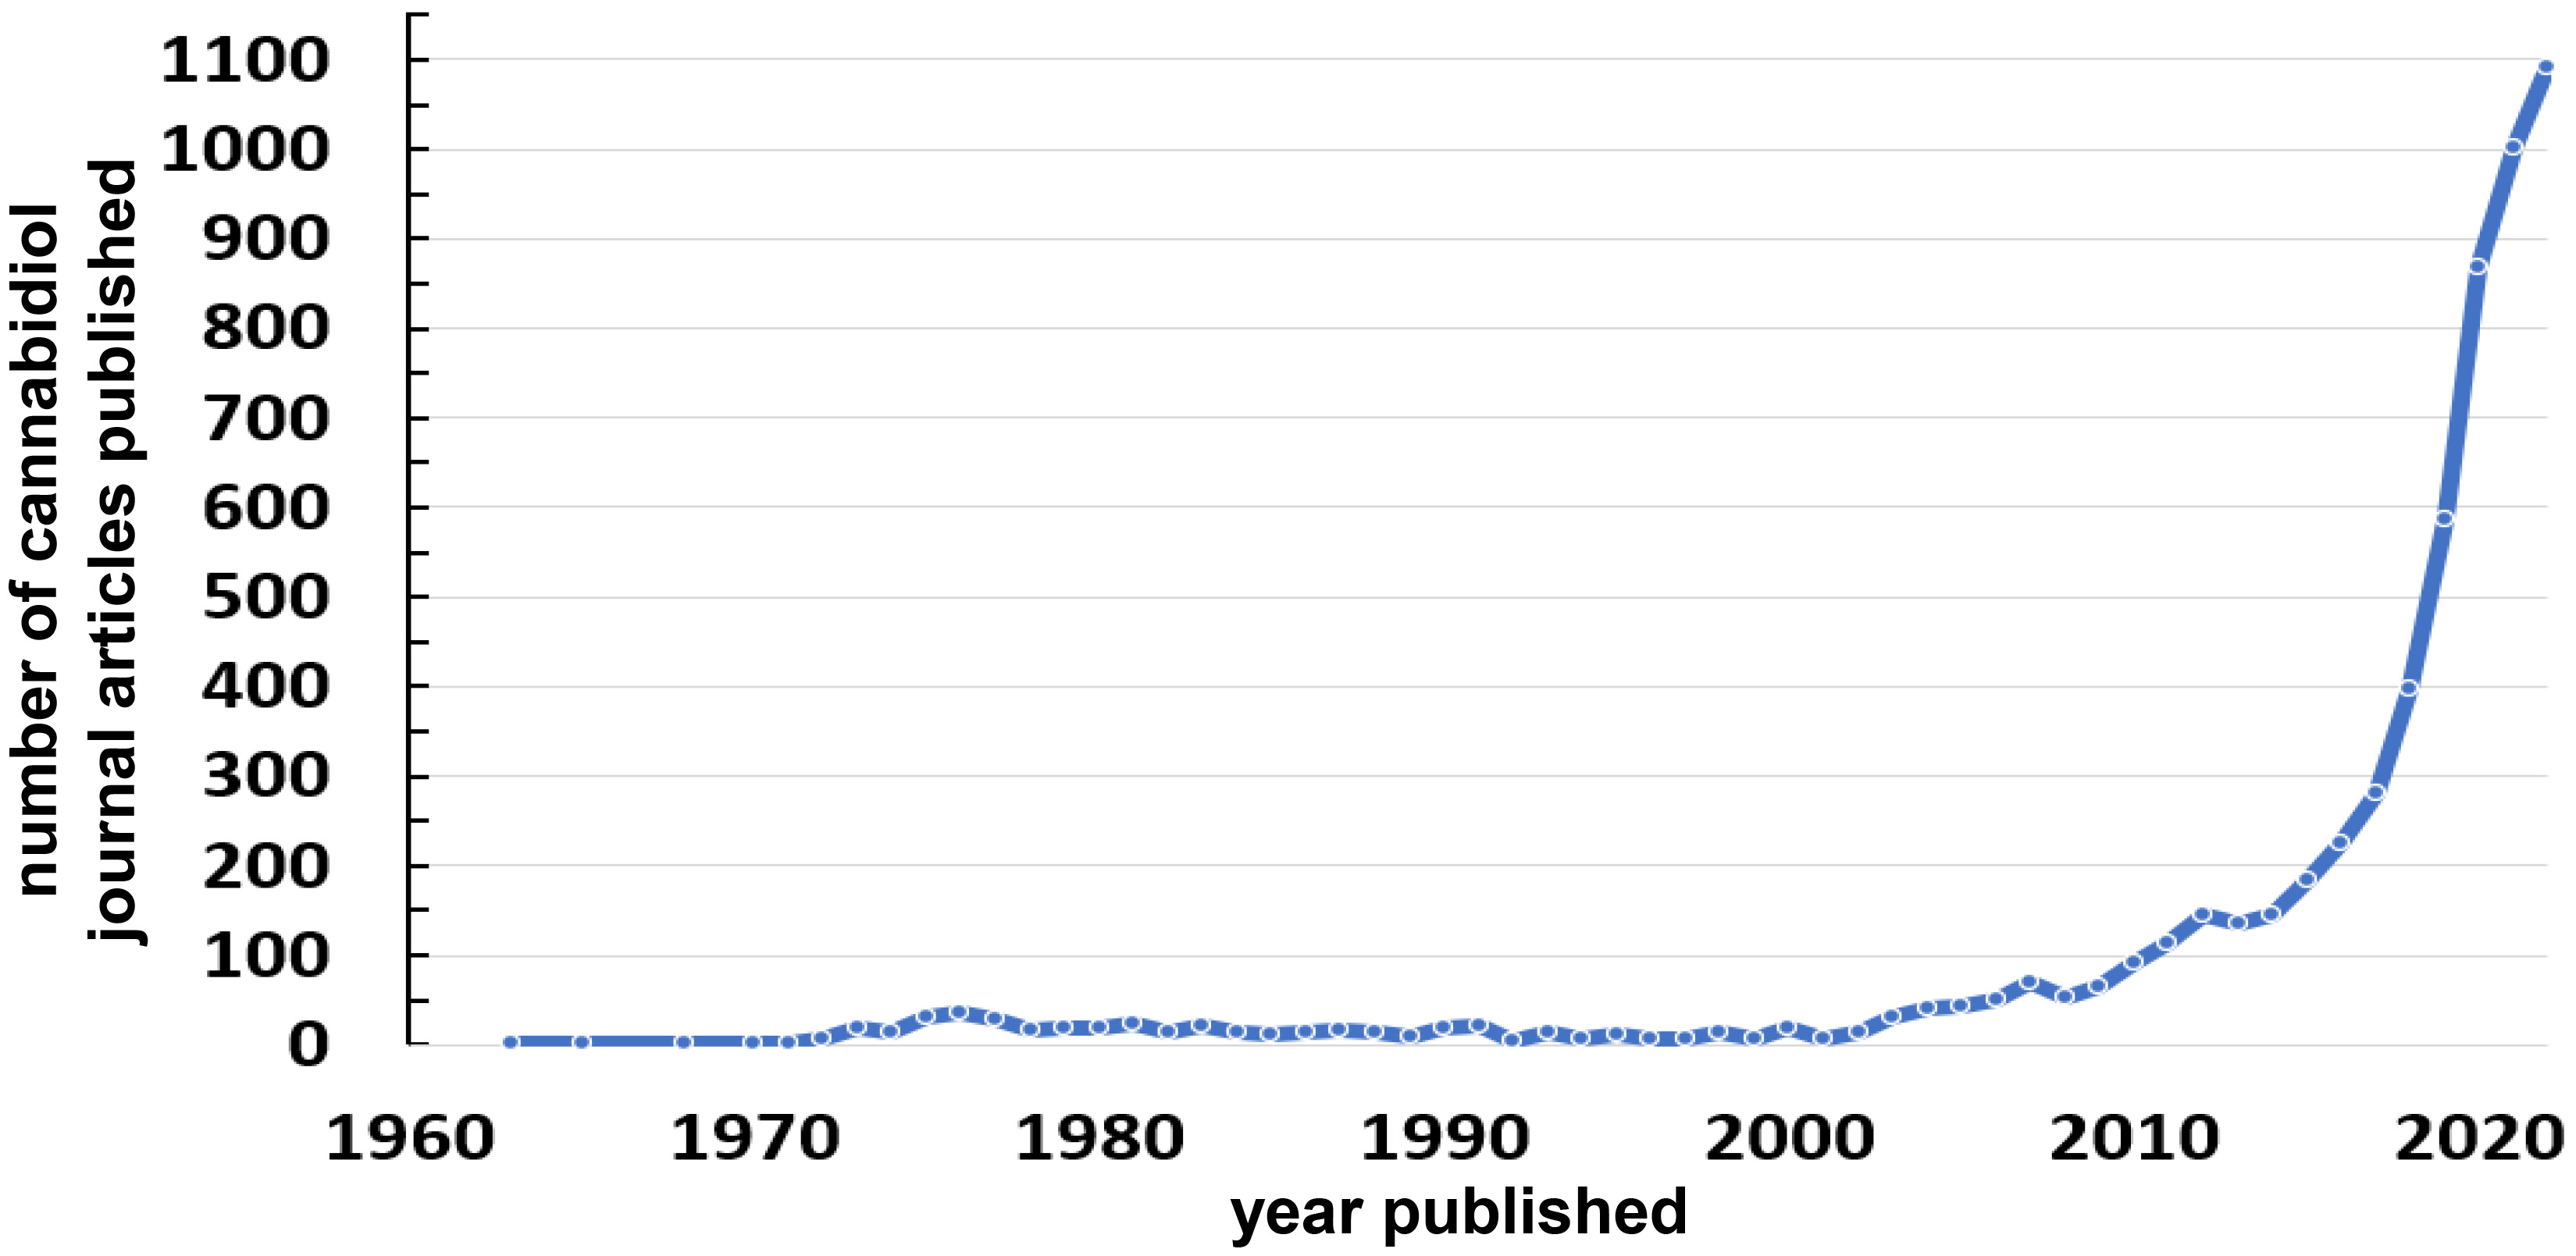 Fig. 1.
Number of Cannabidiol Journal Articles Published from 1960 through 2022 (via PubMed search using cannabidiol as the key term) [2].
Together with the discovery of the endocannabinoid system that has been proven to be an important, multifaceted homeostatic regulator, which influences a wide-variety of physiological functions throughout the body via the main endocannabinoid receptors (CB1 found mostly in the central nervous system and CB2 found in the peripheral nervous system, particularly in immune cells and is also located in many organ and body areas) [3, 4]. In general, CBD is known for its anti-inflammatory and anti-nociceptive actions with broad therapeutic potential [3, 4]. Furthermore, CBD acting via the CB1 and CB2 receptors located in many different types of skin cells and components have been shown to be involved in skin disorders/diseases (i.e., atopic dermatitis, psoriasis, scleroderma, barrier formation, acne, hair growth, abnormal pigmentation, keratin conditions, itch, wound healing, etc.) [4, 5, 6, 7].
As displayed in Fig. 2 (Ref. [4, 5, 6, 7, 8]), a general overview of CB1 and CB2 receptors along with immune cells located in human skin layers is presented. One of the first reports of the effects of CBD on human skin gene expression was reported by Langerveld et al. [9] in 2019, where it was shown to regulate over 100 genes that influence, wound healing, pigmentation, aging, acne, and hydration etc. Subsequently, several recent reviews have been published about CBD and skin/cosmetic disorders that highlight its use as an ingredient in dermatology and skin care products [4, 5, 6, 7, 8, 10].
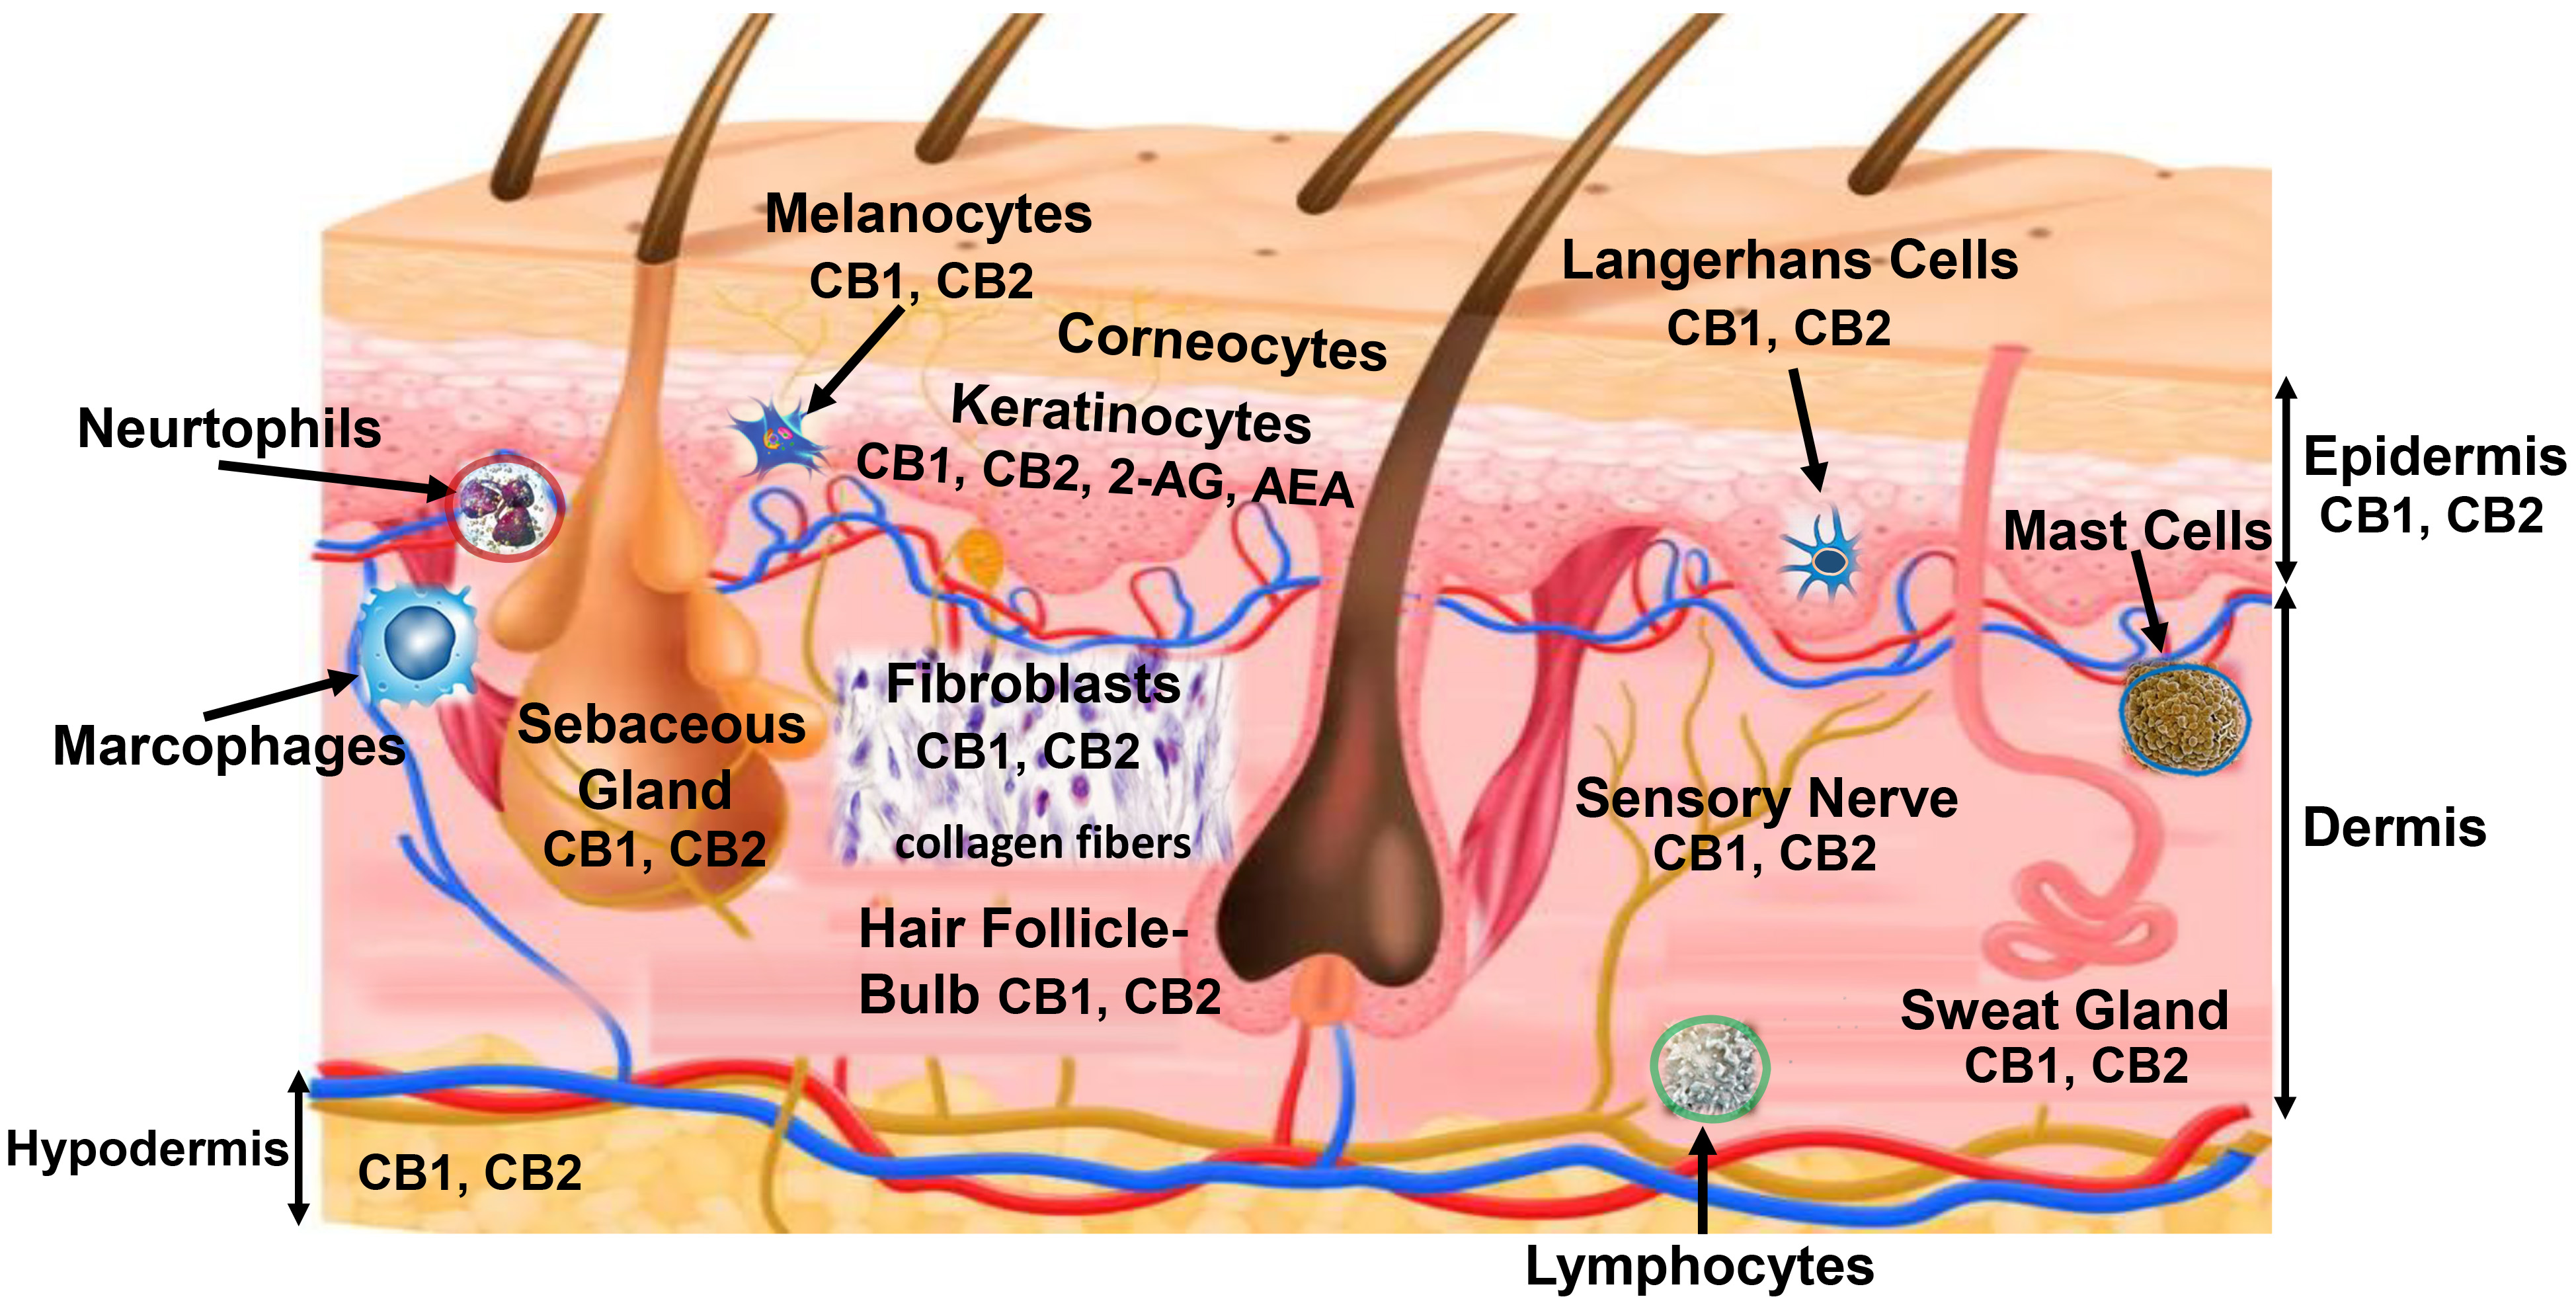 Fig. 2.
Cartoon displays skin layers/components/immune cells and the location of endocannabinoid receptors (CB1 and CB2). This is a general overview based upon the limitations of space that does not allow labeling of all CB1 and CB2 receptors, immune cells as well as other receptors and enzymes in human skin. 2-AG = 2-arachidonoylglycerol and AEA = arachidonoylethanolamide, which are endocannbionoid-like compounds that bind to CB1 receptors [4, 5, 6, 7, 8].
Conversely, plant-dervied phytochemicals have been incorporated into skin care products for several years that possess antioxidant, anti-inflammatory, anti-aging properties (intrinsic/chronological and extrinsic/photo-aging), which have been extensively researched (covering skin penetration, metabolism, mechanisms of actions, influence on human skin gene expression, etc.) such as the polyphenolic compounds like resveratrol and 4’,7-isoflavandiol (Equol) [11, 12, 13, 14, 15]. Notably, Equol has been shown to be effective via in vitro and topical/oral clinical studies and superior to known anti-aging active ingredients such as resveratrol and astaxanthin, and is the only compound proven to demonstrate corresponding changes at the gene and protein levels for various skin biomarkers [11, 12, 13, 16, 17]. In brief, the skin anti-aging properties of Equol are shown in Fig. 3, where it exhibits a sustained-release mechanism of topical delivery from the epidermis into the dermis over time providing long-lasting effects after a single topical dose.
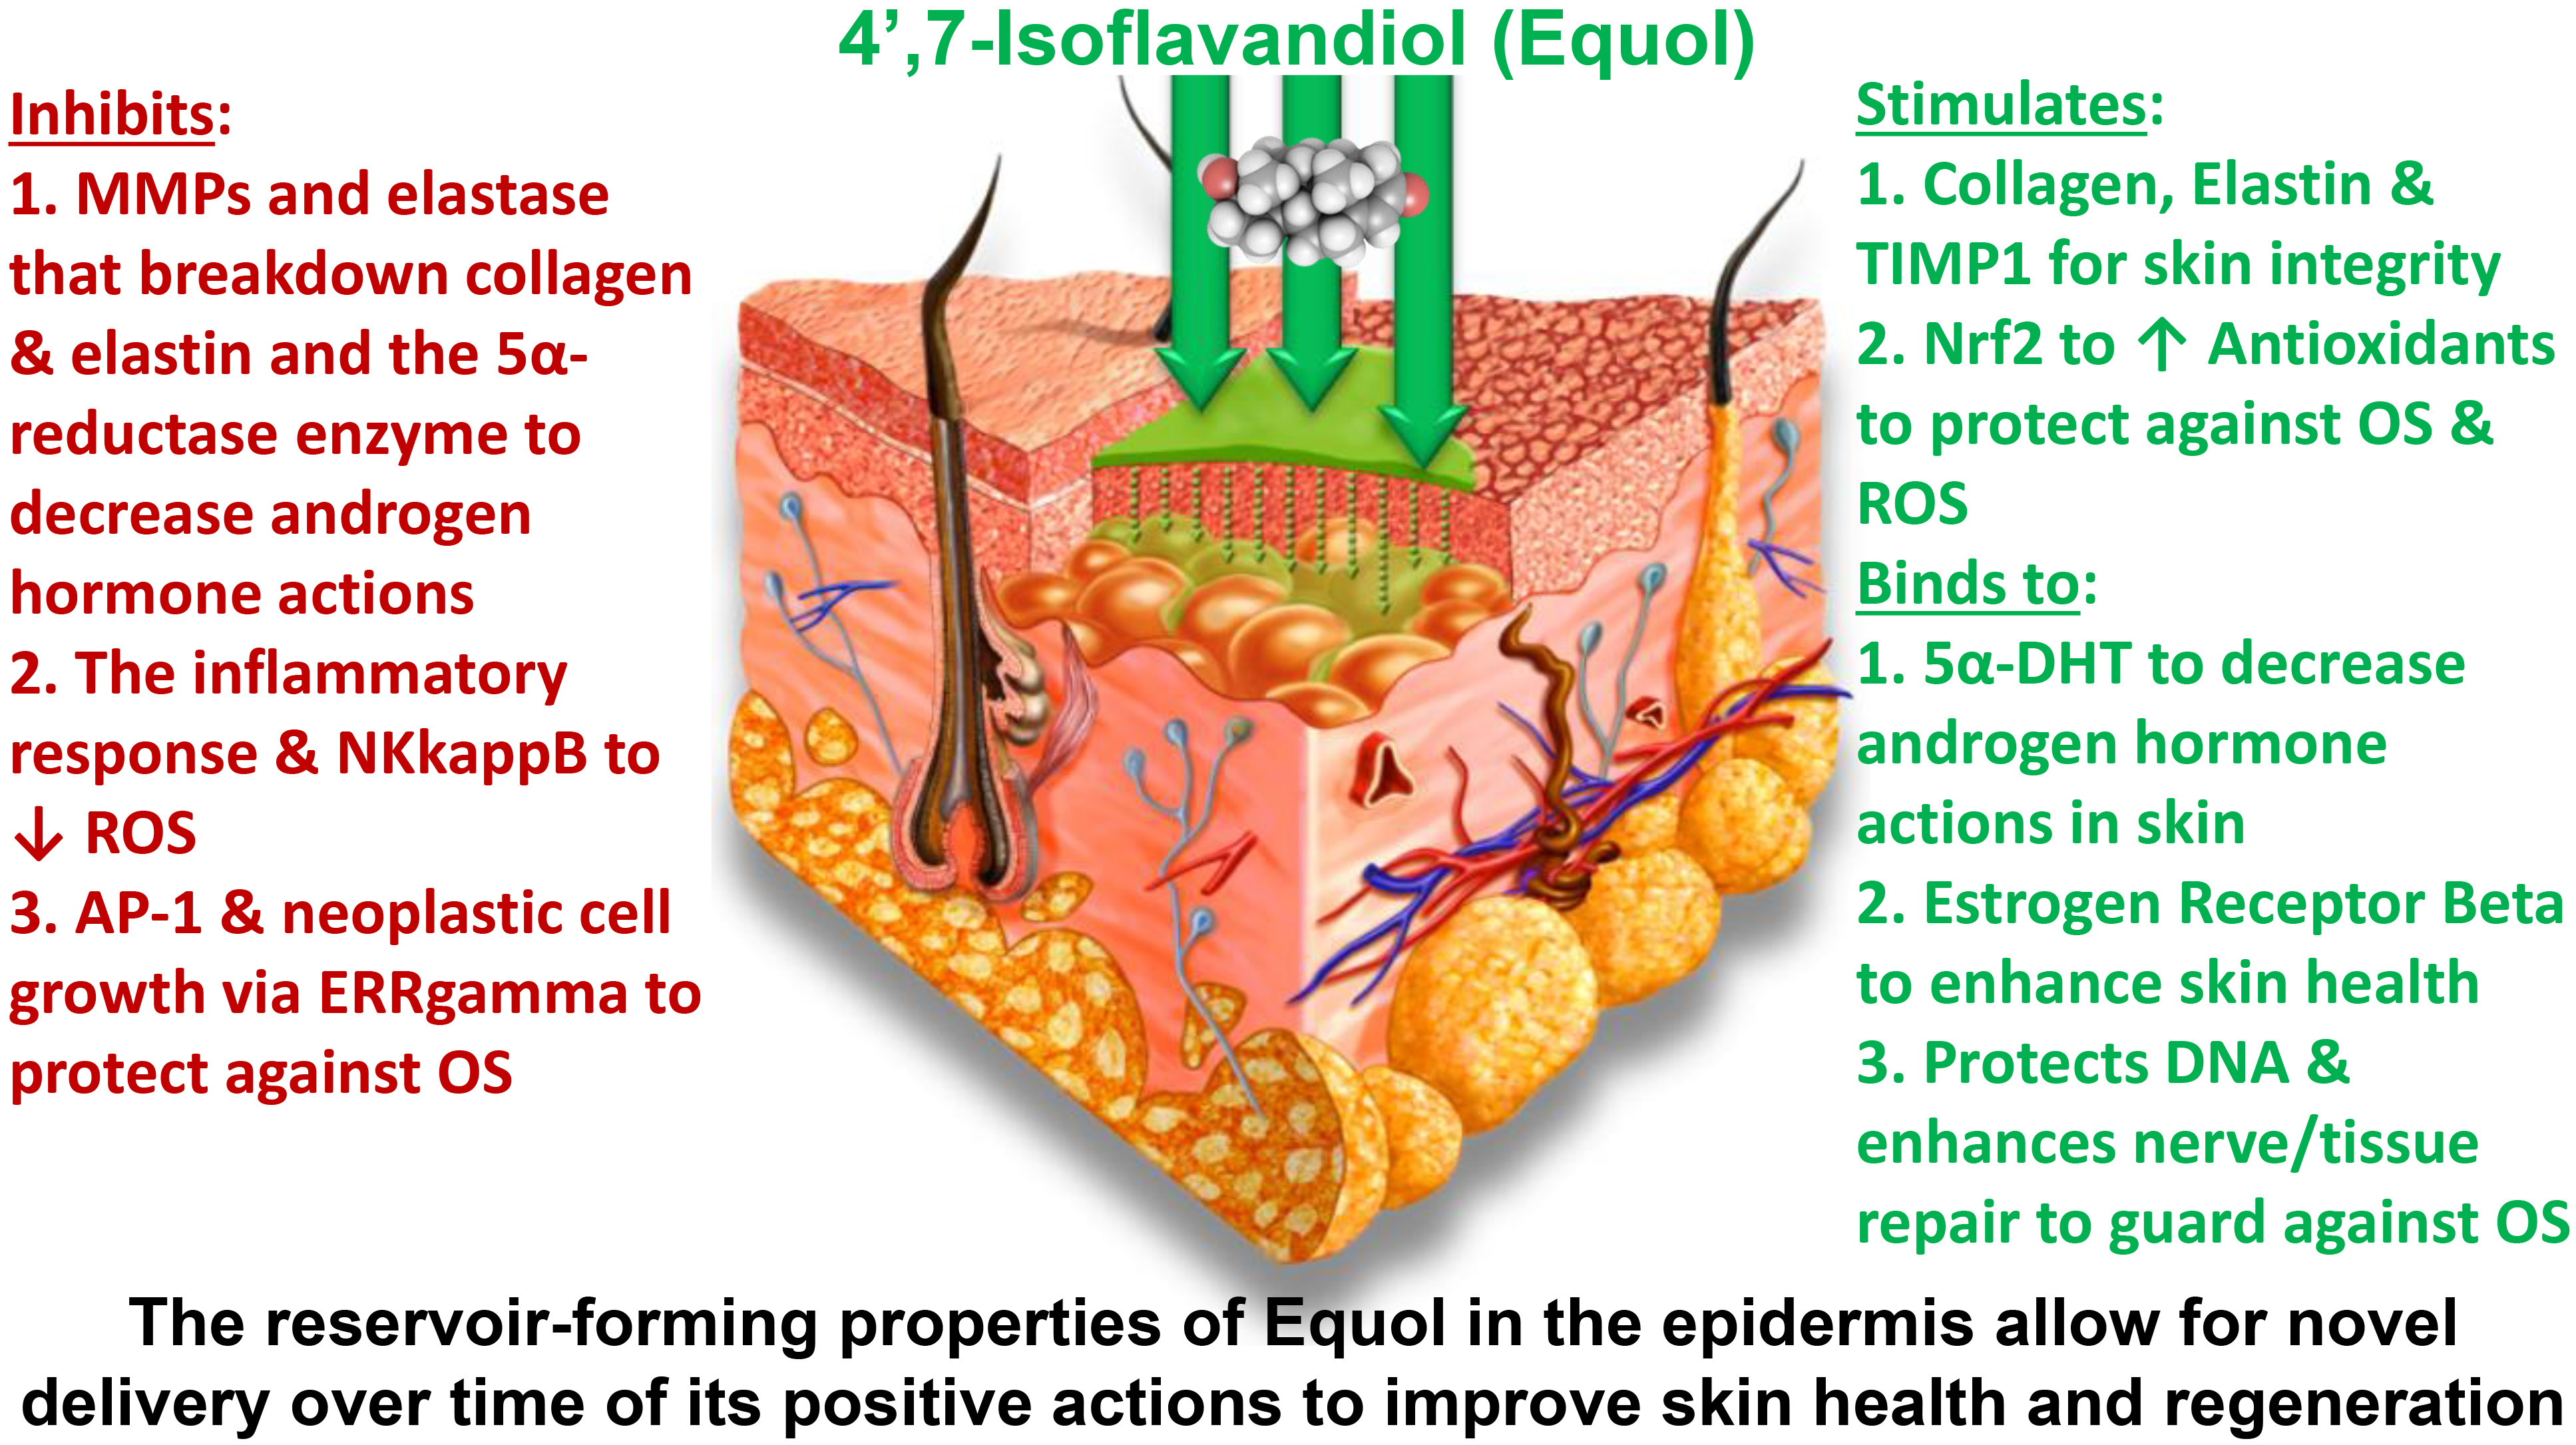 Fig. 3.
Cartoon displays skin layers and dermal actions of 4’,7-Isoflavandiol (Equol) via in vitro and ex vivo investigations.
While CBD and Equol have been studied individually in various skin studies, the present investigation was undertaken to test the hypothesis that topically applied CBD with Equol may yield enhanced effects on human skin gene biomarkers covering a comprehensive profile via microarray analysis compared to CBD or Equol treatments alone. Finally, the chemical structures and characteristics of CBD and Equol are shown in Fig. 4.
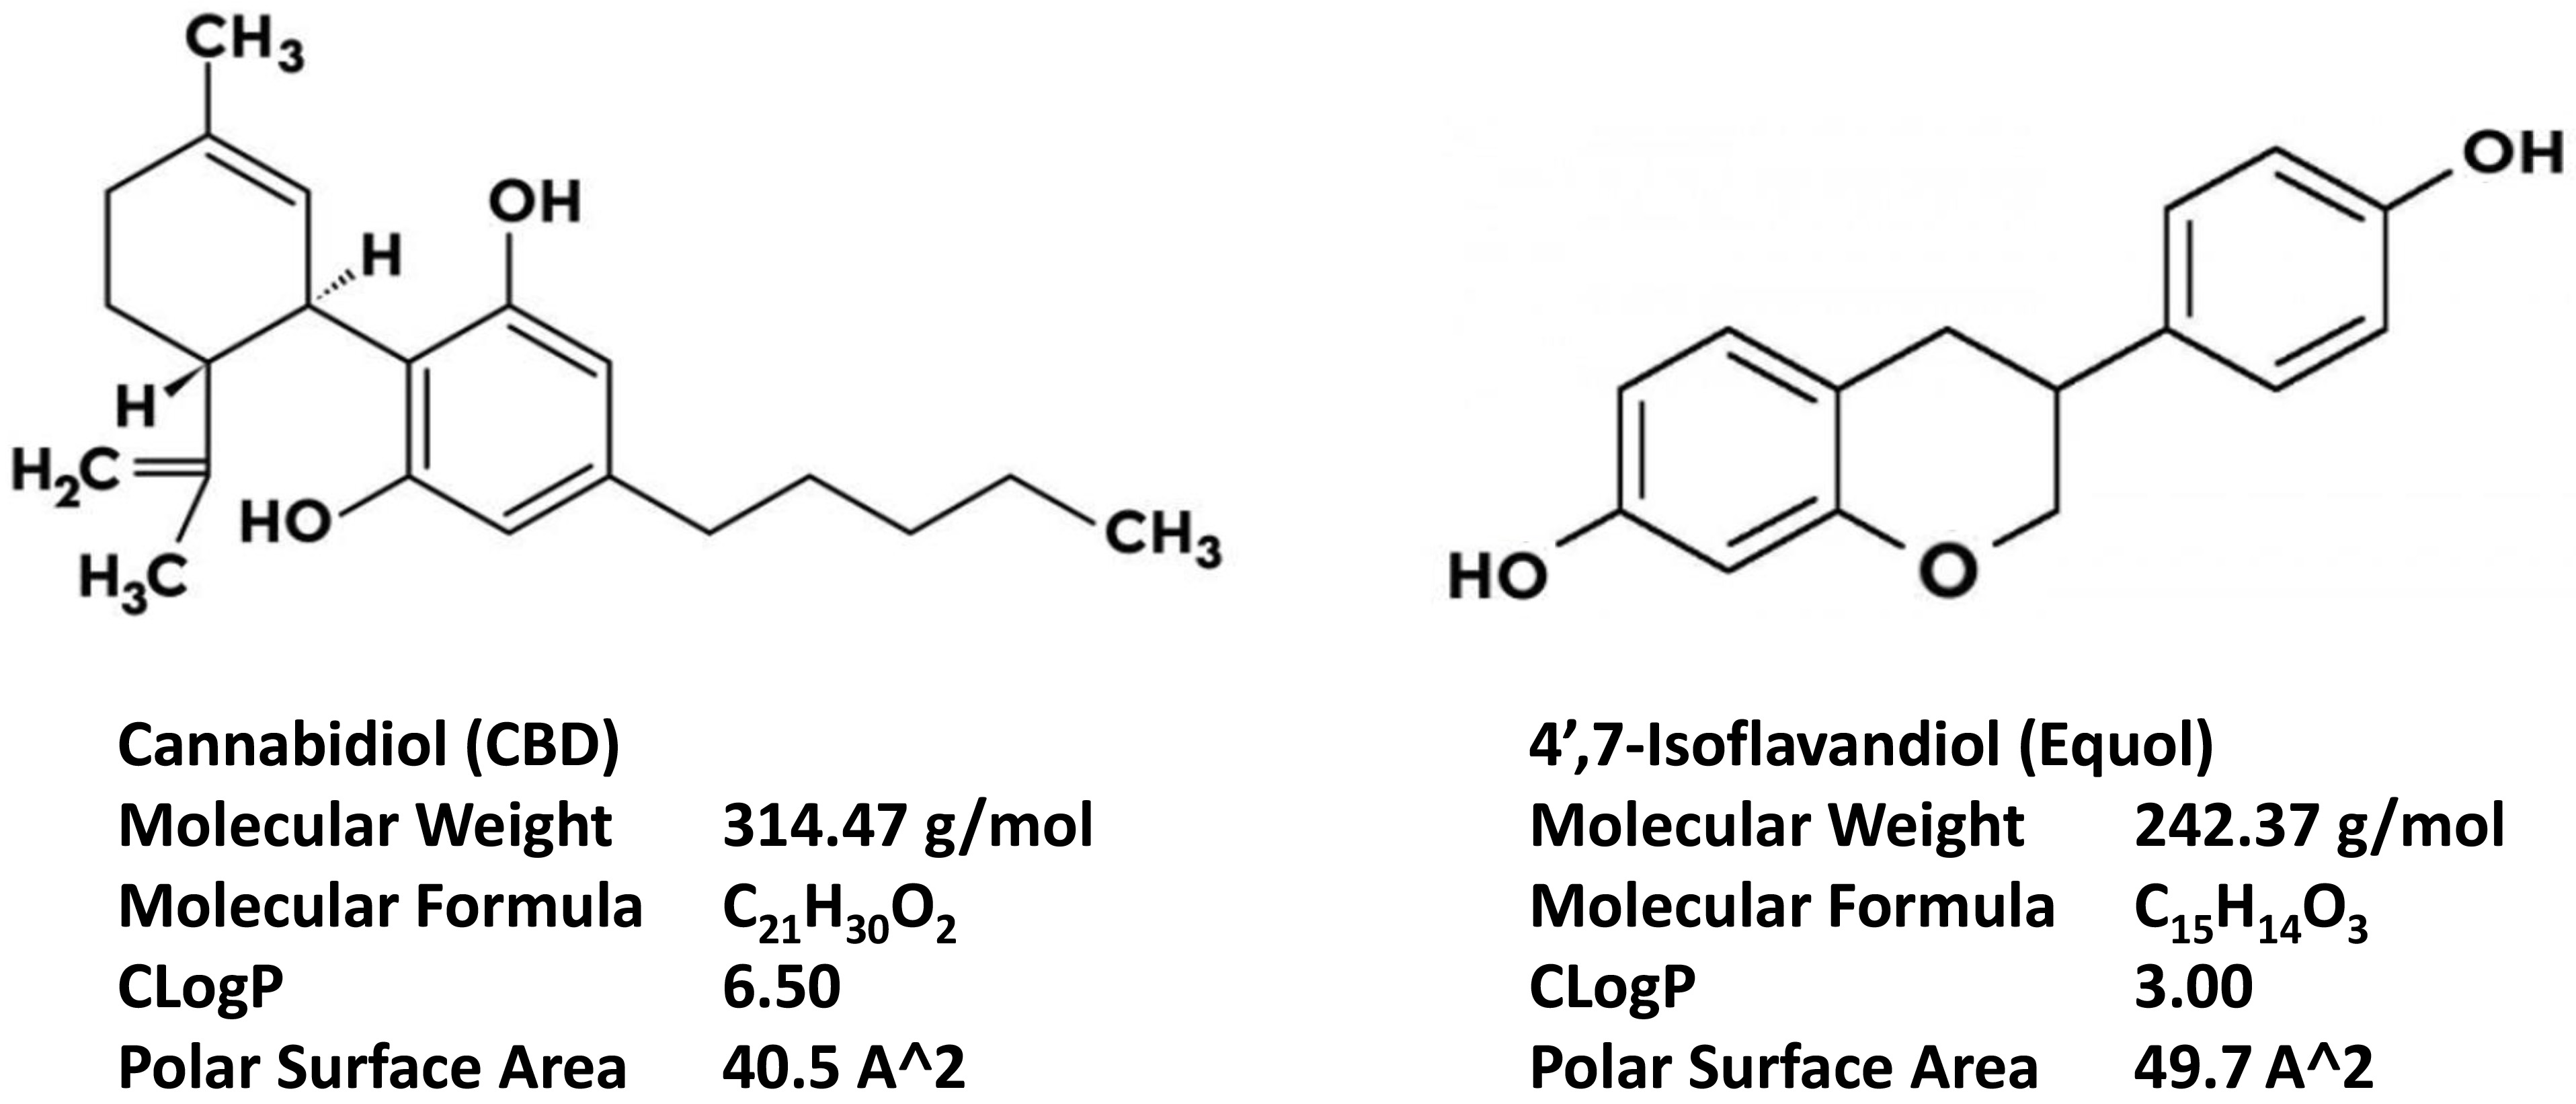 Fig. 4.
Chemical Structures and Characteristics of Cannabidiol (CBD) and
4’,7-Isoflavandiol (Equol). CLogP = the logP value of a compound representing
its partition coefficient and lipophilicity. Polar Surface Area = sum over
all polar atoms or molecules, primarily oxygen and nitrogen (and associated
hydrogen atoms). Molecules with a polar surface area of greater than
140 angstrons squared (A^
Transcutol CG was purchased from Gattefosse SAS (Cedex, France). CBD (99%
purity, #191012709) was purchased from Extract Labs (Lafayette, CO, USA). Equol
(CAS 94105-90-5,
For all the EFT skin cultures, after the application of the treatment(s), sections of the skin sample were prepared and stained with hematoxylin/eosin that revealed cellular components [epidermal layers (stratum corneum and keratinocytes), dermal (fibroblasts), and epidermal/dermal borders. This method has been reported elsewhere [12, 17] where the histological sections were recorded using a Nikon microscope camera (DS-Fi3; Melville, NY, USA). Notably, it is well established that transcutol readily penetrates the stratum corneum as a skin penetrating agent [19, 20].
This was accomplished through experiments using gene (array/mRNA levels) expression, where several skin-related genes could be examined at the same time using human skin (EFT) cultures, as preformed previously [12, 18]. A total of 163 genes were tested. However, 4 genes did not amplify well (CNR1, CRN2, NDRG2, ELOVL4), 34 genes did not display significant alterations with any of the treatments and 9 genes have not been well studied in human skin (dependent upon stimulation or inhibition of the gene expression recorded). Therefore, 97 gene biomarkers out of 116 genes or 84 percent were included in the current study. This gene expression experiment was performed to compare CBD (0.3%), Equol (0.5%) or CBD (0.3%) with Equol (0.5%) versus transcutol control values for each parameter (at 24 hour topical exposure), plus untreated controls, n = 4 across all treatment groups. Validation of these methods used have been reported elsewhere [12, 13, 14, 15, 16, 17, 18]. However, in brief, after the topical application of the 20 µL test samples onto the EFT cultures and at the end of the 24 h incubations, total RNA was isolated using Maxwell 16 Simply RNA Tissue kit (Promega, Madison, WI, USA). RNA concentration and purity were determined using a Nanodrop 200 spectrophotometer (A260/A280), all samples had values from 1.8 to 2.1. Also, for quantitative polymerase chain reaction analysis, 1 µg of total RNA from each tissue EFT sample was converted to cDNA using High Capacity DNA Synthesis Kits (Applied Biosystems, Foster City, CA, USA) for open array processing and qPCR reactions were run using validated Taqman gene expression assays, which were analyzed in a Life Technologies QuantStudio 12 K Flex instrument (Thermo Fisher Scientific, Carlsbad, CA, USA). GUSB was the most stable (control) endogenous gene (among 5 control gene tested) and served as the control gene for all samples. Cycling conditions were 50 °C for 2 minutes, 94.5 °C for 10 minutes, followed by 40 cycles of 97 °C for 30 seconds, then 59.7 °C for 1 minute. mRNA levels were quantified using Applied Biosystem’s Sequence Detection Software (SDS, v5.0) and RQ Manager (v2.2) progams (Foster City, CA, USA). Inhibition of gene expression was detected by significant lower copy numbers and significant stimulation of gene expression was detected by higher copy numbers compared to vehicle control values for each biomarker (see Data and Statistical Analysis section), plus dCT values normalized to the GUSB values for each biomarker was performed.
Real-Time RT-PCR data were analyzed using RealTime StatMiner software v4.2 (Thermo Fisher Scientific, Waltham, MA, USA) for statistical analysis using the relative quantitation (RQ) method. The cycle threshold (CT) value of the target was normalized to the CT value of a selected endogenous control. RQ value was calculated and converted to linear fold changes.
Unpaired t-tests were performed, and a p-value of less than or
equal to 0.05 was reported as statistically significant results (p
A total of 163 genes were tested. However, 4 genes did not amplify well, 43 genes were omitted (see methods), therefore, 97 gene biomarkers out of 116 genes or 84 percent were included in the current study regardless of whether the 2-fold or greater change in gene expression had a positive or negative impact on skin health. The 97 gene biomarkers covered nine different skin functions (i.e., acne regulation, anti-aging, anti-inflammatory (pain), antioxidant, circadian rhythm regulation, pigementation, skin hydration, tissue integrity and wound healing); stimulation or inhibition of certain genes (in most cases), enhanced dermal health.
The MTT results that indicated cell viability (epidermis, dermis and full-thickness) following 24 hour exposure to the treatments are displayed in Fig. 5A–C.
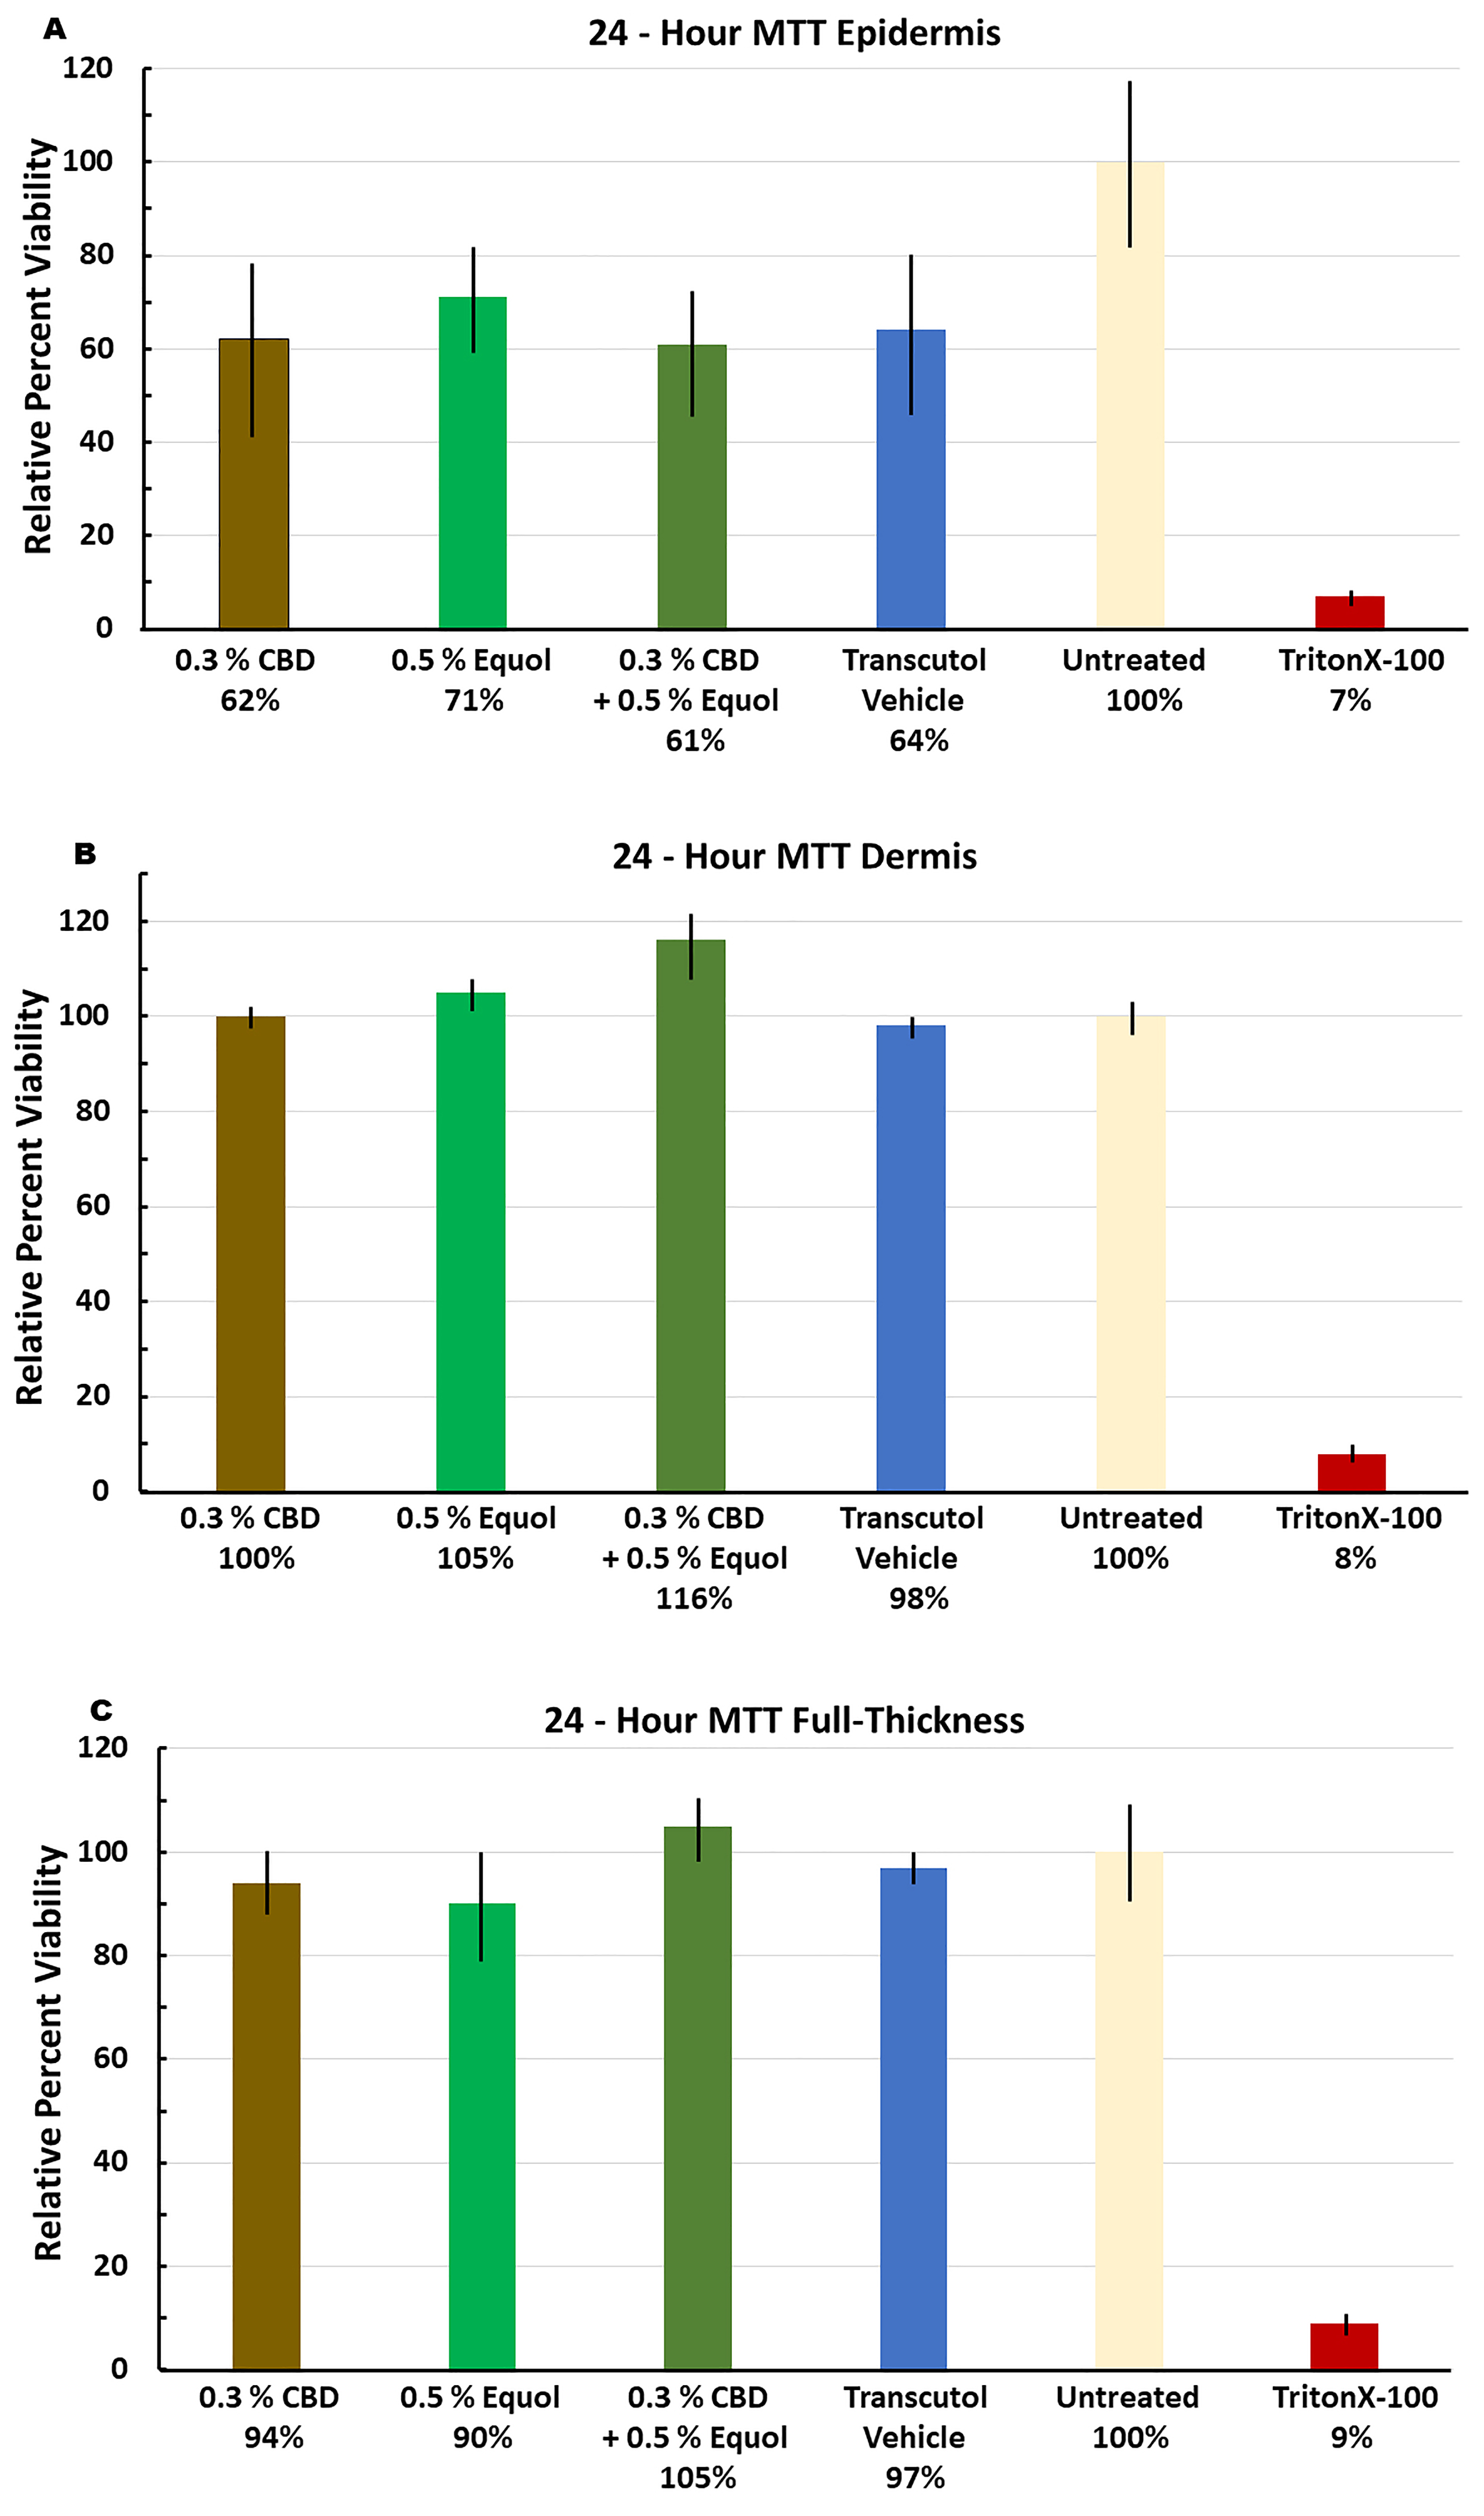 Fig. 5.
(A–C) Testing Cell Viability (expressed as relative percent)
via the MTT assay. Topical applications of the treatments (single dose of 20
µL) for 24 hours. The data are expressed as the mean
When the skin sections were stained with hematoxylin/eosin, all of the treatments slides displayed the dermal layers and cellular components such as the stratum corneum, keratinocytes, fibroblasts and the epidermal/dermal borders (see Fig. 6).
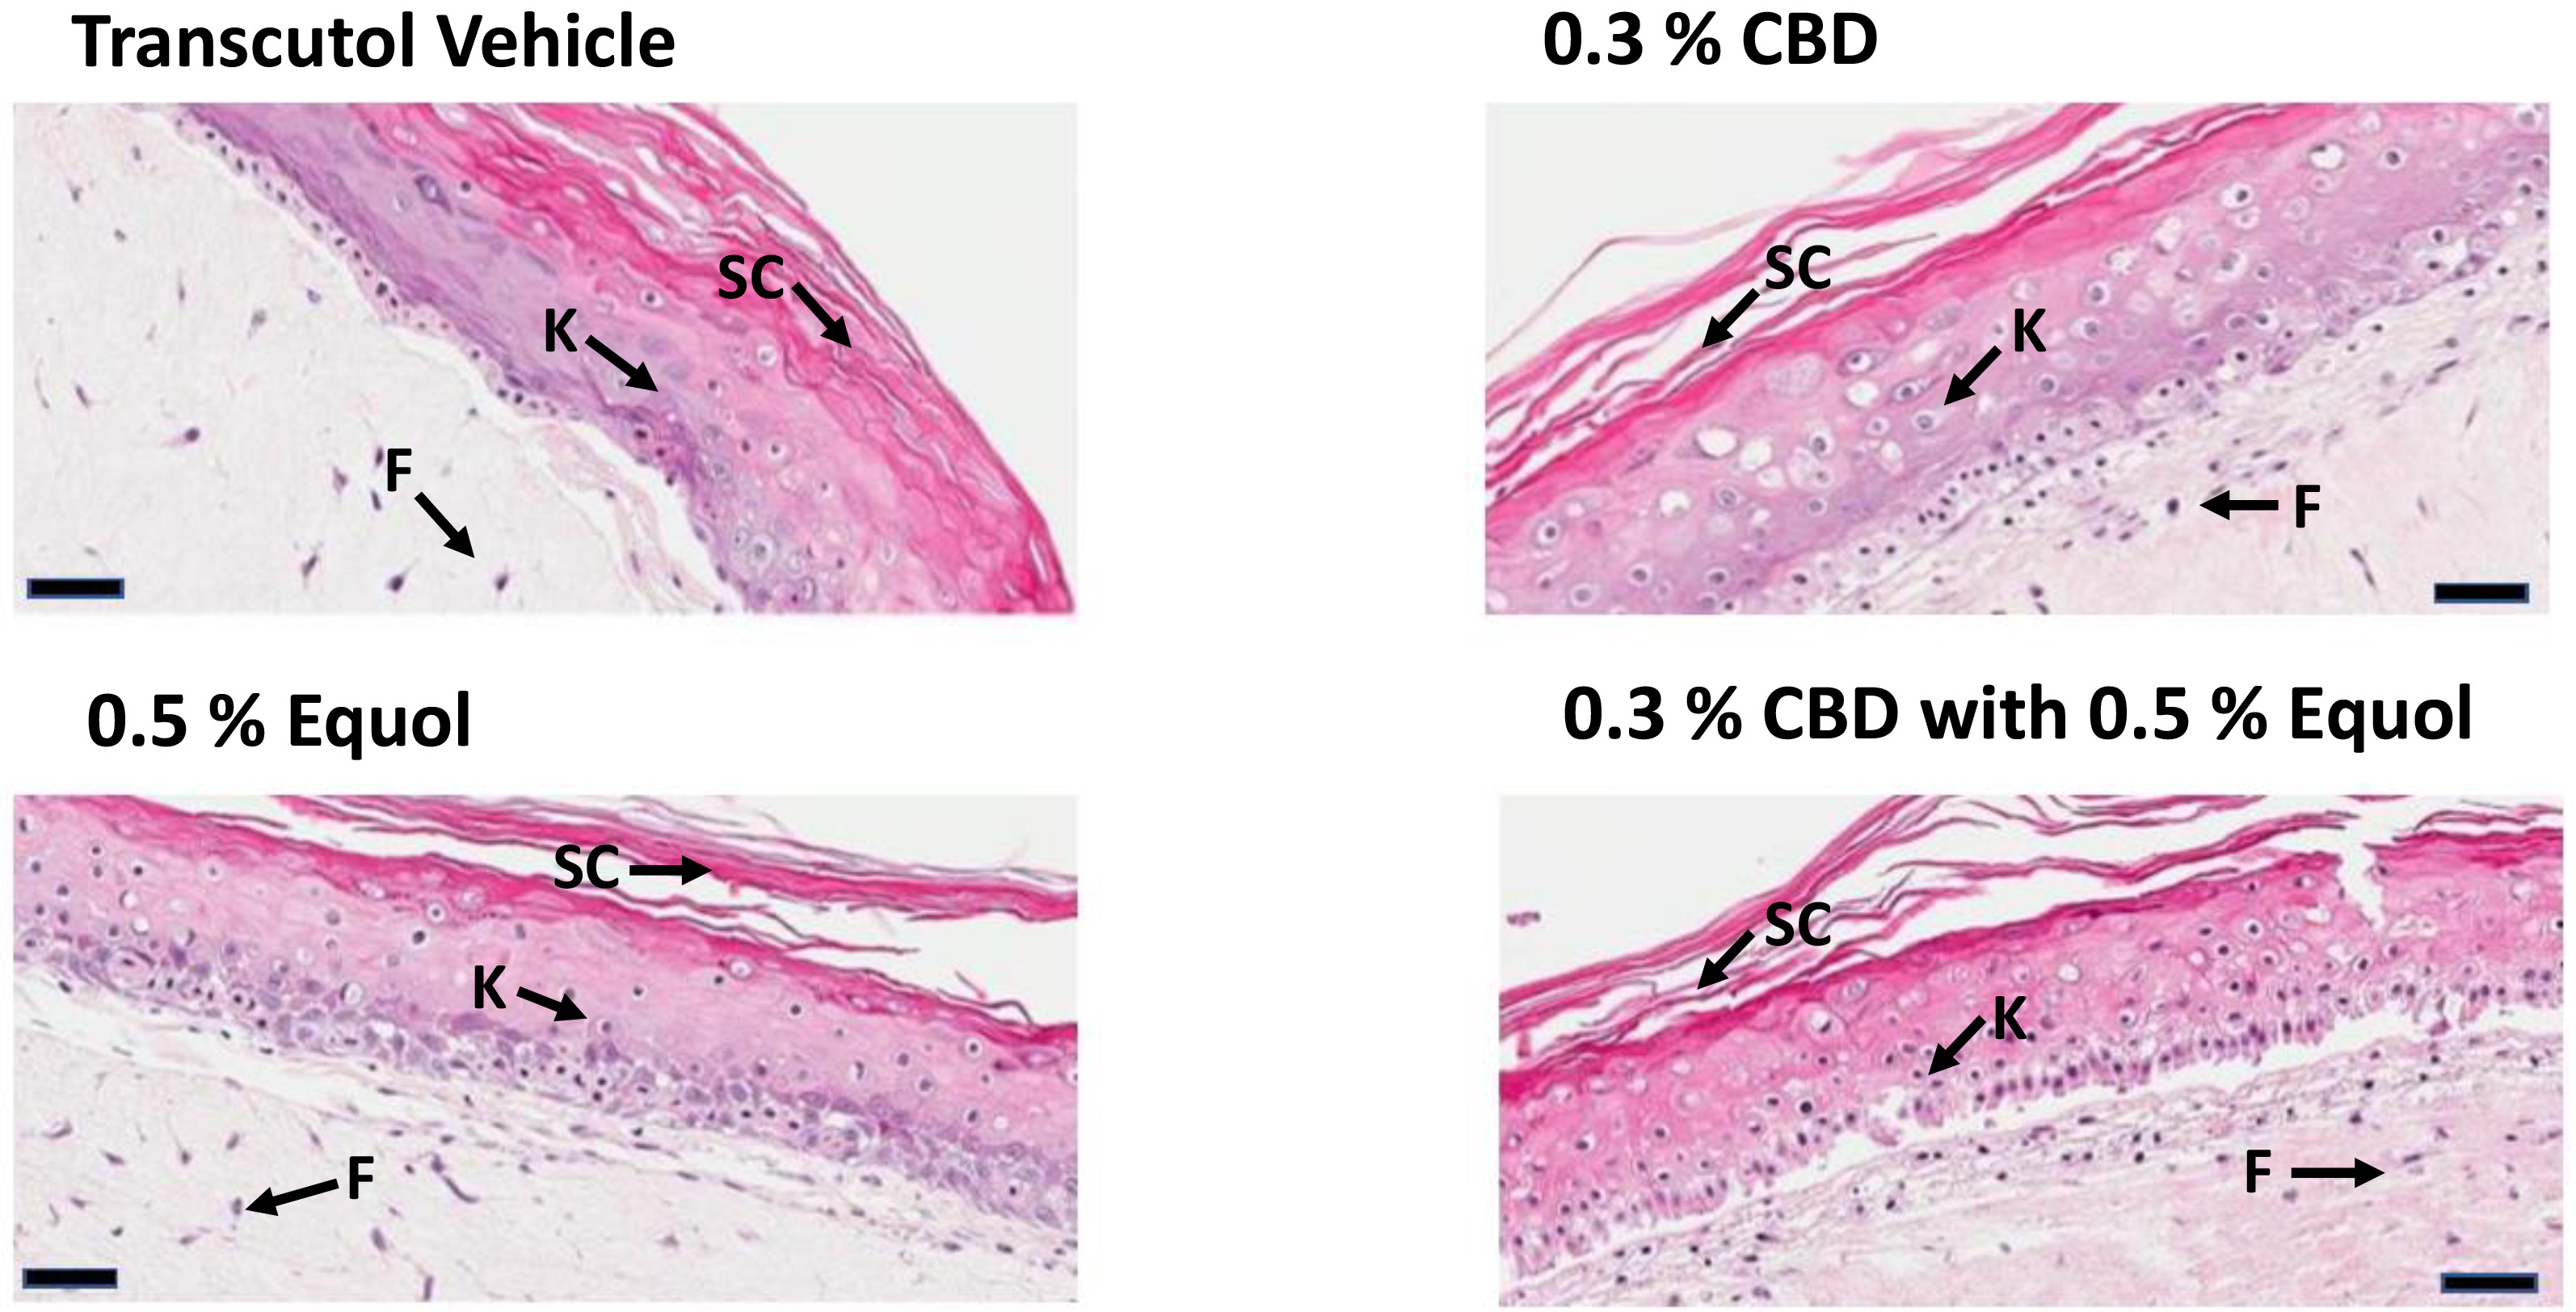 Fig. 6.
Representative histological sections of the vehicle (transcutol)
and across the treatment groups from the gene array experiments are displayed at
40
As shown in Table 1, the skin genes (biomarker names) associated with acne regulation, anti-aging and anti-inflammatory (pain) are displayed along with each gene’s skin function and where the gene is located by skin cell type (either fibrobasts, keratinocytes or both). Among the skin gene analysis involved in acne regulation, CDB with Equol displayed the greatest significant values for four out of the five biomarkers tested. The anti-acne and anti-inflammatory skin effects ranging from –3.77 to –5.31-fold change over CBD or Equol only treatments for (KLK5, KLK7, PSAPL1). Additionally, CBD with Equol significantly stimulated gene expression for TRIB3 above CBD or Equol treatments only. Only the Equol treatment alone showed a significant –2.19-fold change (or inhibition of 219%) for the gene expression of MAPK3 over CBD alone or CBD with Equol values, which also had an anti-acne and anti-inflammatory influence. The CBD treatment goup only displayed either no significant alterations in skin gene expression or displayed the lowest fold-change values compared to the Equol only or CBD with Equol levels for this skin function category.
| Gene name | CBD | Equol | CBD + Equol | Skin function | Skin cell type | |
| ACNE REGULATION | ||||||
| 1. KLK5: Kallikrein Related Peptidase 5 | NS | NS | –4.67^ | anti-acne, anti-inflammatory | K | |
| 2. KLK7: Kallikrein Related Peptidase 7 | –2.34* | NS | –5.31^ | anti-acne, anti-inflammatory | K | |
| 3. MAPK3: Mitogen-Activated Protein Kinase 3 | NS | –2.19# | NS | anti-acne, anti-inflammatory | F, K | |
| 4. PSAPL1: Prosaposin Like 1 | NS | –3.12# | –3.77^ | anti-acne, anti-inflammatory | K | |
| 5. TRIB3: Tribbles Pseudokinase 3 | NS | 2.43# | 3.92^ | anti-acne, anti-inflammatory | F, K | |
| ANTI-AGING | ||||||
| 1. ADH1B: Alcohol Dehydrogenase 1B | NS | 7.20# | 8.93^ | anti-aging, anti-pigmentation | F, K | |
| 2. CASP3: Caspase 3 | NS | 2.25# | 2.84^ | cell growth/renewal | F, K | |
| 3. COL1A1: Collagen type 1 alpha 1 | NS | 2.10 | 2.07 | matrix structural protein | F | |
| 4. CST6: Cystatin E/M | NS | 3.01# | 6.06^ | barrier integrity/hydration | K | |
| 5. DNASE1L2: Deoxyribonuclease 1 Like 2 | NS | 2.04# | 3.31^ | barrier integrity | K | |
| 6. DSC1: Desmocollin 1 | 2.14 | 3.29# | 6.29^ | anti-aging, matrix function | K | |
| 7. DSG1: Desmoglein 1 | NS | 2.49# | 3.03^ | anti-aging, matrix function | K | |
| 8. ELN: Elastin | NS | 2.29# | 2.55^ | anti-aging, elasticity | K, F | |
| 9. GSDMC: Gasdermin C | NS | –2.11# | –2.84^ | anti-aging, ↓ MMP expression | K | |
| 10. IGFL3: Insulin Growth Factor Like Family Member 3 | NS | 3.28 | 5.33^ | cell growth/renewal | K | |
| 11. MMP 10: Matrix Metallproteinase 10 | –3.41 | –7.48# | –3.57 | MMPs break down collagen/elastin | F, K | |
| 12. PPARGC1A: PPARC Coactivator 1 alpha | NS | NS | 3.01^ | ↑ Mitochondrial biosynthesis | F, K | |
| 13. S100A7: S100 Calcium Binding Protein A7 | 2.69 | 3.58# | 7.22^ | barrier function | K | |
| 14. SERPINH1: Serpin Family H member 1 | NS | 2.58# | 7.06^ | collagen biosynthesis, wound healing | K, F | |
| 15. SDR16C5: Short Chain Dehyrogenases/Reductase | NS | 2.08# | 4.42^ | anti-aging | K | |
| 16. TGM5: Transglutamine 5 | 4.51 | 6.24# | 12.63^ | barrier function/hydration | K | |
| 17. TIMP 1: Tissue Inhibitor of Matrix Metalloproteinase 1 | NS | 2.31# | 2.83^ | breaks down MMPS | F, K | |
| ANTI-INFLAMMATORY (PAIN) | ||||||
| 1. ANXA9: Annexin A9 | –5.44 | –14.08# | –19.16^ | anti-inflammatory | K | |
| 2. APOB: Apolipoprotein B | –12.64 | –31.47# | –20.90^ | anti-inflammatory | F, K | |
| 3. ARG1: Arginase 1 | –2.45 | –2.17 | –4.25^ | anti-inflammatory | K | |
| 4. CASP14: Caspase 14 | NS | 2.24# | 4.11^ | anti-inflammatory | K | |
| 5. CSF2: Colony Stimulating Factor 2 | NS | NS | –7.78^ | anti-inflammatory | F, K | |
| 6. DMKN: Dermokine | –4.49* | –6.38# | –12.01^ | anti-inflammatory | K | |
| 7. IFNA1: Interferon Alpha 1 | NS | NS | –2.10^ | anti-inflammatory | K | |
| 8. IL10: Interleukin 10 | NS | NS | 2.14^ | anti-inflammatory | F, K | |
| 9. IL18: Interleukin 18 | –3.50 | –4.73# | –8.39^ | anti-inflammatory | K | |
| 10. IL20RA: Interleukin 20 Receptor Subunit Alpha | –2.57 | –5.89# | –6.75^ | anti-inflammatory | K | |
| 11. IL20RB: Interleukin 20 Receptor Subunit Beta | –2.26 | –2.09 | –3.28^ | anti-inflammatory, anti-psoriatic | K | |
| 12. IL23A: Interleukin 23 Subunit Alpha | 6.72 | 7.31 | 9.43^ | pro-inflammatory | F, K | |
| 13. IL24: Interleukin 24 | 2.43 | 3.03 | 3.63^ | anti-proliferative | F, K | |
| 14. IL37: Interleukin 37 | –6.93 | –9.25# | –7.67 | increased immune response | F, K | |
| 15. IRF1: Interferon Regulatory Factor 1 | 2.95 | 5.79# | 6.57^ | tumor-suppressor | K | |
| 16. SERPINA12: Serpin Family A Member 12 | 5.53 | 9.54# | 17.23^ | anti-inflammatory, anti-microbial | K | |
| 17. SPINK5: Serine Peptidase Inhibitor Kazal Type 6 | NS | 3.21# | 6.25^ | anti-inflammatory | K | |
| 18. ST14: Suppression Tumorigenicity 14 (Maltriptase) | NS | –5.03# | –6.94^ | anti-inflammatory | K | |
| 19. TLR2: Toll Like Receptor 2 | –2.75 | –6.99# | –10.25^ | anti-inflammatory, anti-acne | K | |
| 20. TNSF10: Tumor Necrosis Factor Member 10 | –5.00 | –6.94# | –8.52^ | anti-psoriatic | F, K | |
| 21. WFDC5: WAP Four-Disulfide Core Domain 5 | –2.46 | –4.23# | –6.05^ | anti-inflammatory, anti-psoriatic | K | |
Gene Expression (fold-change) influenced by CBC (0.3%) vs. Equol (0.5%) vs.
CBD with Equol, which resulted in 2-fold or greater change (stimulation or
inhibition) compared to Vehicle (Transcutol) Control values are displayed. The
greatest numerical value (inhibition or stimulation) among the treatment groups
is displayed in bold. Significantly differences were set at p
When the anti-aging genes were analyzed (see Table 1), 15 out of the 17 biomarkers showed significant stimulation ranging from 2.07 to 12.63-fold changes (or 207% to 1263%) in the CBD with Equol treatment group compared to the CBD or Equol treatments alone for ADH1B, CASP3, CST6, DNASE1L2, DSC1, DSG1, ELN, IGFL3, PPARGC1A, S100 A7, SERPINH1, SDR16C5, TGM5 and TIMP1, whereas the CBD with Equol displayed a significant inhibition of GSDMC compared to the CBD and Equol only treatments. Only the Equol treatment alone displayed the greatest significant fold-inhibition for the matrix metalloproteinase 10 (MMP10) biomarker (at 7.48 or 748%) compared to CBD alone (–3.41) or CBD with Equol (at –3.57). Finally, CBD alone was not significant for the collagen biomarker (COL1A1) while Equol alone and CBD with Equol display similar significant levels at 2.10 or 210% vs. 2.07 or 207%, respectively, for the stimulation of this skin gene profile. Moreover, CBD treatment alone in 13 out of the 17 biomarkers displayed no significant changes compared to control values for anti-aging gene expression (Table 1).
Finally, when the anti-inflammatory (pain) genes were tabulated (see Table 1), 18 out of the 21 biomarkers showed significant changes (either stimulation or inhibition) ranging from 2.10 to 19.16-fold (or 210% to 1916%) in the CBD with Equol treatment group compared to the CBD or Equol treatments alone. Notably, one biomarker (IL23A) an interleukin with pro-inflammatory properties was significantly stimulated in the CBD with Equol group compared to the other two treatment groups. Only 2 biomarkers (APOB and IL37) displayed the greatest significant change in gene expression in the Equol only treatment group compared to the CBD only or CBD with Equol values. In general, while the CBD only treatment displayed anti-inflammatory properties among the skin biomarkers tested, this treatment group showed the most non-significant or lowest gene expression levels among the 20 anti-inflammatory genes analyzed (Table 1).
The genes involved as antioxidants, in circadian rhythm regulation and pigmentation are shown in Table 2. In the CBD only treatment group for the antioxidant biomarkers 5 out of 11 genes displayed protection against oxidative stress (OS), however, in this treatment group only the MT1G biomarker showed significantly greater stimulation compared to the Equol only group. Furthermore, the Equol only treatment displayed the greatest significant stimulation of MT1A compared to the CBD only or the CBD with Equol values. Notably, in the CBD with Equol group 10 out of the 11 biomarkers displayed higher numerical values with 9 skin genes that were significantly (stimulated or inhibited) compared to the CBD only or Equol only values that included activation of Nrf2, anti-inflammatory, pro-survival, wound healing and protection agains free radical and oxidative stress (OS) (see Table 2).
| Gene name | CBD | Equol | CBD + Equol | Skin function | Skin cell type | |
| ANTIOXIDANT | ||||||
| 1. AHR: Aryl Hydrocarbon Receptor | NS | 2.08 | 2.67^ | activate Nrf2, ↑ other antioxidants | F, K | |
| 2. CAT: Catalase | NS | 2.17 | 2.54^ | antioxidant | F, K | |
| 3. DUOX1: Dual Oxidase 1 | NS | –3.65 | –4.10^ | anti-inflammatory | F, K | |
| 4. EGLN3: Egl-9 Family Hypoxia Inducible Factor | NS | 3.57# | 4.29^ | limits hypoxia factors | K | |
| 5. HAL: Histidine Ammonia Lyase | 2.35 | 3.21 | 6.10^ | antioxidant, anti-inflammatory, wound healing | F, K | |
| 6. HMOX1: Heme Oxygenase 1 | –3.96 | NS | 3.48^ | antioxidant, anti-inflammatory, wound healing | F, K | |
| 7. MT1A: Metallothionein 1A | 3.67 | 4.57# | 3.58 | antioxidant | F, K | |
| 8. MT1G: Metallothionein 1G | 42.78* | 12.51 | 57.12^ | antioxidant | F, K | |
| 9. NFE2L3: Nuclear Factor Erythroid Like 3 | NS | –2.10 | –2.53^ | pro-survival, anti-proliferative | F, K | |
| 10. SLC30A1: Solute Carrier Family 30 Member 1 | 3.18 | NS | 3.55^ | antioxidant, anti-inflammatory | F, K | |
| 11. TXNRD1: Thioredoxin Reductase 1 | NS | 5.89# | 7.71^ | protects against free radicals/oxidative stress | F, K | |
| CIRCADIAN RHYTHM REGULATION | ||||||
| 1. CIRT: Circadian Associated Repressor of Transcription | NS | NS | –2.21^ | anti-proliferative | F, K | |
| 2. CLOCK: Clock Circadian Regulator | NS | NS | 2.27^ | DNA repair/hydration/barrier function | K | |
| 3. CRY1: Cryptochrome Circadian Regulator 1 | NS | NS | 2.79^ | skin firmness/elasticity/antioxidant | K | |
| 4. NOCT: Nocturnin | NS | –2.68# | –3.13^ | epidermis homeostasis/inverse CLOCK | K | |
| 5. PER2: Period Circadian Regulator 2 | NS | 2.02# | 2.79^ | CLOCK regulator, hair growth | K | |
| 6. RORA: RAR Related Orphan Receptor A | NS | NS | –3.05^ | decrease acne | F, K | |
| PIGMENTATION | ||||||
| 1. ABRB2: Adrenoceptor beta 2 | –3.02* | –2.10 | –3.47^ | anti-pigmentation | F, K | |
| 2. ALOX12B: Arachidonate Lipoxygenase 12R Type | –2.95 | –30.27# | –33.74^ | anti-pigmentation, brightening | K | |
| 3. BMP6: Bone Morphogene Protein 6 | 5.97* | 4.25 | 9.63^ | anti-pigmentation, scare formation | F, K | |
| 4. CALM5: Calmodulin Like 5 | –2.81 | –14.70# | –8.05^ | anti-pigmentation | K | |
| 5. CRYBG1 (AIM1): Crystallin Beta-Gamma Domain 1 | NS | NS | –2.75^ | anti-pigmentation | F, K | |
| 6. CTSV: Cathepsin V | NS | –2.27# | –7.08^ | anti-pigmentation | F, K | |
| 7. EDNRB: Endothelin Receptor Type B | 3.32* | 2.64 | 3.43^ | pro-pigmentation | F, K | |
| 8. KIT: KIT Proto-Oncogene Receptor Tyrosine Kinase | –2.48 | –2.23 | –2.52 | anti-pigmentation | F, K | |
| 9. KRT5: Kallikrein Related Peptide 5 | NS | NS | –2.34^ | anti-pigmentation | K | |
| 10. MC1R: Melocortin 1 Receptor | NS | –2.34# | –4.87^ | anti-pigmentation | F, K | |
| 11. MITF: Melanogenesis Associated Transcription Factor | NS | NS | –2.66^ | anti-pigmentation | F, K | |
| 12. PAQR7: Progestin, AdipoQ Receptor Family Member 7 | –2.57 | –2.94# | –2.02 | pro-pigmentation | F, K | |
| 13. PPARG: Peroxisome Proliferator-Activated Receptor G | NS | 2.66# | 3.36^ | pro-pigmentation, anti-psoriatic | F, K | |
| 14. QPCT: Glutaminyl-Peptide Cyclotransferase | NS | –2.94# | –2.02^ | anti-pigmentation | F, K | |
| 15. STAP2: Signal Transducing Adaptor Family Member 2 | NS | NS | –2.27^ | anti-pigmentation | F, K | |
Gene Expression (fold-change) influenced by CBC (0.3%) vs. Equol (0.5%) vs.
CBD with Equol, which resulted in 2-fold or greater change (stimulation or
inhibition) compared to Vehicle (Transcutol) Control values are displayed. The
greatest numerical value (inhibition or stimulation) among the treatment groups
is displayed in bold. Significantly differences were set at p
Skin cells have specialized “clock” genes that when synchronized can maximize DNA repair by providing nutrients and compounds to assist in skin cell restoration. When 6 clock genes were tested, the CBD only treatment group did not significantly alter any of these genes compared to vehicle control values (see Table 2). In the Equol only treatment 2 clock genes displayed significant values over controls, but in the CBD with Equol treatment all 6 clock genes (CIRT, CLOCK, CRY1, NOCT, PER2 and RORA) were significantly greater (either stimulation or inhibition) compared to the CBD only or Equol only values, which included DNA repair/hydration, barrier function, skin firmness, elasticity, etc. (Table 2).
For genes associated with pigmentation, in the CBD only group 6 out of the 15 biomarkers showed significant changes (either stimulation or inhibition) compared to vehicle control values and 3 of these biomarkers displayed significantly greater levels compared to the Equol only group (i.e., ABRB2, BMP6 and EDNRB, see Table 2). In the Equol only group 11 out of the 15 biomarkers showed significant changes compared to vehicle control values or CBD only levels. However, in the CBD with Equol group 10 out of 15 biomarker displayed anti-pigmentation skin function results compared to the Equol only or CBD only values, suggesting support for skin lightening properties with this combination (Table 2).
Skin genes associated with hydration, tissue integrity and wound healing as influenced by the 3 treatments are displayed in Table 3. In the CBD only group, 2 genes showed significant changes (ALOX12B and BMP4) over vehicle control levels and in fact, BMP4 values were significantly altered (inhibition) compared to Equol only or CBD with Equol values. For the Equol only group, 4 out of the 5 genes showed significantly greater stimulation compared to the CBD only values. While in the CBD with Equol treatment 4 out of the 5 biomarkers displayed the greatest significant stimulation among the skin genes (ALOX12B, ALOXE3, AQP9 and EPHX3) compared to the CBD only or Equol only levels (see Table 3).
| Gene name | CBD | Equol | CBD + Equol | Skin function | Skin cell type | |
| SKIN HYDRATION | ||||||
| 1. ALOX12B: Arachidonate 12-Lipoxygenase 12R Type | 2.89 | 6.34# | 10.26^ | hydration/barrier function | K | |
| 2. ALOXE3: Arachidonate Lipoxygenase 3 | NS | 4.28# | 6.58^ | hydration/barrier function | K | |
| 3. AQP9: Aquaporin 9 | NS | 3.73# | 7.74^ | hydration | K | |
| 4. BMP4: Bone Morphogene Protein 4 | –2.56* | NS | NS | hydration/barrier function | F, K | |
| 5. EPHX3: Epoxide Hydrolase 3 | NS | 2.38# | 3.89^ | hydration/barrier function | K | |
| TISSUE INTEGRITY | ||||||
| 1. ABCG4: ATP Binding Cassette Subfamily G Member 4 | 4.18 | 6.27# | 11.16^ | cell survival/wound healing | F, K | |
| 2. CD36: CD 36 Molecule | 2.59 | 2.04 | 4.50^ | collagen binding/cell adhesion | K | |
| 3. CDSN: Corneodesmosin | 3.59 | 5.28# | 7.32^ | barrier function | K | |
| 4. FLG2: Filaggrin Family Member 2 | 5.21 | 5.03 | 9.36^ | keratin integrity | K | |
| 5. KRT1: Keratin 1 | NS | NS | 3.31^ | barrier function | K | |
| 6. KRT10: Keratin 10 | NS | NS | 2.64^ | barrier function | K | |
| WOUND HEALING | ||||||
| 1. EFNA3: Ephrin A3 | NS | NS | –6.77^ | decrease scar formation | K | |
| 2. F3: Coagulation Factor III Tissue Factor | NS | NS | 2.24^ | increase wound healing | F, K | |
| 3. FAF2: Fibroblast Growth Factor 2 | 4.58* | 3.29 | 8.08^ | growth factor, wound healing | K | |
| 4. FETUB: Fetuin B | 3.69* | NS | 9.33^ | wound healing/immune | K | |
| 5. HBEGF: Heparin Binding EGF Like Growth Factor | NS | NS | 8.42^ | wound healing | F, K | |
| 6. KITLG: Kit Ligand | 2.27 | 4.20# | 5.76^ | wound healing | K | |
| 7. LEP: Leptin | 2.08 | NS | 2.23 | wound healing | F, K | |
| 8. MT1F: Metallothinein 1F | NS | NS | 5.09^ | antioxidant, wound healing | F, K | |
| 9. NRG1: Neuregulin 1 | NS | NS | 2.01^ | wound healing | F, K | |
| 10. PKP1: Plakophilin 1 | NS | –2.05# | –4.93^ | decrease scar formation | K | |
| 11. PLAU: Plasminogen Activator, Urokinase | NS | NS | 2.50^ | wound healing | F, K | |
| 12. TIAM1: T Cell Lymphoma Invasion/Metastasis 1 | NS | NS | 2.69^ | wound healing/survival | F, K | |
Gene Expression (fold-change) influenced by CBC (0.3%) vs. Equol (0.5%) vs.
CBD with Equol, which resulted in 2-fold or greater change (stimulation or
inhibition) compared to Vehicle (Transcutol) Control values are displayed. The
greatest numerical value (inhibition or stimulation) among the treatment groups
is displayed in bold. Significantly differences were set at p
When the tissue integrity biomarkers were examined 4 out of 6 genes in the CBD only group showed significant stimulation over vehicle control values (for ABCG4, CD36, CDSN, FLG2). Also, in the Equol only group the same biomarkers displayed significantly greater stimulation compared to the CBD only levels. While in the CBD with Equol group all 6 out of 6 biomarkers (ABCG4, CD36, CDSN, FLG2, KRT1 and KRT10) displayed significantly greater stimulation compared to the CBD only or Equol only values, suggesting cell/tissue integrity, cell survival, collagen binding and cell adhesion characteristics (Table 3). Finally, wound healing biomarkers were examined where 4 out of the 12 biomarkers were significantly stimulated in the CBD only group over vehicle control values (e.g., FAF2, FETUB, KUTKG, LEP). In the Equol only group, 3 out of the 12 biomarkers showed significantly increased stimulation (or inhibition) over vehicle control levels and with 2 genes (KITLG showed stimulation and PJP1 displayed inhibition) that showed significantly greater values compared to CBD only levels. For the CBD with Equol treatment, 11 out of the 12 biomarkers showed significantly greater (stimulation or inhibition) compared to the CBD only or Equol only values, suggesting enhanced wound healing, antioxidant effects and cell/tissue survival (Table 3).
While CBD and Equol have been investigated individually as treatments, the purpose of this study examined whether CBD with Equol yielded better influences on human skin biomarkers compared to CBD or Equol alone. The transdermal delivery of CBD and Equol has been previously demonstrated via Franz cell diffusion testing [21, 22, 23]. In fact, the human transdermal delivery of Equol has been reported to accumulate in the epidermal layers [(binding to estrogen receptors (beta)] then slowly released into the dermis over 28 hours after a single topical application [23].
Acne is the most common skin condition in the United States that affects
approximately 85% of people 12 to 24 years of age [24]. Both CBD and Equol alone
displayed some anti-acne influences on some of the skin biomarkers, but the
greatest effect was observed when the CBD with Equol treatment was employed (in 4
out of 5 skin genes). The present data confirm the anti-acne effects of CBD,
where previous reports suggest the anti-inflammatory mechanisms work upon acne by
inhibiting the cytokines such as TNF-
Aging of the skin is due to exposure to the sun (photo-aging) that damages
dermal layers associated with the loss of collagen, elastin and the activation of
matrix metalloproteinases (MMPs) that breakdown the structural components of the
skin due to oxidative stress, inflammation and the lack of antioxidants to combat
these assaults [11, 27]. Previous in vitro, ex vivo and clinical
studies demonstrated that CBD or Equol have anti-aging properties that boost
dermal structural proteins (collagen & elastin) and antioxidants while
inhibiting oxidative stress and inflammation [4, 5, 6, 7, 9, 10, 11, 12, 13, 14, 15]. Additionally studies
that examined CBD showed that immune responses (e.g., the aryl hydrocarbon
receptor (AHR) redox homeostasis, the capase-1-IL 1 beta axis) were
significant in its skin rejuvenating properties [28, 29, 30, 31, 32, 33]. In general, the present
results confirm these skin protective and enhancement effects of CBD or Equol,
but especially when CBD with Equol was utilized to examine the human skin
biomarkers covering anti-aging, inflammation and antioxidants. For example, the
collagen (COL1A1), elastin (ELN), calcium binding protein
(S100 A7), serphinH1 (SERPINH1) and tissue inhibitor of matrix
metalloproteinase 1 (TIMP1) results in the present study confirm
previous reports published elsewhere [11, 12, 13]. Although, in this category of skin
function, the only aberrant finding was that interleukin 23 (IL23A) was
significantly stimulated by all the treatment groups, which is a pro-inflammatory
biomarker. However, 16 out 21 of the inflammatory biomarkers displayed
anti-inflammatory results with the CBD with Equol group (that demonstrated the
most significant inhibition of gene expression among the three treatment groups
of the genes tested). Also, the biochemical origin of pain is associated with the
inflammatory response in the extracellular matrix which include the interleukins
(IL-1, IL-6), TNF-
Circadian rhythms are maintained by networks of molecular clocks throughout the core and peripheral tissues, including immune cells, blood vessels, perivascular adipose tissues, etc. [37]. Skin cells have specialized “clock” genes that when synchronized can maximize DNA repair by providing nutrients and compounds to assist in skin cell restoration at certain time intervals [38]. While the Equol treatment alone significantly stimulated two clock genes, CBD with Equol significantly stimulated 6 out of 6 of the clock biomarkers that are known to influence DNA repair, hydration, barrier function, skin firmness, elasticity, antioxidant function, hair growth and diminish acne (Table 2). Prior studies on CBD and gene “clocks” and circadian rhythms have been reviewed, where the endocannabinoid system has emerged as a complex signaling network, which regulates numerous aspects of circadian physiology that are especially beneficial in aging individuals [39]. Also, the polyphenols, such as resveratrol and Equol have been studied via “clock” genes, where activation of SIRT1 by the PER2 and CLOCK genes have been shown to promote vascular health [37]. In brief, the present finding of the CBD with Equol treatment, when the 6 “clock” genes were analyzed, suggested a potential benefit to skin health.
For the 15 pigmentation genes examined in this study (while CBD alone or Equol
alone demonstrated significant anti-pigementation results) the best outcome was
with the CBD with Equol treatment, where 10 out of the 15 biomarkers were
significantly altered (Table 2). As reviewed by Baswan et al. [6] in
2020, where CBD pigmentation treatments were evaluated (upon citation of a few
available studies) their conclusion was the complex CBD-melanocyte function
warranted further research to determine targeted pigmentation disorders using
cannabinoids. Conspicuously, Tanaka et al. [40] in 2021 reported from
in vitro studies that equol metabolites (quinones) were cytoxotic to
melanocytes. However, this notion is unlikely since large clinical studies where
topical equol treatment has been shown to improve skin spots/discoloration in (a)
women, (b) in a small pilot study in men (topical or oral) and (c) in high unit
topical commercial cometic products used by women (
Hydration plays a vital role in the preservation and repair of skin integrity. Dehydration disturbs cell metabolism and wound healing. Moreover, adequate fluid intake is necessary to support blood flow to wounded tissues and prevent breakdown of skin components such as the stratum corenum [42, 43]. The therapeutic potential of cannabinoids for integumentary wound healing [44] and the isoflavonoid, equol has estrogenic actions such as skin hydration, cellular/tissue repair and wound healing [23, 27] have been reported elsewhere. Again, CDB or Equol alone displayed skin biomarkers that were positive for hydration, tissue integrity and wound healing, but the greatest significant stimulation of gene expression was seen in the CBD with Equol treatment group (Table 3), that suggested skin health-promoting actions among the biomarkers examined. However, despite the wide-ranging benefits of CBD on dermal health, Perez et al. [45] in 2022 reported that cannabigerol (CBG), which is the direct precursor to CBD and tetrahydrocannabinol (THC) to have greater anti-inflammatory, antioxidant (protecting against UV light or photo-aging), anti-acne and skin barrier properties compared to CBD. In fact, in vehicle-controlled clinical studies, Perez et al. [45] showed that topical application of CBG was safe and may be more effective for its anti-aging properties than CBD. Therefore, further research is necessary to determine if the combination of CBG and Equol (or other polyphenols like resveratrol, querecetin, etc.) would provide better improvements in skin biomarkers in vitro and a technology platform for advanced skin technology in vivo for clinical/commercial use.
The present data sets suggest that CBD or Equol alone has beneficial effects on
the skin parameters tested, but the CBD with Equol treatment indicated greater
efficacy across the 9 dermal function categories analyzed among the 97 biomarkers
that were quantified. In ranking the treatments CBD
All applicable data and materials are included in the manuscript.
EDL designed the research study, analyzed the data, wrote the manuscript, contributed to editorial changes in the manuscript, and read and approved the final manuscript.
This study used human skin tissues from a commercial supplier and the studies were performed by a contact research organization (CRO), thus the requirement for BYU university IRB approval was waived # IRB 100122019, therefore this approval is not applicable.
Thanks are expressed to Janet Faye Lephart for her technical and editorial assistance in the preparation of this research report along with Anna Langerveld at Genemarkers for assistance in this study.
This research was funded, in part, by TTO/Life Science College grant number 19-2215 from Brigham Young University (BYU).
Edwin D. Lephart has no funding or sponsor conflicts of interest in the decision of the data/research presented in this report and regarding the publication of this manuscript. Edwin D. Lephart is an inventor on polyphenolic patents (US and worldwide) on various human health applications. Given the role as Guest Editor, Edwin D. Lephart had no involvement in the peer-review of this article and has no access to information regarding its peer-review. Full responsibility for the editorial process for this article was delegated to Graham Pawelec.
References
Publisher’s Note: IMR Press stays neutral with regard to jurisdictional claims in published maps and institutional affiliations.