


 , Bofeng Zhu 1,2,5,*
1 Guangzhou Key Laboratory of Forensic Multi-Omics for Precision Identification, School of Forensic Medicine, Southern Medical University, 510515 Guangzhou, Guangdong, China
2 Microbiome Medicine Center, Department of Laboratory Medicine, Zhujiang Hospital, Southern Medical University, 510280 Guangzhou, Guangdong, China
3 Belt and Road Research Center for Forensic Molecular Anthropology, Key Laboratory of Evidence Science of Gansu Province, Gansu University of Political Science and Law, 730070 Lanzhou, Gansu, China
4 Genetic Sciences Group, Thermo Fisher Scientific (China) Inc. Guangzhou Branch, 510005 Guangzhou, Guangdong, China
5 Key Laboratory of Shaanxi Province for Craniofacial Precision Medicine Research, College of Stomatology, Xi’an Jiaotong University, 710004 Xi’an, Shaanxi, China
Abstract
Background: The Tibetan group is one of the oldest Sino-Tibetan ethnic groups. The origin, migration as well as the genetic background of Tibetans have become the research hotspots in the field of forensic genetics. The use of ancestry informative markers (AIMs) allows the investigation of the genetic background of the Gannan Tibetan group. Methods: In this study, the 165 ancestry informative single nucleotide polymorphism (AI-SNP) loci included in the Precision ID Ancestry Panel were used to genotype 101 Gannan Tibetans using the Ion S5 XL system. The forensic statistical parameters of 165 AI-SNP in the Gannan Tibetan group were calculated. Population genetic analyses including Nei’s genetic distances, phylogenetic analyses, pairwise fixation index, principal component analyses and population ancestry composition analyses were also conducted to evaluate the genetic relationships between the Gannan Tibetan group and other reference populations. Results: Forensic parameters of the 165 AI-SNP loci indicated that not all of the SNPs showed high genetic polymorphisms in the Gannan Tibetan group. Population genetic analyses indicated that the Gannan Tibetan group had close genetic affinities with East Asian populations, especially with the groups residing in its neighboring geographical regions. Conclusions: The 165 AI-SNP loci in the Precision ID Ancestry Panel showed high ancestral prediction powers for different continental populations. When trying to predict the ancestral information of East Asian subpopulations using this panel, the prediction results are not particularly accurate. The 165 AI-SNP loci showed varying degrees of genetic polymorphisms in the Gannan Tibetan group, and the combined use of these loci could be an effective tool in the forensic individual identification and parentage testing of this group. The Gannan Tibetan group has close genetic affinities with East Asian populations compared with other reference populations, especially tighter genetic relationships with the groups residing in its neighboring geographical regions.
Keywords
- ancestry informative SNP
- forensic genetic analyses
- massively parallel sequencing
- Gannan Tibetan group
- precision ID ancestry panel
The Tibetan group, indigenous group of the Qinghai-Tibet Plateau, is one of the 56 ethnic groups with a long history in China. Chinese Tibetan group mainly settled in the Tibet Autonomous Region, Qinghai, Western Sichuan, Yunnan, and the Gansu provinces [1, 2]. According to the seventh national population census in 2020, the population of the Tibetans is more than seven millions [3]. The Tibetan language is a branch of the Tibeto-Burman family of the Sino-Tibetan language. Chinese Tibetan group could be divided into three main subgroups (U-Tsang, Khams and Amdo) in terms of their geographical and cultural differences [4]. The Gansu Tibetans, belonging to a branch of the Amdo Tibetans, mainly reside in Gannan Tibetan Autonomous Prefecture, which is located on the northeastern edge of the Qinghai-Tibet Plateau, and at the border of the Aba Tibetan Qiang Autonomous Prefecture of the Sichuan province [5]. In the past decade, many researchers devoted their efforts to uncovering the origin, migration, genetic admixture as well as high-altitude adaptation of the Tibetan group [1, 6, 7, 8]. However, these issues have been long-standing heated arguments because of limited genetic data of ancient and modern Tibetans.
In recent years, ancestry inference of unknown DNA donor found at the crime scene has become a new tool to help solve crime [9]. Ancestry informative marker (AIM) refers to a kind of genetic markers with significant frequency variations among different populations. With the technological developments of next generation sequencing (NGS) and the reduction of the sequencing cost, several biogeographical ancestry inference panels based on single nucleotide polymorphism (SNP), deletion-insertion polymorphism (DIP) and multi-allelic haplotype markers have been constructed [10, 11, 12]. Nowadays, ancestry information inference has wide applications not only in crime investigations, but also in the identifications of skeletal remains of missing persons, population substructure studies, population genetic investigations, and the disease susceptibility studies in different populations [13, 14, 15, 16].
With the exception of AI-SNP panels recently developed for East Asian subpopulation structure [17, 18, 19, 20, 21], few commercial kits are available in the forensic genetic field. ForenSeq™ DNA Signature Prep Kit and Precision ID Ancestry Panel are both commonly used in forensic DNA laboratory. According to related validation study, the 165 AI-SNP loci of the Precision ID Ancestry Panel can be used to discriminate the ancestal origins of major populations including Africa, Europe, Southwest Asia, South Asia, East Asia, Oceania and Americas [22]. Population genetic evaluations based on Precision ID Ancestry Panel indicated that this panel could also be used to analyze the genetic background of some subpopulations [23, 24]. In this study, we systematically evaluated the performance of the Precision ID Ancestry Panel in 101 Tibetan individuals from Gannan Tibetan Autonomous Prefecture of Chinese Gansu province. The present results provided the raw data on genetic variations at 165 SNP loci in Gannan Tibetan ethnic minority, the relevant forensic parameters for individual discrimination in this region and indicated the genetic relationships between Gannan Tibetan group and reference groups.
The present study has been approved by the ethics committee of Xi’an Jiaotong University Health Science Center and Southern Medical University (Ethical Approval Number: 2019-1039). This research was conducted in accordance with the ethical principle for medical research involving human subjects recommended by the World Medical Association Declaration of Helsinki. Sample collection and the following sequencing experiments were performed in strict compliance with the ethical regulations. Peripheral venous blood samples were collected from 101 unrelated volunteers who lived in the Gannan Tibetan Autonomous Prefecture in the Gansu province, China for at least three generations. The blood samples were dried on the FTA cards, and then stored at room temperature. Each volunteer signed an informed consent form before the sample collection.
For each sample, five pieces of 1.0 mm
The Precision ID DL8 Kit and the Precision ID Ancestry Panel (Thermo Fisher Scientific Inc, Waltham, MA, USA) were used to prepare DNA library on the automated Ion Chef™ system (Thermo Fisher Scientific Inc, Waltham, MA, USA). For each sample, 15 µL of DNA (1 ng in total) was pipetted into A1 to A8 wells of a Precision ID DL8 IonCode™ Barcode Adapters plate. And twenty-one cycles were used to amplify the target regions. The concentrations of sample libraries were measured by the Ion Library TaqMan® Quantitation Kit (Thermo Fisher Scientific Inc, Waltham, MA, USA) on the QuantStudio™ 5 real-time PCR system (Thermo Fisher Scientific Inc, Waltham, MA, USA) following the manufacturer’s instructions. Before template preparation, all DNA libraries were pooled in equimolar concentrations (33 pM).
Template preparation, enrichment of beads with template, and the sequence of template on beads were performed with the Ion Chef™ and Ion S5™ XL (Thermo Fisher Scientific Inc, Waltham, MA, USA) instruments according to the manufacturer’s instructions. After template preparation, high-throughput sequencing was preformed using four pieces of Ion™ 530 chips (Thermo Fisher Scientific Inc, Waltham, MA, USA). Thirty-two samples were loaded on each Ion™ 530 chip. Positive DNA 007 and deionized water were used as positive and negative controls in each run.
The analysis of primary sequence data was performed with the Torrent Suite Software (Thermo Fisher Scientific Inc, Waltham, MA, USA). All reads were aligned to hg19 reference sequences. Further sequence analyses were carried out using the HID-SNP Genotyper v4.2 plug-in and Converge™ Software (Thermo Fisher Scientific Inc, Waltham, MA, USA) with default analysis settings. Statistical analyses of read depths and balance ratios for the 165 AI-SNPs were calculated using the OriginPro 2021b software (version 9.8, OriginLab Corporation, Northampton, MA, USA).
DNA samples with an ‘A’ allele at locus rs7722456 were further confirmed by Sanger sequencing. Forward primer (5′-GCTGACTCTAGCCCTTTGGG-3′) and reverse primer (5′-GGTGGGTCTTGTTTGGCATT-3′) were synthesized and then used to amplify the locus rs7722456. The PCR products were separated by the method of agarose gel electrophoresis, and then purified using the DiaSpin DNA Gel Extraction kit (Sangon Biotech, Guangzhou, China) following manufacturer’s instructions. Sanger sequencing was conducted at rs7722456 locus by Sangon Biotech (Sangon Biotech, Guangzhou, China).
In the present study, 164 AI-SNP data sets of 26 populations were acquired from the 1000 Genomes Project Phase III database (locus rs10954737 was excluded from the population genetic studies as its genotype data were not available in the 1000 Genomes Project) [27]. The 165 AIM-SNP data sets for 22 populations were obtained from HGDP-CEPH database [28]. SNP genotype data for nine populations (Sichuan Tibetan, Qinghai Tibetan and Liangshan Yi [29], Hainan Han, Hainan Li and Gelao [23], Wuzhong Hui [30], Chinese Kazak [31], and Basque [32]) were obtained from previously published literature. Detailed information, such as population names and their abbreviations, population sizes of all reference populations, is listed in Supplementary Table 1.
The linkage disequilibrium (LD) test, allelic frequencies and forensic
statistical parameters of the 165 AI-SNP loci in the Gannan
Tibetan group were calculated using STRAF [33]. Tests of Hardy-Weinberg
equilibrium (HWE) for 165 AI-SNP loci in Gannan Tibetan group were performed by
the Arlequin software (version 3.5.1.2, Laurent Excoffier & Heidi Lischer,
Berne, Switzerland) [34] . The heatmap for the minimal allelic frequencies (MAF) of 164
AI- SNP loci was created using the R software (version 4.0.5, R
Foundation for Statistical Computing, Vienna, Austria). Pairwise fixation index
(F
In this study, all 165 AI-SNP genotypes in 101 Gannan Tibetan individuals and
positive control DNA were successfully generated using the Ion
S5™ XL system. Four Ion™ 530
chips generated a total of 1.5~1.87 gigabases (Gb). Ion sphere
particle (ISP) loading rate of each Ion™ 530 chip was more than
78%. As recommended by the manufacturer’s instructions, total reads should be
greater than 1 Gb; the ISP loading rate should be greater than 50%; and the
total usable reads should be greater than 30%. These sequencing metrics all met
the recommended values of the manufacturer’s instructions. Read depths of 165
AI-SNP loci in 101 Gannan Tibetan individuals are shown
in Supplementary Fig. 1. The minimum depth of coverage was
24
 Fig. 1.
Box plots of the balance ratios from forward direction of all SNP loci in 101 Gannan Tibetan individuals.
Sixty-three individuals (accounting for 62.4% of total tested Gannan Tibetan individuals) were genotyped ‘AT’ at rs7722456. Genotypes of rs7722456 at these samples were further confirmed by Sanger sequencing. Results of Sanger sequencing showed that the genotypes in these 63 individuals were ‘TT’ at rs7722456 (Supplementary Fig. 2).
Before the population genetic investigations, the HWE tests of the 165 AI-SNPs were carried out in the Gannan Tibetan group, and the results are shown in Supplementary Table 2. The rs1462906, rs1871534, rs2814778, rs3916235, rs4880436, rs4891825, rs6754311, rs7326934 and rs7722456 of 165 AI-SNPs were excluded from the HWE tests because of their homozygous genotypes. The results of HWE tests showed that no significant deviations from HWE for the remaining 156 AI-SNPs were observed in the Gannan Tibetan group after sequential Bonferroni corrections (p = 0.05/156 = 0.0003).
The LD tests for pairwise SNP loci were performed based on the genotype data,
and the p-values are shown in Supplementary Table 3. Similarly,
rs1462906, rs1871534, rs2814778, rs3916235, rs4880436, rs4891825, rs6754311,
rs7326934 and rs7722456 were also excluded from the LD tests because of their
homozygous genotypes. After sequential Bonferroni corrections (p =
0.05/24150 = 2.07
Among the 165 AI-SNPs, nine loci (rs1462906, rs1871534, rs2814778, rs3916235,
rs4880436, rs4891825, rs6754311, rs7326934 and rs7722456) were homozygous.
Forensic statistical parameters including expected heterozygosity (H
Admixture predictions and population likelihood analyses for 101 Gannan Tibetans were first conducted using the plugin in Torrent Suite, and all individuals were predicted as East Asian individuals. When trying to predict the ancestral information of East Asian subgroups using this panel, the prediction results are not particularly accurate (Supplementary Fig. 3). Genetic ancestry analyses for the Gannan Tibetan group were evaluated based on the 164 AI-SNP loci using both the ADMIXTURE (version 1.3, David H Alexander & John Novembre & Kenneth Lange, CA, USA) and STRUCTURE softwares (version 2.3.4, Pritchard & Stephens & Donnelly, UK), and the results are shown in Fig. 2. The Bayesian clustering analyses (K values are set to 2~6) and corresponding CV error values are shown in Fig. 2A,B, respectively. The smallest CV error value was found when K = 5 (Fig. 2B, CV error = 0.50892). Therefore, we adopted the K = 5 as the optimal K value, and all individuals were assigned to five different clusters, which could differentiate among African (a cyan-based ancestry cluster), American (a mixture of purple and green), South Asian (a brick-red-based ancestry cluster), East Asian (an orange-based ancestry cluster) and European populations (a purple-based ancestry cluster), as shown in Fig. 2A.
 Fig. 2.
Analyses of genetic ancestry for the Gannan Tibetan group (GNZ) on the basis of 164 AI-SNP loci. (A) Bayesian clustering analyses with predefined K values from 3 to 6. (B) Line chart of CV error values at K values from 2 to 8. (C) African, East Asian and European ancestral components in the Gannan Tibetan group.
The Bayesian structure analyses indicated that the Gannan Tibetan group shared similar genetic ancestry structure with East Asian populations when K values were set to 3~5. Cluster analysis also showed that the Gannan Tibetans clustered tightly with the East Asian individuals (Fig. 2C). At K = 6, subcluster with pink-based ancestry structure was identified in Tibeto-Burman groups such as the Gannan Tibetan group, the Sichuan Tibetan group and the Liangshan Yi group. The Gannan Tibetan group displayed a mixture of pink and orange ancestry structure, which were different from Han populations in flat land. The studied Gannan Tibetan group shared similar ancestry structure with groups residing in its adjacent areas, such as the Sichuan Tibetan group and the Liangshan Yi group.
To visualize the distributions of allele frequencies of 164 AI-SNPs (locus rs10954737 was excluded due to its unavailability in the 1000 Genomes Project) among the Gannan Tibetan group and reference populations, a heatmap was constructed, and the results are shown in Fig. 3. In the heatmap, the gray to green color scheme represented low to high allele frequencies of the 164 AI-SNP loci. Worldwide reference populations could be distinguished to four major clusters: (1) twelve populations from Europe clustered together into subbranch I; (2) most populations from Southern Asia gathered together and formed subbranch II; (3) most reference populations from China clustered together into subbranch III while Chinese Kazak group clustered between European and East Asian populations. At the same time, the studied Gannan Tibetan group clustered closely with Chinese groups, especially with the Sichuan Tibetan group; (4) eleven populations from Africa gathered into the subbranch IV. Meanwhile, the 164 AI-SNP loci could be divided into six subclusters (clusters A to F). SNP loci in clusters A and E displayed low allelic frequencies in the African populations, and these loci could distinguish the African populations from other continental reference populations; cluster D contained a set of SNP loci with low allelic frequencies in the East Asian populations and relatively large allelic frequencies in other continental reference populations; SNP loci in the subbranch F-1 showed higher allelic frequencies in African populations compared with other reference populations, and these loci could also distinguish the African populations from other continental reference populations.
 Fig. 3.
Heatmap showing the minor allelic frequency distributions of 164 AI-SNPs among Gannan Tibetan group and 56 reference populations. The gray to green color scheme represented low to high allele frequency distributions of the 164 AI-SNP loci.
A series of PCA plots were generated to illustrate the genetic relations and differentiations between the Gannan Tibetan group and other reference populations, and the PCA results are shown in Fig. 4. The PCA plots at individual scale are shown in Fig. 4A (x-axis: PC1; y-axis: PC2) and Fig. 4B (x-axis: PC2; y-axis: PC3), respectively. And PC1 could distinguish the African individuals from non-African individuals, while PC2 could distinguish the European individuals and most East Asian individuals from other continental reference individuals. From Fig. 4A,B, individuals from worldwide populations gathered into four major clusters: Africa, Europe, East Asia and South Asia, labeled in red, blue, green and magenta, respectively. The studied Gannan Tibetan individuals clustered closely with the East Asian individuals, especially with the Chinese groups. A 3D-PCA plot was also generated using an online tool based on the PC1, PC2 and PC3, and the result is shown in Fig. 4C. The top three principal components could explain 44.19% total variance. Individuals from Africa, Europe, Oceania, South Asia, East Asia, Middle East and Americas were clustered together according to their geographical origins. Gannan Tibetan individuals clustered closely with East Asian individuals. A PCA plot at population scale was also generated (Fig. 4D). PC1 and PC2 could explain 77.2% total variance, and the studied Gannan Tibetan group was located closely with East Asian populations.
 Fig. 4.
Principal component analyses at different population scales. (A) PCA plot for 57 reference populations at individual scale based on PC1 and PC2. (B) PCA plot for 57 reference populations at individual scale based on PC2 and PC3. (C) A 3D-PCA plot was generated using an online tool based on the PC1, PC2 and PC3 to investigate the genetic relationships between Gannan Tibetan group and continental reference populations. (D) A PCA plot at population scale was generated based on PC1 and PC2.
Phylogenetic analyses were conducted using the NJ and ML
methods to investigate the genetic relations between the Gannan Tibetan group and
the reference populations, and the results are shown in Fig. 5. A NJ tree was
constructed based on the pairwise D
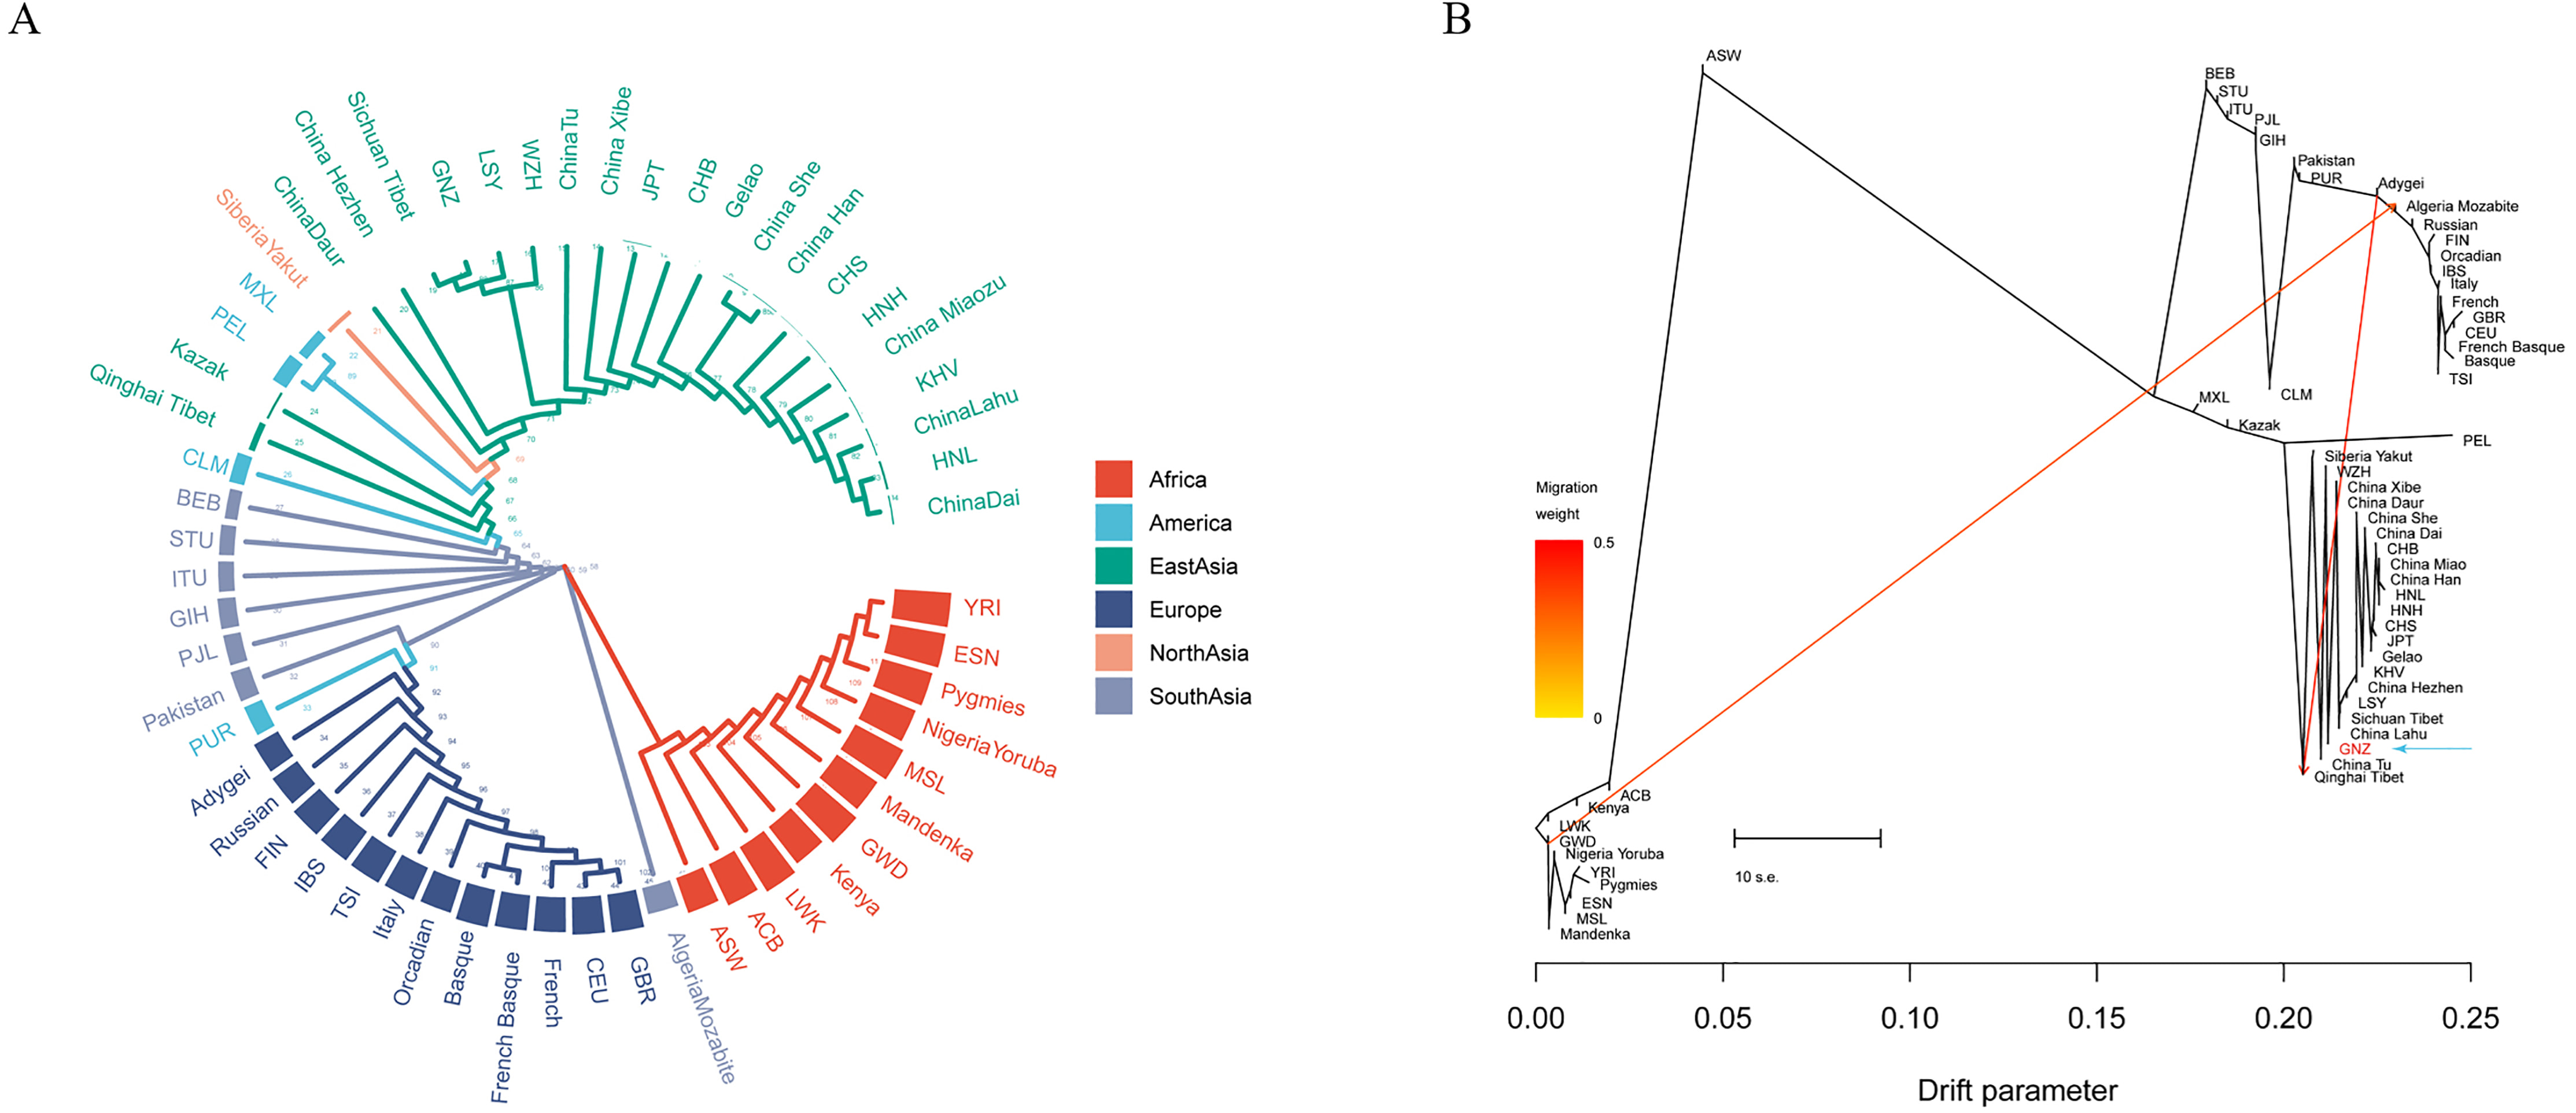 Fig. 5.
Phylogenetic analyses were conducted using neighbor-joining (NJ)
and maximum likelihood (ML) methods to investigate the genetic relations between
the Gannan Tibetan group and the 56 reference populations. (A) A NJ tree was
constructed based on the pairwise D
We also calculated the pairwise F
The read depths, strand balance, noise and other NGS quality control are
important to evaluate the accuracy of NGS genotyping. Therefore, we first
evaluated the sequencing metrics before the population genetic analyses.
According to “Forensic sciences - Specifications for second generation
sequencing-based DNA examination” (GA/T 1693-2020), sequencing depth of SNP loci
should be larger than 100
When we uploaded the genotype data to an online tool—Snipper
(http://mathgene.usc.es/snipper/), the website reminded us to check the “A”
allele at rs7722456 locus in the present study because only C and T alleles were
observed at rs7722456 locus in their database. And then we searched the
population genotype data of this SNP locus on 1000 Genomes Project Phase III, and
also found that only C and T alleles were observed at rs7722456 locus. In the
present study, allele ‘A’ at rs7722456 (chr 5:170775980) was found in 63 Gannan
Tibetan individuals, and reads for the ‘A’ allele accounted for approximate 20%
of the total reads. After sequencing the chr5:170775853 -170776519 region, we
found that a poly-A region [5
Among the 165 AI-SNPs tested in this study, only one pair of rs1229984 and
rs3811801 loci showed linkage disequilibrium, which was mainly caused by the
inheritance of a haplotype encompassing these two SNP loci. Loci rs1229984 (chr
4:99318162, coding for the Arg48His substitution) and rs3811801 (chr 4:99323162)
belong to the core haplotype of alcohol dehydrogenase family 1B gene
(ADH1B), which was associated with the catalytic activity of the enzyme
alcohol dehydrogenase [4]. Forensic parameters of the 165 AI-SNPs indicated that
not all of the SNP loci showed high genetic polymorphisms in the Gannan Tibetan
group. The cumulative random match probability of the 164 AI-SNPs was determined
to be 7.269
The origin, migration and genetic background of Tibetan group have become the research hotspots in the field of population genetics, molecular anthropology, archaeology and linguistics [8, 47, 48, 49]. In this study, we investigated the genetic ancestry structure of the Gannan Tibetan group on the basis of a set of AI-SNP loci. Results of Bayesian structure analyses indicated that the ancestral structure of the Gannan Tibetan group was dominated by the East Asian component, and the Gannan Tibetan group shared similar genetic ancestry structure with the Sichuan Tibetan group and the Liangshan Yi group.
To further analyze the genetic relationships among Gannan Tibetan group and reference populations, allelic frequency distributions, PCA, genetic distances and phylogenetic analyses were also conducted based on the shared AI-SNPs in the studied Gannan Tibetan group and continental reference populations. These analyses confirmed that the AI-SNP loci included in the Precision ID Ancestry Panel could be a valuable tool for the ancestral predictions of African, European, South Asian and East Asian populations. When trying to predict the ancestral information of East Asian subpopulations using this panel, the prediction results are not particularly accurate. An extended set of SNPs would be required to distinguish within East Asian subpopulations.
Results of genetic affinity analyses indicated that the Gannan Tibetan group had closer genetic affinities with East Asian populations, especially tighter genetic ties with those groups residing in its neighboring geographical regions like the Sichuan Tibetan group and the Liangshan Yi group. Many researchers estimated that the Sino-Tibetan groups shared a common ancestor who originated from the upper and middle reaches of Yellow River. With the spread of agriculture, ancient Han Chinese and Tibetan group derived from the shared ancestors about 5900 years ago [49, 50, 51]. Linguistic study and archaeological evidence also inferred that Tibeto-Burman populations consecutively migrated southward to be dispersed along the Tibetan-Yi ethnic corridor into the western Sichuan and western Yunnan provinces [49, 52]. Population genetic evidences also demonstrated that the studied Gannan Tibetan group had closer genetic relationships with East Asian populations, which might be due to the extensive gene exchanges among Tibetan, Han Chinese and other groups residing around the Tibetan Plateau [2, 29, 47]. Besides, the plateau geographical environment also shaped the unique genetic characteristics of the Tibetan group. Frequencies of SNP haplotypes associated with high-altitude hypoxia adaptation were higher than those in populations residing in the plain region [53, 54, 55]. Therefore, these SNP loci mentioned above might be regarded as AIM-SNP markers to distinguish the Tibetan group and Han populations. Population genetic studies based on Y-SNP haplogroups showed that the Tibetan group was dominated by D-M174 haplogroup, followed by O-M175 haplogroup, which had relative high frequencies in Han population. The mtDNA haplogroups (M9a’b, G, D and F) of East Asian origin had high frequencies in the Tibetan group, which also indicated the close genetic relationships among the Tibetan group and East Asian populations [56]. In the future, more types of genetic markers will be used for population genetic analysis, which will allow us to have a deeper understanding of the population genetic sub-structures of the Tibetan groups in Chinese different regions.
In this study, the NGS performance and forensic statistical parameters of the 165 AI-SNP loci in the Gannan Tibetan group were evaluated. The 165 AI-SNP loci showed the varying degrees of genetic polymorphisms in the Gannan Tibetan group, and the combined use of these loci could be an effective tool in the forensic individual identification and parentage testing of the Gannan Tibetan group. The ancestral information component of the Gannan Tibetan group was dominated by the East Asian component. Population genetic analyses indicated that the Gannan Tibetan group had close genetic affinities with East Asian populations compared with other intercontinental reference populations, especially tighter genetic relationships with the groups residing in its neighboring geographical regions.
AIM, ancestry informative marker; CPD, combined power of discrimination; CPE,
combined probability of exclusion; D
The raw genotype data used and analyzed during the current study are available from the corresponding author on reasonable request.
BZ designed this research and were responsible for all the processes of this research. WC and MC conducted the experiment and analyzed the raw data. WC wrote this manuscript. HY collected the samples. QY and LC provided technical support for the experiments. LC, LL and XB assisted the experiment. BZ, MC, LL, LC and XB revised this manuscript. All authors have read and agreed to submit the manuscript.
This study has been approved by the ethics committee of Xi’an Jiaotong University Health Science Center and Southern Medical University (Ethical Approval Number: 2019-1039). This research was conducted in accordance with the ethical principle for medical research involving human subjects recommended by the World Medical Association Declaration of Helsinki. Sample collections and sequencing experiments presented herein were performed in strict compliance with the ethical regulation. Every volunteer signed a written informed consent before sample collection.
We are grateful to all of the volunteers for their kind donations of samples.
This research was funded by the National Natural Science Foundation of China (NSFC), grant numbers 81930055 and 31760309.
Qing Yang is the employee of the Thermo Fisher Scientific (China) Inc. Other authors declare no conflict of interest.
References
Publisher’s Note: IMR Press stays neutral with regard to jurisdictional claims in published maps and institutional affiliations.