1. Introduction
Lamins are architectural protein components of the cell nucleus. Because of
their ability to polymerize, they form molecular networks that anchor nuclear
embedded proteins and peripheral chromatin components within the nuclear
envelope, which confers mechanical stability, and thus have been implicated in
the role of maintaining the structural integrity and overall mechanical stability
of the nucleus [1]. Lamins participate in diverse nuclear cell functions
including maintenance of the genome in a specific structural organization [2, 3, 4, 5].
Lamins have also been shown to play a pivotal role in DNA repair, replication,
and transcription, and thus affect cellular differentiation, apoptosis, and cell
aging. Furthermore, lamins are classified as type V intermediate filament
proteins, which can be categorized according to their sequence and structural
organization as either A-type or B-type lamins [5]. The A-type lamins have 2
major isoforms (lamin A and lamin C) and three minor isoforms (lamin
A10, lamin A50 [Progerin] and lamin C2), while the B-type
lamins have two major isoforms (lamins B1 and B2). A-type lamins are expressed
mostly in somatic cells, whereas B-type lamins are usually ubiquitously expressed
and interact in the nuclear lamina’s assembly process [5].
Lamin A, Lamin C, along with Progerin (Lamin A50), Lamin
A10, and Lamin C2 (specific to the testis) are all derived from a
single gene (Lamin A/C) by alternative splicing of one transcript of the
gene, which contains exons 1 through 12 [2, 3, 6]. Consideration of Lamins as
individual disease causing elements within the cell and nuclear lamina requires a
deeper understanding of the Lamina network. The first 566 amino acids of human
Lamin A/C, spanning exons 1–10, are identical in lamin A and lamin C. However,
lamin C has six unique carboxyl-terminal amino acids [7]. Both Lamins A and C
have been given the role of establishing nuclear mechano-transduction and
stiffness, however, it has been found that Lamin C correlates more with
mechanical properties than Lamin A. Unlike Lamin A, which has a prelamin that
undergoes tail domain cleavage modification once it is inside the nucleus, Lamin
C is the only Lamin that does not undergo post-transitional modifications with a
farnesylated tail domain. Consequently, its expression is unaffected by certain
mutations that occur in genes affecting farnesylation, which is a feature of
Lamin A-specific disease [8].
Lamin A/C mutations has been associated with more than 300 diseases
that vary in phenotype and penetrance, called laminopathies. Depending on the
mutation involved, laminopathies affect different tissues in the body such as
muscles, cardiomyocytes, adipocytes, and neurons. They have also been associated
with known diseases such as Emery-Dreifuss muscular dystrophy and
Hutchinson-Gilford progeria syndrome (HGPS) [9]. HGPS results from a single
nucleotide substitution in exon 11 of Lamin A/C gene resulting in the
usage of an alternative splice donor site in exon 11, with subsequent Progerin
production which is missing 150 nucleotides (50AA). The most prevalent mutation
is a change of bases C and T in exon 11, which leads to a splicing defect, thus
activating the exonic cryptic donor splice site [10]. The expression of Progerin
weakens the nuclear lamina, which results in misshapen nuclei, and adversely
altering mitosis and cell proliferation. The accumulated Progerin eventually
causes nuclear blebbing, DNA damage, and rapid telomere shortening with
subsequent p53-dependent premature senescence [10, 11]. Therefore, HGPS patients,
who have abnormal Progerin levels, suffer premature aging and death nearly at age
of 13 due to heart attack or stroke [11]. Aside from the laminopathies mentioned
above, there has been an on-going investigation of the relationship between
changes of the expression of some lamins that result in diverse types of cancer.
Cancer cells are often characterized as highly proliferative with unregulated
signaling. Thus, lamins are thought to be responsible for the structural
alteration in cells undergoing malignant transformation, since they are
responsible for partial cell functions regulation [2, 9, 12]. In tumor cells,
improper expression of lamins and its interaction with other proteins are evident
[12, 13, 14]. Lamin A10 is another product of Lamin A/C alternative
splicing, missing exon 10 (90 nucleotides). Upregulation of lamin A10
which is found in relatively high amounts in lung cancer cell lines, resulted in
distorted nuclear phenotypes [6]. MCF7 is a “Luminal A” subtype of noninvasive
breast cancer derived cell line and was chosen in this in vitro study
because MCF7 cells maintain characteristics similar to mammary epithelium. In
addition, MCF7 has been utilized in several in vitro studies for the
development of chemotherapeutic drugs and understanding drug resistance as it is
highly responsive to chemotherapy [15].
The lack of consensus on lamin A/C effects in cancer is caused by
several factors including heterogenous expression of lamin A/C
transcript variants in tumors which may play various roles in cancer development
and progression [12] and thus resulting in the activation/inhibition of various
cellular signaling pathways. This study, investigated the critical cellular
signaling pathways in breast cancer MCF7 cell line transfected with one of the
four lamin A/C transcript variants (Lamin A, Lamin C, Lamin
A10, and Lamin A50) and their possible contribution to the
heterogeneity and metastatic aspects of breast cancer.
2. Materials and Methods
2.1 MCF7 Cell Line Maintenance and Transfection
Authenticated MCF7 human breast cancer cell line was purchased from ATCC
(ATCC® HTB-22), American Type Culture Collection, Manassas, VA,
USA) and cultured in Eagle Minimum Essential Medium (MEM) supplemented with
various components, including L-glutamine (2 mM), sodium bicarbonate (1.5 g/L),
1X Non-Essential Amino Acids (NEAA), 1X Penicillin/Streptomycin (Invitrogen Inc.,
Carlsbad, CA, USA), sodium pyruvate (1.0 mM), and 10% fetal bovine serum (FBS)
(Invitrogen Inc., Carlsbad, CA, USA). MCF7/ADR was a generous gift from Dr
Abdelhadi Rebaa (Department of Pediatrics, Children’s Memorial Research Center,
Northwestern University). MCF-7/ADR cells have been widely used as a
multidrug-resistant breast cancer cell. However, the real origin of MCF-7/ADR
cells remains unclear and the MCF-7/ADR were re-designated as NCI/ADR-RES as DNA
fingerprinting analysis showed NCI/ADR-RES to be unrelated to MCF-7 and
NCI/ADR-RES are found to be derived from OVCAR-8 human ovarian carcinoma cells
[16, 17].
All cells were grown in a humidified atmosphere of 95% air and 5% CO at
37 °C. For transfection, MCF7 cells were transfected with different
GFP-tagged lamin A/C transcript variants using Lipofectamine™ 2000
Transfection Reagent (Cat. No. 11668027, ThermoFisher Scientific, Waltham, MA,
USA). The GFP-tagged lamin A50 was obtained from Addgene.org (Plasmid
#17653), while the C-terminal GFP-tagged lamin A, lamin C, and lamin
A10 were purchased from OriGene (Rockville, MD, USA). The transfection
efficiency of MCF7 cells was determined to be 80%, and stably transfected MCF7
cells were selected with G418 antibiotic (Cat. No. A1720-100MG, Invitrogen Inc.)
for 14 days to establish stable cell lines expressing the transfected genes. To
inhibit lamin A/C transcript variants, pSilencer 4.1-CMV neo vector (Ambion,
Inc., Austin, TX) was used for siRNA-mediated knockdown. The vector contained
hairpin siRNA templates targeting exon 1 (5-GCAAAGTGCGTGAGGAGTT-3) or
exon 10 (5-ATGAGGATGGAGATGACCT-3) of lamin A/C to inhibit the
expression of all lamin A/C transcript variants or all except lamin
A10, respectively. A control vector expressing a hairpin siRNA with
limited homology to any known human sequences was also used as a control in the
experiments. Cells were routinely tested for mycoplasma by PCR and G418 sulfate
is toxic to bacteria and yeast.
2.2 mRNA Quantification of Lamin A/C Transcript Variants by RT-qPCR
Total RNA was isolated from the samples using the Ambion Aqueous kit. The
quantity and quality of the isolated RNA were assessed using the Bio-Rad Experion
automated electrophoresis system (Hercules, CA, USA). For cDNA synthesis, 1
µg of total RNA was reverse transcribed using SuperScript III First-Strand
Synthesis kit (Clontech Mountain View, CA, USA). PCR amplification was performed
using Cepheid Smart Cycler (Sunnyvale, CA, USA). PCR mixture was prepared and run
according to previously described method [14]. The amplification of lamin A/C
transcript variants was performed using specific primer sequences listed in Table 1. The PCR protocol consisted of an initial activation cycle at 95 °C
for 2 minutes, followed by 40 cycles of denaturation at 95 °C for 15
seconds, and annealing/extension at specific temperatures for each transcript
variant (lamin A: 58 °C, lamin A50: 60 °C, lamin
A10: 66 °C, lamin C: 60 °C) for 2 minutes. All PCR
results were normalized to the expression of Cyclophilin A (CypA).
Table 1.RT-qPCR Primer sequences used.
| Primer |
Sense (5′3′) |
Anti Sense (5′3′) |
Probe (5′3′) |
Accession Number |
| Total Lamin A/C |
TGAGCAAAGTGCGTGAGGAG |
GCTGCGAGGTAGGGCTGG |
CGCTGAGTACAACCT |
NM_170707.3 |
| Lamin C |
GTGGAAGGCACAGAACACCT |
GCGGCGGCTACCACTCAC |
AGATGACCTGCTCCATCACC |
NM_005572.3 |
| Lamin AΔ10 |
AACTCCACTGGGGAAGGCTCC |
GCTCCTGAGCCGCTGGCAGA |
AGTACAACCTGCGCTCGCGC |
NM_170708.3 |
| Lamin AΔ50 |
ACTGCAGCAGCTCGGGG |
TCTGGGGGCTCTGGGC |
AGCATCATGTAATCTGGGACCT |
NM_001282626.1 |
| Cyclophilin A (CyPA) |
CCCACCGTGTTCTTCGACAT |
TTTCTGCTGTCTTTGGGACCTT |
ACAGCTCAAAGGAGACGCGGCCCA |
NM_021130.5 |
2.3 Fluorescence Confocal Microscopy
Transfected MCF7 cells were grown on plastic cover slips (18 22 mm)
until they are 60–70% confluent. The cells were formalin (3.7%) fixed for 10
minutes at room temperature. Following fixation, the cover slips were then washed
three times with PBS. Leica SP5SM confocal microscope was used for the
morphometric evaluation of the nuclear localization distribution of lamin
transcript variants.
2.4 Cell Proliferation Assay
Stably transfected MCF7/ADR cells with lamins siRNA targeting different exons of
lamin A (exon 1 or exon 10) were incubated with Doxorubicin (Cat. NO. 324380,
MilliporeSigma, Darmstadt, Germany) for 48 hours in 96-well plate.
MTT (3-[4,5-dimethylthiazol-2-yl]-2,5 diphenyl tetrazolium bromide) cell
proliferation assay (abcam, Shanghai, China) was used to quantitatively estimate
percentage of viable cells according to the manufacturer’s protocol.
2.5 Senescence Analysis
Cellular senescence of stably transfected MCF7/ADR cells with lamins siRNA
targeting different exons of lamin A (exon 1 or exon 10) was compared by
histochemical staining of
Senescence-associated beta-galactosidase (SA--gal) activity. Cultured
cells were trypsinized, counted, and plated at the same cell numbers and
incubated for 48 hours at 37 °C in the presence and absence of
doxorubicin at different concentrations. Cells were gently rinsed once with
phosphate buffered saline (PBS, pH 7.4) and then fixed (0.2% gluteraldehyde and
2% formaldehyde) at room temperature for 15 minutes followed by three washes in
PBS. -Gal Staining kit (Roche, Indianapolis, IN, USA) was used for cellular
senescence determination according to the manufacturer’s instructions. Cells were
viewed using phase-contrast microscope (Axio Vert.A1 Zeiss, Jena, Germany).
Images of SA--gal positive staining areas were evaluated by ImageJ
(version 1.53) software (Bethesda, MD, USA. Department of Health and Human
Services, National Institutes of Health).
2.6 Ion Torrent Analysis
2.6.1 RNA Extraction and Quality Control
Nanodrop ND-1000 UV-Vis Spectrophotometer (Thermo Fisher Scientific, Inc., Waltham, MA, USA) was
utilized initially to examine the quantity and the quality of the extracted total
RNA as described in section 2.2. Samples with high purity (260 nm/280 nm
2) were selected for RNA-Seq. RNA Nano 6000 chips and Agilent 2100
Bioanalyzer (Agilent Technologies, Inc., Santa Clara, CA, USA) were used to check
the integrity and quantity of RNA (RNA samples with RNA Integrity Number (RIN)
8 were used). Poly(A) messenger RNA was isolated using RiboMinusTM
Eukaryote System v2 (Thermo Fisher Scientific, Inc.) followed by
RiboMinus™˝️ Magnetic Bead Cleanup Module (Thermo Fisher
Scientific, Inc.). Qubit™˝️ RNA HS Assay kit (Cat. No. Q32855,
Thermo Fisher Scientific, Inc.) was used to quantify the isolated mRNA.
2.6.2 Library Construction for Next-Generation Sequencing (NGS)
NGS library was constructed using Ion Total RNA-Seq Kit v2 (Cat. No. A27752,
Thermo Fisher Scientific, Inc.), Ion Total RNA-Seq Primer Set v2 (Cat. No.
A27896, Thermo Fisher Scientific, Inc.), and Ion Express™˝️ RNA-Seq
Barcode 01-16 Kit (Cat. No. 4471252, Thermo Fisher Scientific, Inc.). The
qualified library was sequenced by injecting onto the Ion PI™˝️
Hi-Q™˝️ Chip Kit v3 (Cat. No. A26769, Thermo Fisher Scientific,
Inc.) and insertion into the Ion Chef™˝️ Instrument (Thermo Fisher
Scientific, Inc.) to emulsify and enrich the library. Samples were sequenced by
the use of Ion Proton Semiconductor Sequencer (Thermo Fisher Scientific, Inc.).
2.6.3 Data Analysis
Data extraction was performed using Agilent Feature Extraction Software, version
11.0.1.1 (Agilent Technologies, Inc. Santa Clara, CA, USA), from the raw data.
The extracted data were then loaded into the GeneSpring GX software, version 12.1
(Agilent Technologies, Inc.), both products of Agilent Technologies, Inc. The
loaded data were log2 transformed and normalized using the percentile shift
algorithm, with the percentile target set at 75. Differentially expressed genes
were identified by comparing the gene expression levels in MCF7 cells transfected
with one of the lamin A/C transcript variants to those in mock transfected MCF7
cells. Genes with a fold change (FC) of 2.5 or above, and with a p-value
0.05 were considered as differentially expressed genes. This approach
allowed for the identification of genes that showed significant changes in
expression levels following upregulation of lamin A/C transcript variants
compared to mock transfected cells, with a focus on genes with a fold change of
2.5 or higher and statistically significant p-values. SigmaStat software
(Version 3., Systat Software Inc., Westminster, CA, USA) was utilized to perform
a comparison of expression levels using an unpaired t-test with statistical
significance set at p-value 0.05.
2.6.4 Ingenuity Pathway Analysis (IPA)
The association of critical pathways, networks, molecular and cellular functions
with differentially expressed genes was analyzed using IPA Core analysis suite
(Qiagen Biosciences Inc., Hamburg, Germany). IPA core analysis with a cut-off
–log(p-value) 3 was used and the significance of IPA core analysis
was measured by a Fischer’s exact test or Z-score to provide predictions
(activation/inactivation/no effect).
3. Results
3.1 Upregulation of Lamin A/C Transcript Variants following MCF7
Transfection
Expression analysis of total lamin A/C transcript variants was detected by
measuring forward and reverse primers located in exons 1 and 7 respectively
following MCF7 transfection with C-terminal GFP-tagged lamin A (Fig. 1A).
Specific primers for lamin C, lamin A10 and lamin A50
transcript variants were used to assess mRNA expression following C-terminal
GFP-tagged lamin C or lamin A10 or N-terminal GFP-tagged lamin
A50 (Fig. 1B). Results indicate that mRNA expression in MCF7 is
increased following transfection.
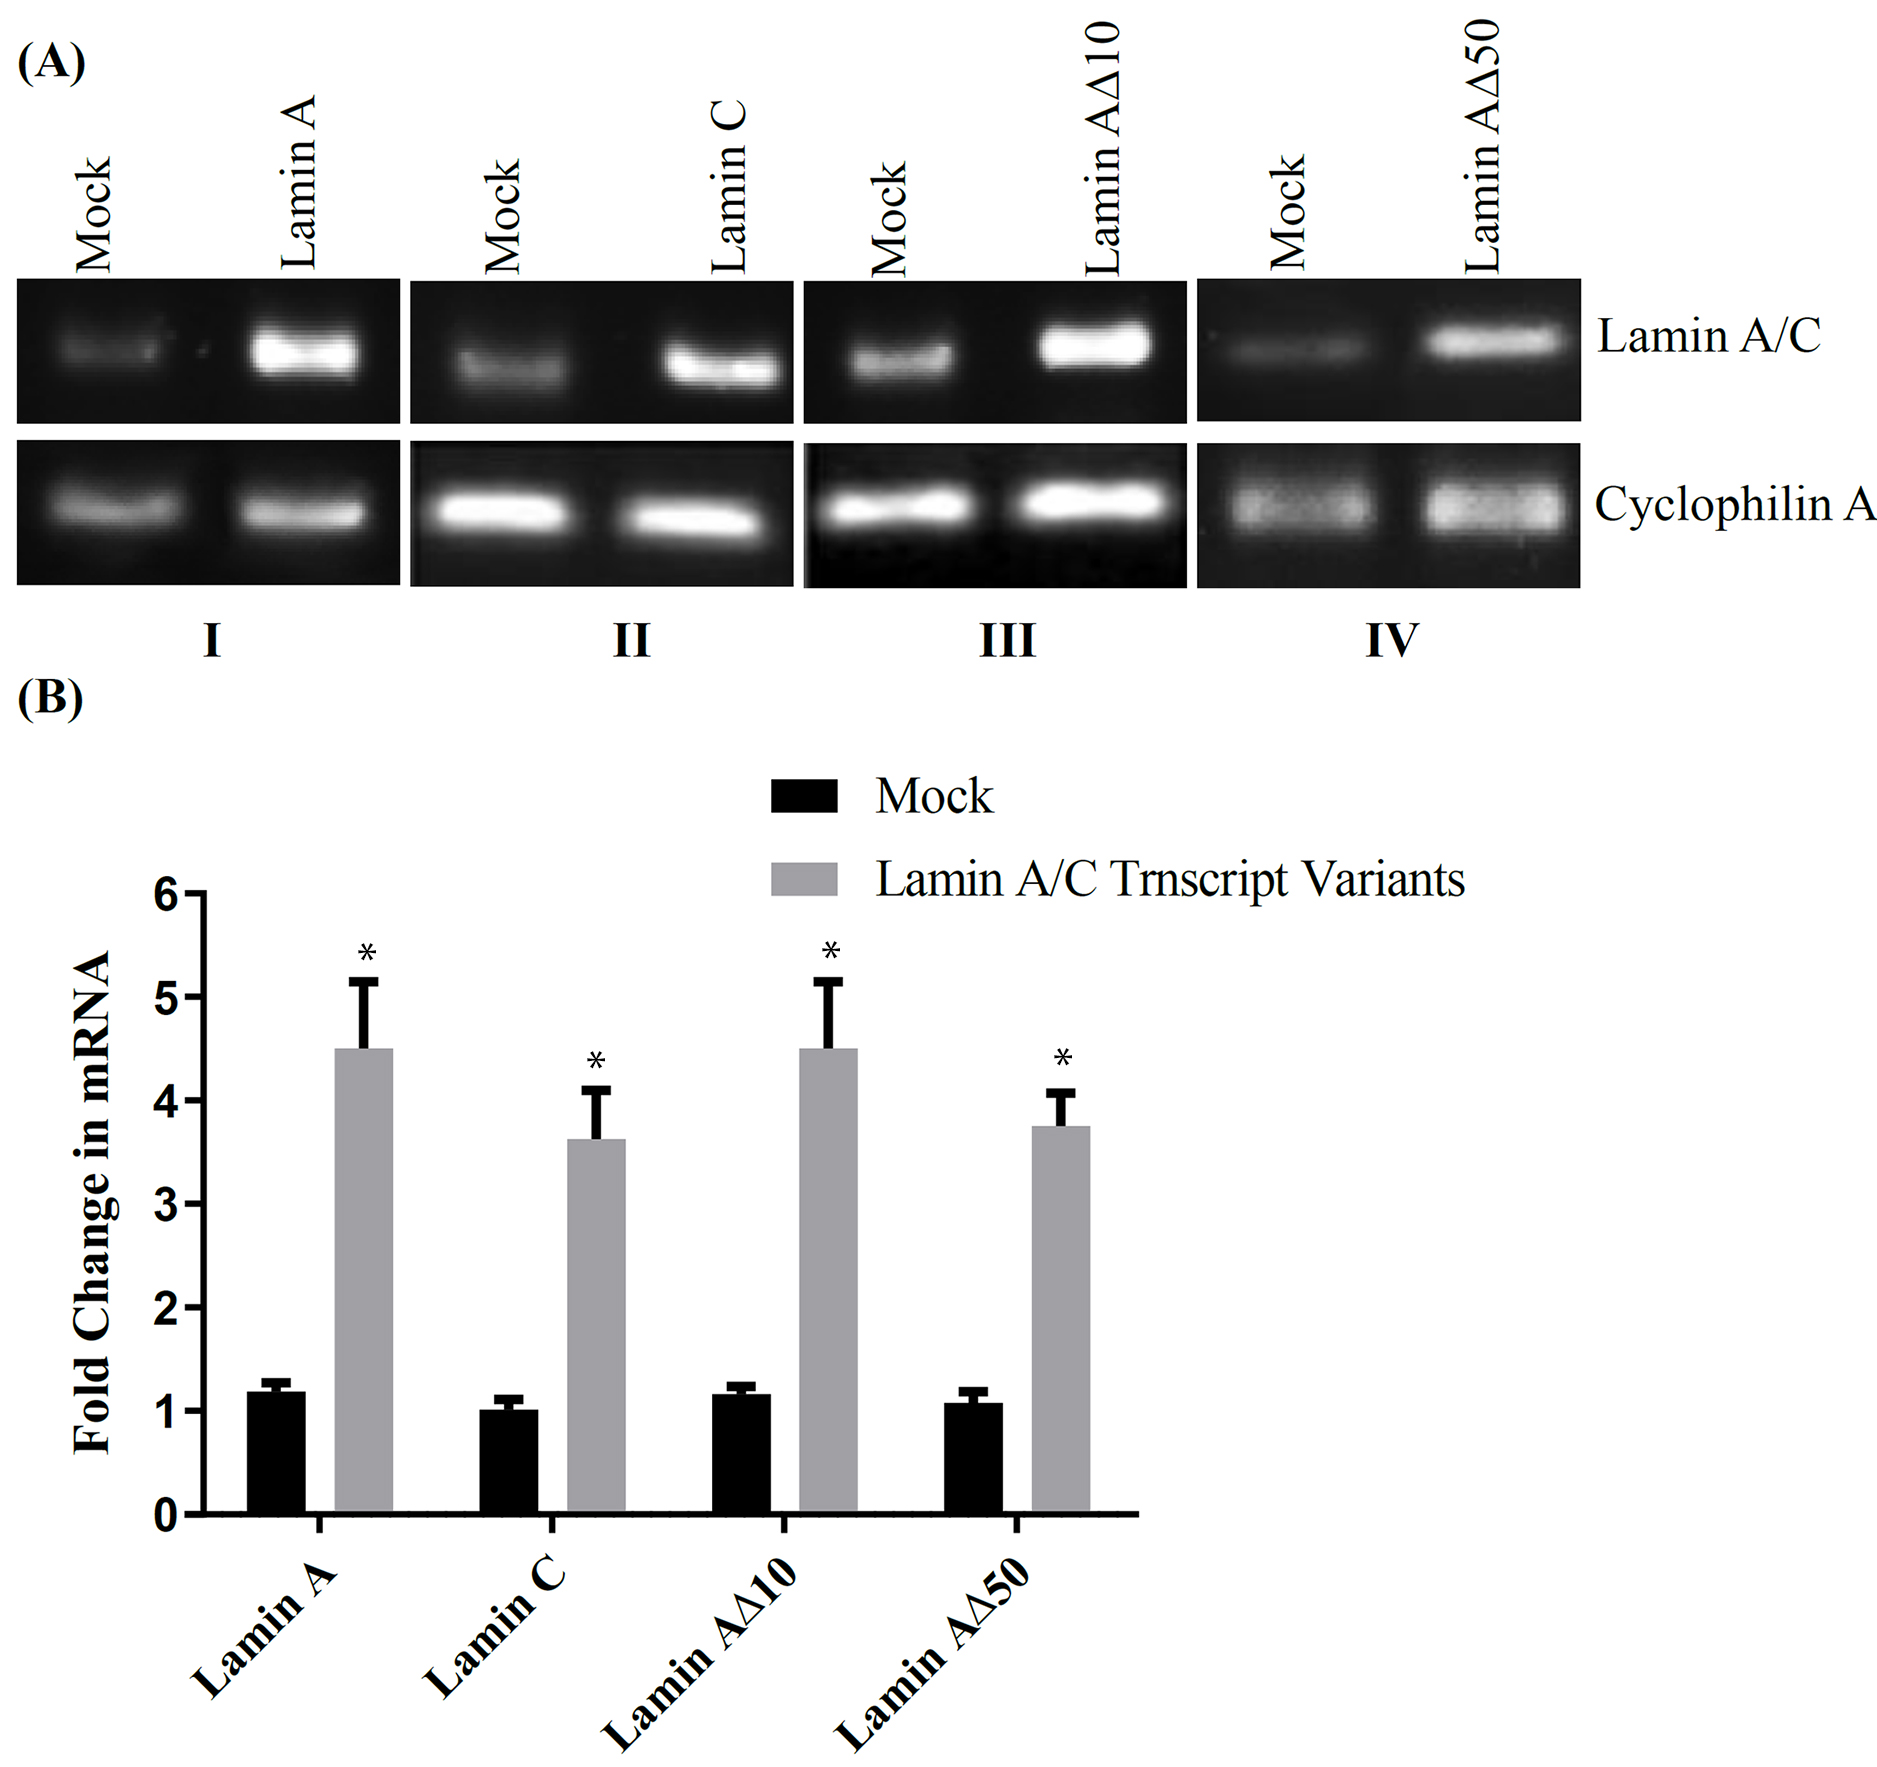 Fig. 1.
mRNA Expression and Normalized Fold Change following Upregulation of Lamin A/C Transcript Variants in MCF7 Cell Line. (A) Upregulation of Lamin A/C transcript variants in MCF7 cell
line: (I) Total lamin (873 bp); (II) Lamin C (178 bp); (III) Lamin A10
(131 bp) and (IV) Lamin A50 (123 bp) following MCF7 transfection.
Cyclophilin A (94 bp) was used as a house keeping gene for gel loading
normalization. (B) Cyclophilin A normalized fold change (FC) in mRNA expression
following transfection of MCF7 with one of the four lamin A/C transcript
variants. Results are presented as mean SE; *: p 0.001 when
compared to Mock transfected MCF7; n = 3, unpaired t-test.
3.2 Cellular Distribution of Lamin A/C Transcript Variant Proteins
by Confocal Microscopy
MCF7 cell line transfected with pCMV6-AC-GFP expressing chimeric lamin
A-GFP-tagged or lamin C-GFP tagged proteins fluorescence showed diffused
fluorescent patterns and a perinuclear localization and incorporation into the
lamina (Fig. 2A,B,D). Data with C-terminal GFP-tagged lamin A10
revealed that lamin A10 is present in the nucleus as aggregates and the
formation of prominent nuclear speckles opposite to lamin A, lamin C and lamin
A50 (Fig. 2C). No speckles were observed in the cytoplasm. This is
consistent with the previous report by Machiels et al. [6]. On other
hand, N-terminal GFP-tagged lamin A50 in MCF7 cells significantly
induced nuclear shape abnormalities as fluorescence showed a perinuclear
localization and incorporation into the lamina with disfigurement of the nucleus,
characterized by a lobular shape (Fig. 2D).
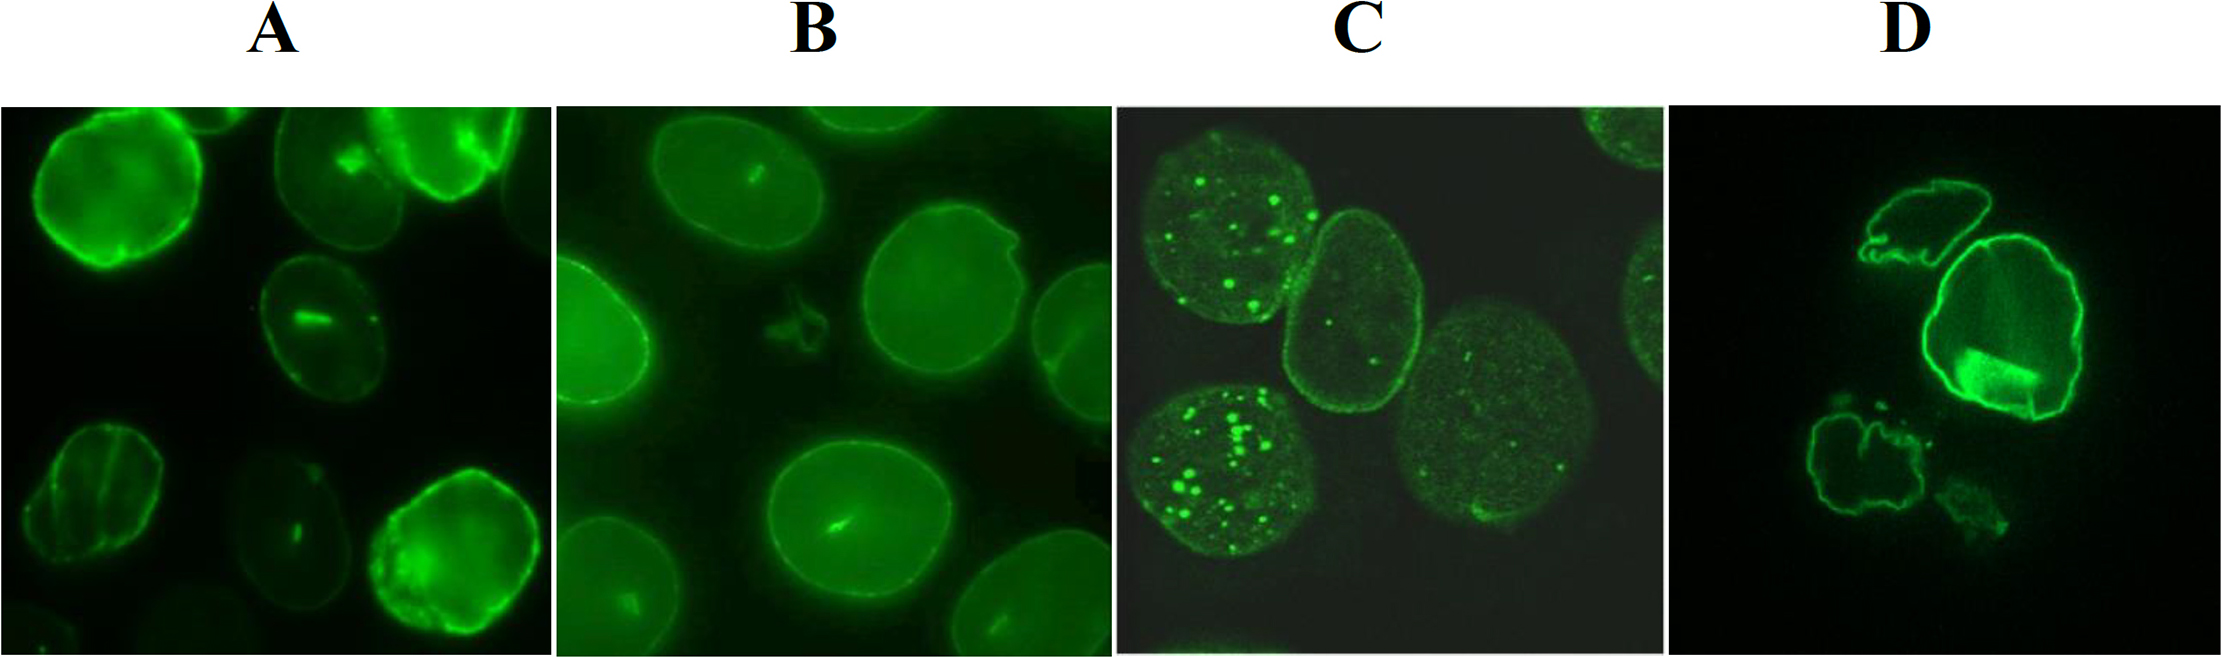 Fig. 2.
Confocal microscopy of fixed cultured MCF7 cell line following
lamin A/C transcript variants cDNA transfection. Images show the cellular
localization of lamin A/C gene transcript variant proteins distributions
of (A) lamin A-GFP; (B) lamin C-GFP; (C) lamin A10-GFP; and (D) lamin
A50-GFP at magnification 100.
3.3 Activation/Inactivation of Pathways and Upstream Regulators by
Lamin A/C Transcript Variants
The 4856 genes that were differentially expressed with lamin A upregulation,
4535 with lamin C, 4877 with lamin A10, and 4562 with lamin
A50 genes were analyzed using Ingenuity Pathways Analysis (IPA). DEGs
affected by modification of lamin A/C transcript variant were found significantly
associated with 71 canonical pathways (Fig. 3 and Supplementary Table
1). A comparison analysis was performed to determine the top canonical pathways
associated with significant DEGs in lamin A/C transcript variants. The top
pathways associated with DEGs that was concordant with both lamin A and lamin
A50 upregulation were EIF2 signaling, regulation of elF4 and p7056K
signaling, and mTOR signaling (Fig. 3 and Supplementary Table 1). Lamin
A and lamin A50 upregulation resulted in pathway patterns that are
similar. On the other hand, the top pathways associated with mRNA expression
patterns that were concordant with both lamin C and lamin A10
upregulation were almost similar and opposite to the activated/inactivated
pathway patterns observed following upregulation of lamin A and lamin
A50 upregulation (Fig. 3 and Supplementary Table 1).
Differentially activated/inactivated pathways induced by lamin A versus lamin
A50 upregulation were renal cell carcinoma signaling, acute myeloid
leukemia signaling, ERB2-ERBB3 signaling, telomerase signaling, remodeling of
epithelial adherens junctions, TCA cycle II, insulin receptor signaling,
endometrial cancer signaling, melanoma signaling, small cell lung cancer
signaling, and hypoxia signaling in the cardiovascular system. Similarly,
differentially activated/inactivated pathways induced by lamin C versus lamin
A10 upregulation were identified using mRNA data including integrin
signaling, ephrin receptor signaling, regulation of actin-based motility by Rho,
tRNA charging, CSDE1 signaling pathway, glycolysis I, PI3K/AKT signaling, mTOR
signaling, androgen signaling, role of CHK Proteins in cell cycle checkpoint
control, and Sumoylation (Supplementary Table 1).
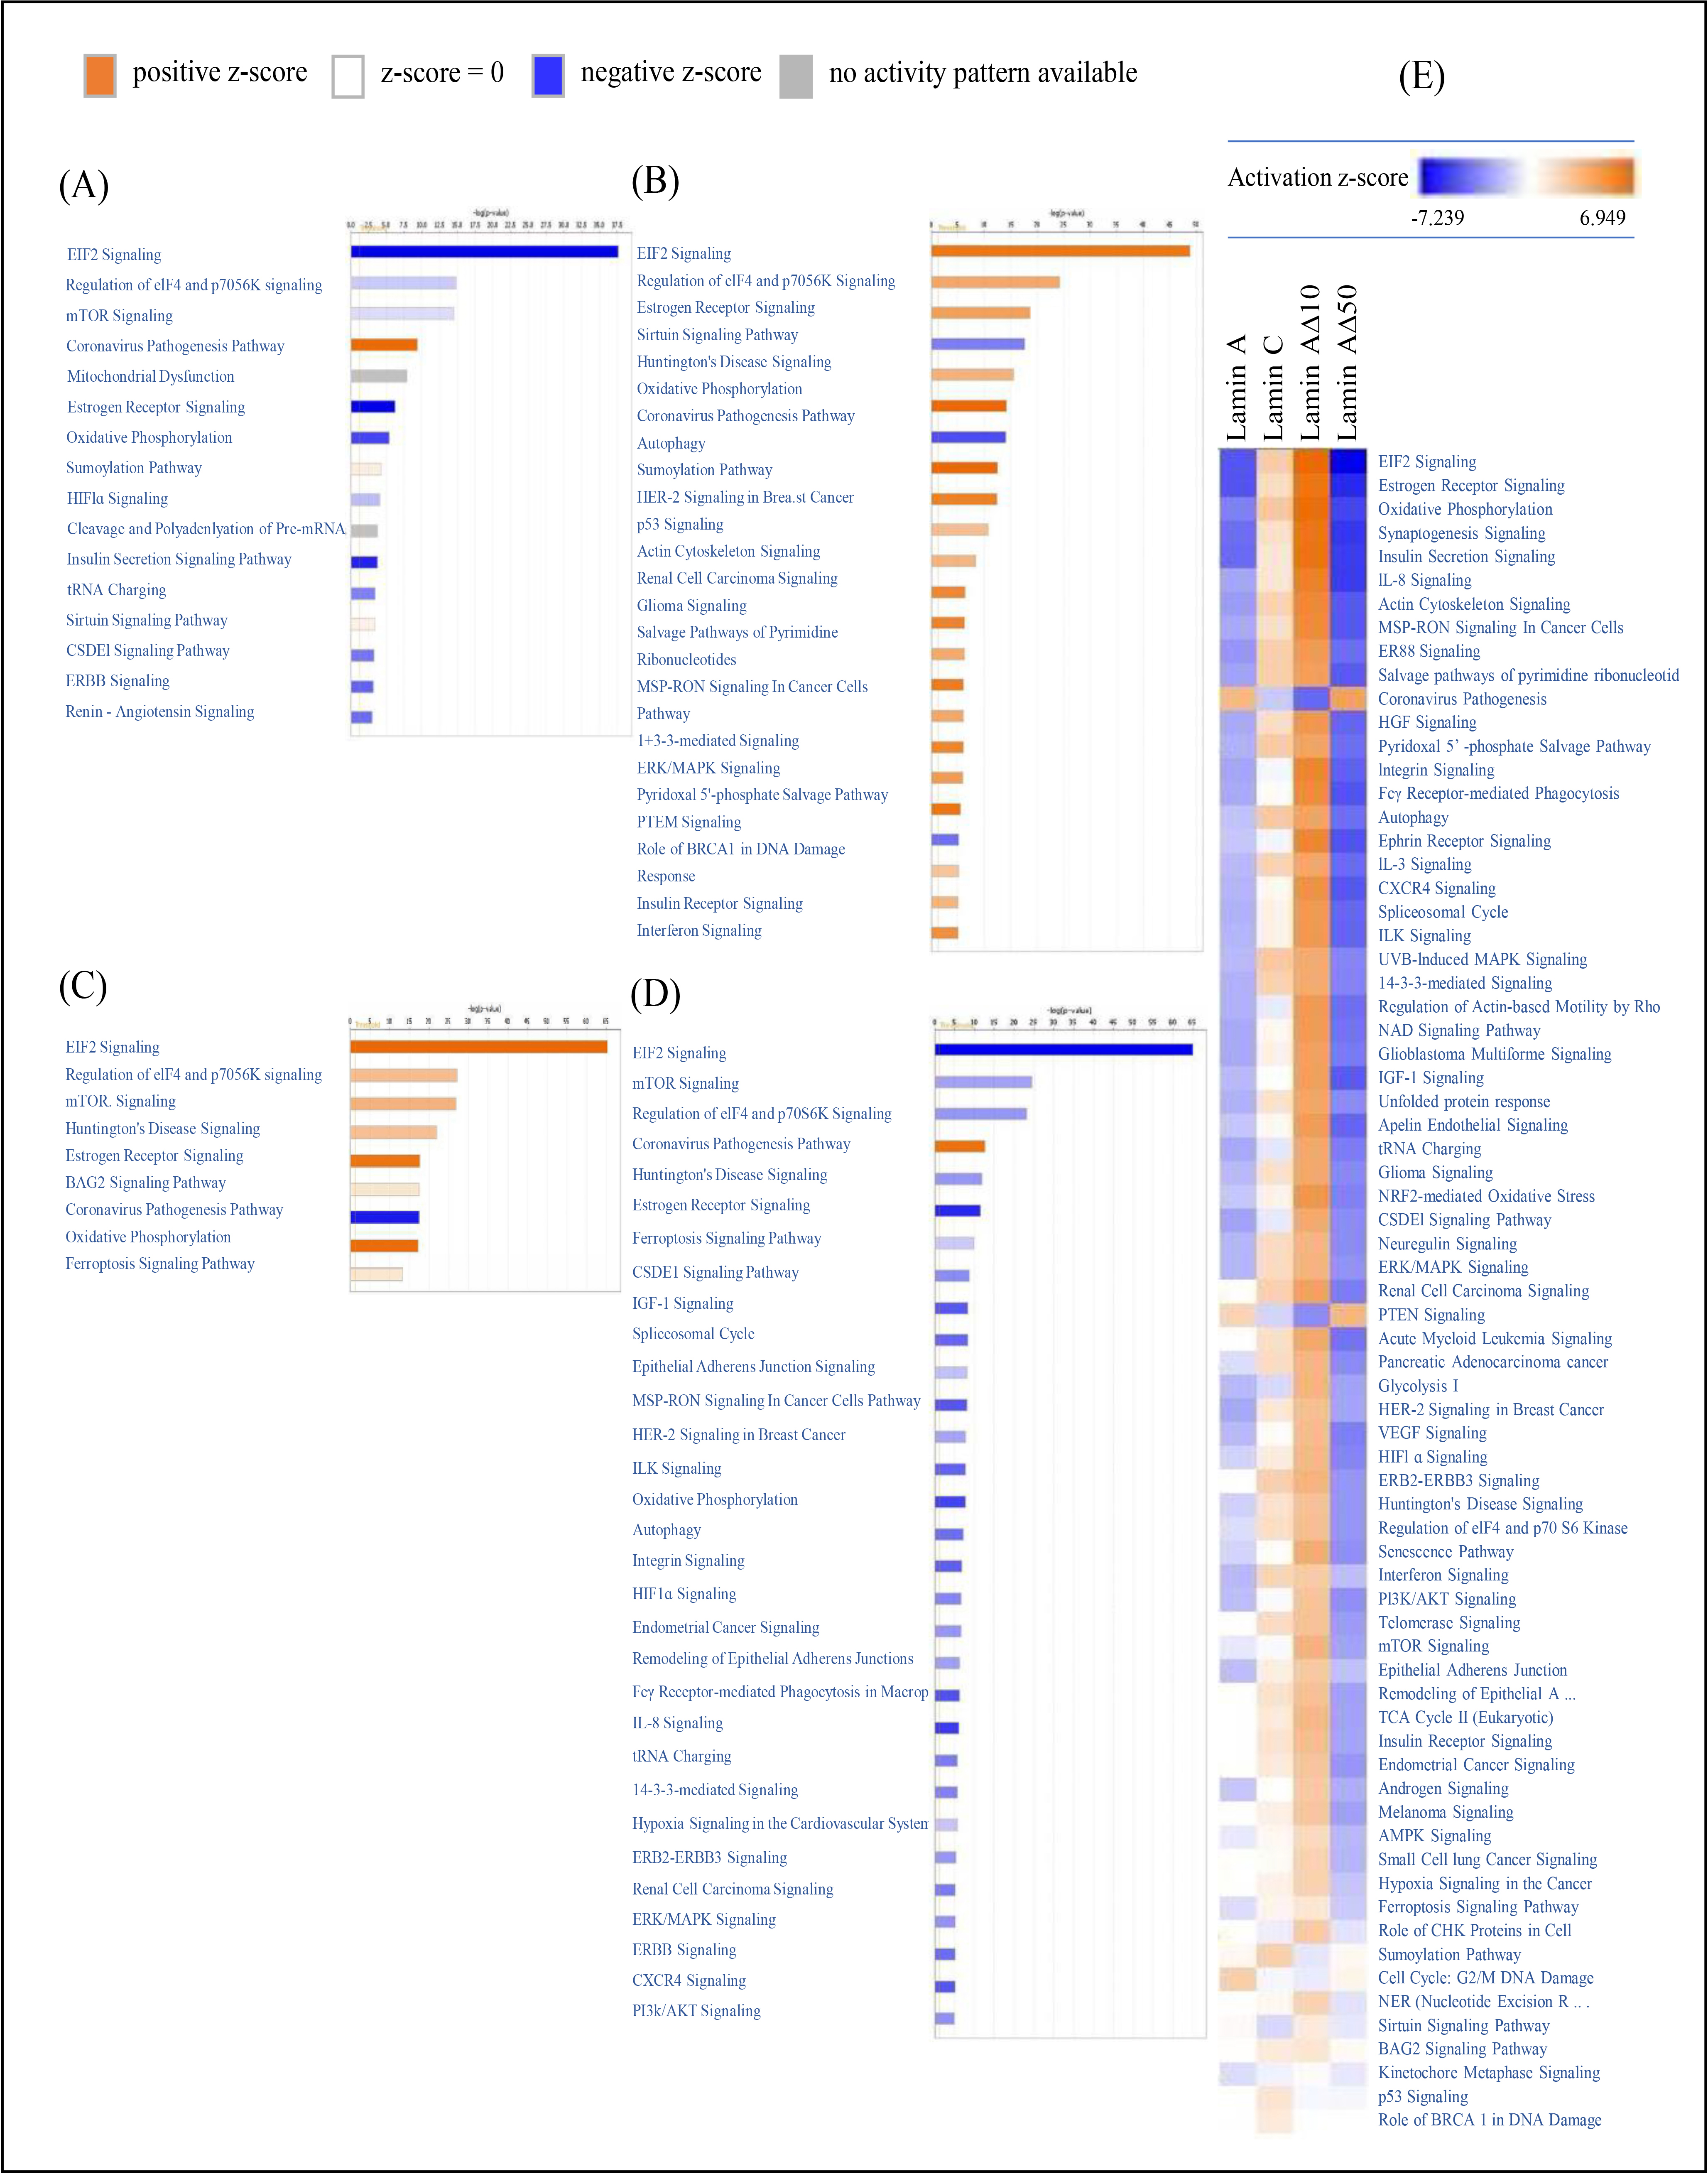 Fig. 3.
Top IPA Canonical pathways associated with mRNA
expression concordant with the upregulation of Lamin A/C transcript variants.
The transcriptional changes associated with the upregulation of different lamin
A/C transcript variants (A) Lamin A, (B) Lamin C, (C) Lamin A10, and
(D) Lamin A50 in MCF7 cell line compared to mock transfected MCF7 cells
were analyzed for canonical pathways using Fisher’s exact test with a designated
significance threshold of –log p value = 1.301 (p 0.05).
The results were plotted on a heat map, where the pathways are ranked based on
the Z-score, with Z-score 1 indicating a significant increase (orange),
Z-score –1 indicating a significant decrease (blue), and undetermined
prediction shown in gray. (E) The heat map displays the canonical pathways that
were identified following the upregulation of lamin A/C transcript variants in
MCF7 cells. The pathways are color-coded based on the Z-score, providing
information about the direction and significance of the changes in each pathway.
Pathways with Z-score 1 are shown in orange, indicating a significant
increase, while pathways with Z-score –1 are shown in blue, indicating a
significant decrease. Pathways with undetermined predictions are shown in gray.
The yellow straight line represents the designated significant threshold of –log
p value = 1.301 (p 0.05).
The Ingenuity Knowledge base provides tools for upstream regulator analysis
based on prior knowledge of expected effects between transcriptional regulators
and their target genes [18]. The analysis was conducted using a threshold of
p value 0.05 and activation Z-score (2 or –2). The
results revealed a total of 109, 198, 924, and 979 upstream molecules that were
observed following the upregulation of lamin A, lamin C, lamin A10, and
lamin A50, respectively, as shown in Supplementary Tables
2–6. The top upstream regulators were selected based on the activation Z-score
(2 or –2), and included regulators such as mTOR (mammalian
target of rapamycin) and MYC proto-oncogene (MYC). Specifically, in the case of
lamin A and lamin A50 upregulation, La ribonucleoprotein domain family
member 1 (LARP1) and torin 1 (ATP-competitive inhibitor of mTOR kinase) were
found to be activated, while MYC was inactivated. On the other hand, lamin C and
lamin A10 upregulation resulted in the activation of MYC and
inactivation of LARP1 and torin 1 (Table 2). These findings suggest that
lamin A, lamin C, lamin A10, and lamin A50 may have distinct
upstream regulators that are involved in regulating the differential expression
of genes and that these regulators, including mTOR and MYC, may play important
roles in the molecular and cellular functions associated with the transcriptional
changes induced by lamin A/C transcript variants in MCF7 cells.
Table 2.Top upstream regulators of Lamin A/C transcript variants
transcriptome.
| Upstream regulators |
Predicted activation Z-score |
p value of overlap |
Predicted activation |
| (LARP1), HGNC:29531 |
5.997 |
4.92 × 10 |
Activated |
| Torin 1 |
2.906 |
1.92 × 10 |
Activated |
| MYC, HGNC:7553 |
–6.541 |
2.90 × 10 |
Inhibited |
| LARP1, HGNC:29531 |
–3.13 |
|
Inhibited |
| Torin 1 |
–1.333 |
|
No Effect |
| MYC |
0.811 |
|
No Effect |
| LARP1, HGNC:29531 |
–8.714 |
1.28 × 10 |
Inhibited |
| Torin 1 |
–5.979 |
2.48 × 10 |
Inhibited |
| MYC |
10.806 |
1.87 × 10 |
Activated |
| LARP1, HGNC:29531 |
8.657 |
3.31 × 10 |
Activated |
| Torin 1 |
4.763 |
1.55 × 10 |
Activated |
| MYC |
–9.493 |
3.66 × 10 |
Inhibited |
While both lamin C or lamin A10 upregulation were associated with a
predicted activation of increased carcinogenesis, cell survival, growth, cell
viability, cell proliferation, cell migration, cell invasion, metastasis, and DNA
repair and a predicted inactivation of cell death (apoptosis and necrosis), lamin
A10 upregulation was associated with a more predicted carcinogenic
phenotype when compared with lamin C upregulation (Fig. 4, Supplementary
Table 7). On the other hand, lamin A or lamin A50 upregulation were
associated with a predicted activation of increased cell death (apoptosis and
necrosis) and inactivation of carcinogenesis, cell growth, cell viability, cell
proliferation, cell migration, cell invasion, and metastasis and was associated
with predicted inactivation of glycolysis and mitochondrial respiration. Lamin C
upregulation resulted in activation of glycolysis with concomitant inhibition of
mitochondrial respiration while lamin A10 upregulation, was associated
with increased glycolysis and mitochondrial respiration.
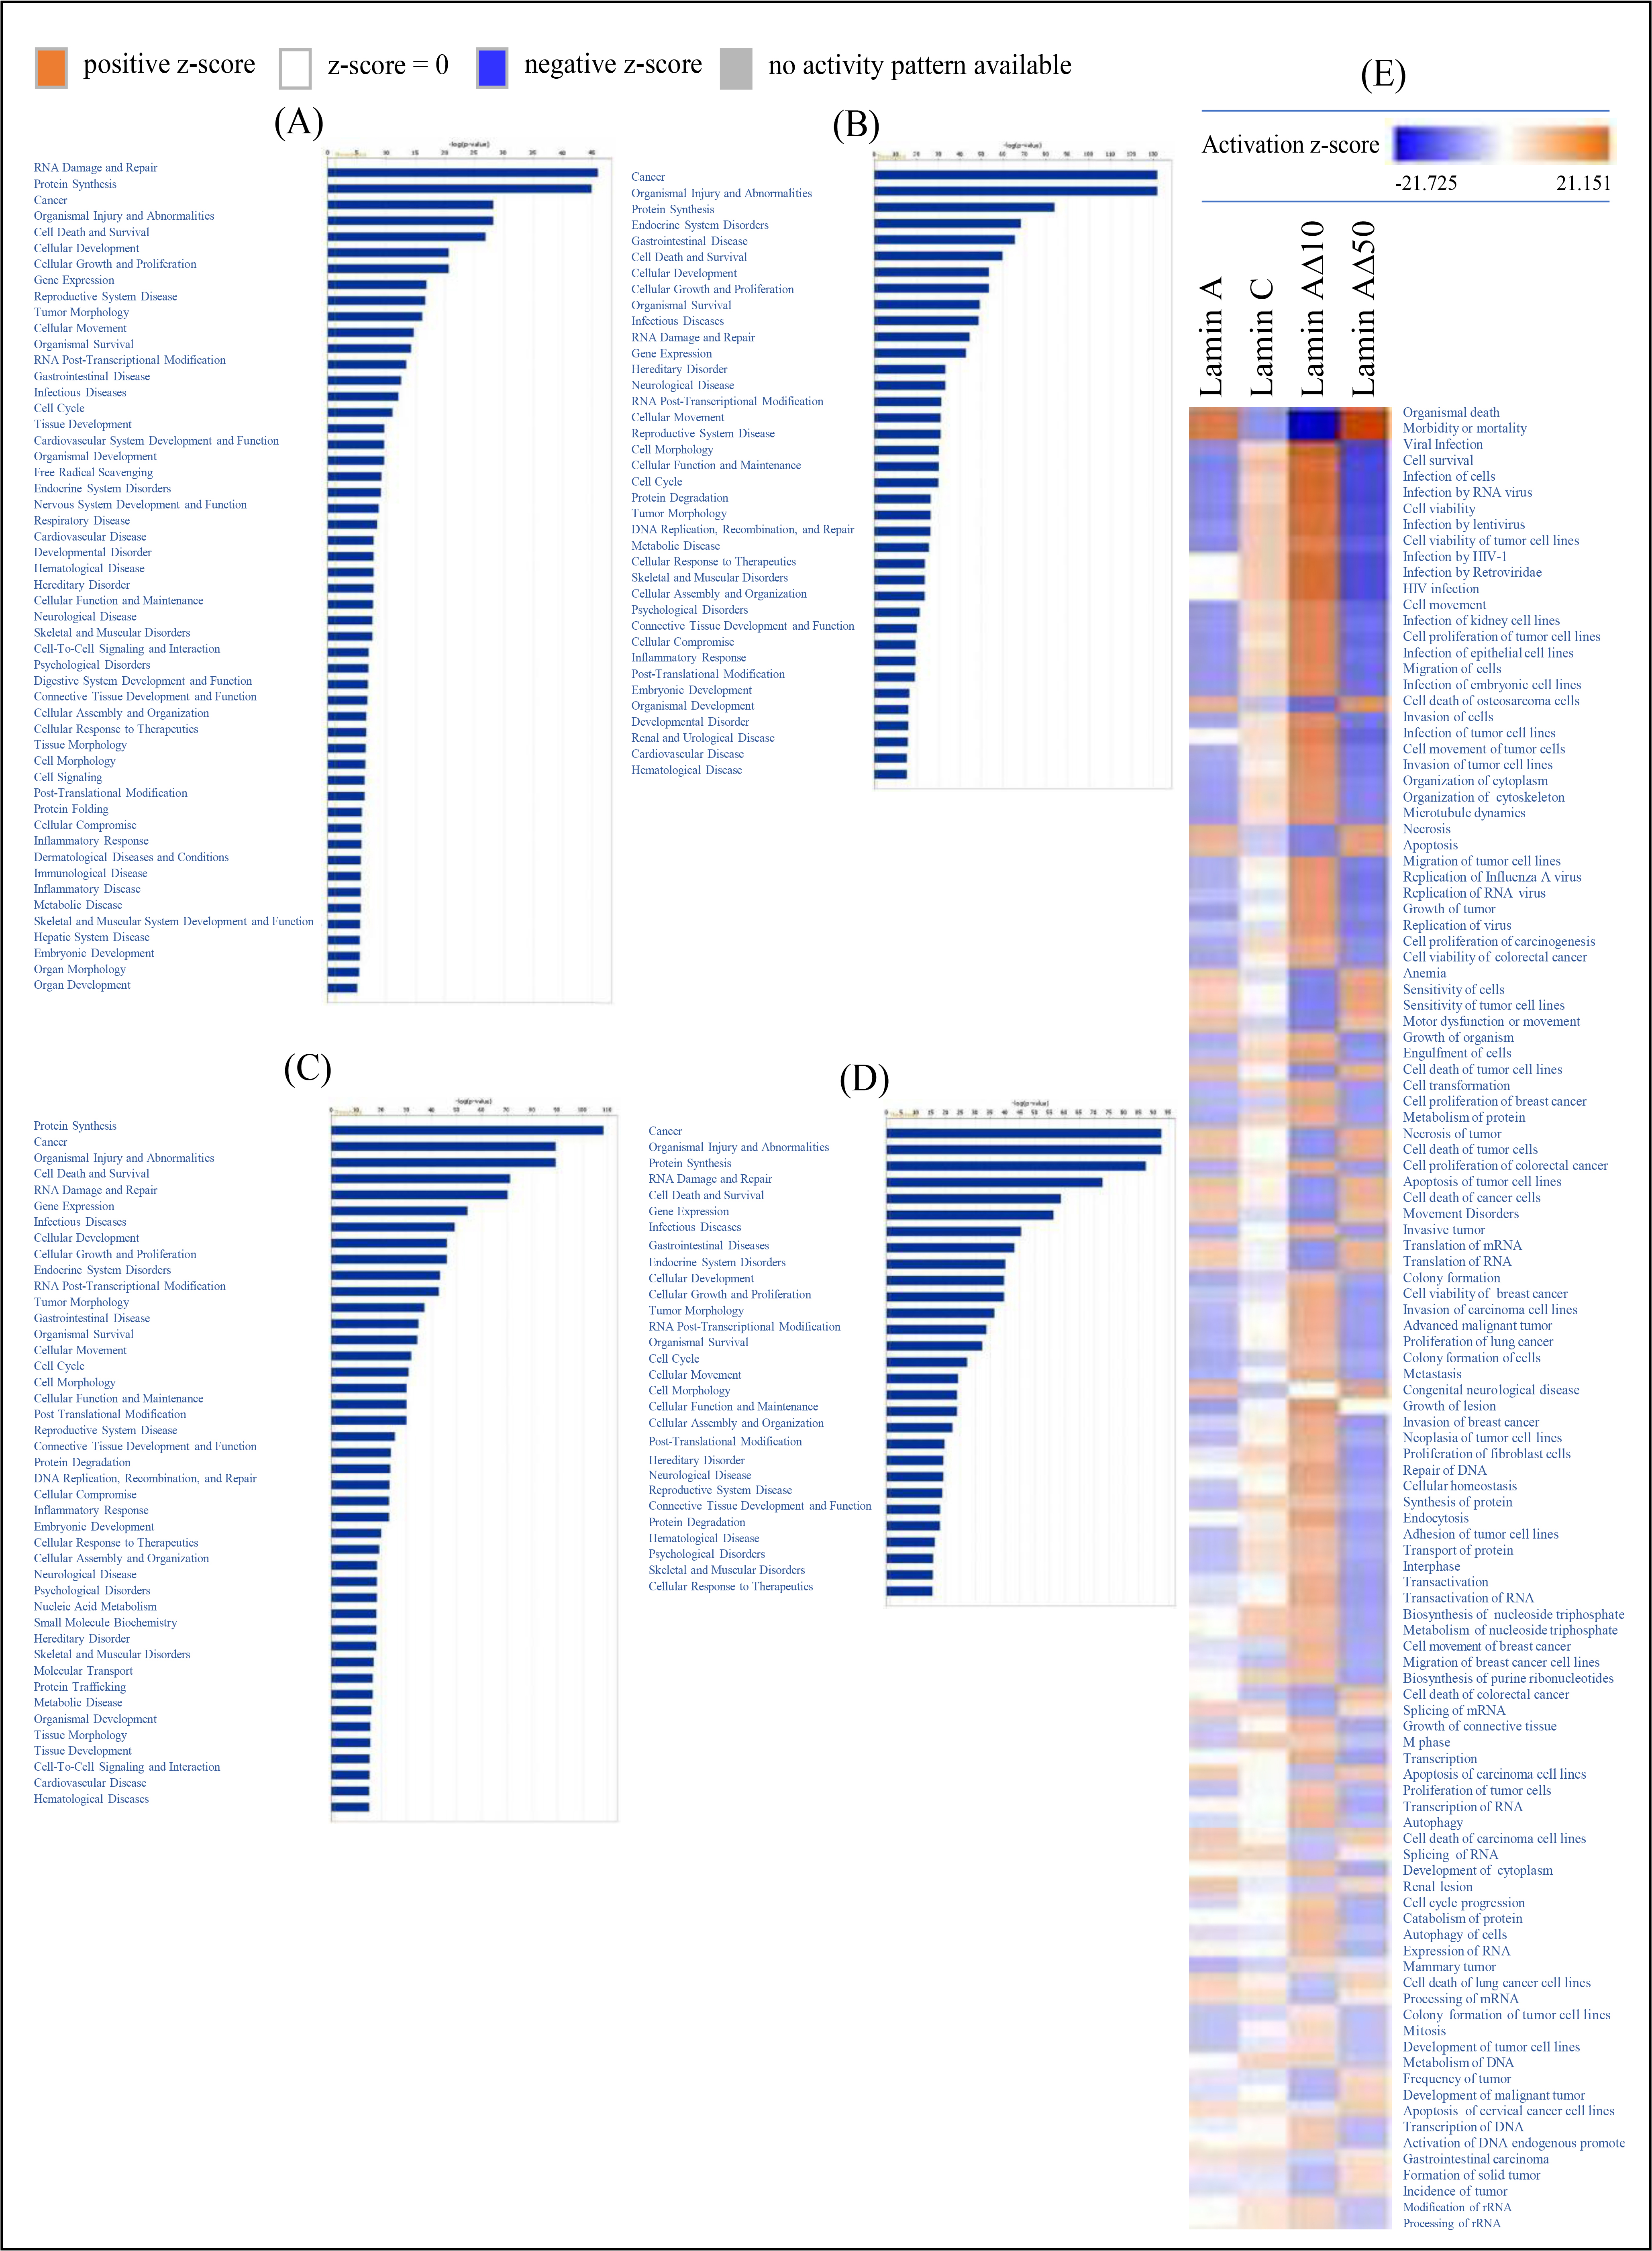 Fig. 4.
Molecular and cellular functions, generated through the use of
QIAGEN’s Ingenuity Pathway Analysis. Molecular and cellular functions associated
with transcriptional changes following upregulation of either: (A) Lamin A; (B)
Lamin C; (C) Lamin A10; (D) Lamin A50 transcript variants in
MCF7 cell line when compared to mock transfected MCF7 cells. The
biological functions are ranked by the negative log of the p value using
Fisher’s exact test, right-tailed. The yellow straight line represents the
designated significant threshold –log p value (p 0.05);
(E) A heat map displaying the molecular and cellular functions
associated with altered mRNA transcription following upregulation of one of the
four lamin A/C transcript variants in MCF7 cell line when compared to mock
transfected MCF7 cells.
3.4 Anti-Apoptotic and Anti-Senescence Effects of Lamin
A10
The findings from the Ion Torrent RNA-Seq data and subsequent experiments
suggest that lamin A10 has anti-apoptotic and anti-senescence effects
in MCF7 cells. When lamin A10 cDNA was upregulated in MCF7 cells, it
resulted in resistance to Doxorubicin, a chemotherapy drug commonly used to
induce apoptosis in cancer cells (Fig. 5A). Comparison of mRNA expression levels
of lamin A/C transcript variants in MCF7 cells and MCF7/ADR cells
(Doxorubicin-resistant) showed higher levels of lamin A/C transcript variants in
MCF7/ADR cells, except for lamin A50 which was not detected (Fig. 5B).
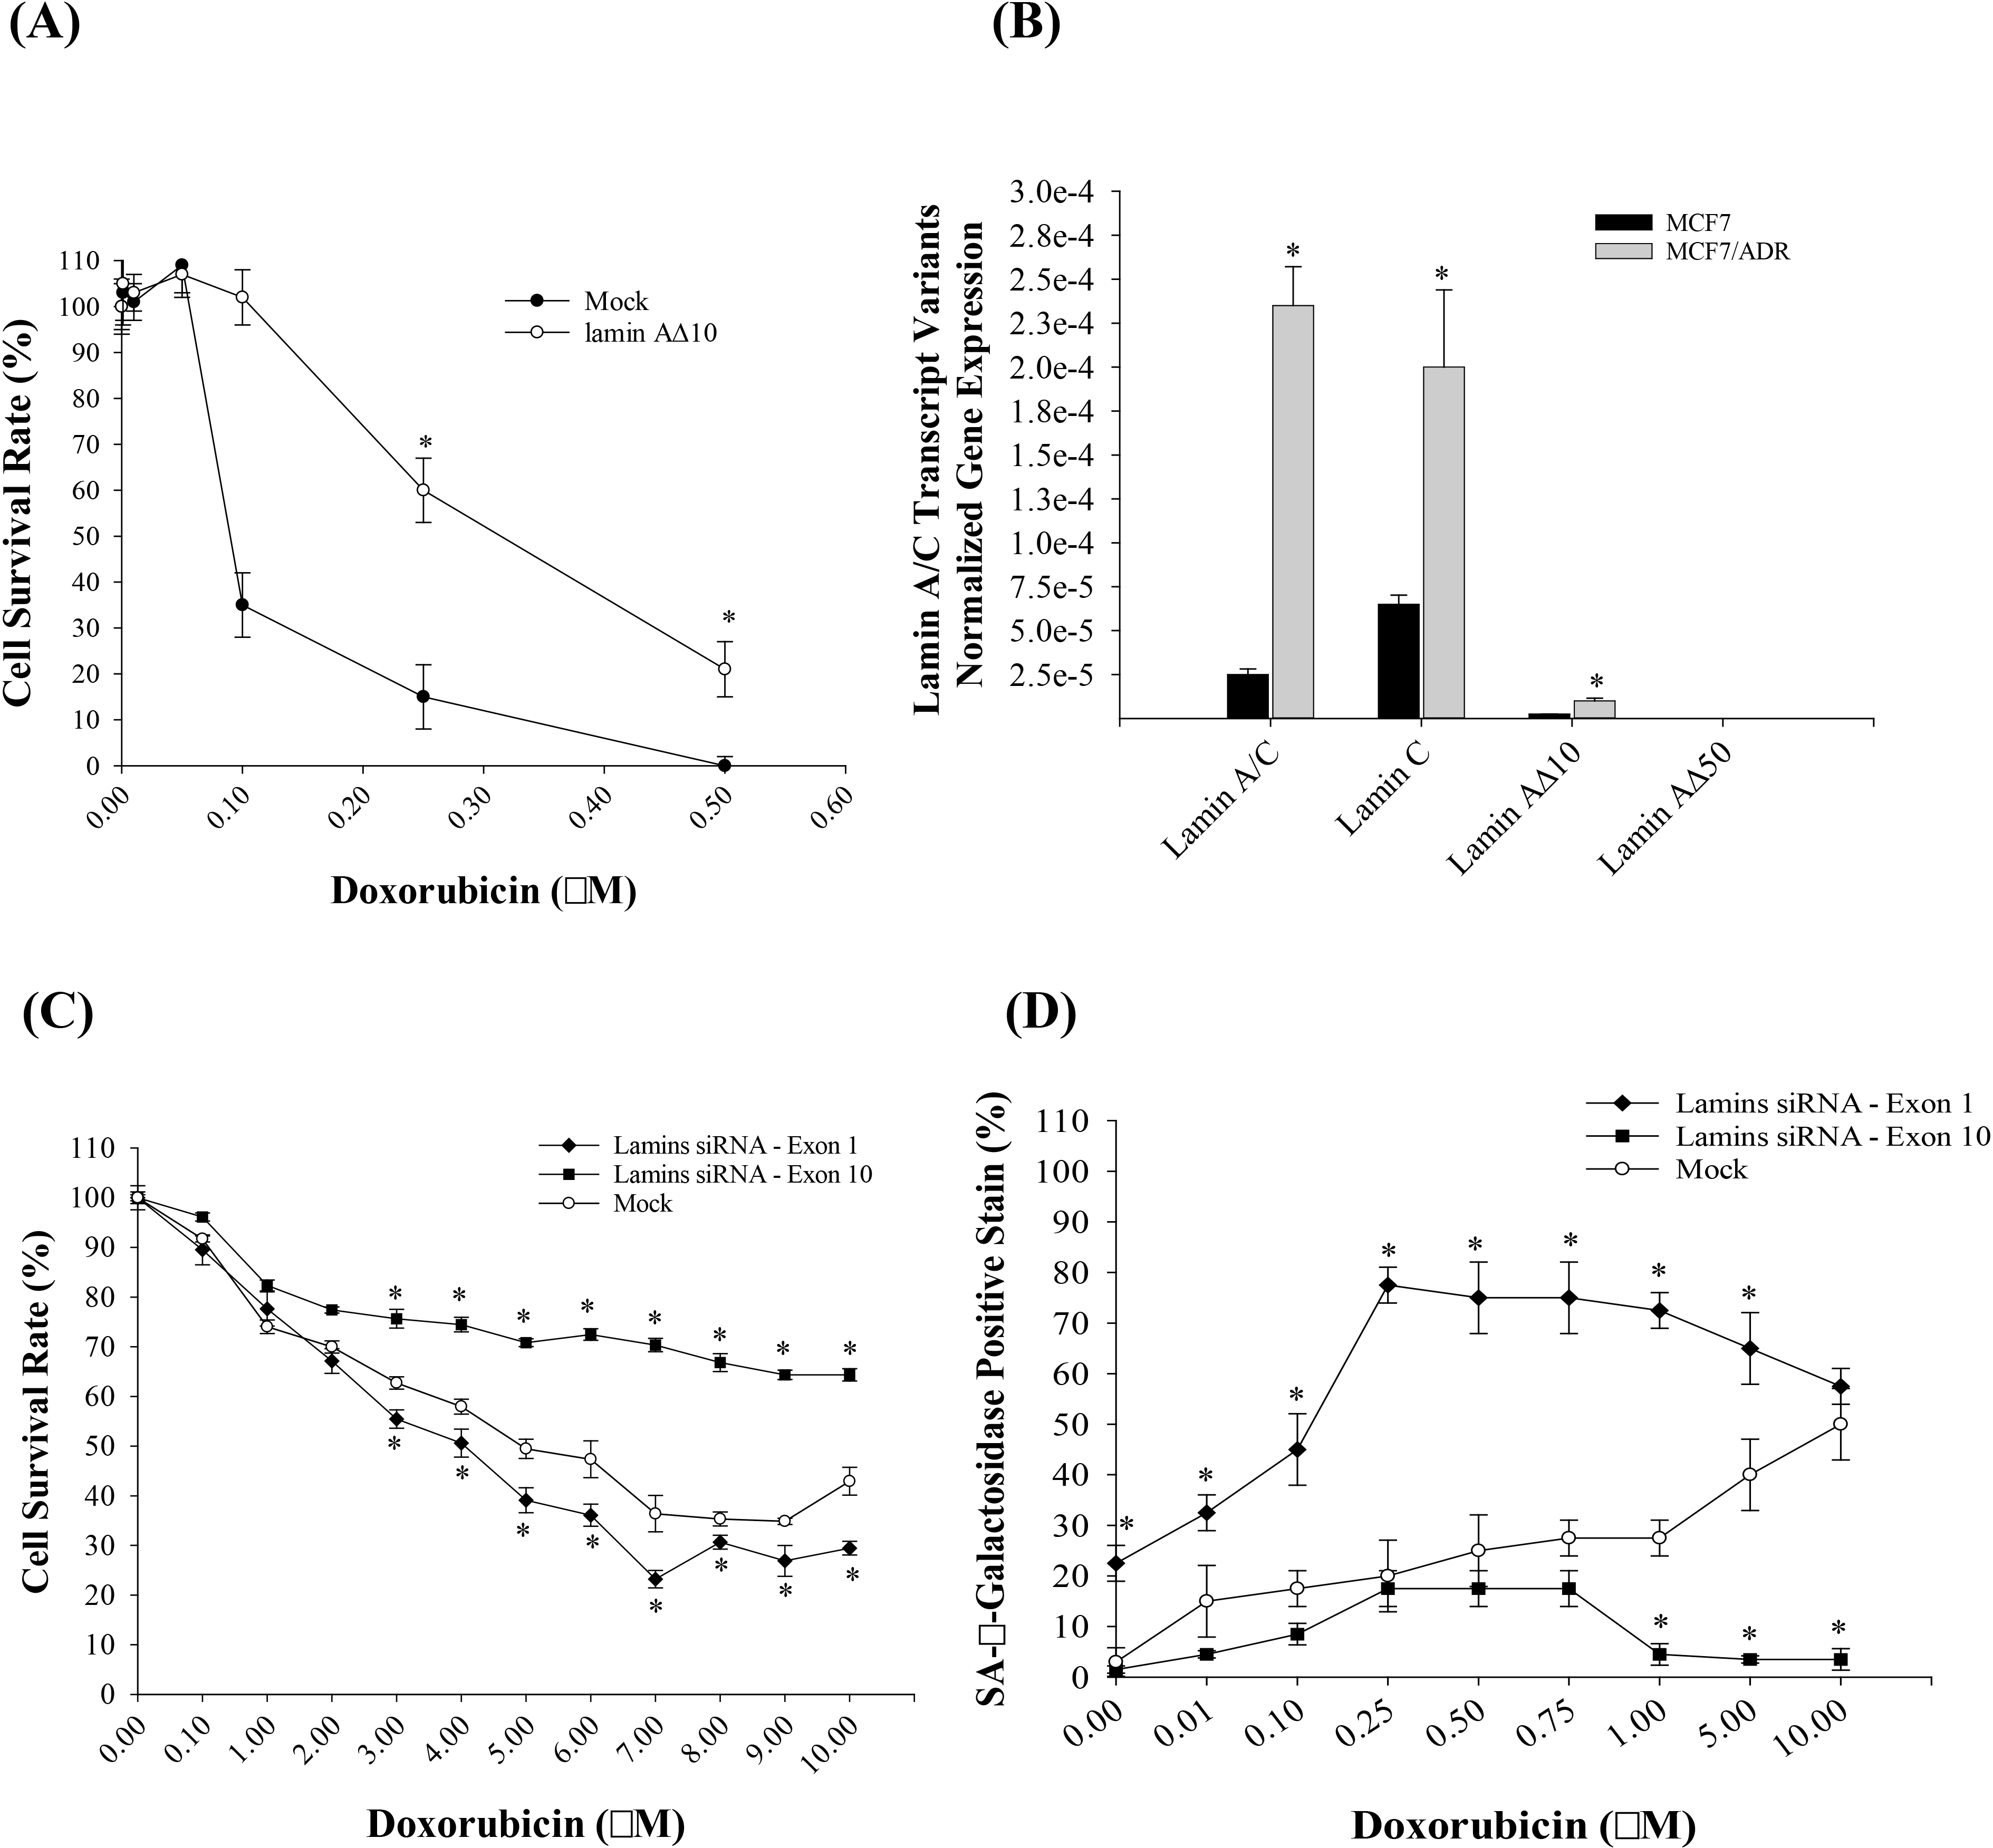 Fig. 5.
Lamin A/C transcript variants expression in MCF7/ADR cell line
and the effect of Lamin A10 inhibition on cell survival and
Senescence-associated beta-galactosidase (SA--Gal stain). MCF7 cell
survival following lamin A10 cDNA upregulation. (B) Lamin A/R
transcript variants mRNA expression in MCF7 and MCF7/ADR as measured by RT-qPCR
utilizing lamin A/C transcript variants specific primers except Lamin A. Results
demonstrate significant increase of total lamin, lamin C and lamin 10
mRNA. (C) MCF7/ADR transfection with plasmids expressing lamin A/C exon 1 siRNA
resulted in increased doxorubicin sensitivity while targeting lamin A/C exon 10
resulted in increased doxorubicin resistance. Cells were incubated with
doxorubicin for 48 hours. (D) SA--Gal stain was absent in most of mock
transfected MCF7/ADR cells or lamin A/C siRNA against exon 10. Challenging these
cells with different concentrations of doxorubicin for 48 hours increased the
percentage of cells stained with SA--Gal except for MCF7/ADR cells
transfected with lamin A/C exon 1 siRNA . Results are presented as mean
SE; *: p 0.001 when compared to Mock transfected MCF7; n = 3,
unpaired t-test.
Further experiments involved transfecting MCF7/ADR cells with siRNA targeting
lamin A/C exon 1 or exon 10, while control cells were transfected with siRNA with
limited homology to any known sequences in humans. Transfection with lamin A/C
exon 1 siRNA, which targeted the expression of all four transcript variants of
lamin A/C, resulted in lower cell survival rate when compared to mock transfected
MCF7/ADR cells following incubation with Doxorubicin (Fig. 5C). On the other
hand, transfection with lamin A/C exon 10 siRNA, which targeted the expression of
lamin A, lamin C, and lamin A50, displayed resistance to Doxorubicin
(Fig. 5C).
Furthermore, staining for senescence-associated -galactosidase
(SA--Gal), a marker of cellular senescence, showed that lamin A/C exon 1
siRNA transfected MCF7/ADR cells were positive for SA--Gal even in the
absence of Doxorubicin, and the intensity and percentage of positive cells
increased significantly in the presence of Doxorubicin (Fig. 5D). In contrast,
lamin A/C exon 10 siRNA transfected MCF7/ADR cells had low SA--Gal
staining even at high doses of Doxorubicin, indicating a potential
anti-senescence role for lamin A10 (Fig. 5D). Taken together, these
findings suggest that lamin A10 has anti-apoptotic and anti-senescence
effects in MCF7 cells, potentially contributing to resistance to
Doxorubicin-induced apoptosis and senescence. Further research may be warranted
to elucidate the molecular mechanisms underlying these effects and explore the
potential therapeutic implications of lamin A10 in cancer treatment.
4. Discussion
Lamins are intermediate filament proteins located in the nucleus that interact
with both chromatin and the cytoskeleton of the cell [9]. The levels of different
transcript variants of lamin A/C change during normal development and in
diseases, but the exact mechanism behind this differential expression is not yet
fully understood. It is believed that this variation in expression could be
attributed to altered mRNA splicing, reduced mRNA stability, reduced protein
stability, or reduced translation efficiency [19]. To better comprehend the role
of lamins and their contribution to diseases, it is crucial to measure their
relative abundances in both normal and cancerous tissues. A previous study
investigating the expression levels of lamin A, lamin C, lamin A10, and
lamin A50 mRNA in 47 different normal tissues and organs revealed that
the expression of lamin A/C transcript variants varies across tissues [14]. Most
normal human tissues primarily express lamin A and lamin C, with lamin
A10 and lamin A50 being less abundant [6, 14]. Notably, the
placenta exhibits very high expression of lamin A10, followed by
seminal vesicles, while the kidney shows the least mRNA expression. Lamin A
expression is often reduced or absent in less differentiated and highly
proliferating cells, such as undifferentiated embryonic stem (ES) cells [20, 21, 22, 23],
suggesting that lamin A may be implicated in the maintenance of cellular
differentiation [23, 24, 25].
Mutations in the Lamin A/C gene can result in various laminopathies, including
muscular dystrophy, neuropathy, diabetes, lipodystrophy [26], Hutchinson-Gilford
Progeria Syndrome (HGPS) affecting children, and Werner syndrome in adults [27, 28]. Additionally, alterations in the composition of nuclear lamins have been
implicated in malignant transformation, tumor propagation, and progression. Loss
of lamin A/C has been reported in lung cancer [29], breast cancer [30, 31], colon
cancer [30, 32], colonic and gastric adenocarcinoma [30], primary gastric
carcinoma [33], basal cell skin carcinoma [34], leukemia [35], ovarian cancer
[36, 37] and prostate cancer [38, 39]. However, there are conflicting findings as
up-regulation of lamin A/C has also been observed in breast cancer [14], prostate
cancer [40, 41], skin cancer [42], ovarian serous cancer [43], and colorectal
cancer [44, 45]. In fact, increased expression of lamin A/C in colorectal cancer
has been shown to increase invasiveness and cell motility [45, 46], while
increased lamin A/C in prostate cancer cells has been linked to stimulation of
cell growth, colony formation, migration, and invasion [41]. Understanding the
mechanisms underlying these diseases is challenging, as most studies have
detected LMNA/C gene transcript variants as one protein with one function,
without considering each variant as a separate protein with different levels of
disease involvement and associated laminopathies (Table 3, Ref. [29, 30, 31, 32, 33, 34, 35, 36, 37, 38, 39, 42, 43, 44, 45]).
Moreover, the methods used for studying lamins, such as semi-quantitative and
insensitive Western blotting (WB) and immunohistochemistry (IHC), have
limitations. For instance, there is currently no specific antibody for lamin
A10, and attempts to generate one have failed [6]. Additionally, lamin
A50 is low abundant in normal cells and generally undetectable with
current methods [47, 48, 49] and can only be detected in HGPS cells [10, 27, 28, 50].
The recent development of specific methods for the measurement of the four
transcript variants at the mRNA level [14] and protein level [13, 51] could
provide valuable insights into the role of lamin A/C transcript variants in
different path.
Table 3.Lamin A/C expression in different cancer types.
| Type of cancer |
Lamin-A/C |
| Lung cancer [29] |
|
| Breast Cancer [30, 31] |
|
| Colon cancer [30, 32] |
|
| Colorectal cancer [44, 45] |
|
| Colonic and gastric adenocarcinoma [30] |
|
| Primary gastric carcinoma [33] |
|
| Basal cell skin carcinoma [34] |
|
| Skin cancer [42] |
|
| Leukemia [35] |
|
| Ovarian serous cancer [43] |
|
| Ovarian cancer [36, 37] |
|
| Prostate cancer [38, 39] |
|
The IPA (Ingenuity Pathway Analysis) is used to predict activity patterns of
pathways based on curated literature [18]. The comparison analysis showed that
lamin A and lamin A50 transcript variants had similar patterns of
activated/inactivated pathways that were opposite to the patterns observed with
lamin C and lamin A10. However, there were also differences in the
activated/inactivated pathways induced by lamin A versus lamin A50 or
lamin C versus lamin A10. Upregulation of lamin A or lamin
A50 in MCF7 cell line activated LARP1 and torin 1 (ATP-competitive
inhibitor of mTOR kinase) while inactivating MYC. Lamin C or lamin A10
upregulation, on the other hand, activated MYC and inactivated LARP1 and torin 1.
LARP1 functions as a key effecter and regulator for mTORC1 by repressing the
translation of TOP mRNAs downstream of mTORC1 and thus regulates cell death and
translation of mRNA [52]. Torin 1 is able to effectively block phosphorylation of
mTORC1 and mTORC2 and thus induces autophagy, as inhibition of mTOR mimics
cellular starvation by blocking signals required for cell growth, proliferation,
reduce protein synthesis and arrest cell cycle progression in G1 [53, 54]. The
MYC gene (MYC Proto-Oncogene, BHLH Transcription Factor) belongs to an oncogene
encoding a nuclear protein that is involved in cell cycle regulation. The MYC
gene family promotes cell proliferation, immortalization, dedifferentiation and
transformation. This suggests that Lamin C or lamin A10 upregulation
are associated with carcinogenic phenotype by modulating MYC, LARP1 and torin 1
pathways. This phenotype is associated with a predicted activation of increased
carcinogenesis, cell survival, growth, cell viability, cell proliferation, cell
migration, cell invasion, metastasis, and DNA repair and a predicted inactivation
of cell death (apoptosis and necrosis) observed following upregulation of Lamin C
or lamin A10. Lamin A or lamin A50 upregulation, on the other
hand, were associated with a predicted activation of increased cell death
(apoptosis and necrosis) and inactivation of carcinogenesis was associated with
predicted inactivation of glycolysis and mitochondrial respiration suggesting
that the energy source relies mainly on the metabolism of glucose which is
characterized by increased rates of glycolysis and lactate production (Warburg
effect) even in the presence of oxygen [55]. Interestingly, lamin C upregulation
resulted in activation of glycolysis with concomitant inhibition of mitochondrial
respiration while lamin A10 upregulation was associated with increased
glycolysis and mitochondrial respiration. The increased glycolysis and
mitochondrial respiration, observed with lamin A10 upregulation, is
consistent with dysregulated metabolism which has been linked to increased tumor
aggressiveness and treatment resistance [56]. These data support the notion that
lamin A10 upregulation is associated with a more carcinogenic and
aggressive tumor phenotype.
The effect of LMNA inhibition on cell survival was examined on MCF-7/ADR.
Establishing a specific siRNA for each transcript variant is a tedious work and
the possibility of off target is almost always present. Off-target effect is
mainly induced by the unintended cross hybridization between siRNAs and
endogenous RNA sequences, other than the ones specifically targeted. This can
obscure the aimed functional interpretation in gene silencing experiments, and
must be avoided as much as possible [57]. Targeting exon 1 reduced doxorubicin
chemoresistance as a result of inhibition of lamin A, lamin C, lamin
A10, and lamin A50. Targeting exon 10 results in the
inhibition of all lamin A/C transcript variants except lamin A10 and
this increased doxorubicin resistance. Inhibition of all lamin A/C transcript
variants resulted in an increased SA--gal stain in MCF7/ADR following
doxorubicin addition while targeting exon 10 of lamin A/C resulted in decreased
stain of SA--gal stain. These data strongly suggest that lamin
A10 regulates senescence and inhibition of lamin A10 results
in increased senescence and apoptosis. Interestingly, lamins are one of the first
nuclear targets cleaved during apoptosis. The A type Lamins cleavage by caspase-6
is an important step in the nuclear apoptotic process and concurs with their
total disintegration from the nuclear lamina during apoptosis [58, 59, 60, 61, 62]. The
caspase-6 cleavage site (VEID) for A type lamins [59] is in exon 4 and thus would
inactivate all lamin A/C transcript variants. This represents a plausible
hypothesis that lamin A10 cleavage is essential for the nuclear
apoptotic process and requires further investigation.
MCF7 cells transfected with lamin A10-GFP construct expressing GFP at
the C-terminal in this study showed a stable expression of the chimeric proteins.
In the majority of transfected cells, lamin 10-GFP revealed prominent
nuclear speckles. This is consistent with the Machiels et al. [6] study
which was first to report the expression of lamin A10 in several cell
lines. Machiels et al. [6] study detected an abnormal localization of
lamin A as nuclear aggregates in the adenocarcinoma cell line GLC-A1 using
immunofluorescence microscopy when stained with an antibody directed to lamin A.
Lamin A is synthesized as prelamin A, with a C-terminal CaaX motif, and then
undergoes a series of posttranslational modifications in the nucleus
(farnesylation, aaX cleavage and carboxylmethylation, and cleavage by Zmpste24)
[63]. Since lamin C lacks a CaaX motif, it is not modified. However, the
processing enzymes have been shown to reside either in the cytosol
(farnesyltransferase), or are endoplasmic reticulum (ER) membrane proteins
(Zmpste24, Rce1, and ICMT) [63]. Both prelamin A and lamin A50 have
been shown to undergo these posttranslational modifications whereas lamin
A10 has not been investigated. However, lamin 10 has been
demonstrated to be localized to the nuclear membrane (perinuclear localization)
suggesting that it does undergo posttranslational modifications in the
Chinese Hamster Ovary (CHO-K1) cells. The majority of
transfected cells with one of the three lamin A/C transcript variants-GFP chimera
(lamin A. lamin C, and lamin A10) revealed an extensive collection of
branching intra- and trans-nuclear tubular structures [64]. Interestingly,
blocking farnesylation, the first step of CaaX processing, causes nucleoplasmic
accumulation of completely unprocessed prelamin A [65, 66] and inhibition of
farnesylation of lamin A50 prevents the characteristic nuclear blebbing
of Hutchinson-Gilford progeria syndrome [67]. However, our data with C-terminal
GFP-tagged lamin A10 suggest that unprocessed lamin A10 is
present in the nucleus as aggregates opposite to unprocessed lamin A and lamin
A50 which show a diffused fluorescent pattern. Overexpression of
C-terminal GFP-tagged lamin A10 in MCF7 cells resulted in the formation
of prominent nuclear speckles and no speckles were observed in the cytoplasm.
Additionally, no speckles were formed when cells were transfected with C-terminal
GFP-tagged lamin A, or lamin C or lamin A50. The role of the
aggregation and nuclear localization of lamin A10 in the nucleus is
unknown and needs further investigation.
5. Conclusions
Dissecting the signal transduction pathways of lamin A/C transcript variants is
crucial to identify the mechanisms for the different pathophysiological processes
associated with laminopathies. Lamin C and lamin A10 upregulation are
associated with a predicted increased carcinogenesis, cell survival, growth, cell
viability, cell proliferation, cell migration, cell invasion, metastasis, and DNA
repair and a predicted inactivation of cell death by modulating MYC, LARP1 and
torin 1 pathways. However, lamin A10 upregulation is associated with a
more carcinogenic and aggressive tumor phenotype as compared to lamin C. Lamin A
or lamin A50 upregulation is associated with a predicted activation of
increased cell death and inactivation of carcinogenesis. Lamin A10 only
form prominent nuclear speckles and aggregates rather than the conventional
perinuclear localization observed with other lamin A/C transcript variants.
Abbreviations
HGPS, Hutchinson-Gilford progeria syndrome; MEM, Eagle minimum essential
médium; CypA, Cyclophilin A; MTT, (3-[4,5-dimethylthiazol-2-yl]-2,5 diphenyl
tetrazolium bromide); SA--gal, Senescence-associated beta-galactosidase;
NGS, Next-Generation Sequencing; IPA, Ingenuity Pathway Analysis; LARP1, La
ribonucleoprotein domain family member 1; MYC, MYC proto-oncogene; siRNA, small
interfering RNA; GFP, green fluorescent protein.
Availability of Data and Materials
Materials used in this study can be obtained from the corresponding authors upon
request.
Author Contributions
Conceptualization, RF, AA; methodology, LB, MZ, JH, MAA, WA; formal analysis, MAA, JH;
resources, AA, RF; data curation, JH, MZ; writing—original draft preparation,
LB, JH; writing—review and editing, RF, AA; visualization, MAA; supervision, RF,
AA; project administration, RF; funding acquisition, RF. All authors contributed to editorial changes in the manuscript. All authors read and approved the final manuscript. All authors have participated sufficiently in the work to take public responsibility for appropriate portions of the content and agreed to be accountable for all aspects of the work in ensuring that questions related to its accuracy or integrity.
Ethics Approval and Consent to Participate
The study was approved by the Institutional Review Board (IRB) of Ministry of
National Guard Health Affairs (MNGHA, Protocol Code RC10/113).
Acknowledgment
Not applicable.
Funding
This work was funded by the Alfaisal University-Office of Research and Graduate
Studies (ORG) grant #21314 for year 2022.
Conflict of Interest
The authors declare no conflict of interest.


 , Ahmad Aljada 1,*