
- Academic Editor
This is an open access article under the CC BY 4.0 license.
Background: The chloroplast (cp) genome has unique and highly conserved characteristics and is therefore widely used in species identification and classification, as well as to improve the in–depth understanding of plant evolution. Methods: In this study, the cp genomes of 13 Lamiaceae plants in the Tibet Autonomous Region of China were sequenced, assembled and annotated using bioinformatics methods. Phylogenetic trees were constructed to reveal the phylogenetic relationship of related species in the Lamiaceae. Results: The results showed that all 13 cp genomes had a typical four–segment structure, including one large single–copy (LSC) region, one pair of inverted repeat (IR) regions and one small single–copy (SSC) region. The sequence lengths of the 13 cp genomes were between 149,081 bp and 152,312 bp, and the average GC content was 37.6%. These genomes contained 131–133 annotated genes, including 86–88 protein–coding genes, 37–38 tRNA genes, and 8 rRNA genes. A total of 542 SSR loci were detected using MISA software. The repeat types were mostly single–nucleotide repeats, accounting for 61% of simple repeats. A total of 26,328–26,887 codons were detected in 13 cp genomes. According to the RSCU value analysis, the codons mostly ended with A/T. Analysis of IR boundaries showed that the other species were relatively conserved, except for Nepeta laevigata (D. Don) Hand.–Mazz., which differed in gene type and location on both sides of the boundary. By analysing nucleotide diversity, two highly mutated regions located in the LSC and SSC regions were identified in the 13 cp genomes. Conclusions: Using the cp genome of Lycium ruthenicum Murray as the outgroup, 97 cp genomes of the Lamiaceae were used to construct an Maximum Likehood (ML) phylogenetic tree, in which these species were divided into eight major clades, corresponding to eight subfamilies based on morphological classification. The phylogenetic results based on monophyletic relationships were consistent with the morphological classification status at the tribe level.
Lamiaceae is a large family with worldwide distribution. There are 10 subfamilies, approximately 220 genera and 3500 species in this family in the world, and more than 800 species in 99 genera in China [1]. Compared to mainland China, in the Tibetan plateau region, the sunlight exposure time is longer, and the altitude is higher. Because of this special geographical environment, Tibet has bred some unique medicinal plants, commonly known as Tibetan medicine [2, 3]. In China, 24 species in 16 genera of the Lamiaceae are used in Tibetan medicine [4], e.g., Elsholtzia fruticosa, N. laevigata, and Elsholtzia densa. These Tibetan medicines are widely used in the treatment of influenza, liver and stomach diseases, dysentery, and pharyngitis [3]. Some Lamiaceae plants have very good economic value, e.g., Galeopsis bifida is a famous oil crop, and Salvia sikkimensis is a landscape plant.
To date, studies on species in the Lamiaceae have mainly focused on pharmacological effects [5], morphological investigations [6], chemical composition analysis [7, 8], and species classification [9]. However, Chinese scholars have published the cp genomes of Tibetan medicine Elsholtzia Willd. and Lamiophlomis Kud., and confirmed that plant morphological classification can be used as a basis to support molecular classification and species identification of medicinal materials [10, 11]. Through clustering analysis of cp genomes of some species in the Lamiaceae, studies have confirmed that medicinal materials with similar chemical compositions and pharmacological effects have close genetic relationships [12]. In order to explore the relationships of different subfamilies of the Lamiaceae, investigators have established the phylogenetic trees with the cp genomes of some species in the Lamiaceae. They found that the Nepetoideae subfamily formed a clade independently of the other six subfamilies, and that the Lamioideae subfamily and Scutellarioideae subfamily were closely related [13, 14].
Cp is the main intracellular location for plant photosynthesis and one of the organelles with independent genetic material. Compared with the mitochondrial or nuclear genome, the cp genome has a higher structure, gene number and gene composition [15]. In recent years, an increasing number of researchers have used cp genomes to analyse plant genetic diversity [16, 17, 18] and to explore the relationships among different families, genera and species [19, 20, 21, 22, 23, 24, 25, 26].
Many species in the Nepeta, Elsholtzia, and Salvia genera of the Lamiaceae [1] are distributed in the Qinghai–Tibet Plateau in China, providing a solid basis for the study of these species. Therefore, based on high–throughput sequencing technology, we sequenced the cp genomes of 13 Lamiaceae species from the Tibet Autonomous Region of China, analysed and compared their structural characteristics using bioinformatics methods, and constructed phylogenetic trees, aiming to provide new ideas for the classification and identification of the Lamiaceae species.
The plant materials of 13 species of the Lamiaceae used in this study were collected from the Tibet Autonomous Region of China (Tibet) (Table 1, Fig. 1) and identified by Professor Guoyue Zhong of Jiangxi University of Chinese Medicine (JUTCM). The certificate specimens were all stored in the herbarium of JUTCM.
| Special | Collect location | Latitude and longitude | Altitude | Sample number | Accession number |
|---|---|---|---|---|---|
| Ajuga nubigena Diels. | Gyirong County, | 28°23′53.9″E | 2868.1m | H3050404 | OP186457 |
| Rikaze City, Tibet | 85°18′35″N | ||||
| Elsholtzia densa Benth. | Chagyab County, | 98°6′0.51″E | 4365.0m | H3050021 | OP186458 |
| Changdu City, Tibet | 30°12′31.98″N | ||||
| Elsholtzia eriostachya Benth. | Nyalam County, | 28°19’6.2″E | 4172.6m | H3050264 | OP186459 |
| Rikaze City, Tibet | 86°2’19.5″N | ||||
| Elsholtzia fruticosa (D. Don) Rehd. | Gyirong County, | 28°23’52.4″E | 2813.1m | H3050369 | OP186460 |
| Rikaze City, Tibet | 85’19’39.1″N | ||||
| Galeopsis bifida Boenn. | Bomê County, | 93°14′52.0″E | 3630.0m | H3050082 | OP186461 |
| Nyingchi City, Tibet | 29°53′5.54″N | ||||
| Marmoritis complanatum (Dunn) A. L. Budantzev. | Qushui County, | 90°38′9.46″E | 3596.0m | H3050160 | OP186462 |
| Lhasa City, Tibet | 29°18′33.49″N | ||||
| Nepeta dentata C. Y. Wu et Hsuan. | Karuo District, | 31°24′36.8″E | 3677.4m | H3050533 | OP186463 |
| Changdu City, Tibet | 97°28′1.8″N | ||||
| Nepeta hemsleyana Oliver ex Prain. | Bomê County, | 93°14′52.0″E | 3630.0m | H3050095 | OP186464 |
| Nyingchi City, Tibet | 29°53′5.54″N | ||||
| Nepeta laevigata (D. Don) Hand.–Mazz. | Mira Mountain Pass, | 94°38’54.14”E | 4544.0m | H3050131 | OP186465 |
| Nyingchi City, Tibet | 29°36’55.22”N | ||||
| Nepeta thomsonii Benth. ex Hook. f. | Chagyab County, | 98°6′0.51″E | 4365.0m | H3050023 | OP186466 |
| Changdu City, Tibet | 30°12′31.98″N | ||||
| Phlomis betonicoides (Diels) Kamelin & Makhm. | Ranwu Canyon, Basu County, | 96°46′4.64″E | 4013.0m | H3050063 | OP186467 |
| Changdu District, Tibet | 29°30′55.02″N | ||||
| Salvia sikkimensis Stib. | Yadong County, | 89°0′1.34″E | 3693.0m | H3050217 | OP186468 |
| Rikaze City, Tibet | 27°33′20.36″N | ||||
| Thymus linearis Benth. | Nyalam County, | 28°19′6.2″E | 4172.6m | H3050268 | OP186469 |
| Rikaze City, Tibet | 86°2′19.5″N |
 Fig. 1.
The collected 13 Lamiaceae species.
Leaves dried with silica gel were used to extract DNA using a Plant Genomic DNA
Kit (Tiangen Biochemical Technology (Beijing) Co., Ltd.). The quality of genomic
DNA was detected by a spectrophotometer and 1% agarose gel electrophoresis.
According to the standard genomic DNA library preparation procedure provided by
Illumina, intact DNA samples with concentrations greater than 20
ng
Trimmomatic v0.36 software [27] (Aachen and Institute of Bio- and Geosciences: Plant Sciences, Forschungszentrum Jülich, Leo-Brandt-Straße, Jülich, Germany) was used for quality filtering of raw data in Illumina sequencing. Single bases with a quality score lower than 20 were deleted from both ends of the sequence, as well as regions of sequences with more than three consecutive uncalled bases. All reads less than 40 bp were discarded. Filtered data were mapped to available cp genomes of the closest species in the Lamiaceae using Bowtie2 v.2.2.3 software [28] (Department of Computer ScienceUniversity College London, Gower Street, London, UK), and reads from nuclear and mitochondrial origins were excluded. The chloroplast genomes were then assembled and reconstructed using GetOeller 1.7.5 software [29] (Chinese Academy of Sciences, Kunming, Yunnan, China). CPGAVAS2 software [30] (Faculty of Technology, University of Bielefeld, Germany) (http://47.96.249.172:16019/analyzer/annotate/) was used to complete automatic annotation. Geneious 11.0.5 software [31] (Oxford, England) was used for manual correction, and OGDRAW V1.1 software [32] (Max-Planck-Institut für Molekulare Pflanzenphysiologie, Am Mühlenberg, Germany) (https://chlorobox.mpimp-golm.mpg.de/OGDraw.html) was used to map the physical structure of the chloroplast genome.
MISA software [33] was used to screen microsatellite sequences, and the parameters were set as ten repeats for single–nucleotide SSRs, five repeats for dinucleotide single sequence repeats (SSRs), four repeats for trinucleotide SSRs, and three repeats for four– and five–nucleotide SSRs.
Forward, reverse, complementary and palindrome repeat sequences were identified using REPuter software [34] (Faculty of Technology, Bielefeld, Germany) (http://bibiserv.techfak.uni-bielefeld.de/reputer/).
CodonW software 1.4.2 [35] (Paul Sharp lab, Dept of Genetics, University of Nottingham, UK) was used to identify codon usage patterns and calculate codon bias (RSCU). The CODEML program in PAML V4.973 software [36] (Department of Biology, Galton Laboratory, London, UK) was used to calculate ratio of nonsynonymous nucleotide substitution rate to synonymous nucleotide substitution rate (Ka/Ks) for each gene. Pairwise comparisons were performed, dN/dS ratio of each protein–coding gene were calculated using the yn00 program in PAML and the detailed parameters were: icode = 10, weighting = 0, commonf3x4 = 0, and other parameters in the CODEML control file were left at default settings.
Nucleotide variability (Pi) of cp genomes was assessed by alignment of sequences using MAFFT V7 software [37] (Bioinformatics Center, Institute for Chemical Research, Kyoto University Uji, Kyoto 611-0011, Japan), followed by manual adjustment of sequences using BioEdit software [38] (Borland company, Scotts Valley, California, USA). Sliding window analysis was completed using DnaSP version 5.1 software [39] (Departament de Genètica, Facultat de Biologia and Institut de Recerca de la Biodiversitat, Universitat de Barcelona, Barcelona, Spain). The step size was set to 200 bp, and the window length was set to 600 bp.
Using IRSCOPE software [40] (https://irscope.shinyapps.io/irapp/), the IR (Inverted repeat) boundaries were drawn, and the gene type and location in the border area were identified. The expansion and contraction of genes were also discovered.
The differences in cp genome sequences of the 13 Lamiaceae species evaluated in this study were compared using mVISTA software [41] (National Energy Research Scientific Computing Center Genome Sciences Department, Berkeley, USA) (http://genome.lbl.gov/vista/mvista/submit.shtml).
Selecting the published cp genomes of 84 Lamiaceae species and the 13 cp genomes from the Lamiaceae species in Tibet, the MAFFT V7 program [37] was used to compare the entire cp genomes, with manual adjustment when necessary. After being estimated in Modelfinder, the general time reversible (GTR) + r model of nucleotide substitution was used for phylogeny. Using the cp genome of L. ruthenicum (NCBI accession number NC039651.1) as the outgroup, a maximum likelihood (ML) phylogenetic tree was constructed using PhyloSuite v1.2.2 [42] (Key Laboratory of Aquaculture Disease Control, Chinese Academy of Sciences, Wuhan, China) with bootstrap values of 10,000 replicates.
Consistent with most land plants, the cp genomes of the 13 Lamiaceae species showed a conserved quadripartite structure [43] (Fig. 2), with lengths ranging from 149,081 bp to 152,312 bp, indicating that the lengths of these cp genomes were conserved [23]. The LSC region (80,908–83,416 bp) and SSC region (17,177–17,692 bp) were separated by two IRs (IRa and IRb, 24,956–25,790 bp), and the GC content was 37.83–38.49%, much lower than the AT content.
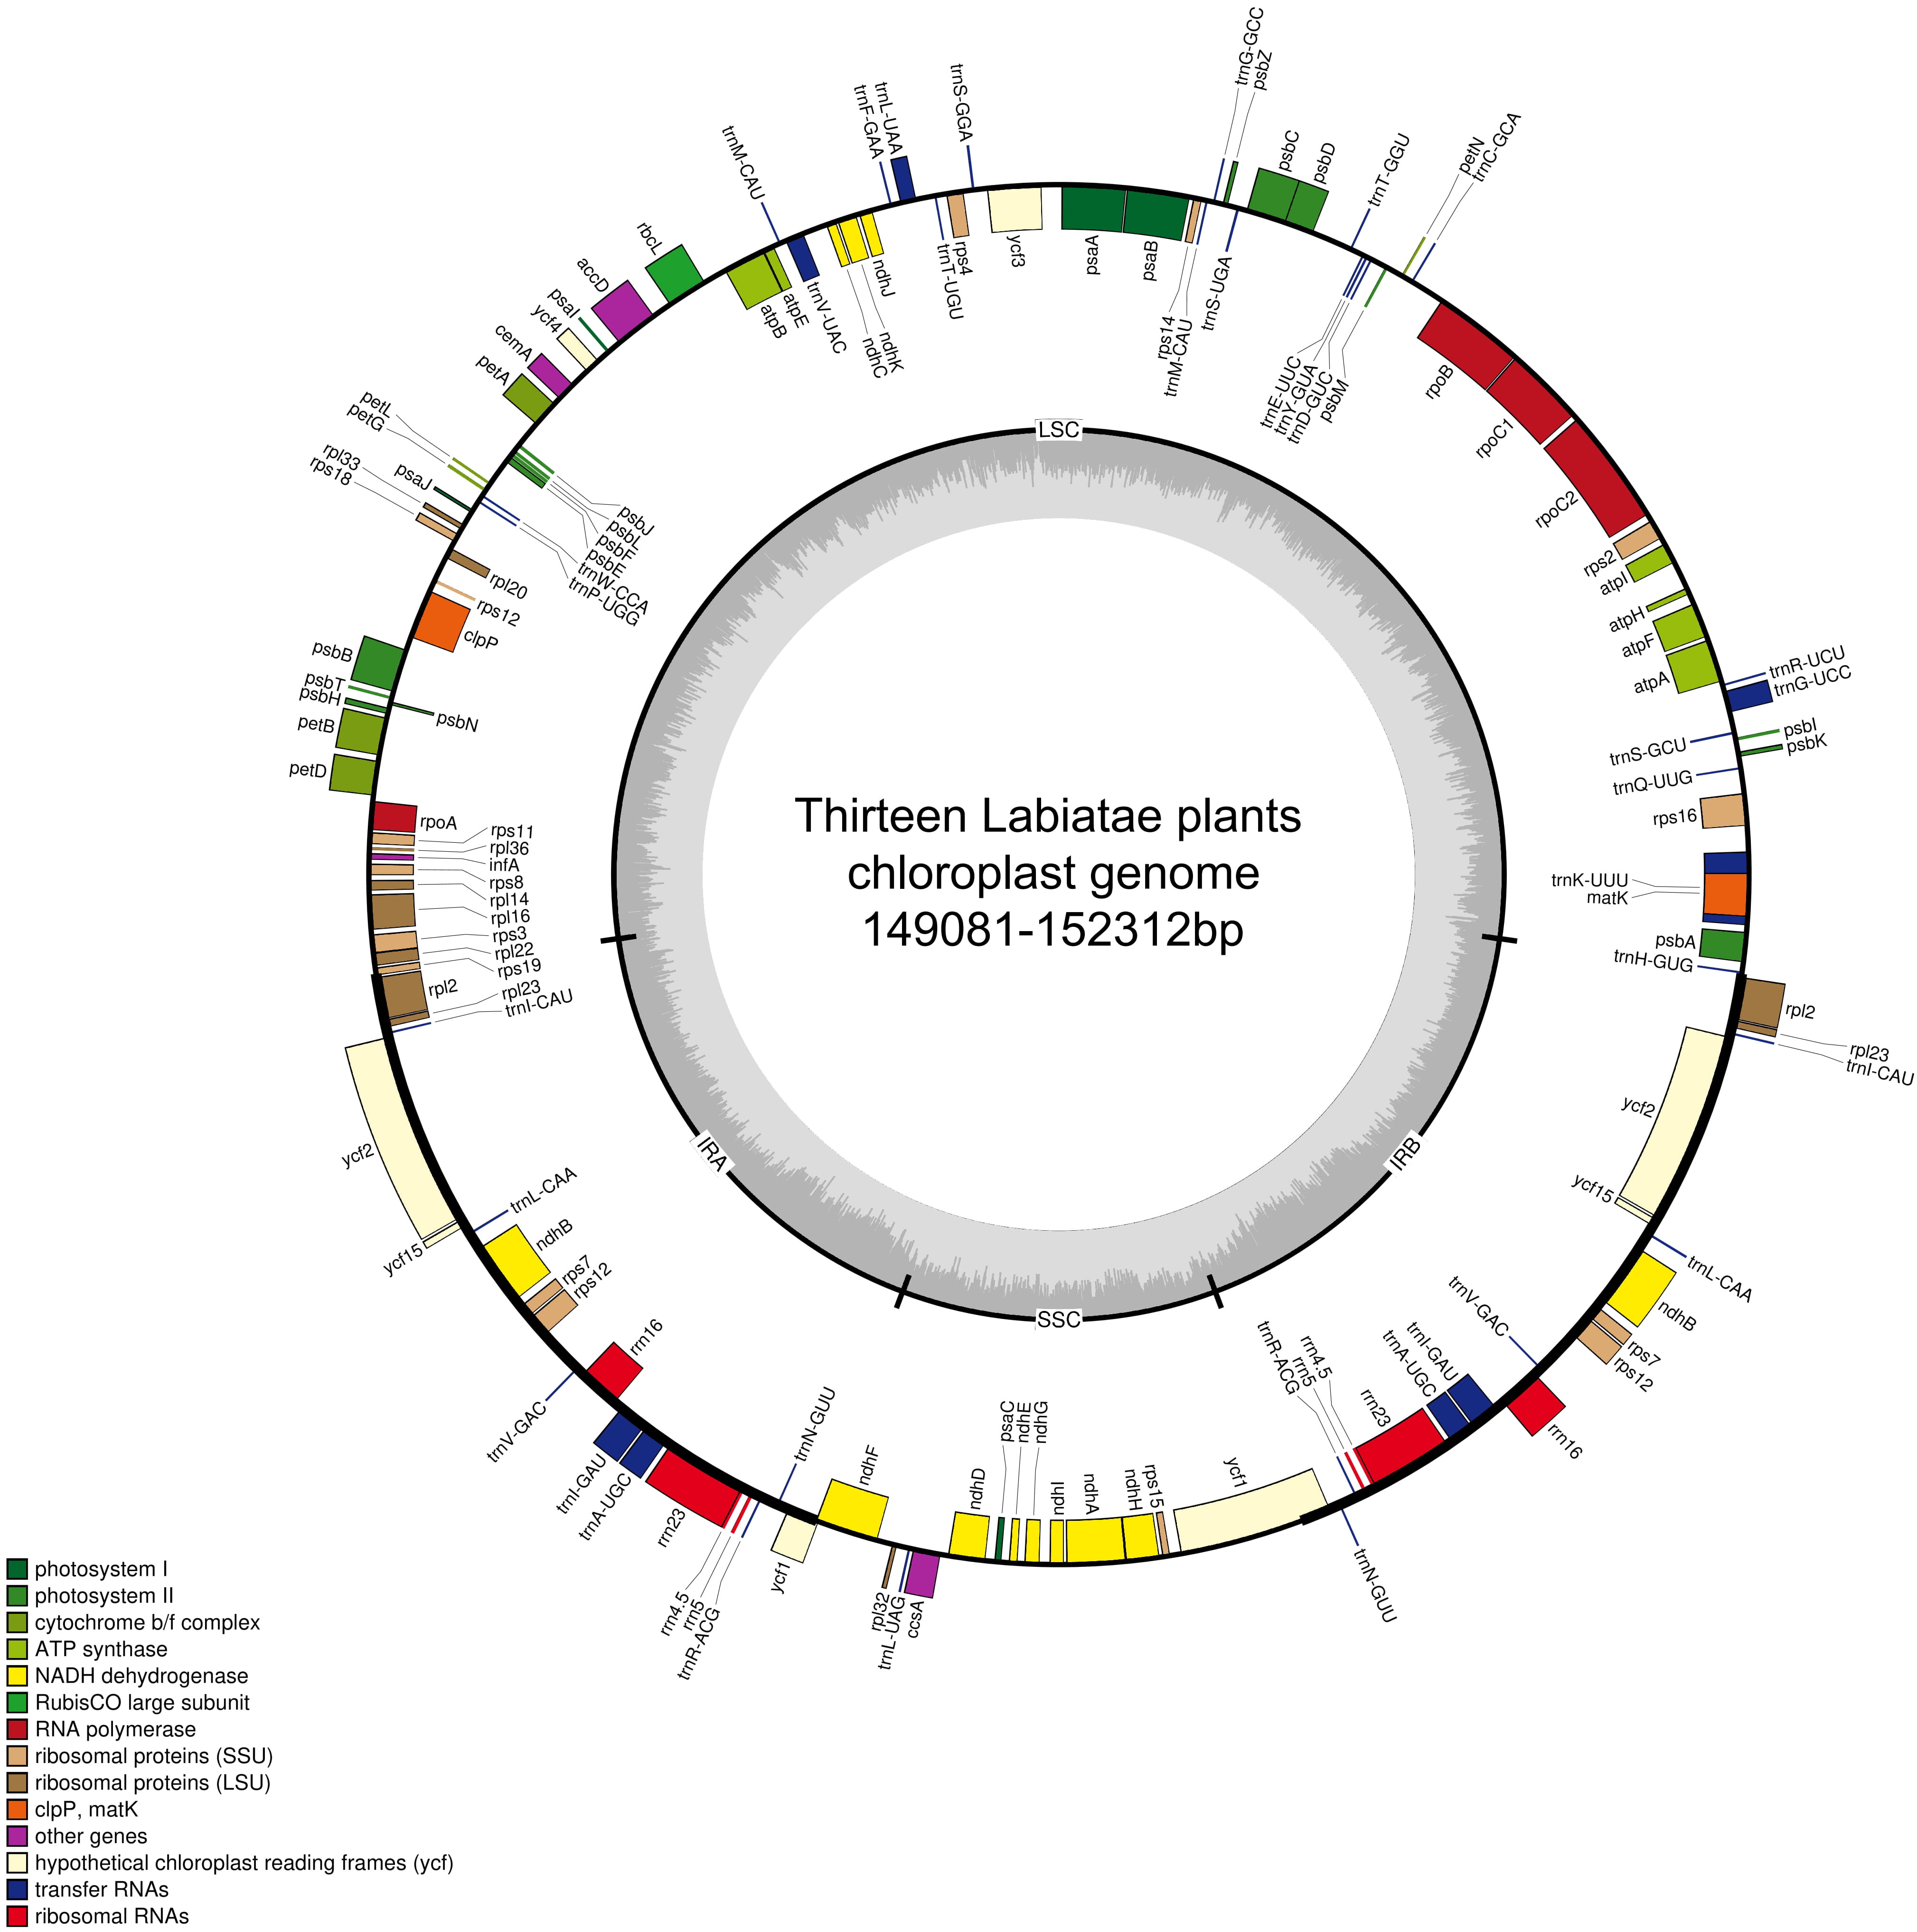 Fig. 2.
The cp genome map of 13 Lamiaceae species. Note: The black thick line indicates that the large single copy area (LSC) and small single copy area (SSC) were separated by two reverse repeat areas (IRa and IRb). The dark inner circle indicates the GC content in the chloroplast genome. Genes drawn inside the circle are transcribed clockwise, and those drawn outside the circle are transcribed counter clockwise.
The cp genome sequence of each species encoded 131–133 genes, including 88 protein–coding genes, 37 tRNA genes and 8 rRNA genes (Table 2). Taking the cp genome of A. nubigena as an example, the encoded genes can be divided into various types according to their product functions. There were 49 genes associated with photosynthesis, of which four genes (ycf1, ycf15, ycf2 and ndhB) had two copies. Fifty–nine genes were involved in self–replication, 16 of which had two copies. There were also five additional genes (Table 3). In 12 of the species, except for E. densa, there were 20 multicopy genes, and 18 genes (trnK–UUU, rps16, trnG–UCC, atpF, rpoC1, ycf3, trnL–UAA, trnV–UAC, clpP, petB, petD, rpl16, rpl2, ndhB, rps12, ndhA, trnA–UGC, trnI–GAU) contained one or two introns. Among the 18 genes, three (rps12, clpP, ycf3) contained two introns. E. densa has an extra gene (trnH–GUG) that contains an intron, which is consistent with previous studies [22].
| Species | Size | Length (LSC) | Length (SSC) | Length (IR) | GC% | PCGs | tRNAs | rRNAs | Genes |
|---|---|---|---|---|---|---|---|---|---|
| A. nubigena Diels | 150,490 | 82,153 | 17,177 | 25,580 | 38.27 | 88 | 37 | 8 | 133 |
| E. densa Benth. | 149,081 | 81,483 | 17,364 | 25,117 | 37.92 | 86 | 37 | 8 | 131 |
| E. eriostachya Benth. | 148,288 | 80,908 | 17,468 | 24,956 | 38.18 | 88 | 37 | 8 | 133 |
| E. fruticosa (D. Don) Rehd. | 151,583 | 82,812 | 17,495 | 25,638 | 37.96 | 88 | 37 | 8 | 133 |
| G. bifida Boenn. | 152,210 | 83,302 | 17,572 | 25,668 | 37.88 | 88 | 37 | 8 | 133 |
| M.s complanatum (Dunn) A. L. Budantzev. | 151,834 | 82,917 | 17,671 | 25,623 | 38.47 | 88 | 37 | 8 | 133 |
| N. dentata C. Y. Wu et Hsuan. | 152,312 | 83,416 | 17,692 | 25,602 | 37.85 | 88 | 37 | 8 | 133 |
| N. hemsleyana Oliver ex Prain. | 151,893 | 83,258 | 17,407 | 25,614 | 37.95 | 88 | 37 | 8 | 133 |
| N. laevigata (D. Don) Hand.–Mazz. | 152,177 | 83,214 | 17,611 | 25,676 | 37.86 | 88 | 37 | 8 | 133 |
| N. thomsonii Benth. ex Hook. f. | 151,985 | 82,790 | 17,615 | 25,790 | 37.83 | 87 | 38 | 8 | 133 |
| P. betonicoides (Diels) Kamelin & Makhm. | 151,794 | 83,205 | 17,389 | 25,600 | 38.49 | 88 | 37 | 8 | 133 |
| S. sikkimensis Stib. | 151,104 | 82,369 | 17,559 | 25,588 | 37.97 | 88 | 37 | 8 | 133 |
| T. linearis Benth. | 151,828 | 82,941 | 17,675 | 25,606 | 37.86 | 88 | 37 | 8 | 133 |
| Category | Group | Genes |
| Photosynthetic | Subunits of photosystem I | psaA,psaB,psaC,psaI,psaJ,ycf1(x2),ycf15(x2),ycf2(x2),ycf3**,ycf4 |
| Subunits of photosystem II | psbA,psbB,psbC,psbD,psbE,psbF,psbH,psbI,psbJ,psbK,psbL,psbM,psbN,psbT,psbZ | |
| Subunits of NADH dehydrogenase | ndhA*,ndhB*(x2),ndhC,ndhD,ndhE,ndhF,ndhG,ndhH,ndhI,ndhJ,ndhK | |
| Subunits of cytochrome b/f complex | petA,petB*,petD*,petG,petL,petN | |
| Subunits of ATP synthase | atpA,atpB,atpE,atpF*,atpH,atpI | |
| large subunit of RubisCO | rbcL | |
| Self–replication | Large subunit of ribosomal | rpl14,rpl16*,rpl2*(x2),rpl20,rpl22,rpl23(x2),rpl32,rpl33,rpl36 |
| Samll subunit of ribosomal | rps11,rps12**(x2),rps14,rps15,rps16*,rps18,rps19,rps2,rps3,rps4,rps7(x2),rps8 | |
| Subunits of RNA polymerase | rpoA,rpoB,rpoC1*,rpoC2 | |
| Ribosomal RNAs | rrn16(x2),rrn23(x2),rrn4.5(x2),rrn5(x2) | |
| Transfer RNAs | trnA–UGC*(x2),trnC–GCA,trnD–GUC,trnE–UUC,trnF–GAA,trnG–GCC,trnG–UCC*,trnH–GUG | |
| Tanskational initiation factor | infA | |
| Other | Protease | clpP** |
| Maturase | matK | |
| Envelope membrance protein | cemA | |
| c–type cytochrome synthesis gene | ccsA | |
| Subunit of Acetyl–CoA–carboxylase | accD |
Note: The parentheses stand for multi–copy genes; * and ** refer to genes containing 1 intron and 2 introns, respectively; # represents the specific gene of E. miltiorrhiza.
A total of 34–57 simple repeat sequences of 6 types were detected in the 13 cp genomes, among which E. fruticosa had the highest SSR number and M. complanatum and N. hemsleyana had the lowest SSR numbers (Fig. 3). Among the six types of repeats, single–nucleotide repeats accounted for the highest proportion (61.07%), followed by dinucleotide (16.42%) and tetranucleotide (16.78%) repeats. Trinucleotide, pentanucleotide and hexanucleotide repeats accounted for 3.50%, 2.02% and 0.18%, respectively. Only one hexanucleotide repeat was detected in G. pseudogentiana. The length of single–nucleotide tandem repeats accounted for 41.88% of the total sequence length, followed by the trinucleotide sequence length (30.26%), dinucleotide sequence length (15.87%) and pentanucleotide sequence length (9.96%). The tetranucleotide sequence length accounted for 2.03%. In single–nucleotide sequences, A/T accounted for 97.58%.
 Fig. 3.
Type and number of SSRs in cp genome of 13 Lamiaceae species.
SSR sequences were not evenly distributed in these cp genomes. They were distributed mostly in the LSC region, accounting for approximately 65–85%, while the remaining 15–35% were distributed in the LSC and IR regions. The SSR sequences of E. fruticosa, M. complanatum and P. betonicoides were not distributed in the IR region. SSR loci showed high polymorphism in the cp genomes of the 13 Lamiaceae plants, which provided a basis for the subsequent development of SSR molecular markers [22].
In the scattered long repeats in the cp genome, a total of 477 long repeats were detected in the 13 species analysed by REPuter software. E. fruticosa had the largest number of long repeats, while E. densa had the smallest number (Fig. 4). There were four types of long repeats, including forward, palindromic, reverse and complement. Among them, E. fruticosa and E. densa had all four types. A. nubigena, E. eriostachya, G. bifida and S. sikkimensis only had forward and palindromic types; and the other seven species had forward, palindromic and reverse types.
 Fig. 4.
Long repeats in the cp genomes of 13 Lamiaceae species.
The RSCU value refers to the ratio between the actual usage frequency of a
certain codon and its theoretically expected usage frequency, which is often used
as an important parameter to measure codon bias. An RSCU value
During plant evolution, genes are affected by nonsynonymous substitutions (Ka)
and synonymous substitutions (Ks). The ratio Ka/Ks can be used to indicate the
evolutionary rate to determine whether gene sequences have selective pressure in
the process of evolution [45]. When Ka = Ks, the gene is not under selective
pressure; when Ka
 Fig. 5.
Analysis of gene selection pressure of 13 Lamiaceae species. Note: The x–axis represents the gene, and the y–axis represents the value of Ka/Ks.
Nucleotide diversity (Pi) values were calculated to identify divergence
hotspots. With Pi values ranging from 0.000 to 0.230, a total of 754 variation
sites were detected (Fig. 6). In addition, there were 8 variation sites with Pi
values
 Fig. 6.
Nucleotide diversity analysis of 13 Lamiaceae species.
The expansions and contractions of the IR regions often result in genome size variations among various plant lineages. Therefore, the analysis of the boundary changes of the cp genome can reflect the evolutionary process [46]. In the cp genomes of N. laevigata, rpl22/trnH and trnH/psbA were located on the two sides of the LSC/IRb and LSC/IRa boundaries, respectively (Fig. 7). In the cp genomes of other species, rps19/rpl2 and rpl2/trnH were discovered on the two sides of the two boundaries. The expansion of the IR boundary allows it to enter the coding regions of nearby genes, which will lead to the formation of pseudogenes in the other IR copy region due to the inverted repeat characteristic of IR [23]. In this study, the LSC/IRb boundary entered the coding region of the rps19 gene, and the SSC/IRa boundary entered the coding region of the ycf1 gene; therefore, both ycf1 and rps19 became pseudogenes. The IR boundaries of the cp genomes of the other 12 Lamiaceae species except N. laevigata were essentially conserved, suggesting that the evolutionary direction of N. laevigata may be different from those of the other 12 species.
 Fig. 7.
Comparative analysis of cp genome boundary regions (LSC, SSC, IR) in 13 Lamiaceae species. Note: The coloured squares indicate that the large single copy (LSC) area and the small single copy (SSC) area are separated by two reverse repeat areas (IRa and IRb). JLB (LSC and IRb boundary), JSB (IRb and SSC boundary), JSA (SSC and IRa boundary), JLA (IRa and lSC boundary).
The order of genes in the 13 cp genomes were essentially identical, no rearrangement or inversion were detected among these genomes (Supplementary Fig. 2).
To investigate intergeneric differences among cp genomes, the identity percentage of these species was plotted using the mVISTA program, taking the cp genome of A. nubigena as a reference. A high degree of similarity was detected among the 13 cp genomes. More variations were detected in the LSC/SSC region than in the IR region. The variation in the non–coding region was significantly higher than that in the coding region, indicating that the 13 cp genomes were conserved (Supplementary Fig. 3).
In this study, we constructed an ML phylogenetic tree (Fig. 8) and analysed the genetic relationship. During sequence alignment, the alignment length was 18,755,965 bp. The results showed that all species comprise eight clades, which consisted of the Nepetoideae subfamily, Lamioideae subfamily, Ajugoideae subfamily, Scutellarioideae subfamily, Premnoideae subfamily, Viticoideae subfamily, Tectona genus, and Callicarpa genus (Fig. 8). The major clade made from the Nepetoideae subfamily was composed of species of 12 genera, e.g., the Salvia, Melissa and Mentha genera; the Viticoideae subfamily was composed of the Vitex genus; the Lamioideae subfamily was composed of species of 13 genera, e.g., the Stenogyne, Phyllostegia and Haplostachys genera; the Scutellarioideae subfamily was composed of the Scutellaria and Holmskioldia genera; the Ajugoideae subfamily was composed of species of four genera, e.g., the Ajuga, Teucrium and Caryopterisgenera; and the Premnoideae subfamily was composed of the Gmelina and Premna genera. These results are consistent with the findings of Li [47]. Except for three branch nodes, the bootstrap value of each node was greater than 70, indicating that the constructed ML tree was reliable. In addition, 97 species could also be divided into eight tribes (Fig. 8). Except for Lamium galeobdolon (NC036972.1) which was not clustered with the Lamium genus, the phylogenetic relationships of other species in the ML tree at the tribe level were consistent with those in Li’s study [47].
 Fig. 8.
The ML phylogenetic tree of cp genomes of 97 Lamiaceae species. Note: Coloured squares represent subfamilies and genera, coloured horizontal lines represent families. Brown fonts represent sister groups and orange fonts represent the complex group.
The cp genomes of 13 Lamiaceae plants in Tibet were sequenced and characterized for the first time. Their structure, length and GC content were similar to those of other Lamiaceae species [22, 23, 24, 25, 26]. Similar to previous reports [15, 47], the rps12, clpP and ycf3 genes all contained two introns.
In the cp genomes of 12 species, 133 genes were annotated. However, the cp genome of E. densa had only 131 genes because one trnM–CAU gene and two ycf2 genes were missing, and one trnfM–CAU gene was added, which was consistent with a previous report on E. densa [10]. Compared with the published cp genome of E. densa [10], one more rps16 gene was detected in the cp genome assembled in this study. Although the deletion of the rps16 gene has also been found in some angiosperms [48], it was found in the cp genomes of other species in this study and other published cp genomes of the Lamiaceae. Structural variations and gene loss of cp genomes are important for the study of plant phylogeny.
The contraction and expansion at the boundary of the IR region can cause length changes in cp genomes [49]. In this study, N. laevigata showed a deletion of the rpl2 and rps19 genes, which was different from the other 12 species. The discovery of hypermutated regions in cp genomes is of great value in phylogenetic and population studies of related species [50]. Eight hypervariable regions (4810–5400, 7001–7600, 8001–8600, 71,801–72,400, 133,601–134,200, 135,401–136,000, 135,601–136,200, and 135,801–136,400) were identified by analysing nucleotide diversity, which can provide potential targets for the development of molecular markers and phylogenetic studies [51].
In this study, cp genomes were used to construct an ML phylogenetic tree of the Lamiaceae, and the results showed that the eight major clades corresponded to the subfamily classification of Li [47]. Except for one species, the phylogenetic relationships at the tribe level were also consistent with those in Li’s study [47]. Bendiksby [52] reconstructed the phylogenetic tree of the Lamiaceae subfamily using DNA fragments from the cp genomes and added a new clade, Galeopsis, based on the work of Li [47], which was also consistent with the classification results of this study. Among the species in this study, the genera Salvia, Thymus and Nepeta have a common ancestor and can be considered “sister groups”. The genera Galeopsis and Phlomoides belong to the subfamily Lamioideae and form a complex group, indicating that they have closer genetic relationships than other species, which is consistent with previous studies [47, 53, 54].
Morphological and geographical data can provide a better understanding of molecular phylogenetic classification. Among the species sequenced in this study, N. laevigata and N. thomsonii have round heart–shaped leaves and spikes. N. dentata has ovate–oblong leaves, N. hemsleyana has linear lanceolate leaves, and Marmoritis complanatum has ovate–round or kidney–like leaves. The five species of plants have the common morphological characteristics of the Nepeta genus, namely, the stems are prismatic, and the leaves are white pilose. In this study, the ML phylogenetic tree showed that N. laevigata and N. thomsonii constituted sister groups, and M. complanatum, N. dentata and N. hemsleyana formed sister groups with both of them. Therefore, the morphological characteristics verified the rationality of the molecular phylogenetic classification. From a geographical point of view, M. complanatum is mainly found in the mountains and rocks in the eastern area of Tibet. The special morphological characteristics of M. complanatum were caused by the parallel evolution of the Nepeta genus due to its geographical location [55]. They did not form sister groups, which was consistent with the relative relationships inferred from leaf morphology. Lamium galeobdolon and other species of the Lamiaceae tribe were not grouped together, though the cause remains to be determined.
This study shows that it is feasible to use cp genomes to classify species in the Lamiaceae at the subfamily and tribe levels, which is basically consistent with morphological classification and can provide a molecular basis for the study of the evolutionary relationships of the Lamiaceae species.
The datasets used and/or analysed during the current study are available from the first author upon reasonable request. Raw data for the cp genomes sequencing can be accessed by logging on to the website https://www.ncbi.nlm.nih.gov/.
These should be presented as follows: XW and ZM designed the research study. YN, QQ, YD, and SZ, performed the research. XW, QQ, YD, and SZ provided help and advice on paper writing. YN, XW, and QQ analysed the data. YN, QQ and XW wrote the manuscript. All authors contributed to editorial changes in the manuscript. All authors read and approved the final manuscript.
The plant materials of 13 species of the Lamiaceaeused in this study were collected from the Tibet Autonomous Region of China (Tibet) and identified by Professor Guoyue Zhong of Jiangxi University of Chinese Medicine (JUTCM). The certificate specimens were all stored in the herbarium of JUTCM.
Not applicable.
This research was funded by the Jiangxi University of Chinese Medicine Science and Technology Innovation Team Development Program (Grant CXTD22002).
The authors declare no conflict of interest.
Publisher’s Note: IMR Press stays neutral with regard to jurisdictional claims in published maps and institutional affiliations.