
- Academic Editor
Background: The purpose of our study is to analyze the expression pattern and prognostic value of catabolism-related enzymes of branched-chain amino acids (BCAAs) in non-small cell lung cancer (NSCLC). Methods: Differential expression analysis, mutation, copy number variation (CNV), methylation analysis, and survival analysis of BCAAs catabolism-related enzymes in NSCLC were performed using the Cancer Genome Atlas (TCGA) database. Results: Six and seven differentially expressed genes were obtained in lung adenocarcinoma (LUAD) and lung squamous cell carcinoma (LUSC), respectively. IL4I1 was located at the core regulatory nodes in the gene co-expression networks of both LUAD and LUSC. The AOX1 mutation rate was the highest in both LUAD and LUSC. For CNV, IL4I1 was up-regulated in both LUAD and LUSC with an increase in copy number, whereas AOX1 and ALDH2 were differentially regulated in the two subtypes of lung cancer. In patients with NSCLC, high expression of IL4I1 was associated with lower overall survival (OS), and low expression of ALDH2 predicted shorter disease-free survival (DFS). ALDH2 expression was related with LUSC survival. Conclusions: This study explored the biomarkers of BCAAs catabolism related to the prognosis of NSCLC, which provided a theoretical foundation to guide the clinical diagnosis and treatment of NSCLC.
Lung cancer is one of the malignant tumors with the highest morbidity and mortality worldwide and has become a major public health concern [1, 2]. Despite considerable progress in therapeutic strategies, the 5-year survival rate of lung cancer in China has remained between 10% and 20% over the past decade [3]. Therefore, the key to improving the survival rate for lung cancer is not only improving the treatment but also improving the level of screening and using more abundant analytical methods to find biomarkers that are closely related to the development and prognosis of lung cancer.
Branched-chain amino acids (BCAAs) include leucine, isoleucine, and valine. Plasma levels of BCAAs and their metabolic enzymes are expressed to varying degrees in multiple cancers and have a very close relationship with tumor occurrence and development. They are considered important markers for early tumor screening and prognosis, and provide a very meaningful research prospect for the development of novel therapeutic drugs in the direction of targeted treatment of amino acid metabolism enzymes [4, 5, 6, 7, 8, 9, 10]. However, there have been no systematic studies on the expression pattern of the BCAAs catabolic enzyme in non-small cell lung cancer (NSCLC) and its correlation with prognosis. Therefore, it is crucial to screen for key BCAAs catabolic enzymes to identify new biomarkers for the prognosis of NSCLC.
In this study, sets of catabolic enzyme genes related to BCAAs were established using the Kyoto Encyclopedia of Genes and Genomes (KEGG) pathway enrichment. Transcriptome and clinical data of lung adenocarcinoma (LUAD) and lung squamous cell carcinoma (LUSC) were obtained from the Cancer Genome Atlas (TCGA) database. Based on the multidimensional bioinformatic analysis, the expression pattern of the BCAAs catabolic enzyme in NSCLC and its correlation with prognosis were explored to identify novel biomarkers for the prognosis of NSCLC and to provide references for the future active exploration and development of new therapeutic targets for NSCLC.
The KEGG database (https://www.kegg.jp/kegg/pathway.html) was used to search the catabolism pathways of human BCAAs. The valine, leucine and isoleucine degradation pathway is diaplayed in Supplementary Fig. 1. In total, 44 gene sets of related metabolic enzymes were identified as the main study objects (Supplementary Fig. 2). The transcriptome profiles and corresponding clinical information of LUAD, LUSC, and adjacent normal tissues were downloaded from the TCGA (http://tcga-data.nci.nih.gov/) dataset using the RTCGAToolbox 2.28.0 package in R 4.2 software.
The data were transformed from fragments per kilobase of exon per million reads
mapped (FPKM) value, and log
The mutation data were processed and visualized using the maftools 2.14.0 R
package (https://github.com/PoisonAlien/maftools). For CNV, the loss and gain of
copy numbers have been identified using the Genomic Identification of Significant
Targets in Cancer (GISTIC) algorithm. The 5-valued spectrum (–2, –1, 0, 1, 2)
was used to indicate changes in CNV. –2, –1, 0, 1, and 2 represent homozygous
deletion of copy number, heterozygous deletion of copy number, no variation in
copy number, amplification of low-dose copy numbers and amplification of
high-dose copy numbers, respectively. Due to the noise of low-dose amplification
or deletion, we mainly referred to copy number changes of 2 and –2 in the
analysis, taking 2 as amplification and –2 as deletion, while others considered
copy number unchanged. For methylation analysis, ChAMP 3.8 in the R package was
used to filter the data, fill in the missing values, and calculate the
differential methylation probe and the differential methylation region.
Differential methylation sites between lung cancer and normal lung tissues were
obtained using limma 3.38.2 in the R package. The Benjamini and Hochberg multiple
testing methods were applied to acquire the FDR. The FDR of
SPSS 22.0 statistical software (IBM Corp., Armonk, NY, USA) was used for the
survival analysis. The Kaplan-Meier curve and the logarithmic rank test were used
to evaluate high and low gene expression in overall survival (OS) and
disease-free survival (DFS). The Cox proportional hazard regression model was
used to perform univariate and multivariate analyse of independent risk factors
related to postoperative OS in lung cancer patients to calculate the risk ratio
(HR) and 95% confidence interval (CI). Statistical results with FDR
Gene expression profiles and corresponding clinical data for NSCLC were obtained
from the TCGA database. In this study, 505 LUAD tissues and 59 normal adjacent
samples from patients with LUAD, and 501 LUSC tissues and 51 normal adjacent
samples from patients with LUSC were included. We analyzed the expression of 44
BCAAs catabolic enzymes between NSCLC and normal lung tissues. Hierarchical
clustering analysis of 44 BCAAs catabolism-related enzymes in LUAD and LUSC is
shown in Fig. 1A,B, respectively. As shown in Fig. 2A,B, compared to
normal lung tissues, there were six differentially expressed genes
(ALDH1B1, ACAD8, IL4I1, OXCT2, ALDH2, and AOX1) and seven
differentially expressed genes (OXCT1, EHHADH, IL4I1, ALDH2, ACAA2, AOX1
and HMGCS2) in LUAD and LUSC, respectively, with statistical
significance (FDR
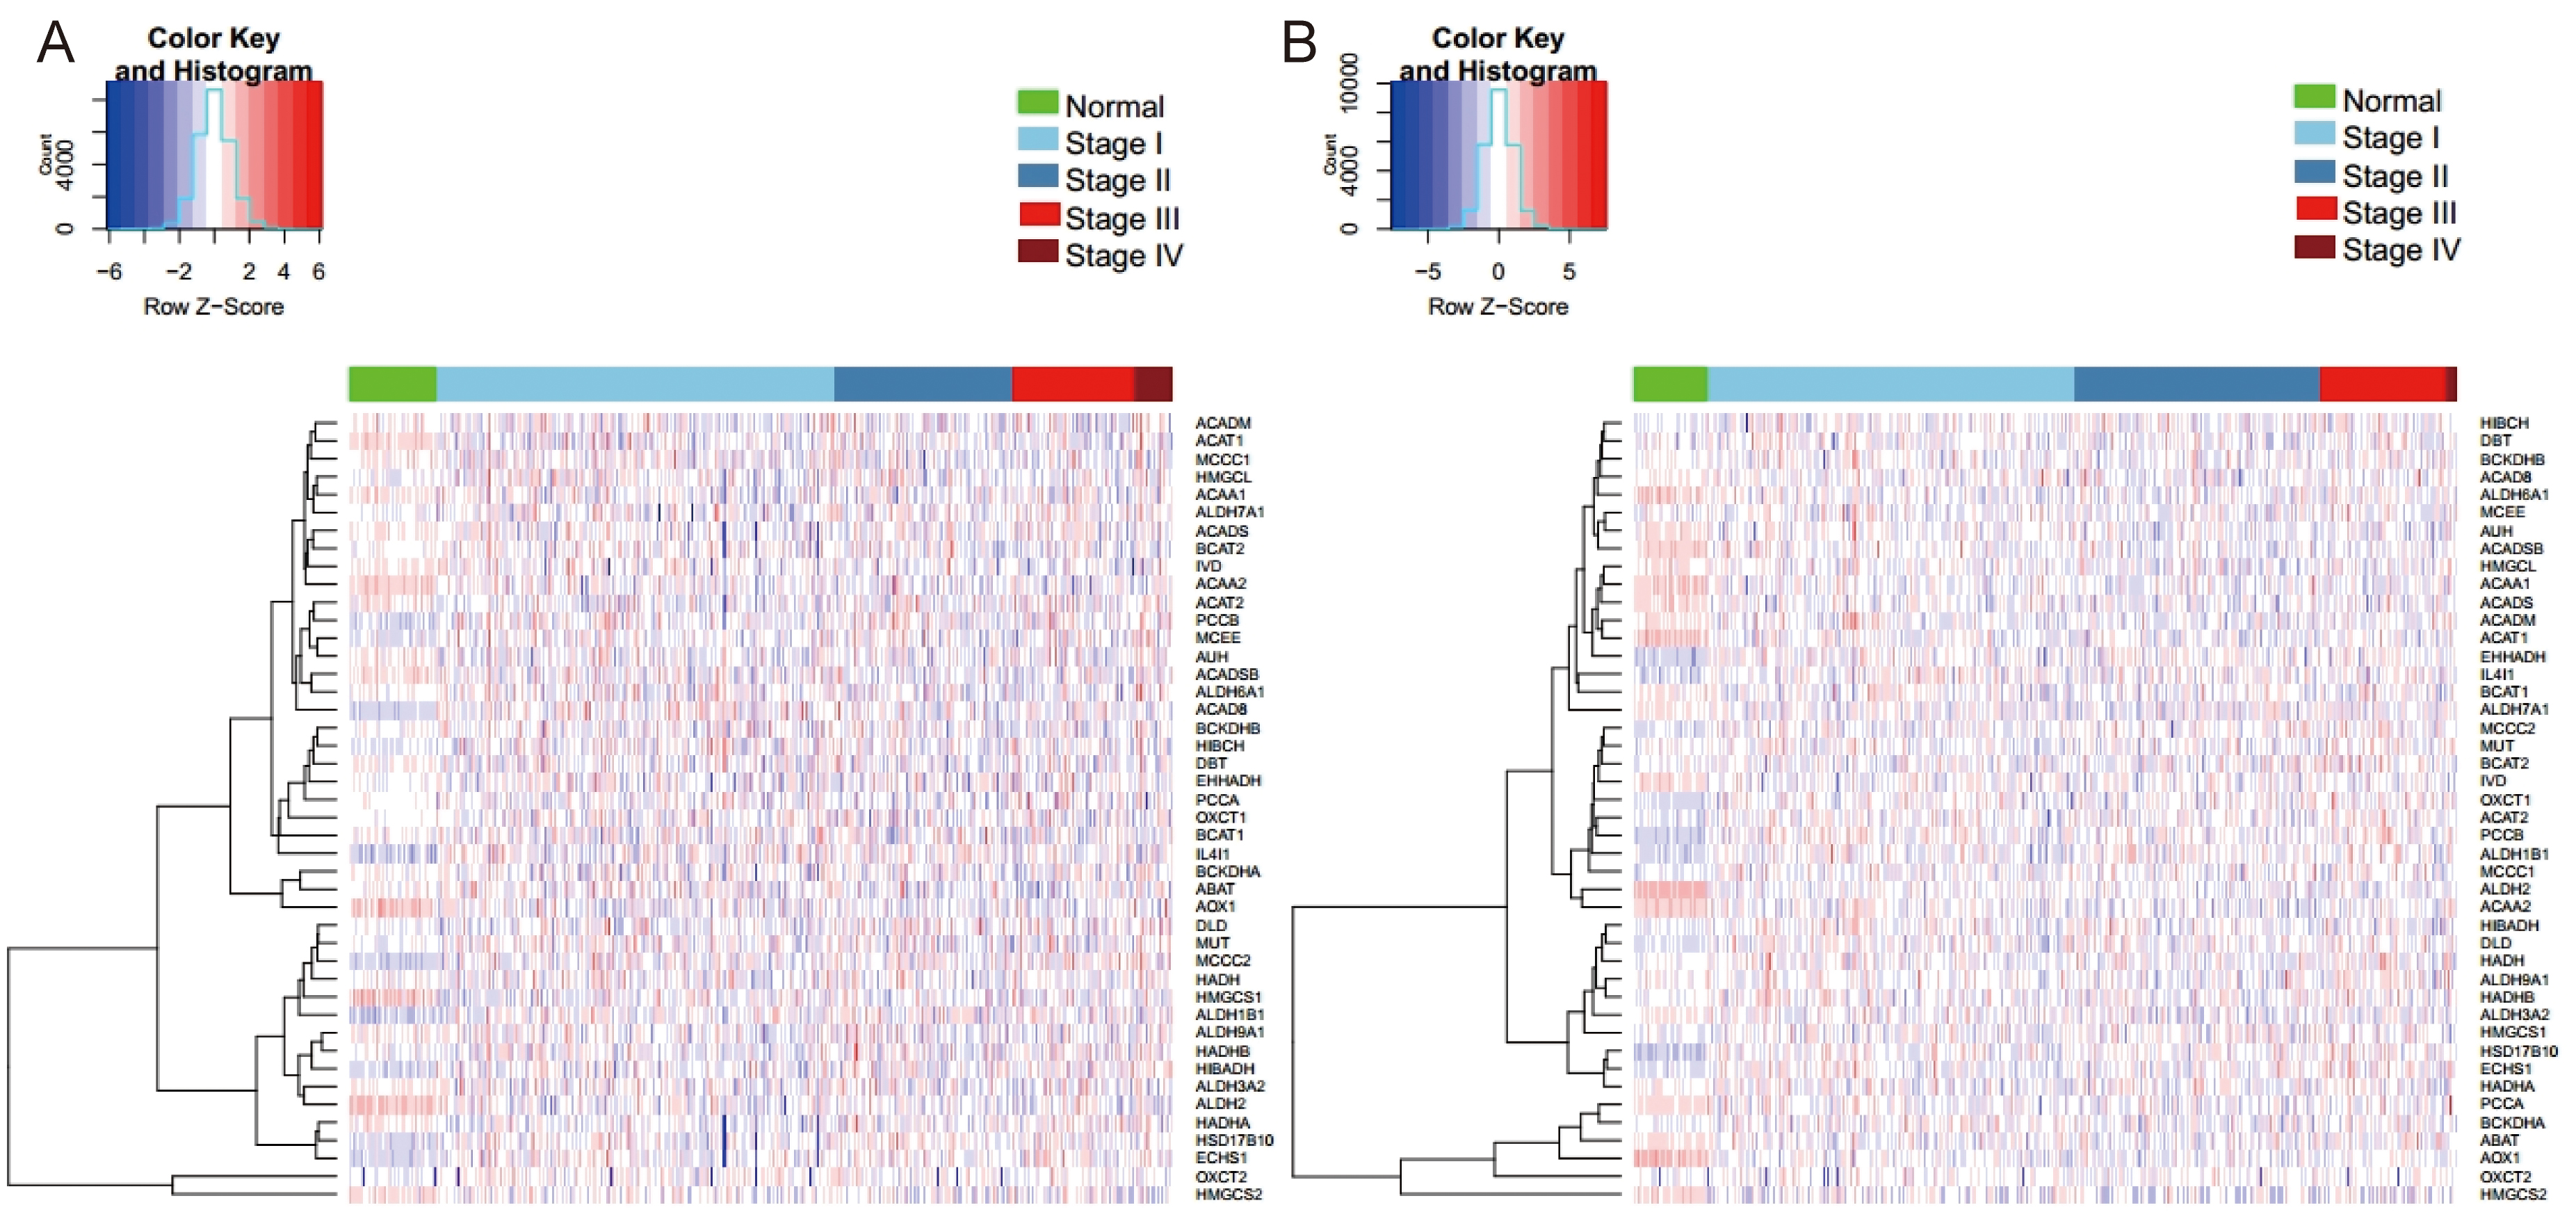 Fig. 1.
Hierarchical cluster analysis of 44 BCAAs catabolism-related enzymes in NSCLC. (A) LUAD. (B) LUSC. Row and column represented BCAAs catabolism-related enzymes and samples, respectively. The color scale indicated the expression of BCAAs catabolism-related enzymes.
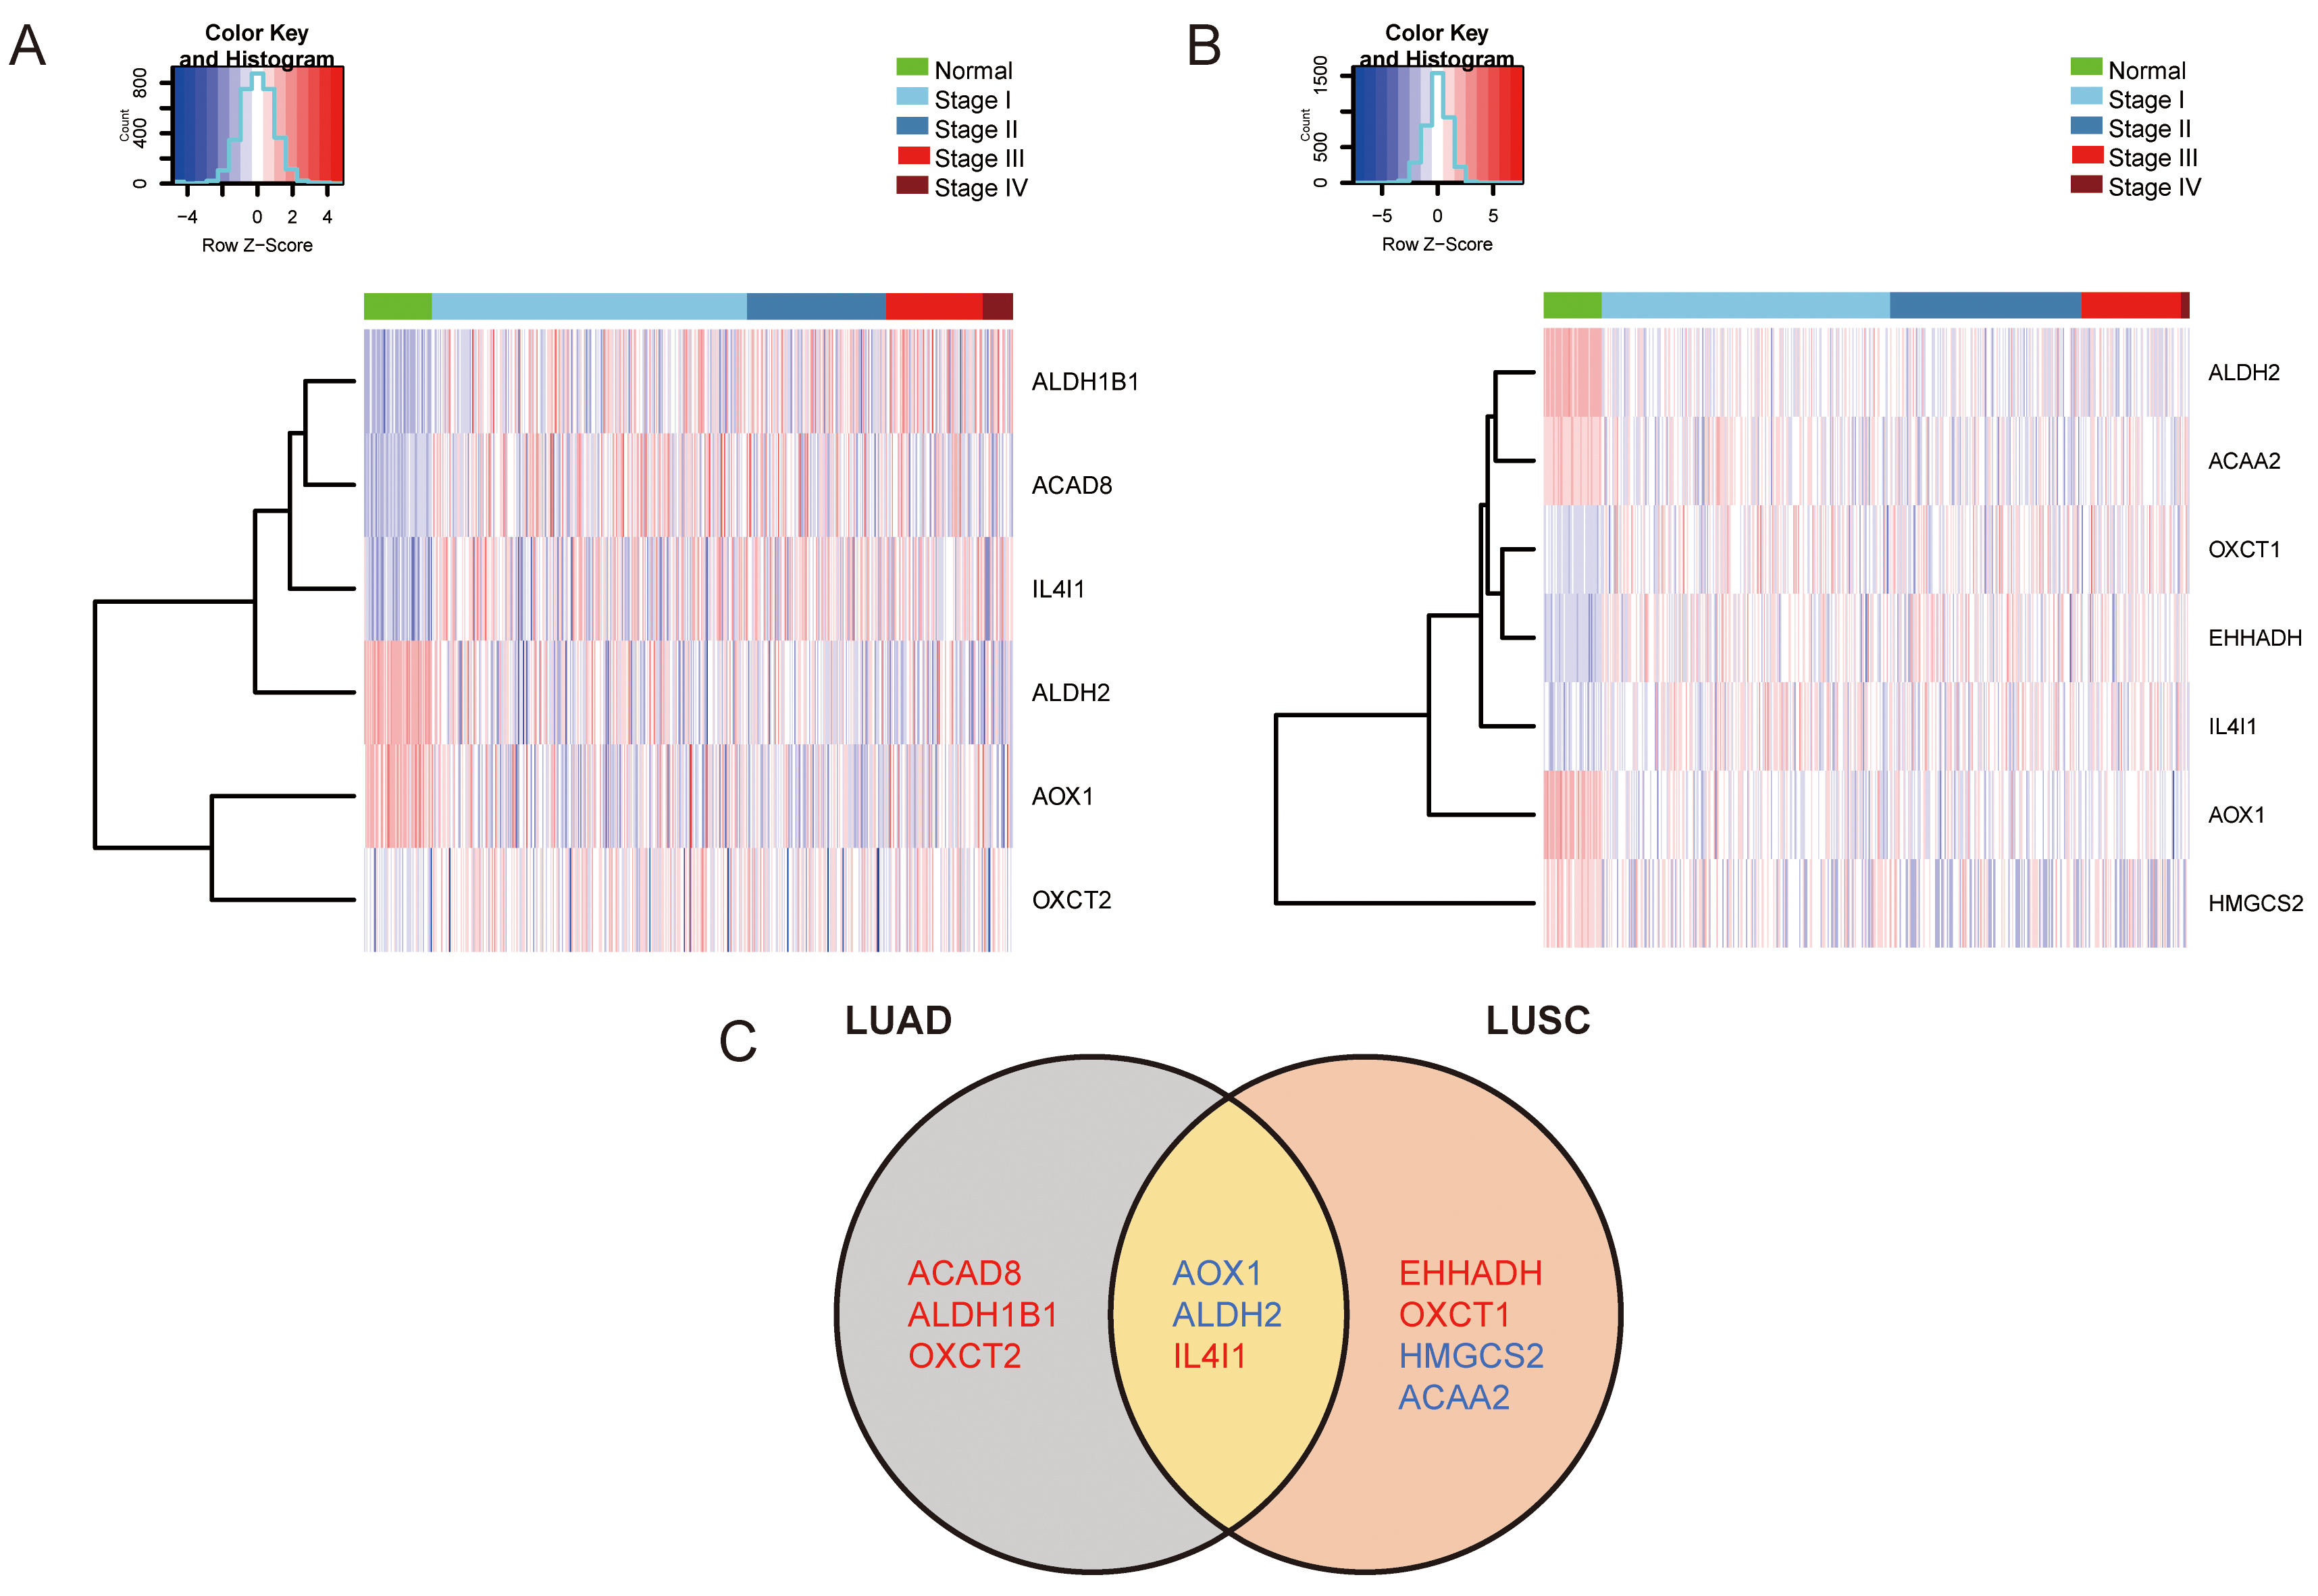 Fig. 2.
Significantly differentially expressed BCAAs catabolism-related enzymes in NSCLC. (A) Hierarchical cluster analysis of significantly differentially expressed BCAAs catabolism-related enzymes in LUAD. (B) Hierarchical cluster analysis of significantly differentially expressed BCAAs catabolism-related enzymes in LUSC. (C) Venn diagram of significantly differentially expressed BCAAs catabolism-related enzymes in LUAD and LUSC. Blue and red represent down-regulation and up-regulation, respectively.
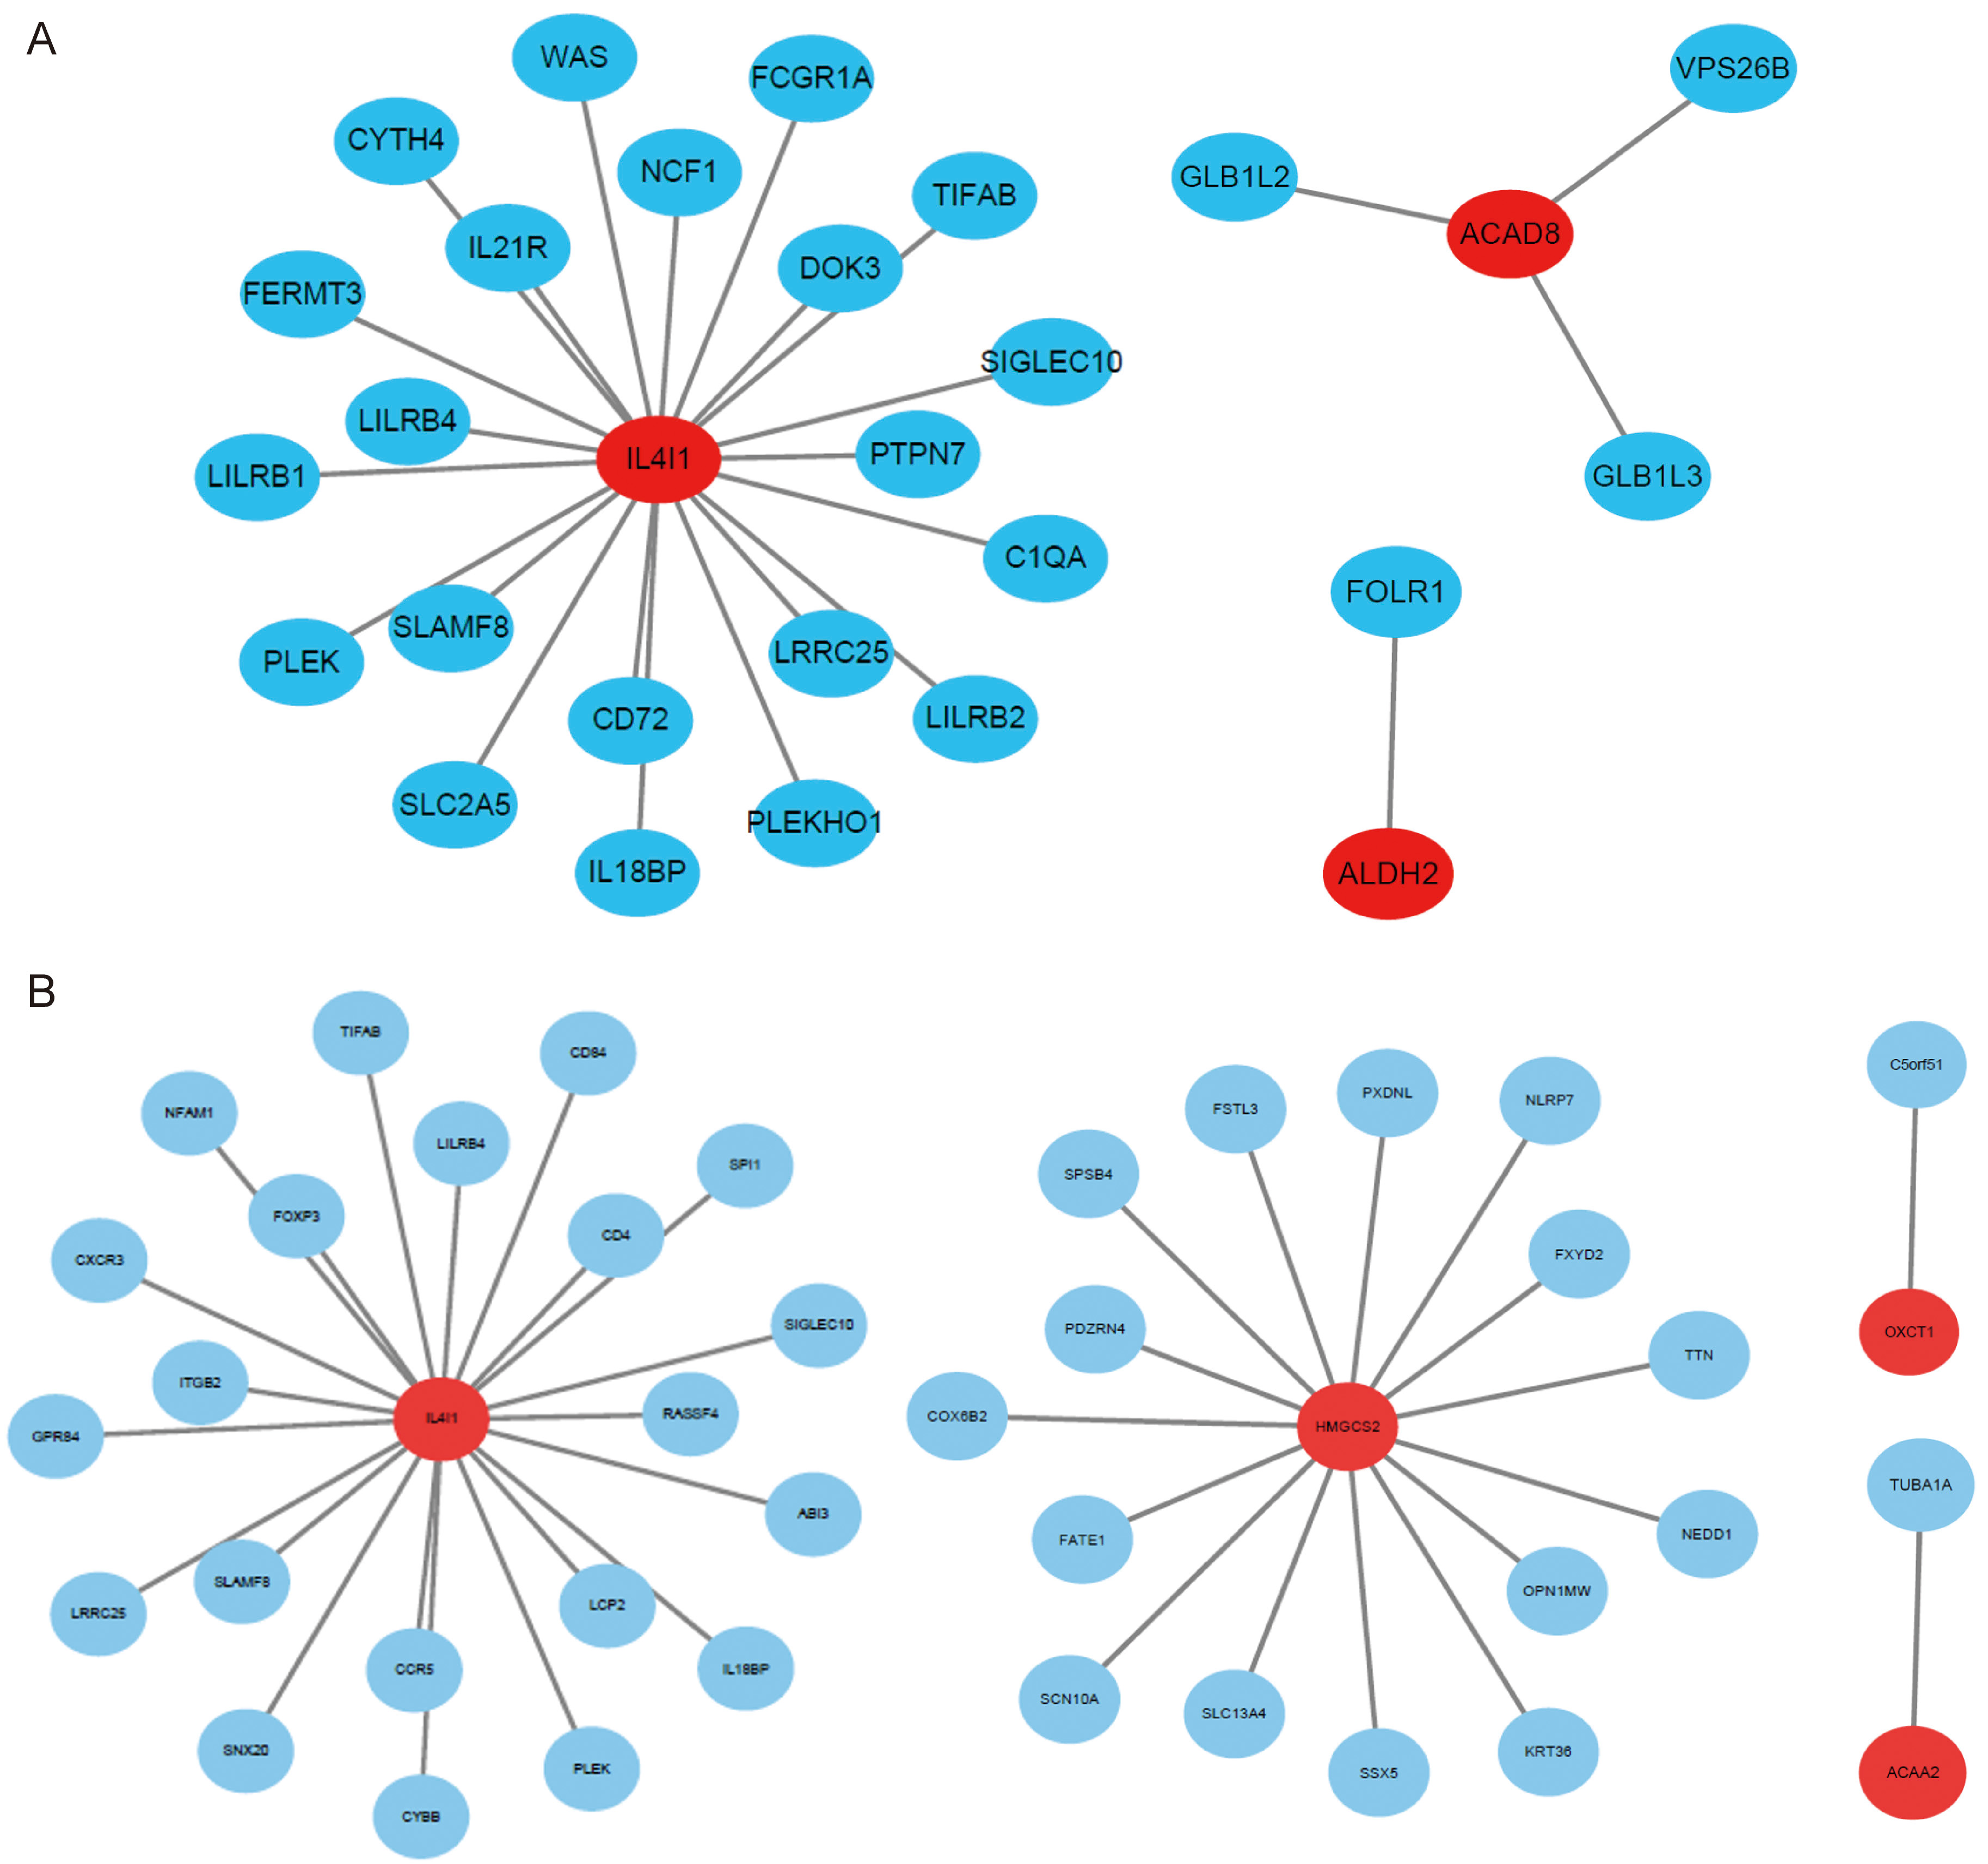 Fig. 3.
Gene co-expression network of significantly differentially expressed BCAAs catabolism-related enzymes in NSCLC. (A) LUAD. (B) LUSC. Ellipses were used to represent nodes, and lines were used to represent edges.
The mutation information for each gene in each sample is displayed in a waterfall plot, where various colors with annotations at the bottom represent the different types of mutations (Fig. 4). Somatic mutations were found in 66 (28.7%) of 230 LUAD samples, and somatic mutations occurred in 36 (81.8%) of 44 enzymes related to the catabolism of BCAAs in 66 patients with somatic mutations (Fig. 4A). Among these, the AOX1 mutation rate was the highest (3%, 7/230). As showed in Fig. 4B, somatic mutations were found in 59 (33.15%) of 178 LUSC samples, and somatic mutations occurred in 37 (84.1%) of the 44 BCAAs catabolism-related enzymes in 59 patients with somatic mutations. Among these, the AOX1 mutation rate was the highest (6.7%, 12/178).
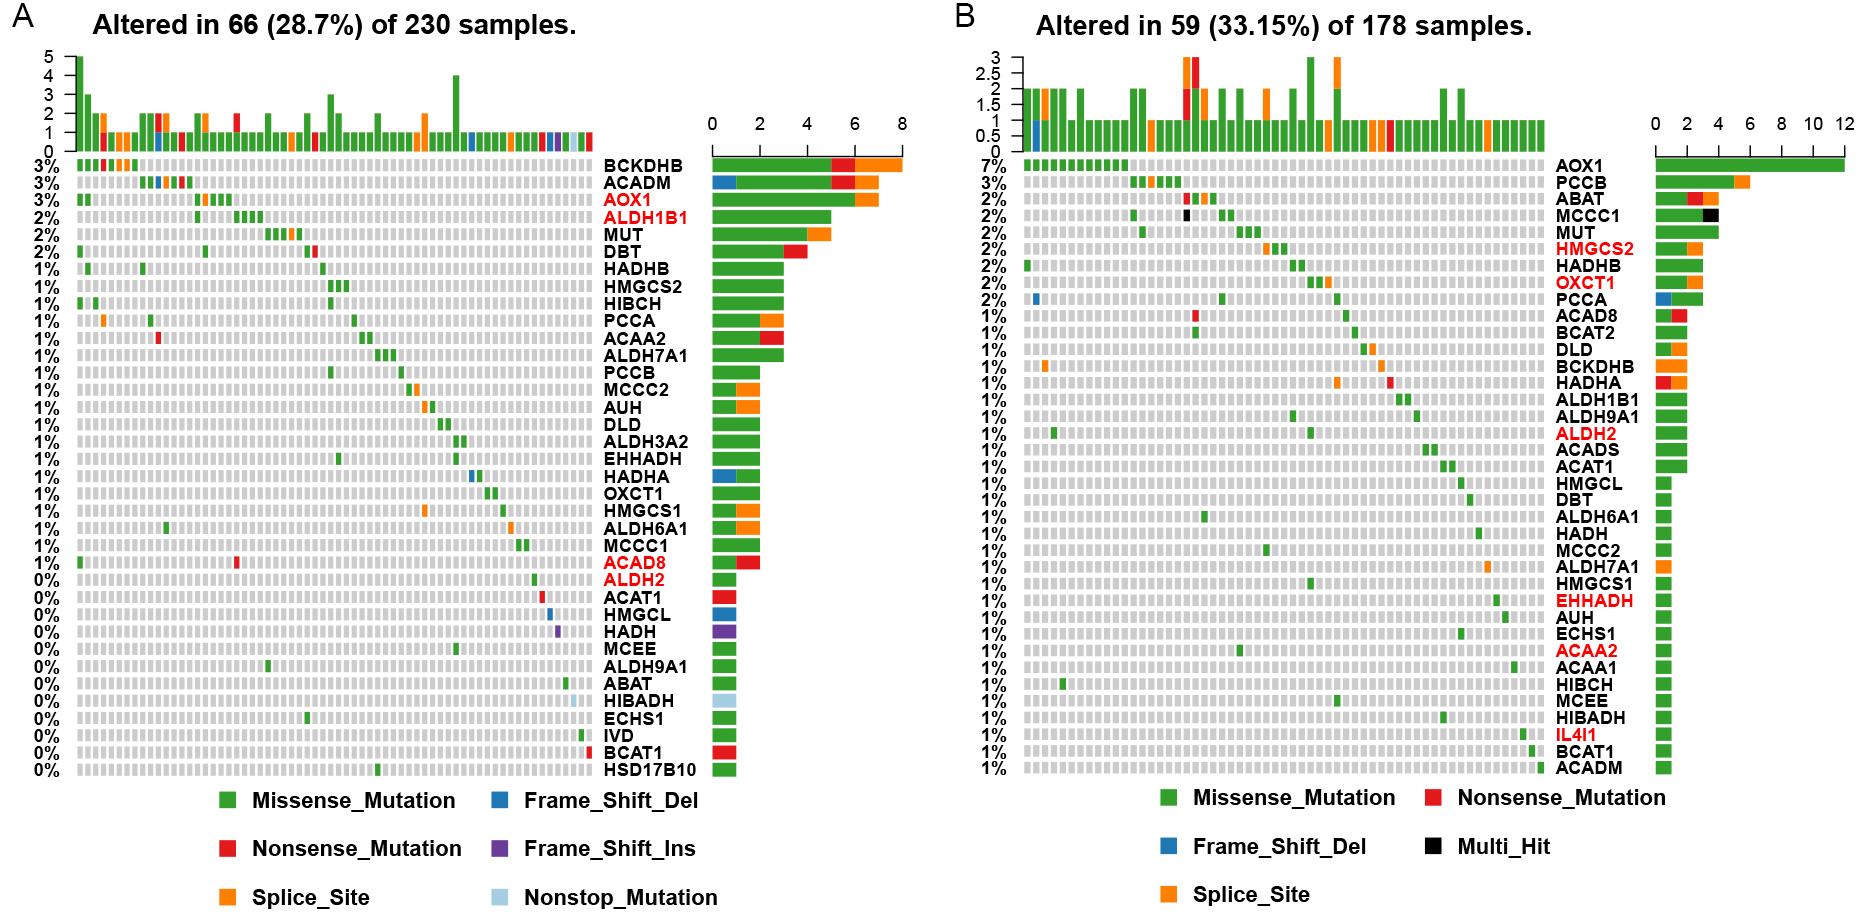 Fig. 4.
Mutation of significantly differentially expressed BCAAs catabolism-related enzymes in NSCLC. (A) LUAD. (B) LUSC. The red font shows significantly differentially expressed BCAAs catabolism-related enzymes.
We then evaluated the CNV patterns of the differentially expressed genes in LUAD and LUSC. We found that OXCT2, AOX1, ACAD8, ALDH2, and IL4I1 were mainly copy number amplifications in LUAD, whereas ALDH1B1 was mainly a copy number deletion (Table 1). In LUSC, EHHADH, OXCT1, AOX1, IL4I1, and HMGCS2 showed copy number amplification, whereas ACAA2 and ALDH2 displayed copy number deletions (Table 2). According to the correlation analysis of CNV and gene expression levels, IL4I1, ACAD8, and OXCT2 were up-regulated in LUAD with an increase in copy number, whereas ALDH2, ALDH1B1, and AOX1 were oppositely regulated (Fig. 5A). IL4I1, OXCT1, and EHHADH were up-regulated in LUSC with increasing copy number; ACAA2 and ALDH2 were down-regulated with deletion of copy number; and HMGCS2 and AOX1 were down-regulated with increased copy number (Fig. 5B).
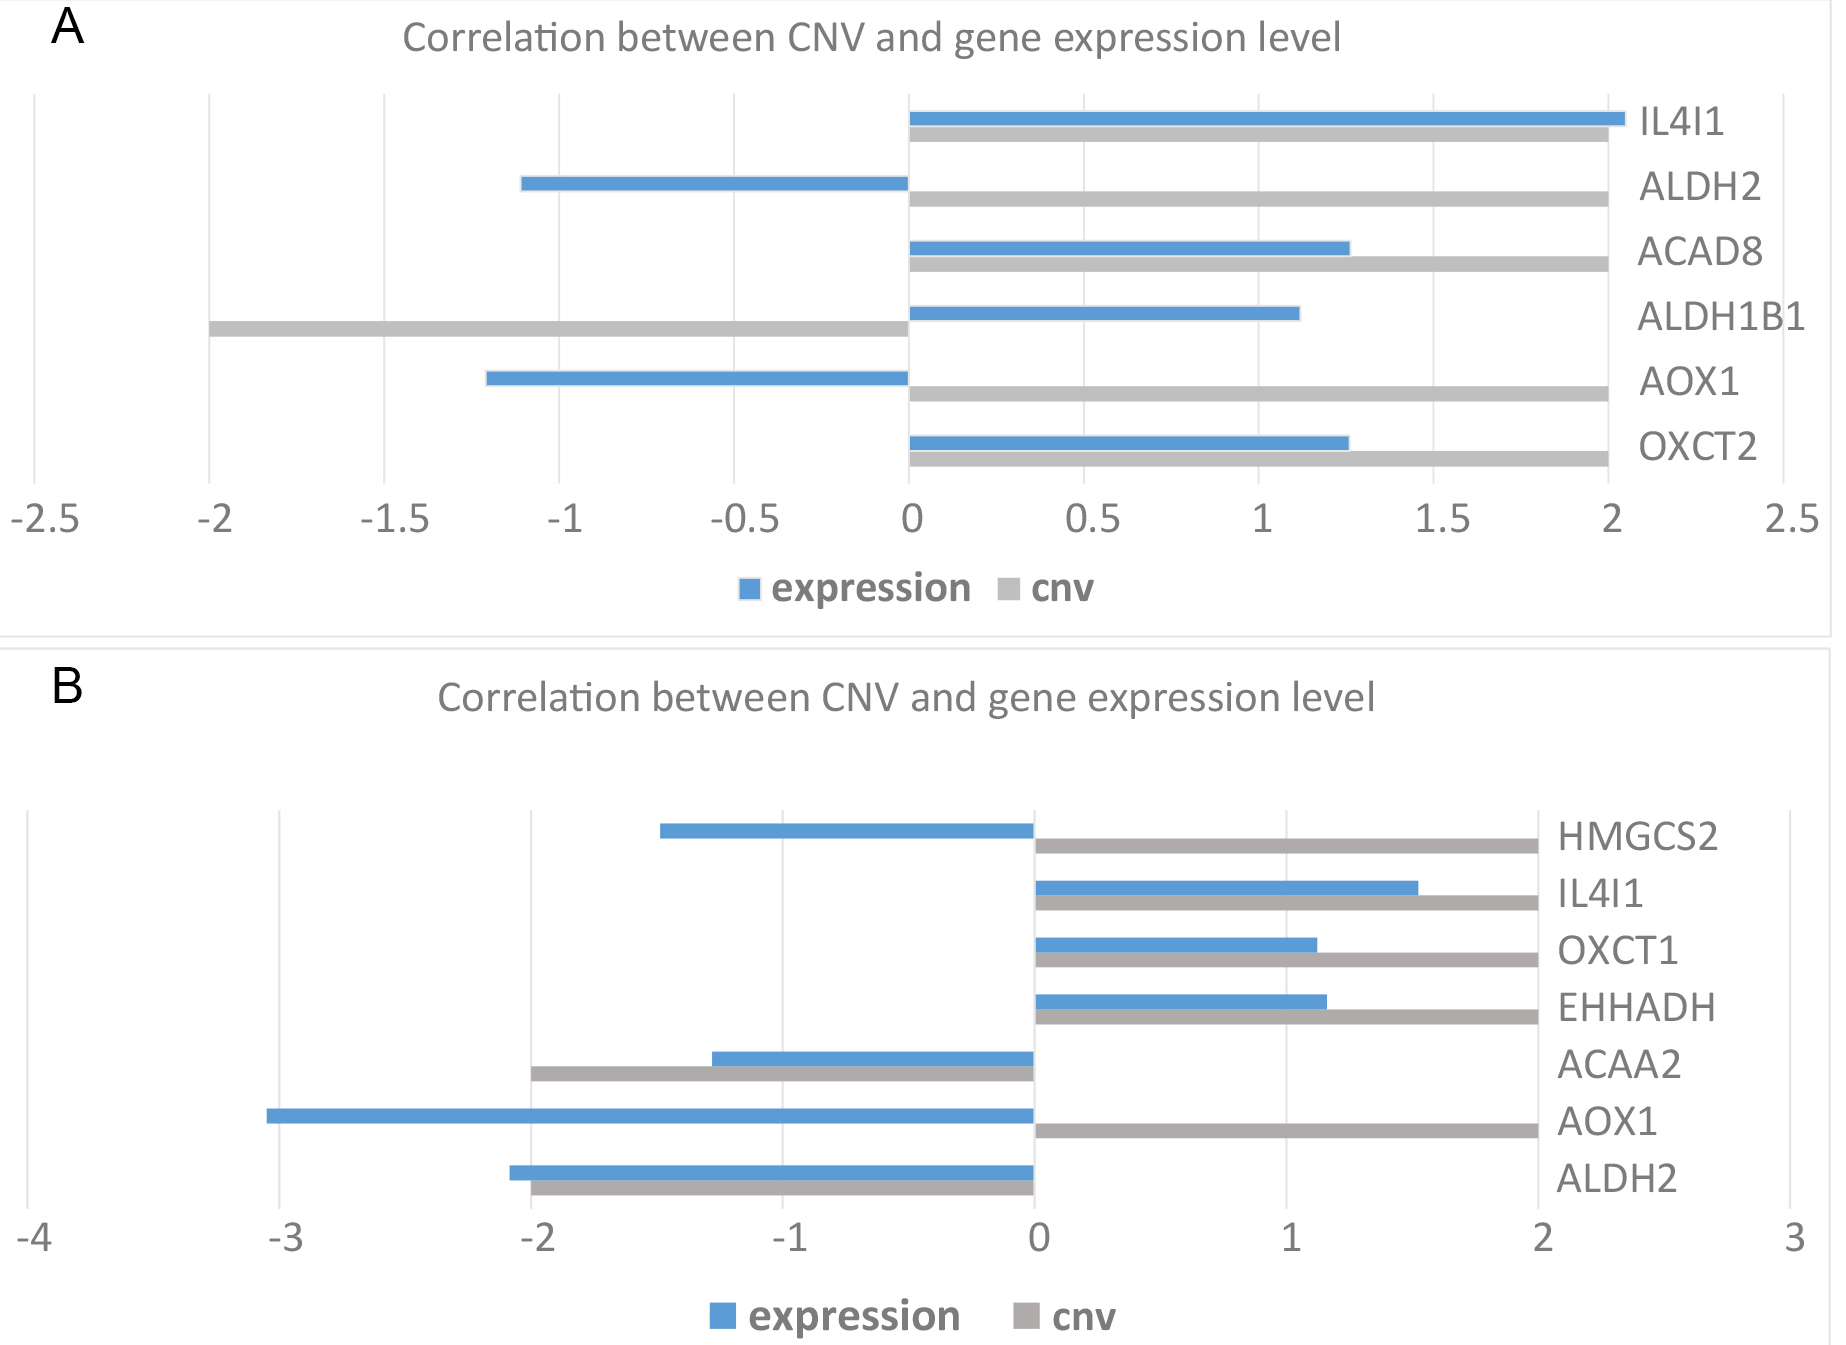 Fig. 5.
Correlation diagram of CNV and expression levels in NSCLC with significant difference in BCAAs catabolism. (A) LUAD. (B) LUSC.
| Gene | Copy number (n = 494) | Variability rate | ||||
|---|---|---|---|---|---|---|
| –2 | –1 | 0 | 1 | 2 | ||
| OXCT2 | 0 | 88 | 278 | 118 | 10 |
4.94% |
| ACAD8 | 7 | 103 | 272 | 104 | 8 |
1.6% |
| AOX1 | 0 | 39 | 324 | 127 | 4 |
0.8% |
| ALDH2 | 2 | 111 | 264 | 114 | 3 |
0.6% |
| IL4I1 | 1 | 176 | 245 | 70 | 2 |
0.4% |
| ALDH1B1 | 7 |
217 | 210 | 58 | 2 | 1.4% |
* represents copy number amplification; # indicates missing copy number.
| Gene | Copy number (n = 490) | Variability rate | ||||
|---|---|---|---|---|---|---|
| –2 | –1 | 0 | 1 | 2 | ||
| EHHADH | 0 | 4 | 48 | 233 | 205 |
41.8% |
| OXCT1 | 1 | 26 | 110 | 303 | 50 |
10.2% |
| AOX1 | 1 | 74 | 278 | 123 | 14 |
2.9% |
| HMGCS2 | 13 | 165 | 215 | 83 | 14 |
2.9% |
| IL4I1 | 0 | 132 | 197 | 158 | 3 |
0.6% |
| ACAA2 | 10 |
193 | 197 | 85 | 5 | 2% |
| ALDH2 | 2 |
77 | 291 | 119 | 1 | 0.4% |
* represents copy number amplification; # indicates missing copy number.
Methylation analysis of BCAAs catabolism-related enzymes was performed in LUAD
and LUSC. Hierarchical cluster analysis of the methylation pattern in LUAD and
LUSC is shown in Fig. 6A,B, respectively. Among them, IL4I1 and
ALDH2 were hypomethylated in LUAD (FDR
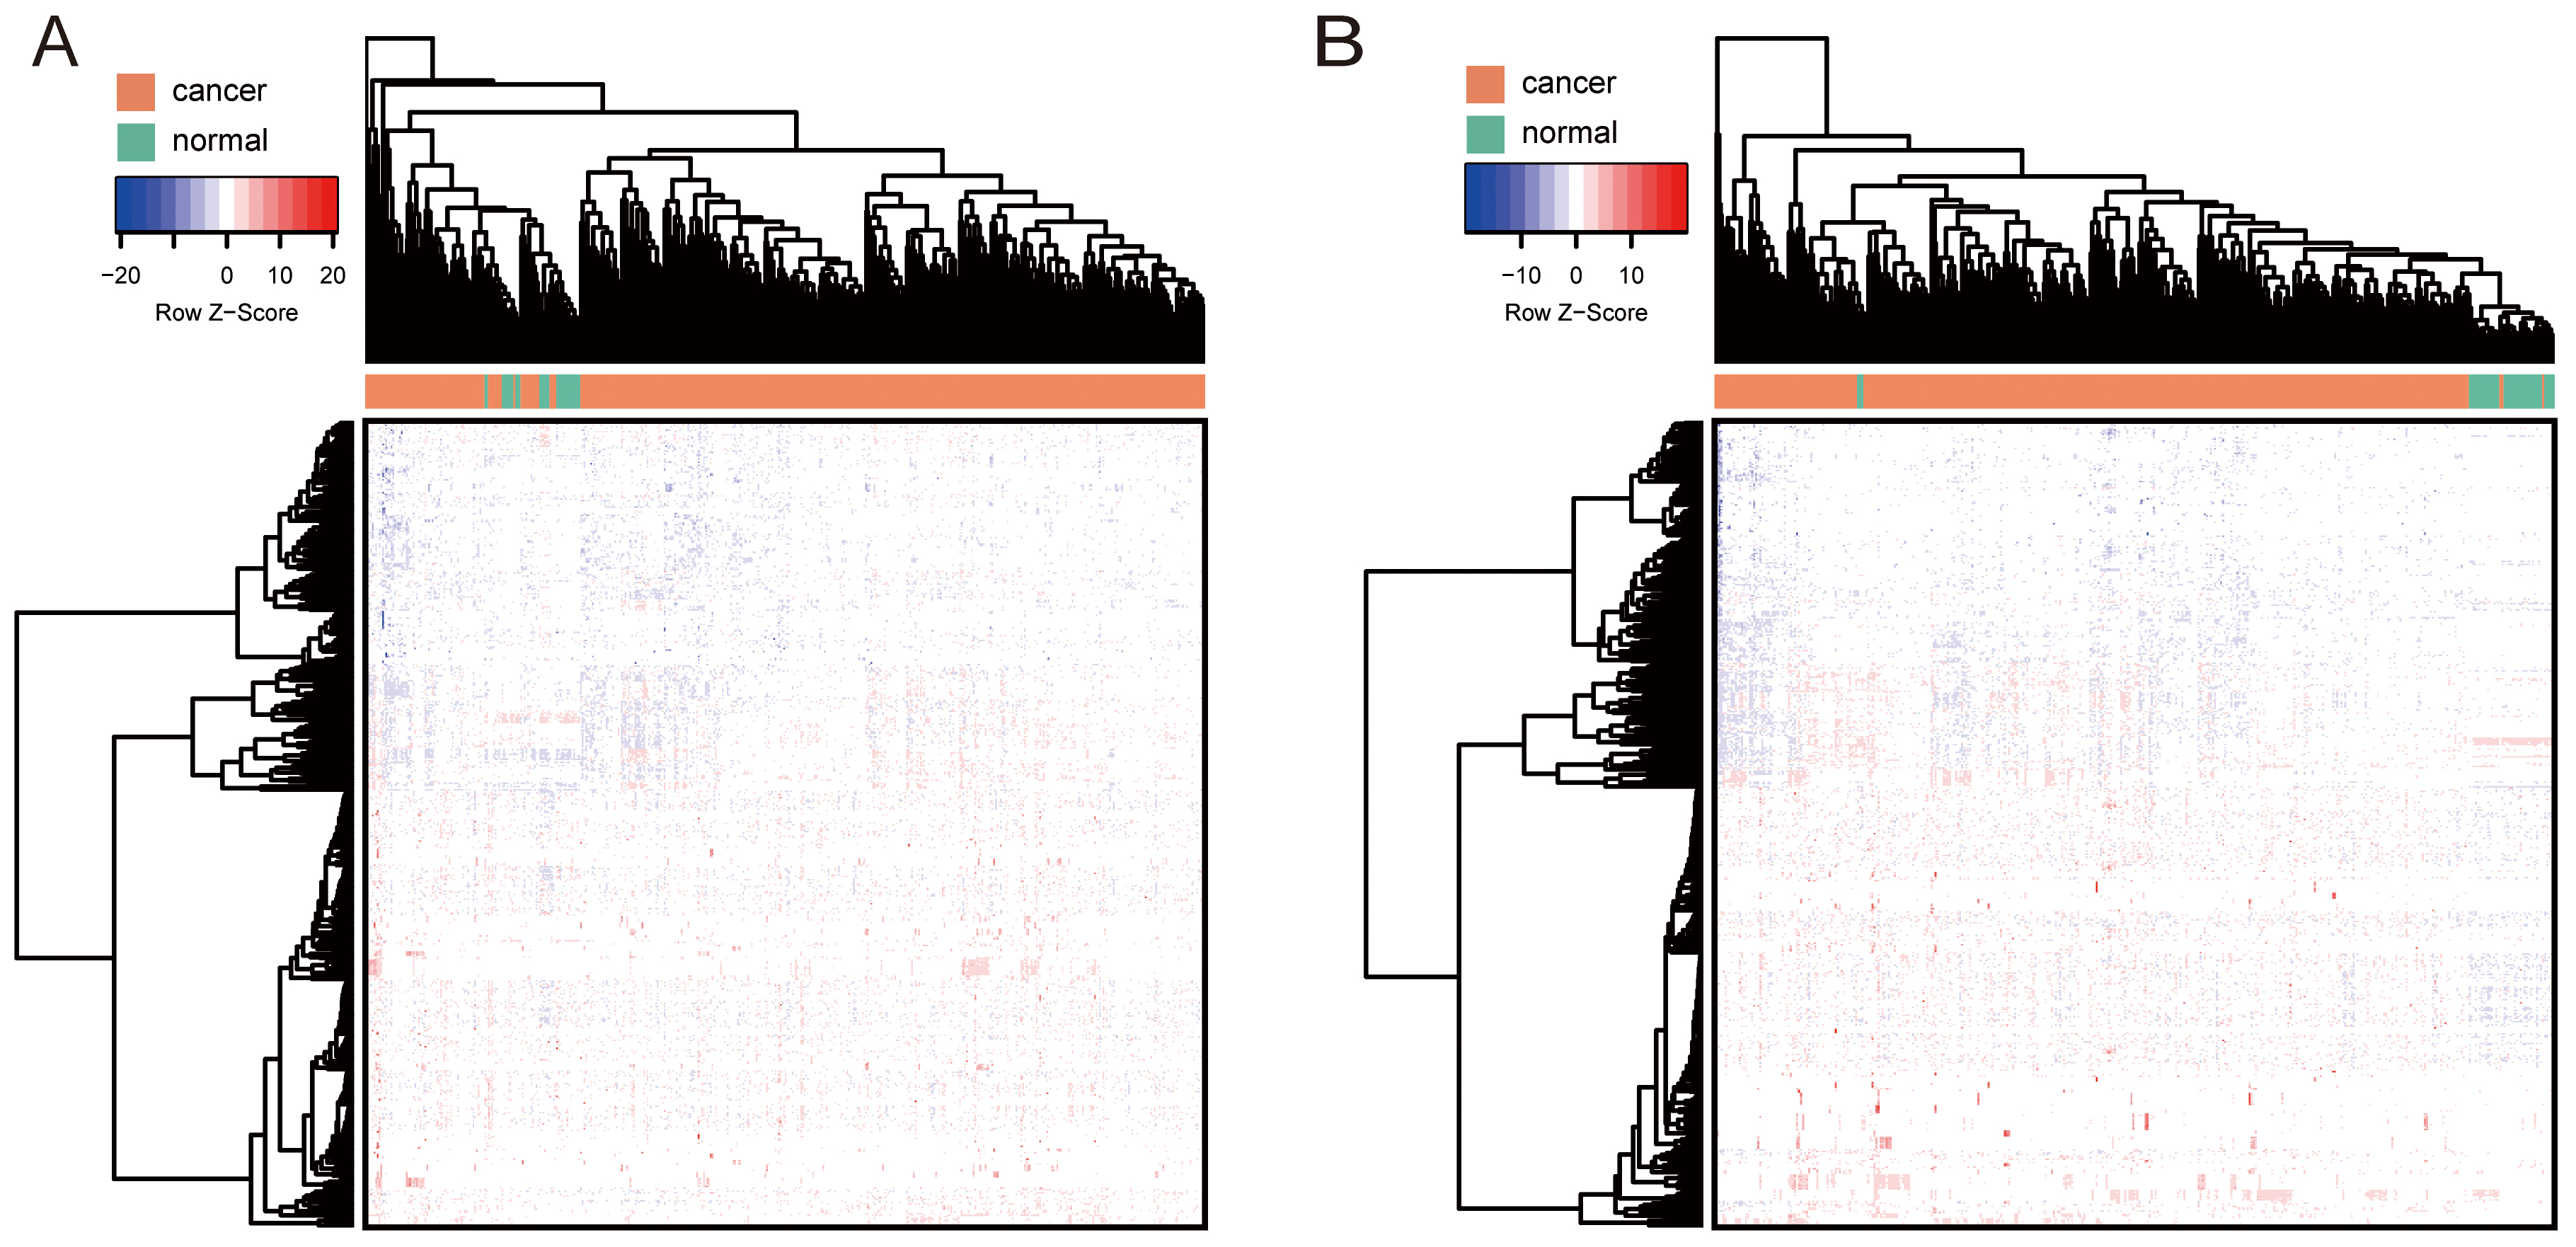 Fig. 6.
Hierarchical cluster analysis of the methylation pattern in NSCLC. (A) LUAD. (B) LUSC. The row and column represented the methylation level and samples, respectively. The color scale indicated the level of methylation.
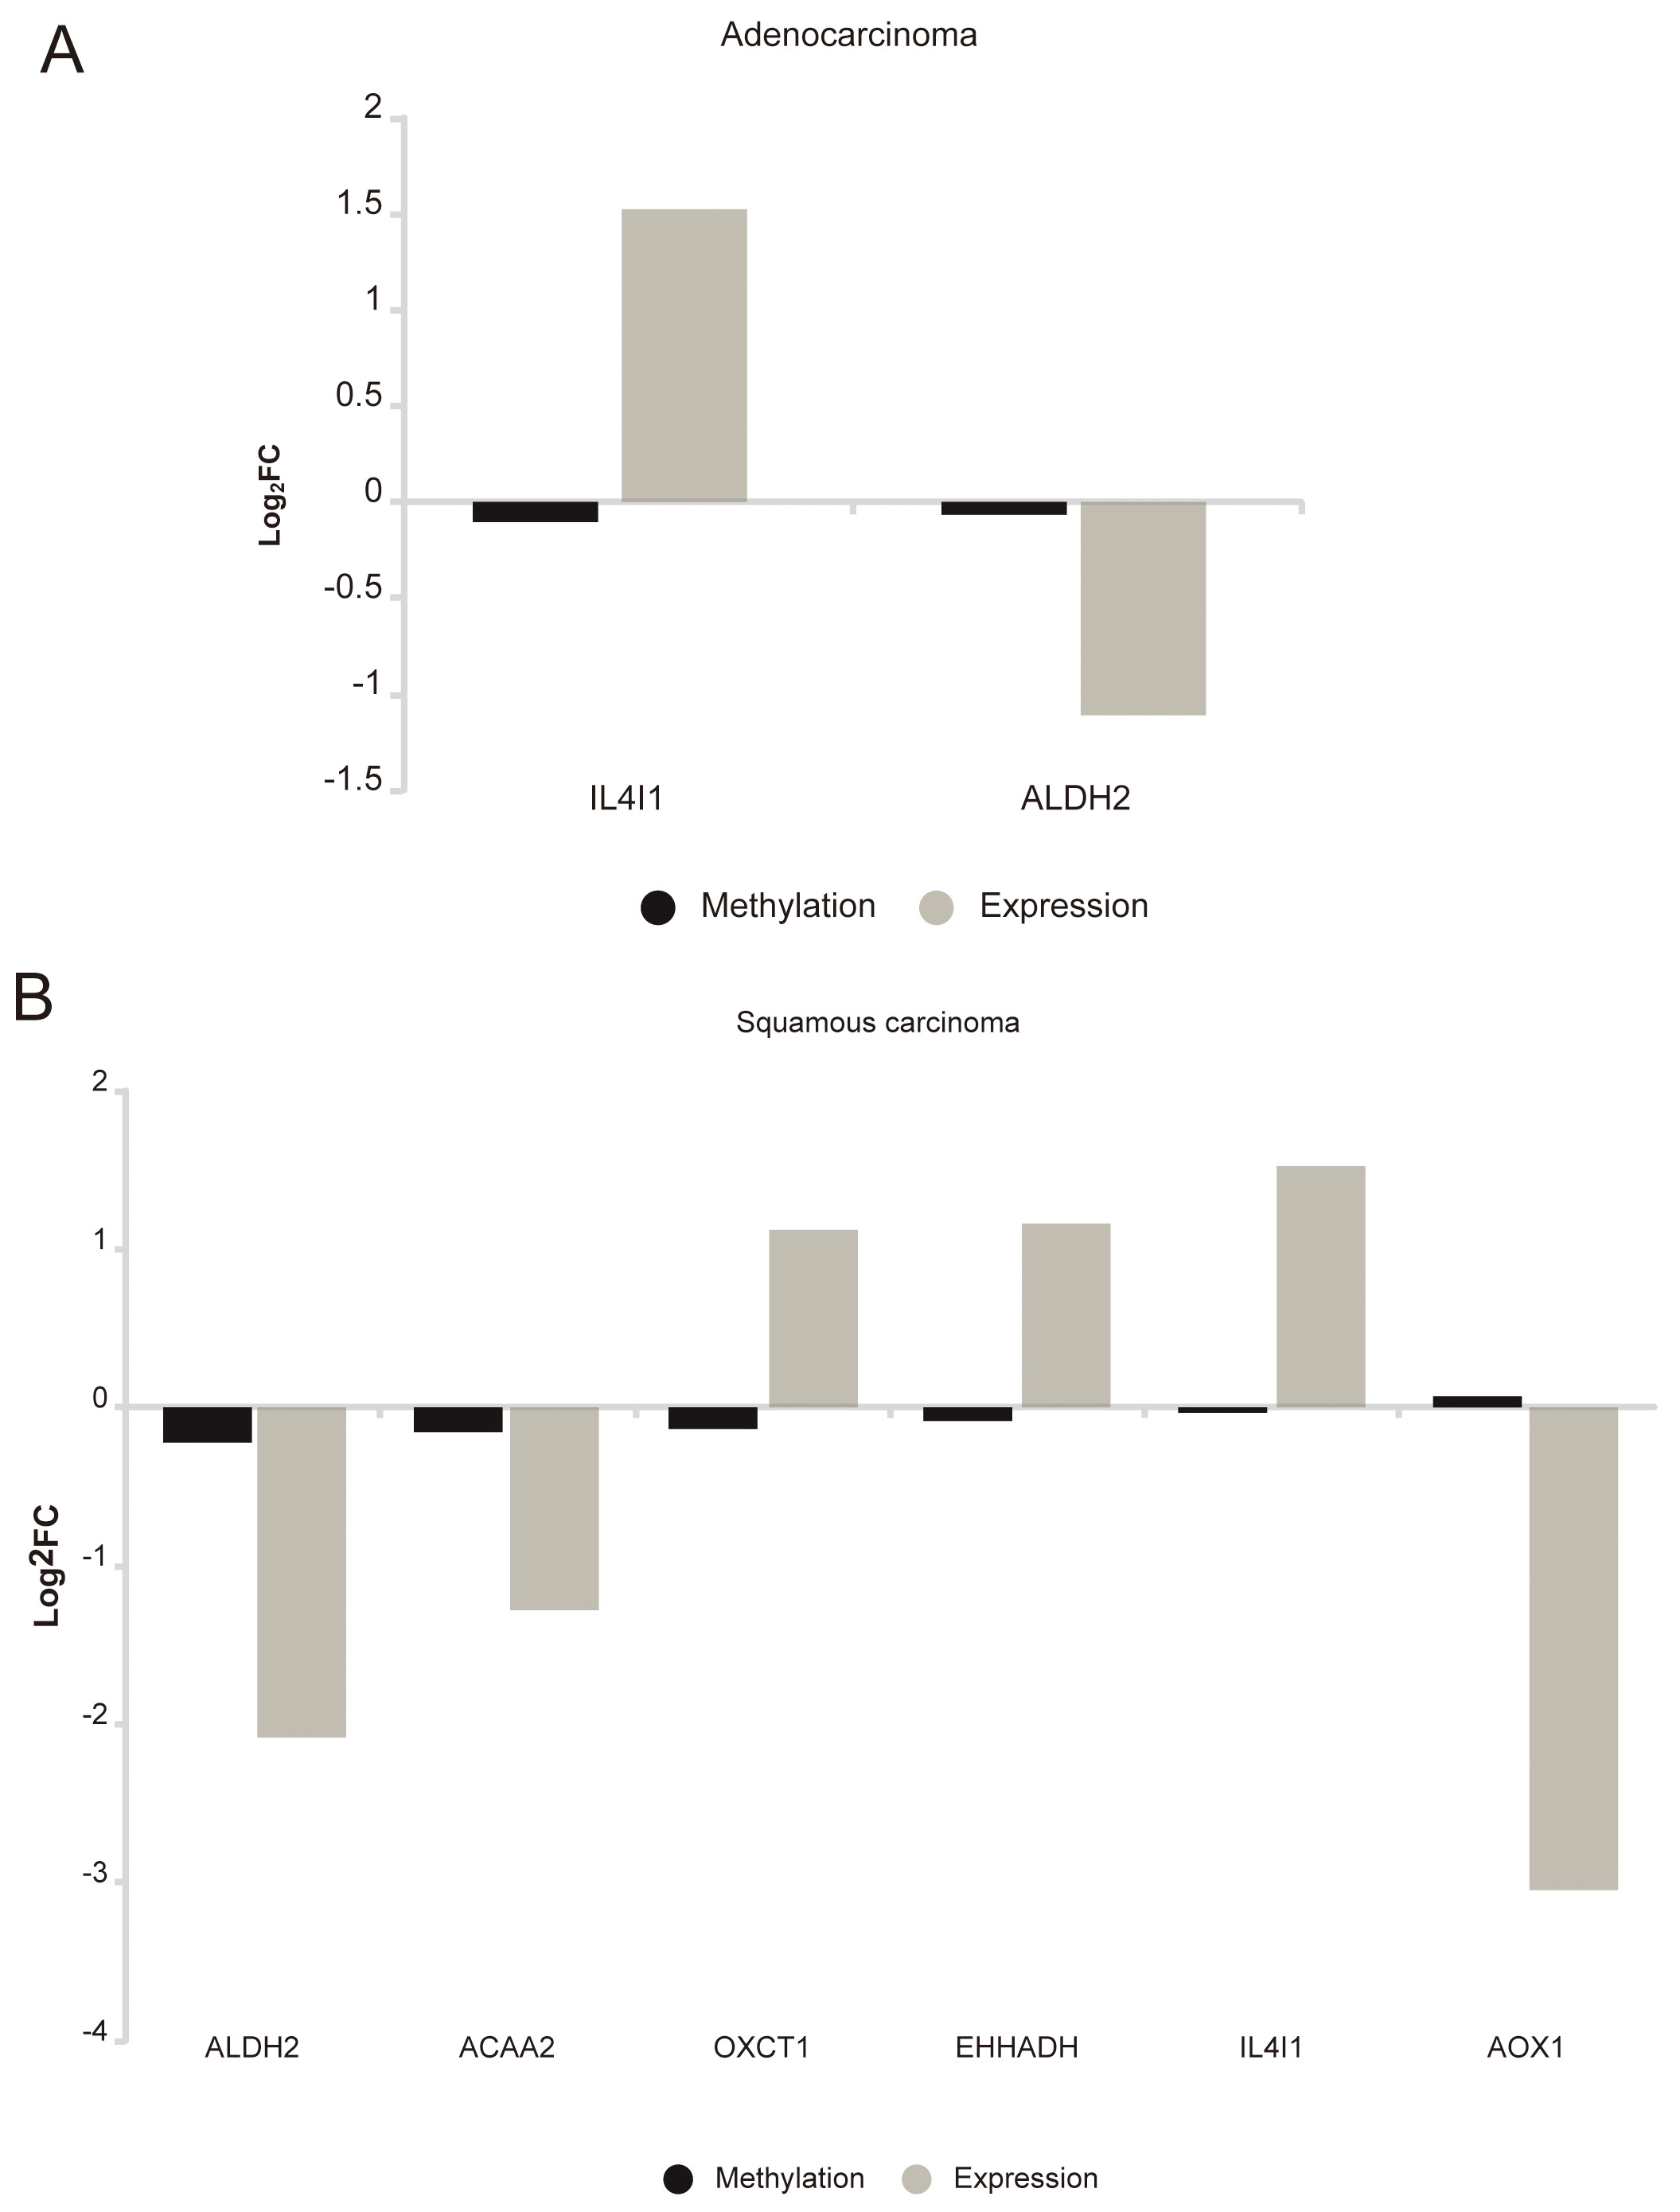 Fig. 7.
Correlation diagram of the methylation level and expression level of BCAAs catabolism enzymes in NSCLC. (A) LUAD. (B) LUSC.
| Gene | Probe | Log |
p value | FDR | Cancer AVG | Normal AVG | Delta beta |
|---|---|---|---|---|---|---|---|
| IL4I1 |
cg10805880 |
–0.10435 |
6.07 × 10 |
3.03 × 10 |
0.2921 | 0.39645 | –0.10435 |
| IL4I1 | cg0638809 | –0.06198 | 2.46 × 10 |
0.00011 | 0.17722 | 0.2392 | –0.06198 |
| ALDH2 | cg10887937 | –0.06601 | 0.00104 | 0.00313 | 0.77884 | 0.84485 | 0.06601 |
Log
| Gene | Probe | log |
p value | FDR | Cancer AVG | Normal AVG | Delta beta |
|---|---|---|---|---|---|---|---|
| ALDH2 |
cg10887937 |
–0.22205 |
1.76 × 10 |
1.57 × 10 |
0.66984 | 0.89189 | –0.22205 |
| ALDH2 | cg22158248 | –0.14350 | 1.44 × 10 |
4.86 × 10 |
0.47053 | 0.61403 | –0.1435 |
| ACAA2 |
cg03345145 |
–0.15567 |
1.45 × 10 |
6.65 × 10 |
0.75873 | 0.9144 | –0.15567 |
| ACAA2 | cg23825830 | –0.02635 | 0.00855 | 0.013038 | 0.078 | 0.10434 | –0.02634 |
| OXCT1 |
cg06537708 |
–0.13572 |
2.74 × 10 |
1.40 × 10 |
0.73252 | 0.86823 | –0.13571 |
| OXCT1 | cg17317280 | –0.06634 | 0.00255 | 0.004269 | 0.83218 | 0.89853 | –0.06634 |
| EHHADH |
cg11935638 |
–0.08541 |
4.28 × 10 |
1.57 × 10 |
0.20847 | 0.29388 | –0.08541 |
| EHHADH | cg08095700 | –0.05792 | 4.54 × 10 |
0.000103 | 0.1981 | 0.25602 | –0.05792 |
| IL4I1 | cg06388099 | –0.03433 | 0.018178 | 0.026101 | 0.14216 | 0.17649 | –0.03433 |
| AOX1 |
cg13000082 |
0.06938 |
0.004132 | 0.00667 | 0.13969 | 0.07031 | 0.06936 |
| AOX1 | cg04380340 | 0.06444 | 0.003021 | 0.004993 | 0.12397 | 0.05953 | 0.06444 |
Log
To determine the prognostic value of enzymes related to BCAAs catabolism, we
evaluated the effects of differentially expressed genes on the OS and DFS of
patients with LUAD and LUSC. In LUAD patients, the expression of five of the six
differentially expressed genes, including ALDH1B1 (p = 0.958),
ALDH2 (p = 0.077), OXCT2 (p = 0.617),
IL4I1 (p = 0.492), and AOX1 (p = 0.288), was
not significantly correlated with DFS. The DFS of patients with LUAD in the high
expression group of ACAD8 was significantly longer than that of patients
with low ACAD8 expression (p
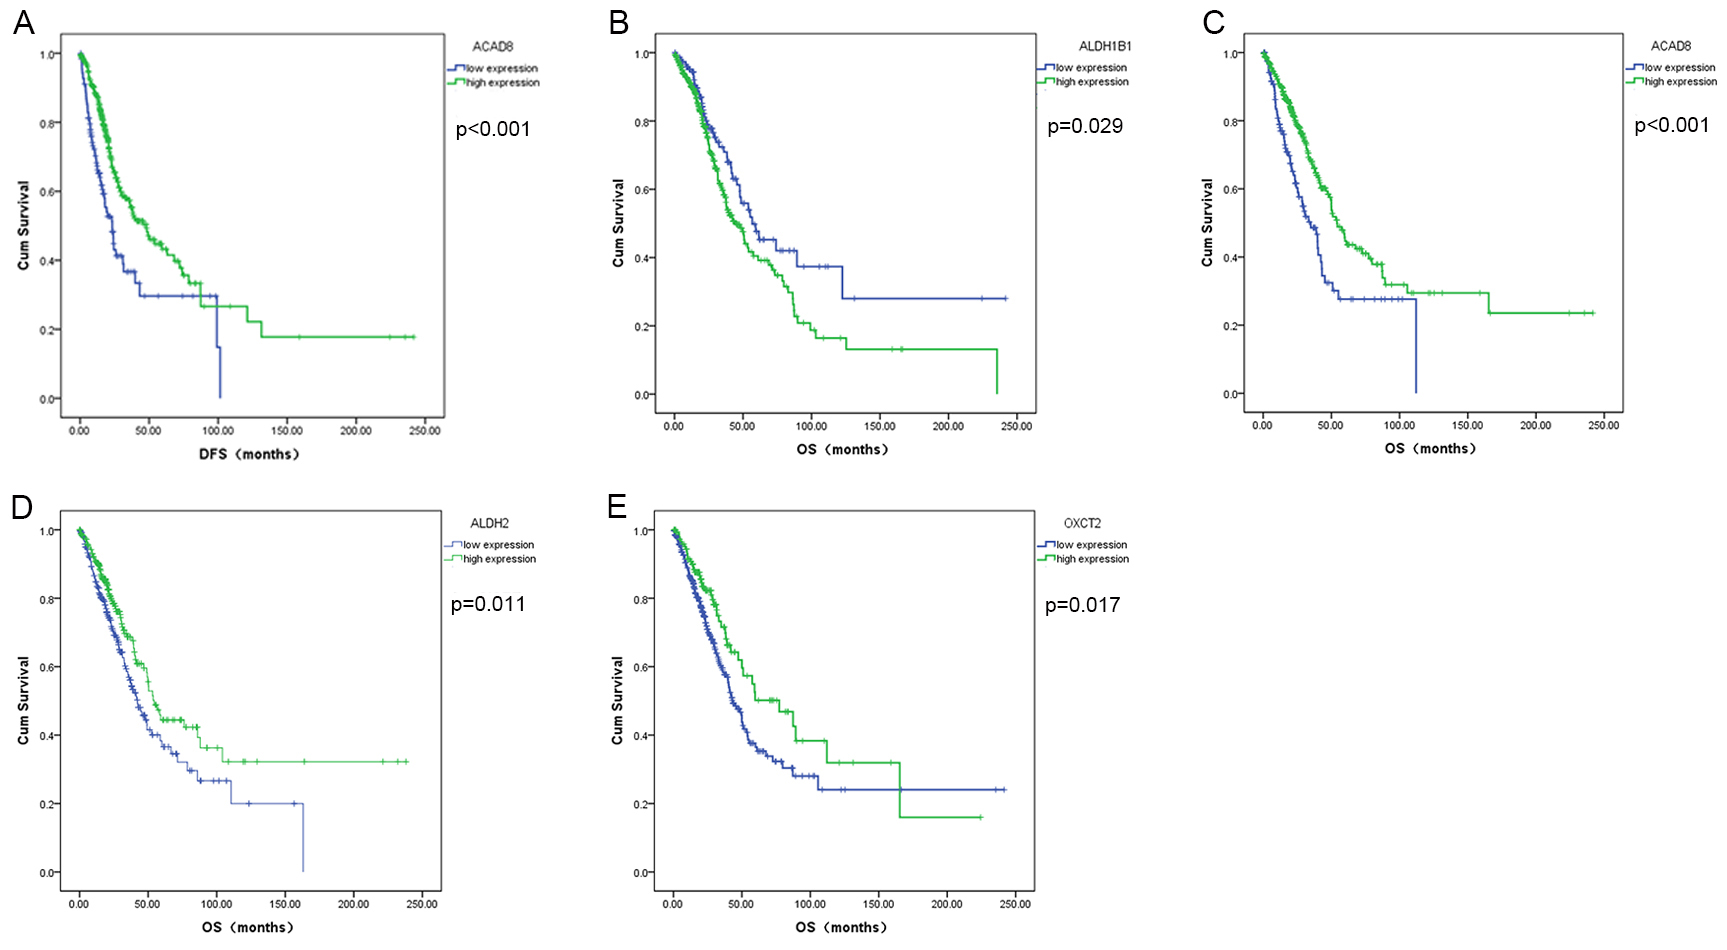 Fig. 8.
Survival analysis of significantly differentially expressed BCAA catabolism-related enzymes in LUAD. (A) ACAD8, (B) ALDH1B1, (C) ACAD8, (D) ALDH2, (E) OXCT2.
In patients with LUSC, the expression of ALDH2 (p = 0.837), EHHADH (p = 0.359), AOX1 (p = 0.059), ACAA2 (p = 0.183) and OXCT1 (p = 0.779) was not significantly associated with DFS, whereas high expression of L4I1 (p = 0.012) and HMGCS2 (p = 0.010) was associated with poor DFS (Fig. 9A–B). Furthermore, as shown in Fig. 9C–E, in addition to the expression of ACAA2 (p = 0.805), OXCT1 (p = 0.258), IL4I1 (p = 0.130), HMGCS2 (p = 0.190), low expression of EHHADH (p = 0.023), high expression of ALDH2 (p = 0.006) and AOX1 (p = 0.034) in patients with LUSC were significantly associated with worse OS (Fig. 9C–E).
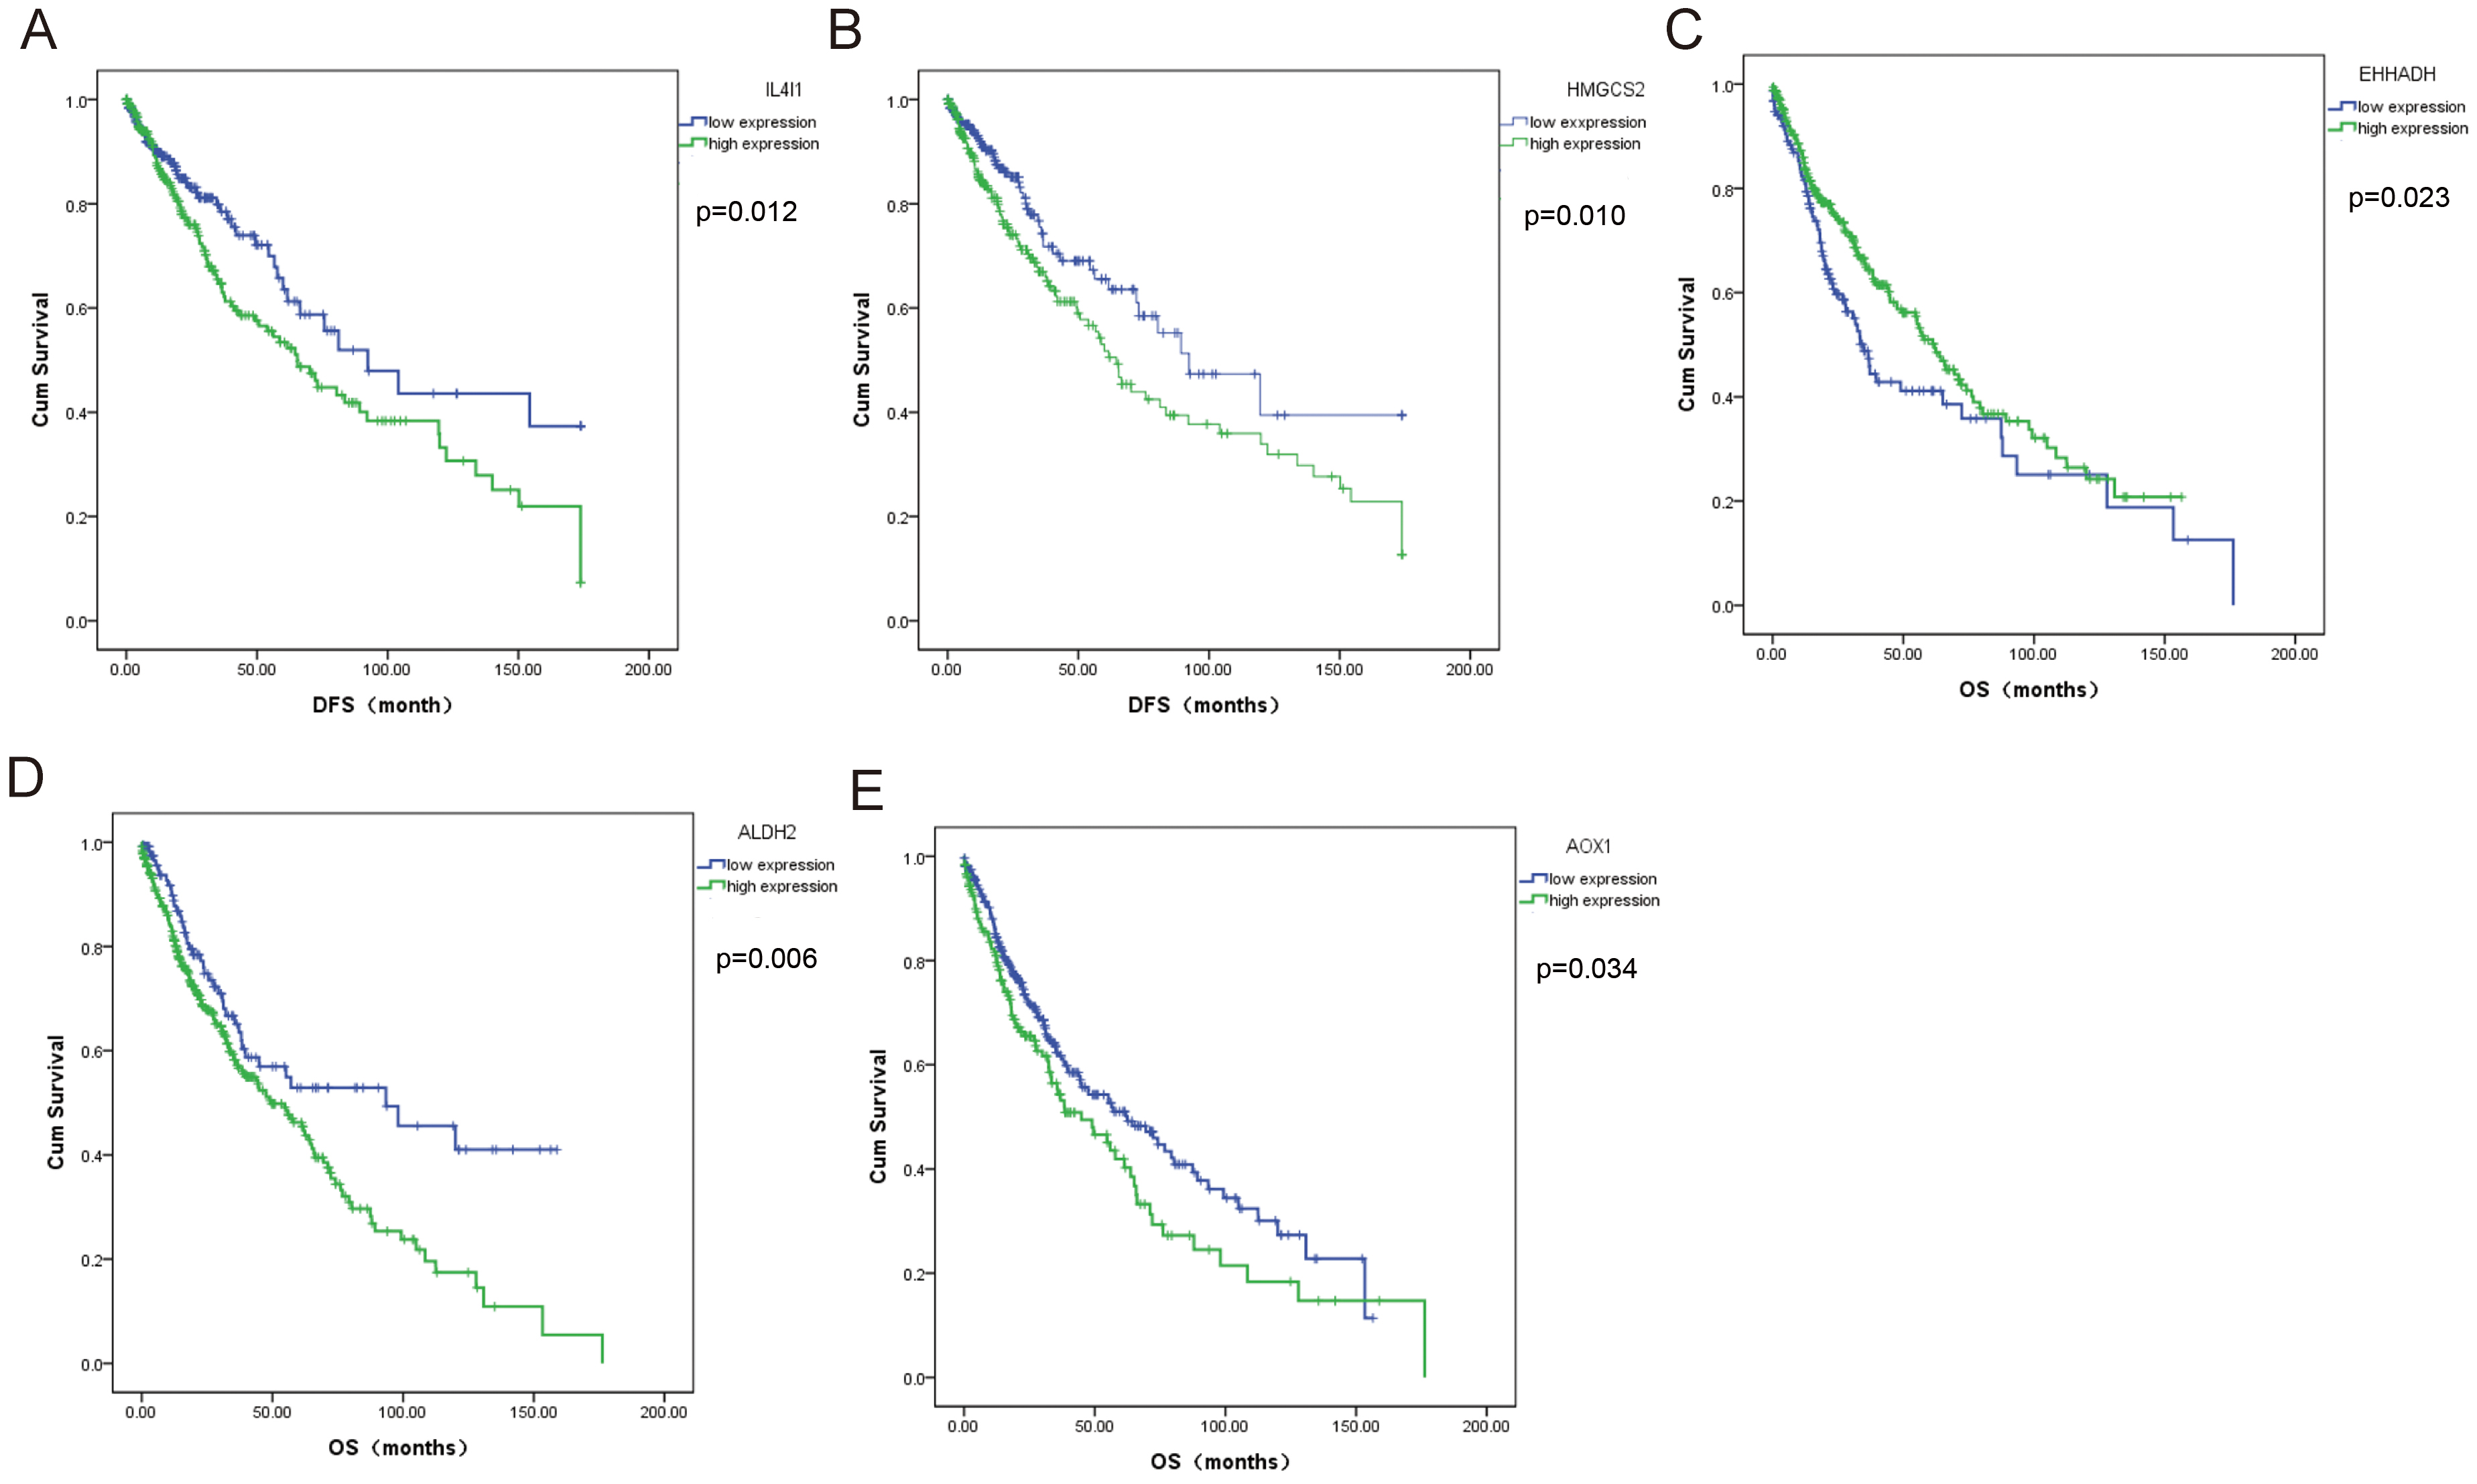 Fig. 9.
Survival analysis of significantly differentially expressed BCAAs catabolism-related enzymes in LUSC. (A) L4I1, (B) HMGCS2, (C) EHHADH, (D) ALDH2, (E) AOX1.
In addition, we integrated the survival data of LUAD and LUSC and analyzed the
effect of the expression of the catabolic enzyme gene of BCAAs, which were
differentially expressed jointly in both LUAD and LUSC, on the OS and DFS of
patients with NSCLC. The DFS of patients with NSCLC and low ALDH2
expression was relatively poor (p
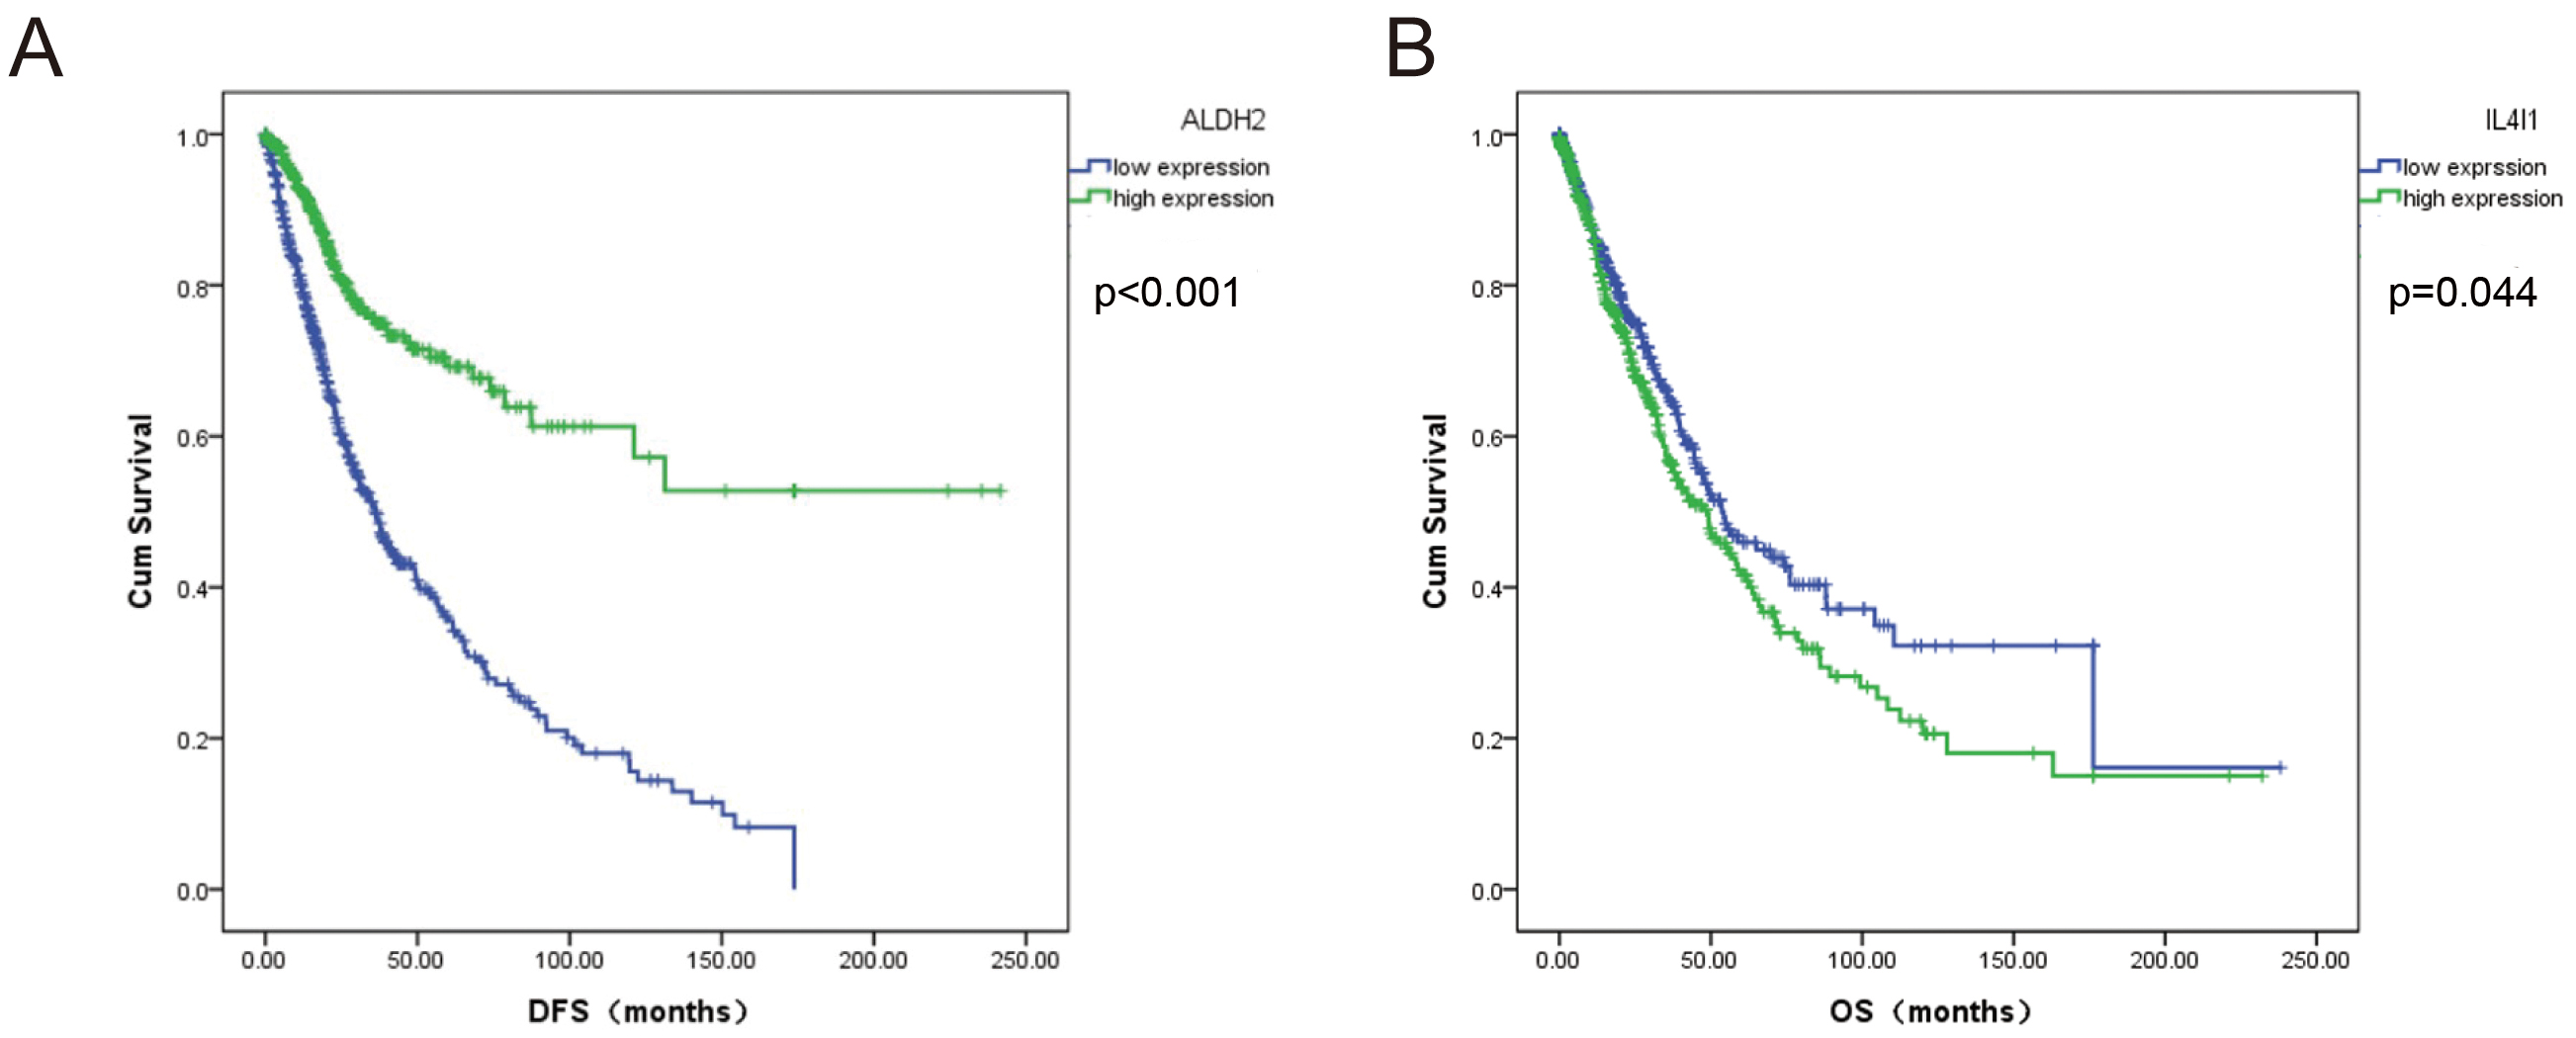 Fig. 10.
Survival analysis of significantly differentially expressed BCAAs catabolism-related enzymes in NSCLC. (A) ALDH2, (B) L4I1.
Finally, Cox regression analysis was performed for genes with significant effects on the OS of LUAD and LUSC. Univariate Cox regression analysis showed that ACAD8 and OXCT2 expression, lymph node metastasis, and Tumor Node Metastasis (TNM) stage were predictors of poor prognosis in patients with LUAD (Table 5). In multivariate Cox regression analysis, ACAD8 expression, lymph node metastasis, and TNM stage were independent predictors of prognosis in patients with LUAD (Table 5). The expression of ALDH2 and the stage were related to LUSC survival in both the univariate and multivariate Cox regression analyse (Table 6).
| Variables | Univariate analysis | Multivariate analysis | ||||
|---|---|---|---|---|---|---|
| Hazard ratio | 95% CI | p value | Hazard ratio | 95% CI | p value | |
| ALDH1B1 expression | 1.349 | 0.978–1.861 | 0.068 | |||
| High vs Low | ||||||
| ACAD8 expression | 0.601 | 0.442–0.818 | 0.001* | 0.553 | 0.405–0.756 | |
| High vs Low | ||||||
| ALDH expression | 0.839 | 0.625–1.127 | 0.244 | |||
| High vs Low | ||||||
| OXCT2 expression | 0.677 | 0.482–0.950 | 0.024* | 0.722 | 0.511–1.021 | 0.066 |
| High vs Low | ||||||
| Gender | 1.090 | 0.812–1.462 | 0.567 | |||
| Male vs female | ||||||
| Age (year) | 1.154 | 0.838–1.590 | 0.380 | |||
| Lymph node metastasis | 2.437 | 1.815–3.272 | 1.831 | 1.287–2.605 | 0.001* | |
| Positive vs Negative | ||||||
| TNM stage | 2.518 | 1.841–3.443 | 1.884 | 1.298–2.735 | 0.001* | |
| III–IV vs I–II | ||||||
| Smoking History | 0.822 | 0.602–1.123 | 0.218 | |||
| Yes vs No | ||||||
* represents p
| Variables | Univariate analysis | Multivariate analysis | ||||
|---|---|---|---|---|---|---|
| Hazard ratio | 95% CI | p value | Hazard ratio | 95% CI | p value | |
| ALDH2 expression | 1.467 | 1.045–2.058 | 0.027* | 1.480 | 1.054–2.077 | 0.023* |
| High vs Low | ||||||
| EHHADH expression | 0.917 | 0.658–1.277 | 0.607 | |||
| High vs Low | ||||||
| AOX1 expression | 1.157 | 0.772–1.735 | 0.480 | |||
| High vs Low | ||||||
| Gender | 0.968 | 0.674–1.390 | 0.858 | |||
| Male vs female | ||||||
| Age (year) | 1.179 | 0.852–1.633 | 0.566 | |||
| Lymph node metastasis | 1.057 | 0.764–1.462 | 0.738 | |||
| Positive vs Negative | ||||||
| TNM stage | 1.433 | 1.001–2.050 | 0.049* | 1.450 | 1.014–2.075 | 0.042* |
| III–IV vs I–II | ||||||
| Smoking History | 0.914 | 0.576–1.450 | 0.702 | |||
| Yes vs No | ||||||
* represents p
The occurrence and development of tumors are complex processes. Amino acid catabolic enzymes are over-expressed in a variety of cancers, providing not only cellular energy and metabolites for the anabolic process but also serving as a mechanism for cancer cells to escape immunity [6, 11]. Multiple studies have indicated that branched-chain aminotransferase (BCAT), an enzyme that catalyzes the first step of BCAA catabolism, is over-expressed in many malignant tumors [7, 10, 12, 13]. BCAT is highly expressed in lung cancer and promotes the proliferation of lung cancer cells [10]. Therefore, it is necessary to systematically study the expression patterns of BCAAs catabolic enzymes in NSCLC and their correlation with disease prognosis.
Through multidimensional bioinformatic analysis, we found that the expression of
BCAAs’ metabolic enzymes IL4I1, ALDH2, and AOX1 was
specific to NSCLC and correlated with prognosis. IL4I1 is a secreted L-amino acid
oxidase that is induced by interleukin 4. IL4I1 is highly expressed in
lymphomas and associated with the prognosis of lymphomas [14]. IL4I1 is
a novel immunomodulatory enzyme produced by mature dendritic cells, that inhibits
the proliferation of effector T lymphocytes and promotes the development of
regulatory T cells [15, 16]. Local secretion of IL4I1 in the immune
synaptic cleft and its binding to CD3
AOX1 is a protein in the molybdoflavin family and an important enzyme involved in purine catabolism. More and more studies show that AOX1 is involved in the pathophysiology of many clinical diseases [17, 18]. AOX1 promotes liver cell damage and fibrosis by increasing reactive oxygen species, which in turn may affect the metabolism and activity of drugs in the liver [19]. AOX1 expression is reduced in hepatocellular carcinoma and correlates with a higher tumor stage, distant metastasis, or lymph node positive status [20]. The beneficial role of Nrf2 in cancer prevention is essentially dependent on strict control of its activity, and relaxation of Nrf2 is a key determinant of tumorigenesis and is found in many types of cancer [21]. Previous studies have shown that AOX1 plays a critical role in the occurrence and development of tumors by regulating the Nrf2 pathway [22]. In the present study, AOX1 was poorly expressed in both LUAD and LUSC, indicating that AOX1 may play an inhibitory role in the development and progression of NSCLC. DNA mutations of AOX1 were highest in both LUAD and LUSC, especially LUSC, which has not been reported in previous studies. AOX1 was mainly amplified by the copy numbers of LUAD and LUSC, but the expression of AOX1 was negatively regulated with an increasing copy number. AOX1 may play an important role in the occurrence and progression of NSCLC, but the underlying mechanisms need to be determined in further clinical and basic research experiments. ALDH2 catalyzes the transformation of toxic methylmalonate semialdehyde into non-toxic methylmalonate via the valine catabolic pathway. ALDH2 is mainly involved in liver metabolism and has been reported to play a role in liver diseases, especially alcoholic liver disease [23, 24, 25]. Among the different subtypes of acetaldehyde dehydrogenase, only ALDH2 has better basic functions than other subtypes in the detoxification of acetaldehyde dehydrogenase [26]. Acetaldehyde, a substrate catalyzed by ALDH2 in the metabolic process, is closely related to a variety of tumors, and low expression of ALDH2 in lung and liver cancer is associated with a poor prognosis [26, 27]. Furthermore, aldehyde dehydrogenase is differentially expressed in lung cancer, and ALDH2 was poorly expressed in lung cancer, while ALDH1A1 and ALDH3A1 were highly expressed in NSCLC [28]. Increasing evidence indicates that lung cancer may originate from tumor stem cells and that aldehyde dehydrogenase is a functional marker of lung cancer stem cells [29]. Several studies have reported that ALDH2 is also a functional marker of lung cancer stem cells [29, 30, 31]. In the present study, ALDH2 expression was down-regulated in both LUAD and LUSC. Low ALDH2 expression was associated with poor OS in LUAD patients, which is consistent with previous reports [26]. However, high expression of ALDH2 is associated with a poor prognosis for LUSC. ALDH2 expression was related to LUSC survival in both the univariate and multivariate Cox regression analyse. There were some differences in the level of ALDH2 expression in the survival of patients with different pathological subtypes of NSCLC, and there may be many unknown mechanisms and complex interference factors, which need to be confirmed in further studies.
Our study revealed the expression pattern and prognosis of differentially expressed BCAAs catabolism-related enzymes in NSCLC at multiple levels based on the TCGA database. First, we analyzed the expression of 44 BCAAs catabolic enzymes in NSCLC and normal lung tissues. A total of six differentially expressed genes (ALDH1B1, ACAD8, IL4I1, OXCT2, ALDH2 and AOX1) and seven differentially expressed genes (OXCT1, EHHADH, IL4I1, ALDH2, ACAA2, AOX1, and HMGCS2) were identified in LUAD and LUSC, respectively. Among them, IL4I1, ALDH2, and AOX1 were differentially expressed in both LUAD and LUSC. IL4I1 participated in the first step of the catabolic process of L-isoleucine, metabolizing L-isoleucine to (S)-3-Methyl-2-oxopentanoate, producing Ammonia and Hydrogen peroxide. In the process of valine catabolism, AOX1 mainly worked with aldehyde dehydrogenase protein family members ALDH2 and ALDH1B1 to oxidize Methylmalonate semialdehyde to Methylmalonate. Mutation, CNV, and methylation analyse of differentially expressed BCAAs catabolism-related enzymes were performed. Finally, a survival analysis of the differentially expressed BCAAs catabolism-related enzymes was performed. This study has some limitations. Our results were not verified in clinical NSCLC samples. This is a pilot study, and more experiments are needed to uncover the pathogenesis of differentially expressed BCAAs catabolism-related enzymes in NSCLC.
The data sets used and analyzed during the present study are available from the Cancer Genome Atlas (TCGA) public database.
XY contributed to the conception of the study. YD, JZ, LJ, and YS performed the data analyses. XY contributed significantly to the writing of the manuscript. All authors read and approved the final manuscript.
Not applicable.
Not applicable.
This research received no external funding.
The authors declare no conflict of interest.
Publisher’s Note: IMR Press stays neutral with regard to jurisdictional claims in published maps and institutional affiliations.