
- Academic Editors
Background: Rapid hemoglobin A1C (HbA1c) level monitoring is
essential in slowing the progression of diabetes. This need becomes challenging
in low resources countries where the social burden of the disease is
overwhelming. Recently, fluorescent-based lateral flow immunoassays (LFIAs)
gained wide attention for small laboratories and population
surveillance. Aim: We aim to evaluate the performance of
Finecare™ HbA1c Rapid Test, certified by CE, NGSP, and IFCC, for
the quantitative measurement of hemoglobin A1C (HbA1c) along with its reader.
Methods: A total of 100 (fingerstick and venepuncture whole blood)
samples were analyzed by Wondfo Finecare™ HbA1c Rapid Quantitative
Test and the results were compared with the reference assay Cobas Pro
c503. Results: A strong correlation was observed between
Finecare™/Cobas Pro c503 with fingerstick (r
The prevalence of diabetes mellitus is significantly expanding at an alarming pace all over the globe. The worldwide burden of diabetes mellitus (DM) has increased from 30 million in 1985 to 382 million in 2014, and current trends indicate that these rates will continue to expand [1]. According to the most recent projections reported by the International Diabetes Federation (IDF), the number of people living with diabetes mellitus will rise to 643 million by 2030 [2].
Glycated hemoglobin (HbA1c) serves as a reliable indicator of glycemic status in
diabetic patients over a period of two to three months [3]. HbA1c is produced
once hemoglobin is chemically linked to glucose [3]. Traditionally, high plasma
glucose levels were used for DM diagnosis. Plasma glucose level is typically
measured after fasting or two hours after an oral glucose (75 g) tolerance test
in symptomatic patients [4]. Recently, the American Diabetes Association and the
World Health Organisation (WHO) recommended the use of HbA1c (
Lateral flow immunoassays (LFIAs) are attractive for small or point-of-care (POC) settings and population surveillance. They are rapid, inexpensive, simple to use, most importantly, rely on easily accessible samples such as whole blood from a fingerstick [16, 17]. Finecare™ HbA1c Rapid Quantitative Test is a fluorescence immunoassay for the quantitative determination of HbA1c in human blood (venepuncture or fingerstick). In this study, we aimed to evaluate the performance of Finecare™ HbA1c Rapid Quantitative Test by using samples obtained by fingerstick and venepuncture. In addition, to compare the performance of Finecare™ HbA1c Rapid Quantitative Test with the reference technique, Cobas Pro c503 clinical chemistry analyzer from Roche Diagnostics.
In collaboration with the Ministry of Health (MOH) in Jordan, Wondfo Biotech (Guangzhou, China) conducted two validation studies on Finecare™ HbA1c Rapid Quantitative Test; one was performed in a private referral laboratory (n = 100 samples) and the other was performed in a public health laboratory that belongs to the MOH (n = 47 samples), and the other was performed in a private referral laboratory (n = 100 samples). HbA1c was measured from collected fingerstick and matched venous blood samples for a total of 147 participants from both laboratories. Testing results were provided to our lab for analysis, and that data was unaccompanied by any patient identifications or private information other than the primary demographic data, including age and gender. Accordingly, an Ethical approval exemption (QU-IRB 1766-E/22) was granted by Qatar University.
Finecare™ HbA1c Rapid Quantitative Test is based on fluorescence immunoassay technology and measures the level of HbA1c in human blood using a sandwich immunodetection approach. According to the manufacturer’s test leaflets and flyer, the Fincare™ HbA1c POC test, according to the manufacturer’s test leaflets and flyer, is traceable to the International Federation of Clinical Chemistry and Laboratory Medicine (IFCC) reference method for measuring HbA1c and is certified by the National Glycohemoglobin Standardization Program (NGSP) as having documented traceability to the Diabetes Control and Complications Trial (DCCT) reference method [18, 19]. The NGSP awards certification to manufacturers for successfully meeting specific performance criteria [20]. The test was carried out according to the manufacturer instructions. The LFA reaction time is 5 min, and the measuring range is 4.0–14.5%
The Tina-quant Hemoglobin A1cDx assay is intended to diagnose diabetic patients. It is in vitro diagnostics assay to quantify hemoglobin A1c (mmol/mol) and % hemoglobin A1c in whole venous blood on the cobas pro c503 clinical chemistry analyzers. This approach is based on the turbidimetric inhibition immunoassay of blood samples that have been hemolyzed. The anti-HbA1c antibody forms a soluble complex with a single binding site on HbA1c. Polyhaptens react with excess anti-HbA1c antibodies to generate an insoluble compound, which is evaluated by turbidimetry. The measuring range is 4.0–14.5%.
Finecare™ and the reference technique, Cobas Pro c503, were
compared using correlation and linear regression analysis. Because our data was
not normally distributed, we estimated the spearman correlation coefficient (r),
with r values of 0–0.39 indicating a weak correlation, 0.40–0.59 indicating a
moderate connection, 0.6–0.77 indicating a high correlation, and 0.8–1
indicating a very strong correlation [21]. In addition, we assessed the area
under the curve (AUC) of the Receiver-Operating Characteristic (ROC) curve, which
measures the accuracy of a quantitative diagnostic test [22]. An AUC of 0.9–1.0
is denoted as excellent, 0.8–0.9 is denoted as very good, 0.7–0.8 is denoted as
good, 0.6–0.7 is denoted as sufficient, 0.5–0.6 is denoted as bad, and
We assessed the correlation between Finecare™ with the reference
method, Roche Cobas Pro c503, using fingerstick and venous blood samples, as
shown in Fig. 1. The correlation between Finecare™ employing
fingerstick whole blood sample and Cobas Pro c503 was very high (r =
0.93, p
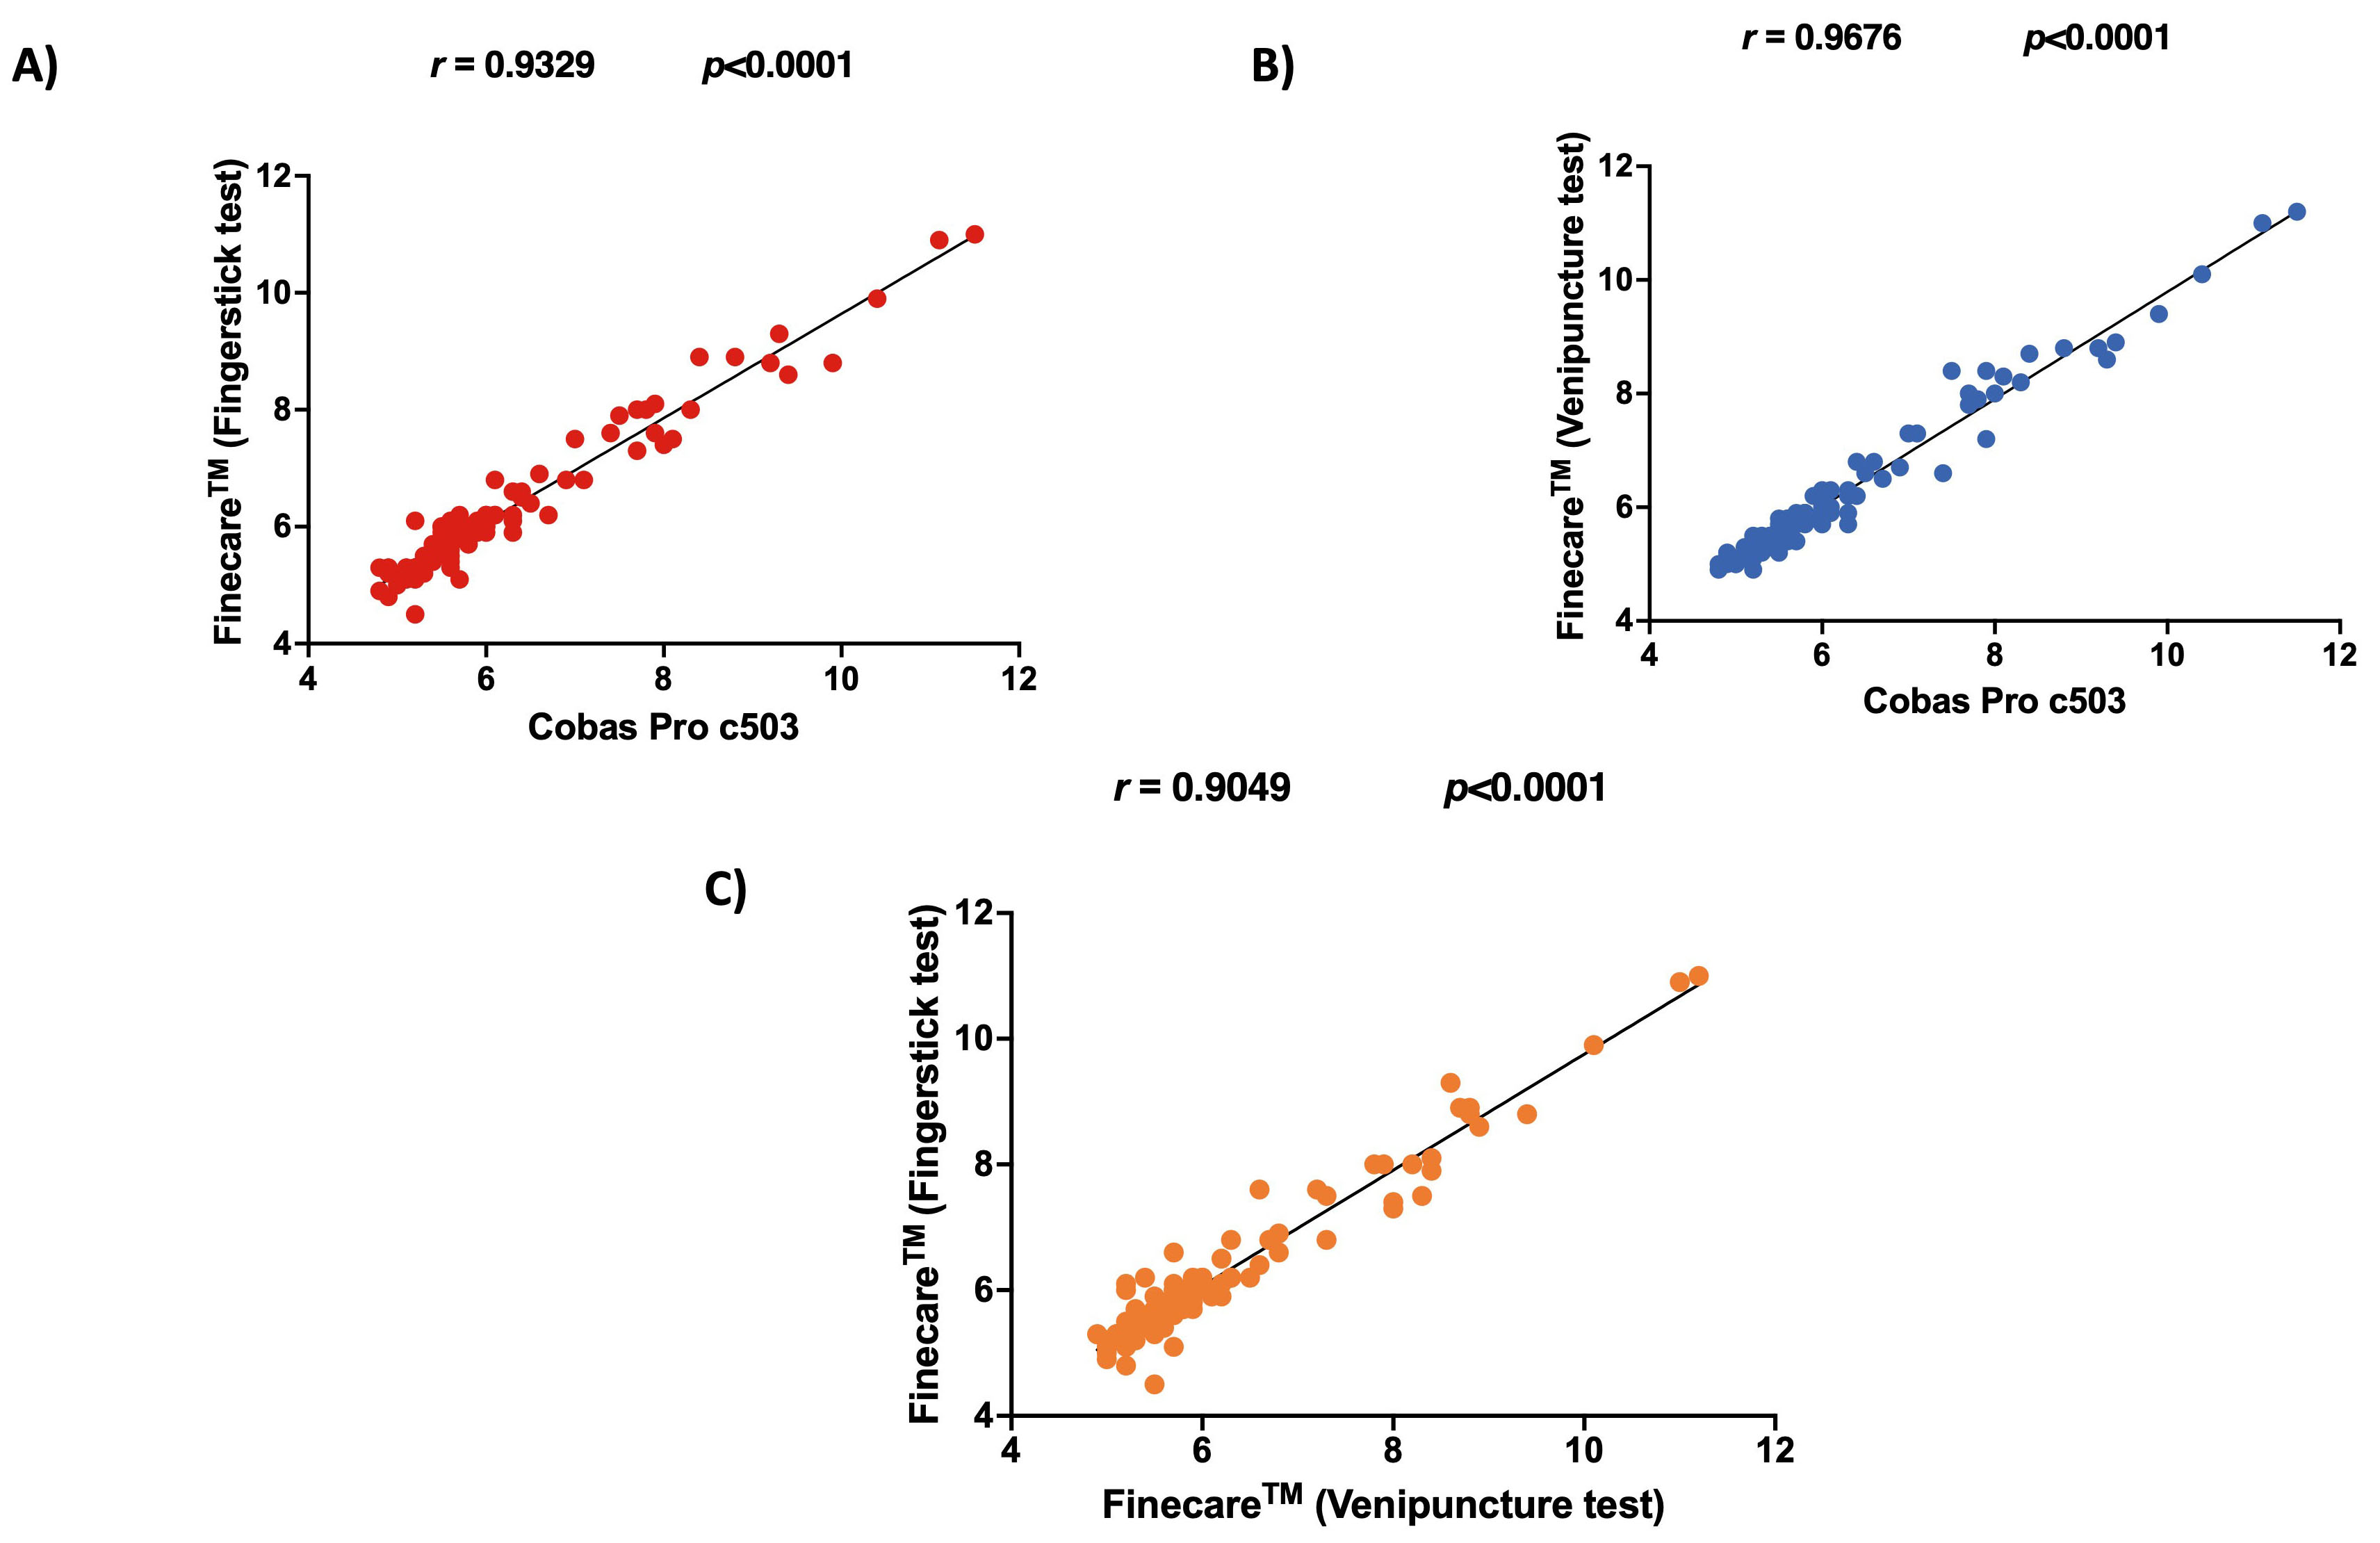 Fig. 1.
Pairwise correlation and linear regression analysis for each
assay. (A) Correlation plot of Finecare
ROC curve analyses showed excellent performance for Finecare™ with an AUC of 0.994 and 0.998 using fingerstick and venous blood samples, respectively (Fig. 2).

An alternative method for comparing Finecare™ and Roche Cobas Pro c503 using fingerstick and venous blood data and results agreement is by performing Bland-Altman plot analysis. Bland-Altman analysis aids in evaluating the agreement between two quantitative tests by graphically depicting the measurement variances by plotting the difference against the mean of the data [24, 25]. Bland-Altman method computes the average difference between two methods of measurement and standard deviation (SD) of the difference, and calculates the ‘95% limit of agreement’ (LOA) as the mean difference. The presentation of the ‘95% LOA’ on the Bland-Altman plot permits a visual decision of how well two measurement methods are in concordance with each other. A smaller range between the LOA is commented as better compliance.
As shown in Fig. 3A,B, Finecare™ fingerstick and venous blood data showed excellent agreement and compliance with Roche Cobas Pro c503 data as the mean bias are 0.05 (LOA: –0.58–0.68) and 0.003 (LOA: –0.49–0.5), respectively, which are very close to 0. Interestingly, a very small mean bias (0.047) was also observed between the fingerstick and the venepuncture data, indicating that the type of sample does not significantly affect the results, and that the assay has high reproducibility.
 Fig. 3.
The bland-Altman plot. Dotted lines present mean bias and agreement limits. The bias is represented by the gap between the X axis and the mean bias dotted line. The mean bias was calculated to be 0.05, 0.003, 0.047 for (A–C), respectively. LOA, Limit of Agreement. n = 100.
We evaluated the performance of Finecare™ using fingerstick and venous blood samples compared to Cobas Pro c503. As depicted in Fig. 4, there was no significant difference between the results obtained from Finecare™ and CobasPro c503 analytical analyser using the fingerstick or venous blood samples.
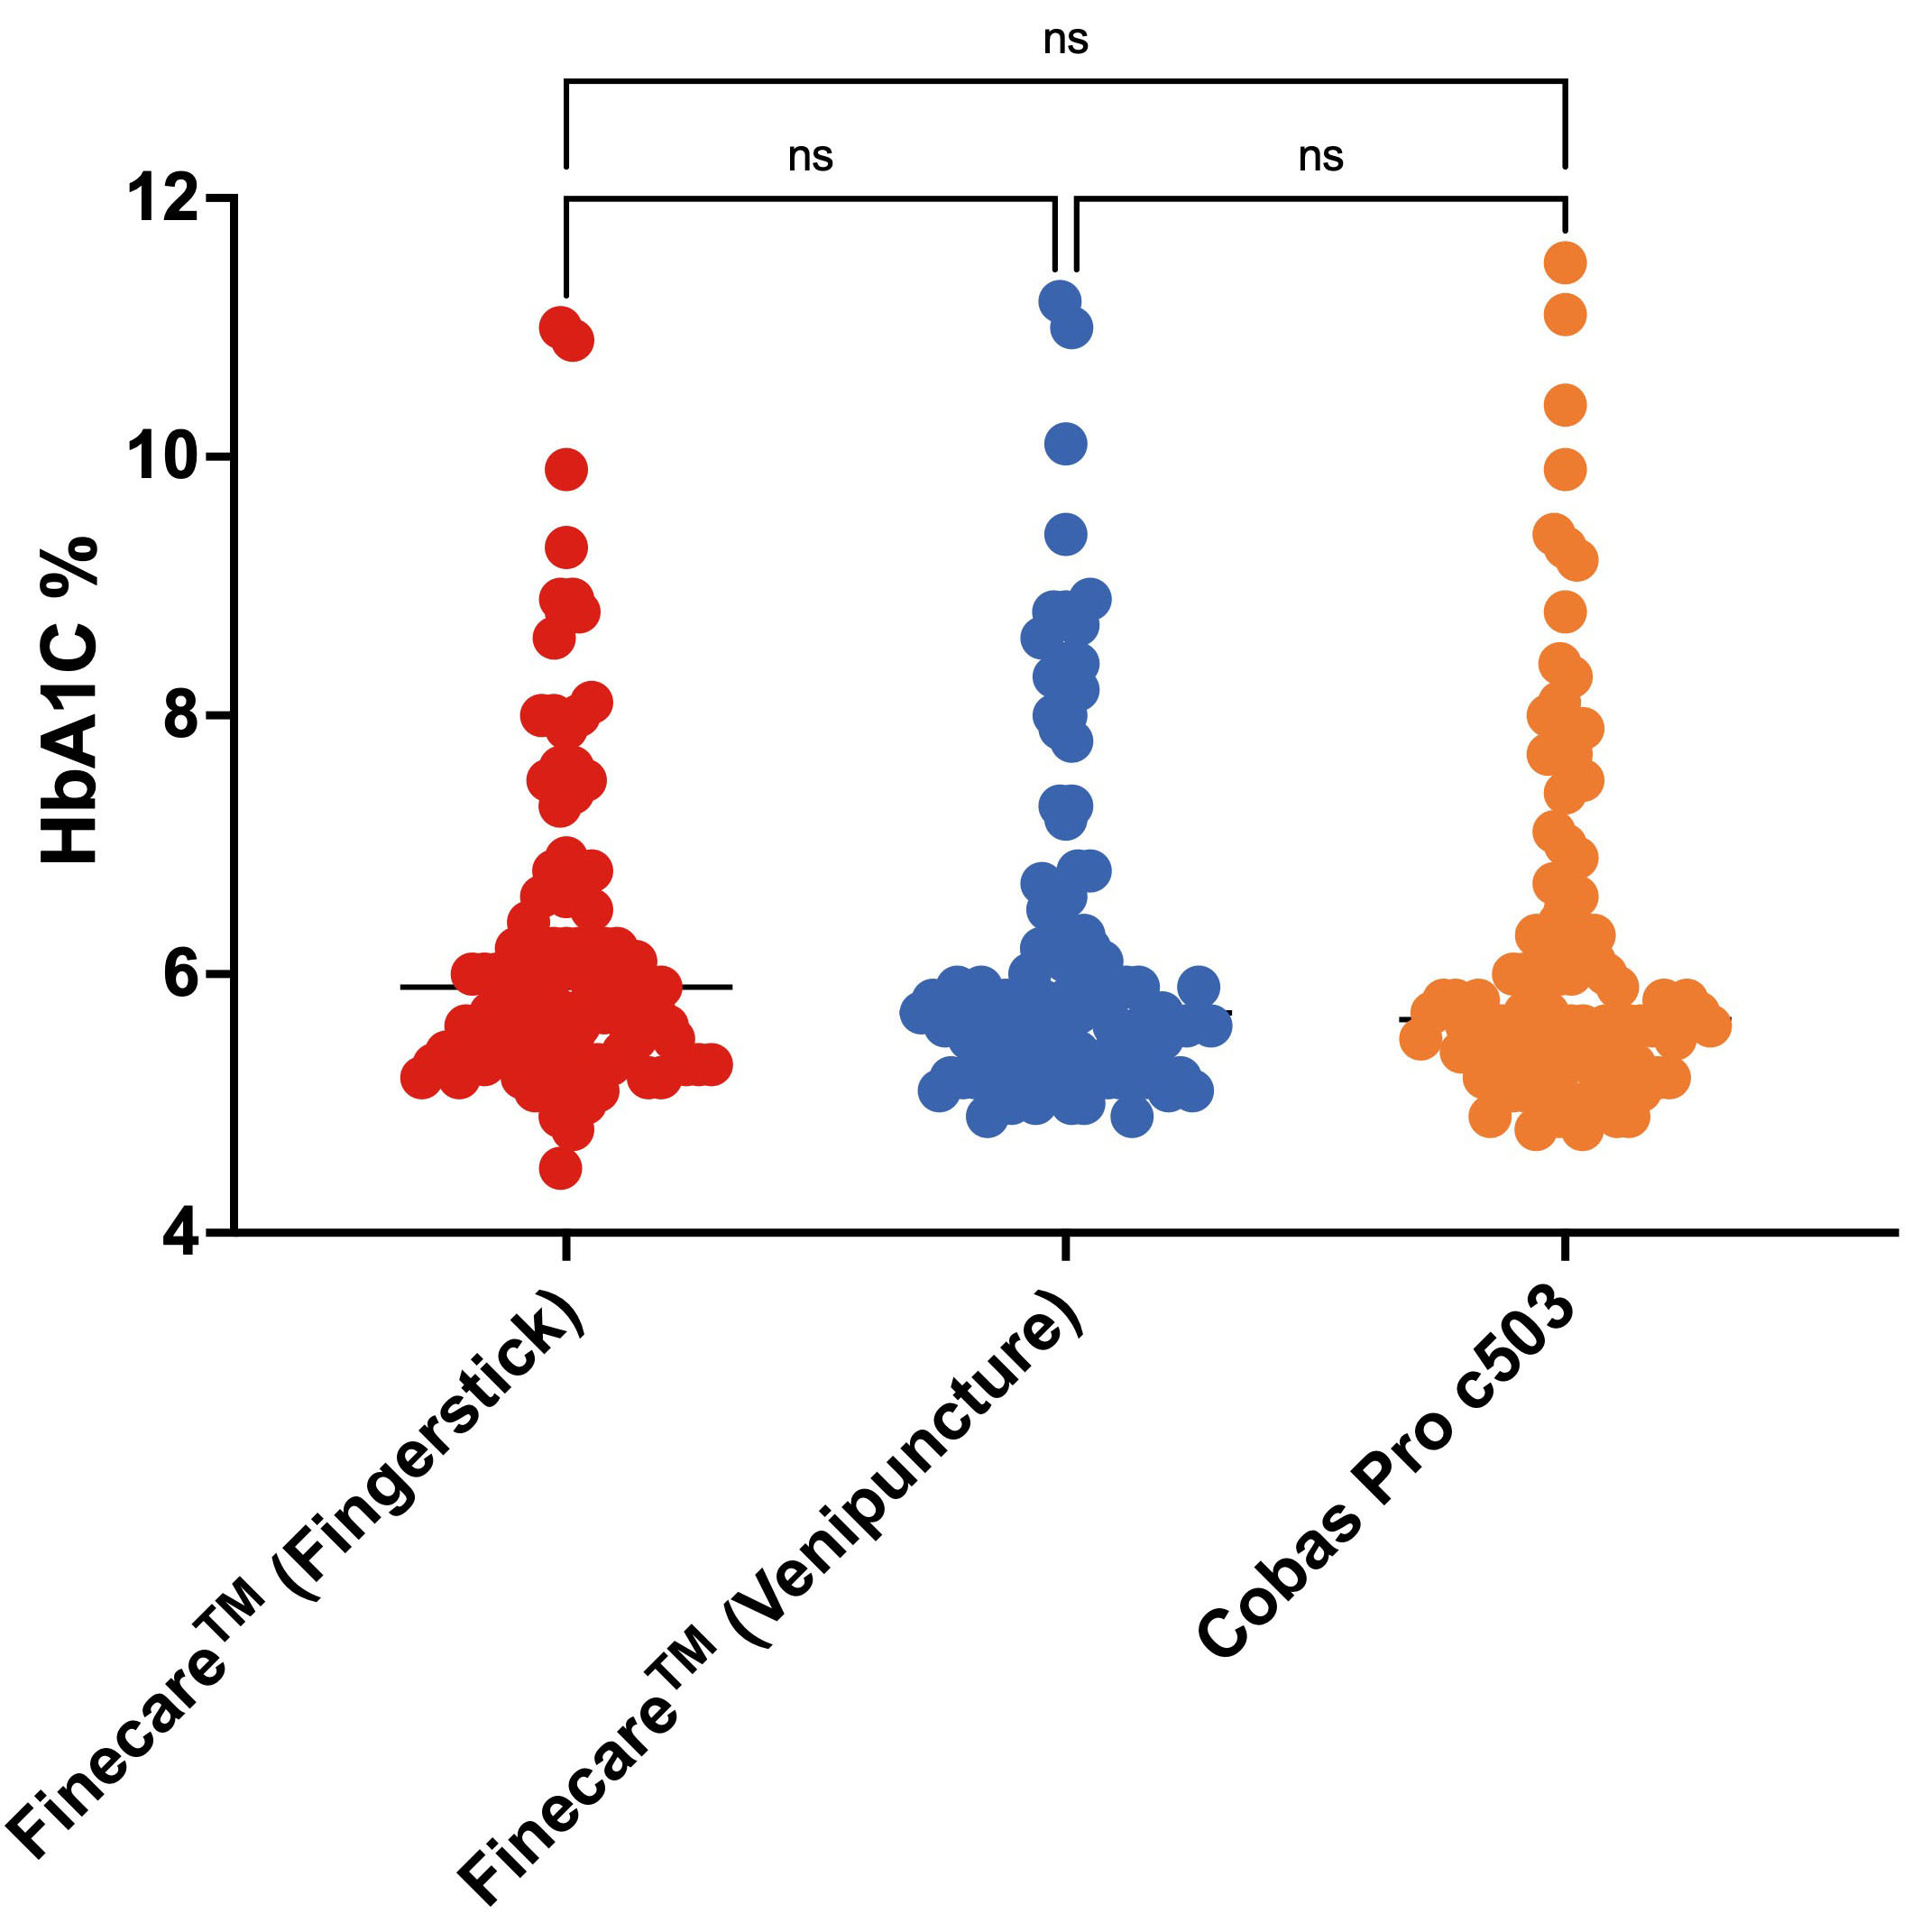 Fig. 4.
Distribution of numerical results obtained from fingerstick whole blood and venous blood using Finecare™ machine and the reference method; Cobas Pro c503. The Nonparametric Kruskal-Wallis test was used to compare the differences between groups. ns, non-significant. n = 100.
According to the current recommendations, patients with an HbA1c level
| (A) Cut-off: 6.5% | Reference Method Cobas Pro c503 | |||
|---|---|---|---|---|
| Positive | Negative | Total | ||
| Finecare™ (fingerstick) | Positive | 23 | 4 | 27 |
| Negative | 2 | 71 | 73 | |
| Total | 25 | 75 | 100 | |
| Finecare™ (venepuncture) | Positive | 25 | 1 | 26 |
| Negative | 0 | 74 | 74 | |
| Total | 25 | 75 | 100 | |
| (B) Cut-off: 6.5% | Finecare™ (venepuncture) | |||
|---|---|---|---|---|
| Positive | Negative | Total | ||
| Finecare™ (fingerstick) | Positive | 24 | 3 | 27 |
| Negative | 2 | 71 | 73 | |
| Total | 26 | 74 | 100 | |
* Positive: Diabetic (
As shown in Table 2, Finecare™ demonstrated 100% (95% CI: 86.3–100) sensitivity and 98.7% (95% CI: 92.8–100) specificity compared to the reference method using venous blood samples. In addition, Finecare™ showed lower sensitivity of 92.0% (95% CI: 74.0–99.0) and a specificity of 94.7% (95% CI: 86.9–98.5) compared to the reference method using fingerstick whole blood. Moreover, we evaluated the sensitivity and specificity of Finecare™ using fingerstick compared to venous blood samples. As expected, using fingerstick whole blood showed a lower sensitivity of 92.3% (95% CI: 74.9–99.1) and a specificity of 95.9% (95% CI: 88.6–99.2) compared to venous blood.
| Reference | Test | Overall Percent Agreement (OPA) | Sensitivity | Specificity | Positive Predictive Value (PPV) | Negative Predictive Value (NPV) | Accuracy/Efficiency | Cohen’s Kappa Coefficient |
|---|---|---|---|---|---|---|---|---|
| Cobas Pro c503 | Finecare™ (fingerstick) | 94.0% (87.4–97.8) | 92.0% (74.0–99.0) | 94.7% (86.9 –98.5) | 85.2% (68.8–93.8) | 97.3% (90.4–99.3) | 94.0% (87.4–97.8) | 0.84 (0.72–0.97) |
| Cobas Pro c503 | Finecare™ (venepuncture) | 99.0% (94.6–100) | 100% (86.3–100) | 98.7% (92.8–100) | 96.2% (78.1–99.4) | 100% (95.1–100) | 99.0% (94.6–100) | 0.97 (0.92–1.00) |
| Finecare™ (venepuncture) | Finecare™ (fingerstick) | 95.0% (88.7–98.4) | 92.3% (74.9–99.1) | 95.9% (88.6–99.2) | 88.9% (72.4–96.1) | 97.3% (90.4–99.3) | 95.0% (88.7–98.4) | 0.87 (0.76– 0.98) |
The concordance assessment between the reference method Cobas Pro c503 and
Finecare™ using venous and fingerstick whole blood samples is
reported in Table 2. The OPA, PPV, and NPV between Cobas Pro c503 and
Finecare™ using venous blood were 99.0% (95% CI: 94.6–100),
96.2% (95% CI: 78.1–99.4), and 100% (95% CI: 95.1–100), respectively.
Whereas, using fingerstick whole blood, the OPA, PPV, and NPV were 94.0% (95%
CI: 87.4–97.8), 85.2% (95% CI: 68.8–93.8), and 97.3% (95% CI: 90.4–99.3),
respectively. Most importantly, Cohen’s Kappa coefficient denoted excellent
agreement between Finecare™ and Cobas Pro c503 (
We classified the participants into three groups according to the American
Diabetes Association (ADA): no diabetes (HbA1c
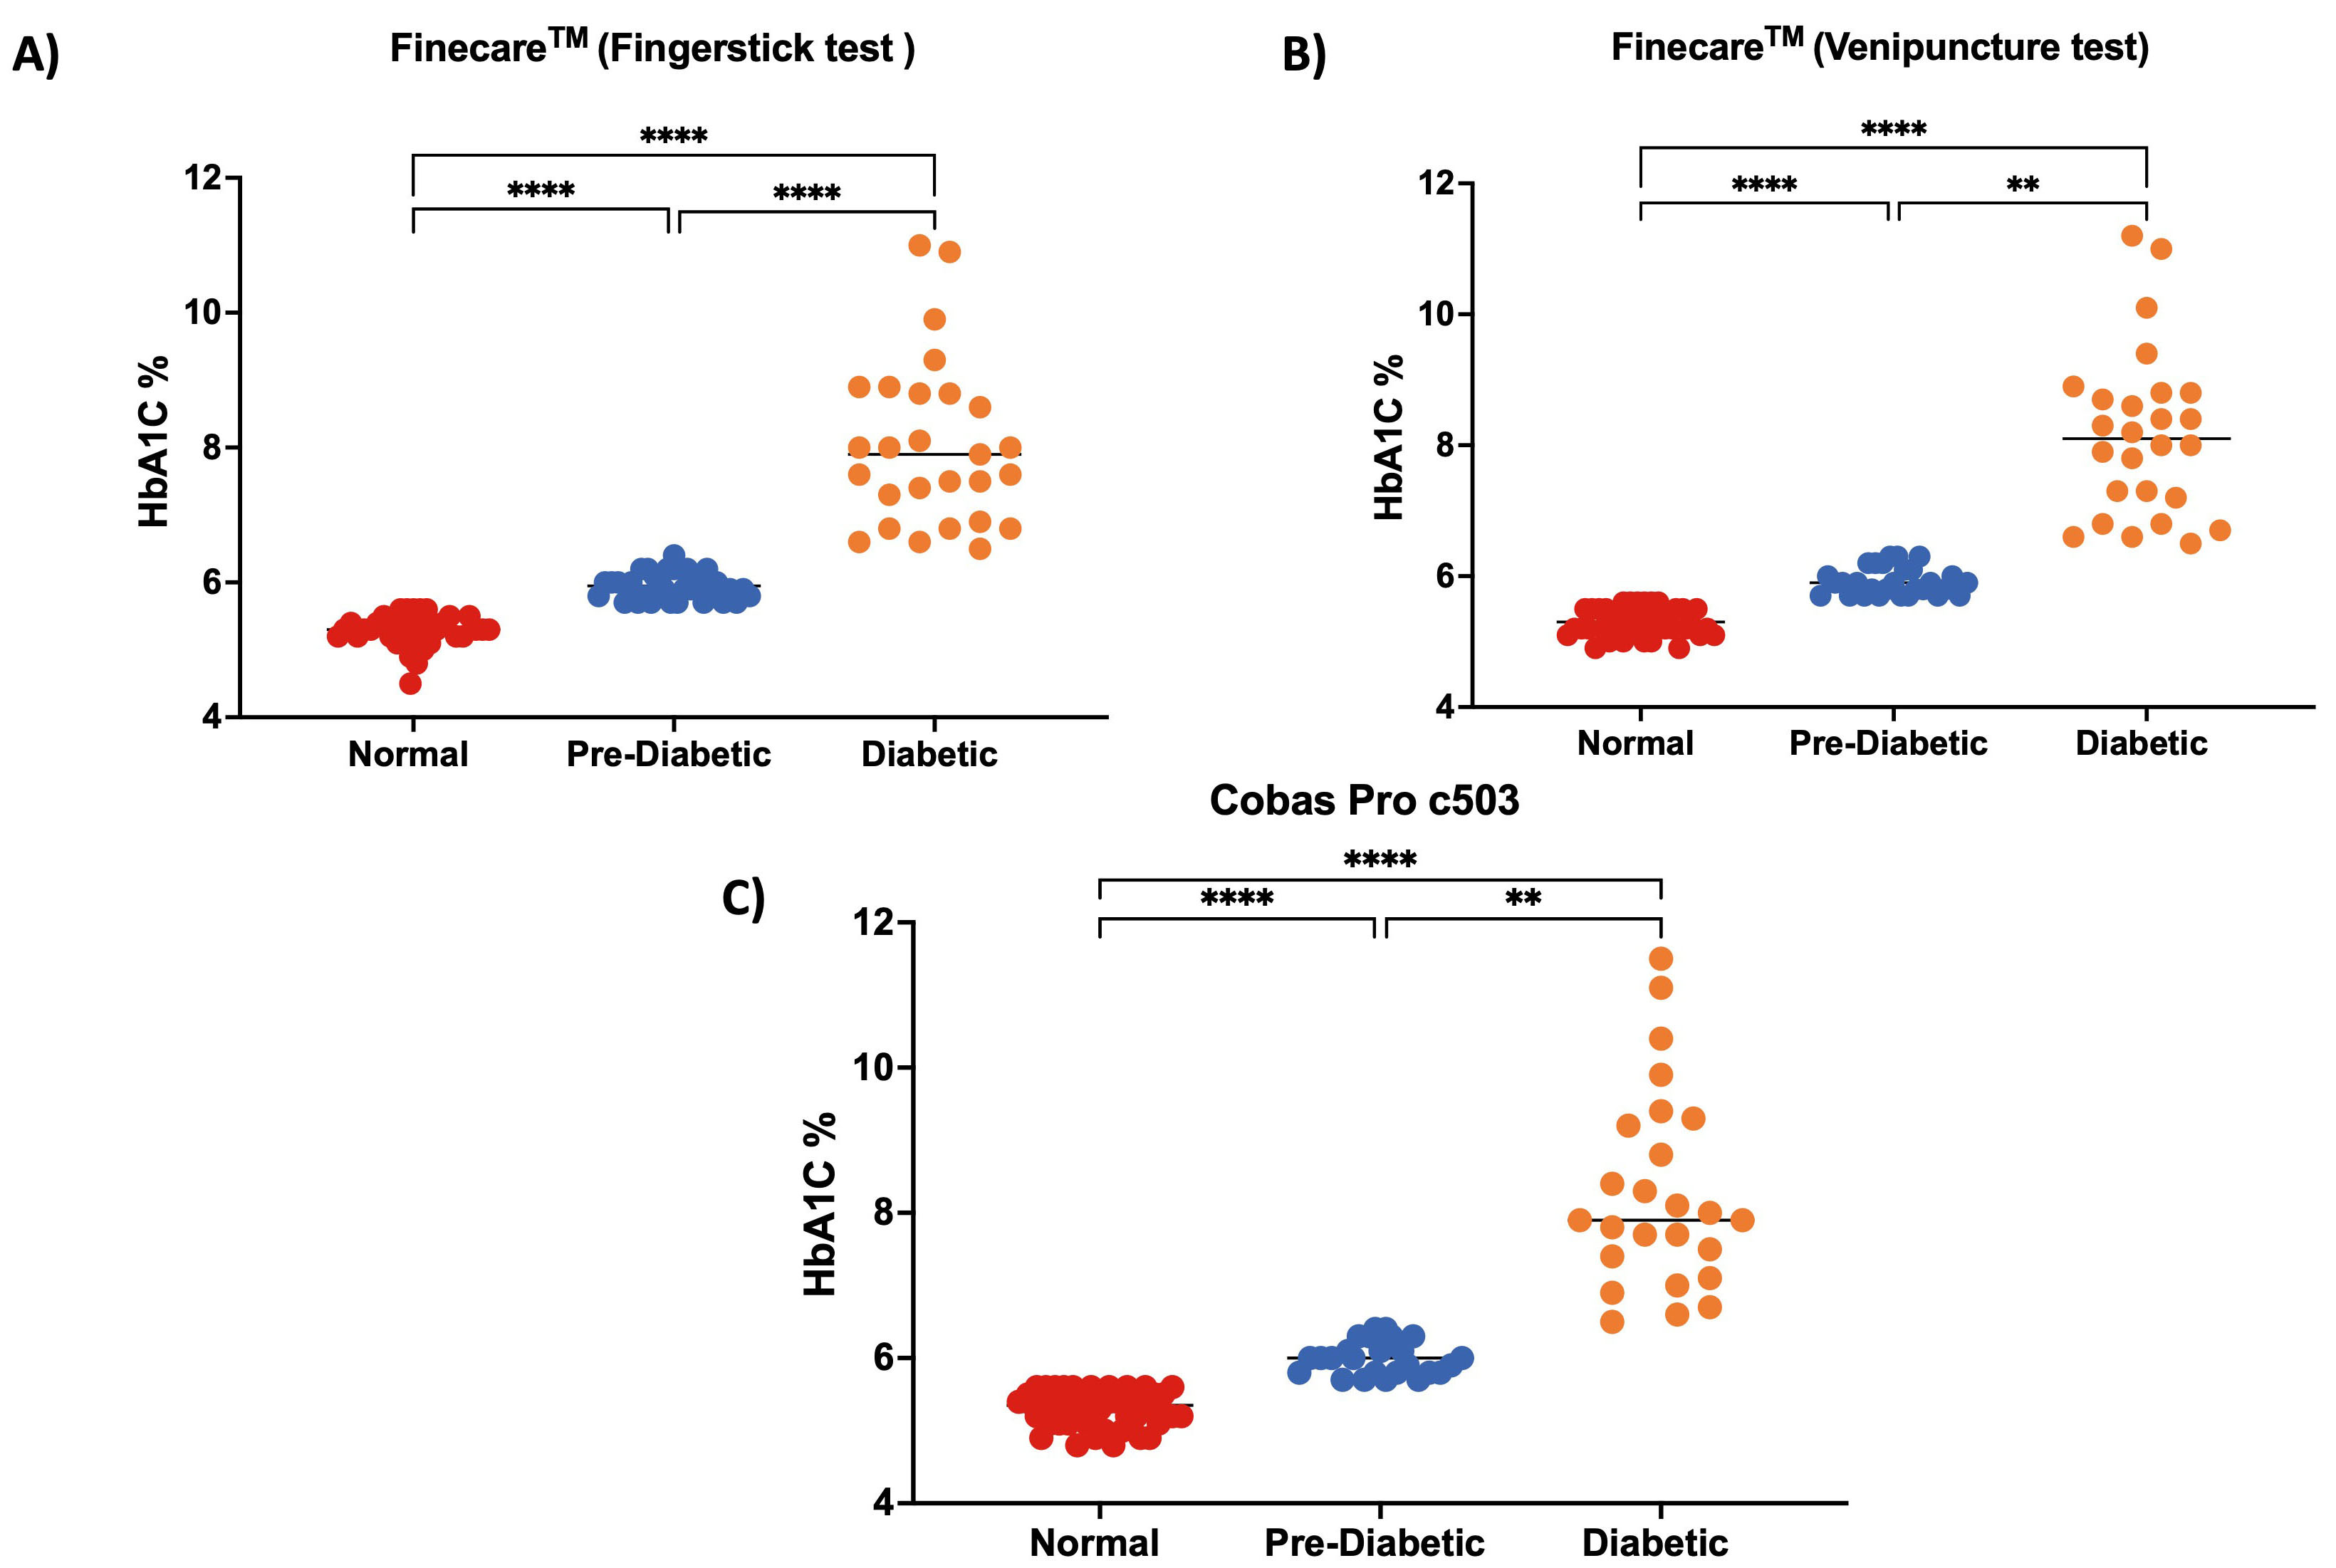 Fig. 5.
Distribution of numerical results.
(A) fingerstick whole blood using Finecare
To ensure the reproducibility of the results, the performance of
Finecare™ was evaluated in another laboratory.
Finecare™ showed 80% sensitivity and 100% specificity compared
to the reference method (Table 3). Nevertheless, similar to our results, a very
strong correlation was observed (r = 0.97, p
| Cut-off: 6.5% | Reference Method Cobas Pro c503 | |||
|---|---|---|---|---|
| Positive | Negative | Total | ||
| Finecare™ | Positive | 20 | 0 | 20 |
| Negative | 5 | 22 | 27 | |
| Total | 25 | 22 | 47 | |
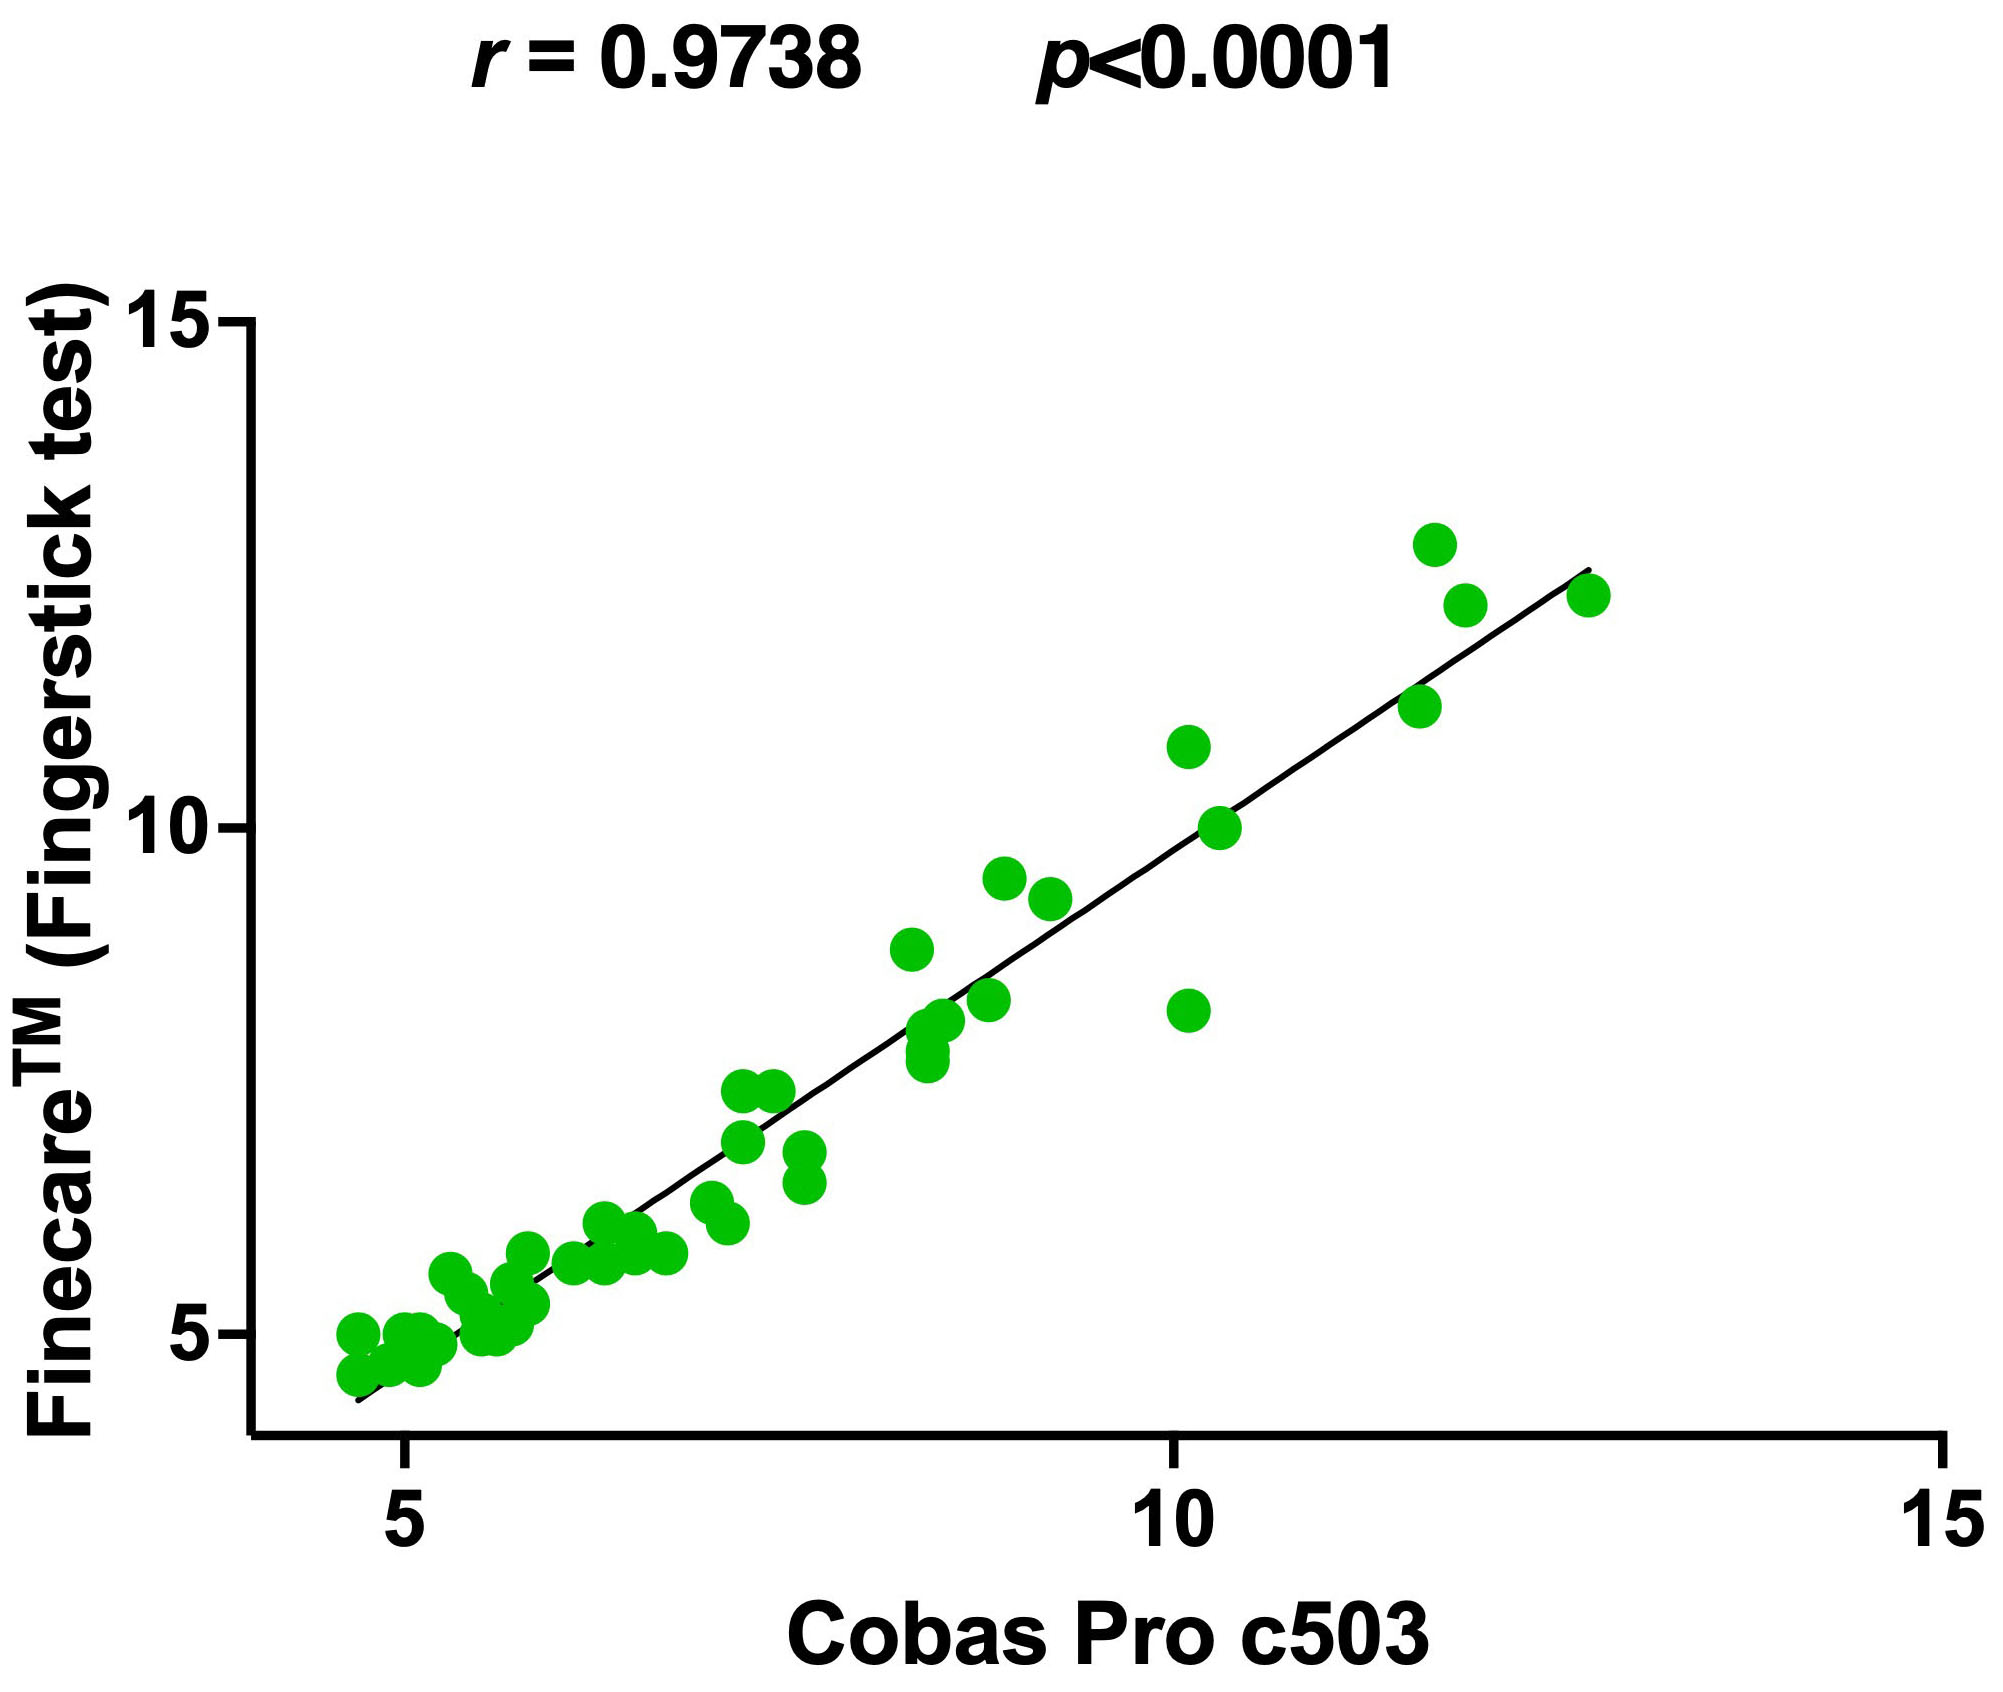 Fig. 6.
Pairwise correlation and linear regression analysis of
Finecare™ in comparison to Cobas Pro c503. Spearman
correlation coefficient (r) and p-value were indicated. The coefficient
of determination (R
To our knowledge, this is the first study conducted to evaluate the performance
of fluorescence-LFIA-based HbA1c test, which marks the novelty of this research
work. In this study, we demonstrated that Finecare™ results are
comparable to the reference method Cobas Pro c503. In addition, there was no
significant difference between Finecare™ and Roche Cobas Pro c503
analytical analyser using the fingerstick or venous blood samples. Furthermore, a
strong significant positive correlation (spearman correlation) and excellent
agreement (Cohen Kappa) were observed between Finecare™ and Cobas
Pro c503 with both fingerstick and venous blood samples (r
One of the key advantages of Finecare™ is obtaining quantitative
results within 5 minutes using fingerstick blood samples. Even though anti-HbA1c
antibodies are more stable and persistent in venous whole blood samples, the
fingerstick whole blood samples are more convenient and easier to use. Further, a
small sample size is used in Finecare™ (10
In this study, we showed that Finecare™ assay could be used
efficiently for the long-term monitoring of HbA1c in diabetic patients. To ensure
the reproducibility of the results, the performance of Finecare™
was evaluated in another laboratory. The assay performs with high reproducibility
(80%) with the two runs repeats done on two different samples taken from two
different laboratories. In addition, Finecare™ showed reproducible
very high specificity (100%) compared to the reference method. Furthermore, a
very strong correlation was also observed (r = 0.97, p
There were a few limitations to our study. We did not show that the
Finecare™ assay was free of artifact interference that could
affect the test results, including samples from patients with hemoglobinopathies
(examples: hemoglobin C disease, hemoglobin S-C disease, sickle cell anemia, and
thalassemia’s). In addition, the size of Finecare™ analyser could
be considered large in size (270
The Finecare™ HbA1c Rapid Quantitative Test showed very good performance, including excellent sensitivity, specificity, correlation, agreement, and concordance with the Roche Cobas Pro c503 (reference method). After further analysis to address the limitations listed above, Finecare™ might be a reliable assay that can be easily implemented for long-term monitoring of HbA1c in diabetic patients.
All data generated or analyzed during this study are included in this published article.
Methodology—MMA. Data analysis—GKN and NY. First draft writing—GKN and NY. Review and editing—SID, EAZ, MMA, AFM, and NAD. All authors read and approved the final manuscript.
Ethical approval exemption (QU-IRB 1766-E/22) was granted by Qatar University.
M.M.A would like to acknowledge his lab staff for the technical support.
This research received no external funding.
The authors declare no conflict of interest. All kits and Finecare™ readers were provided as free of charge as an in-kind support from Wndfo to support this study. GKN is a member of the editorial board of this journal. We declare that GKN had no involvement in the peer review of this article and has no access to information regarding its peer review.
Publisher’s Note: IMR Press stays neutral with regard to jurisdictional claims in published maps and institutional affiliations.