


1 Centre of Glycomics, Institute of Chemistry, Slovak Academy of Sciences, 84538 Bratislava, Slovakia
2 Centre for Inherited Metabolic Disorders, National Institute of Children's Diseases, 83340 Bratislava, Slovakia
3 Department of Paediatrics, Faculty of Medicine, Comenius University in Bratislava, and National Institute of Children's Diseases, 83340 Bratislava, Slovakia
Abstract
Background: Alpha-mannosidosis is a rare lysosomal storage disorder,
caused by decreased activity of
Keywords
- alpha-mannosidosis
- HPLC
- mass spectrometry
- NMR
- velmanase alpha
Alpha-mannosidosis (AM) is an ultra-rare, autosomal recessive lysosomal storage
disorder (LSD) [1] with an estimated prevalence between 1:500,000 and 1:1,000,000
[2]. It is caused by a decreased activity of lysosomal enzyme
A diagnostic algorithm for AM was recently proposed [8, 9]. Diagnosis of AM is
based on measuring
In the presented work, we have utilized and compared three instrumental
approaches to analyze urinary oligosaccharides in AM patients:
All samples were obtained following local ethical and consent guidelines. Urine samples of AM patients and negative controls were obtained from the Center for Inherited Metabolic Disorders of National Institute of Children’s Diseases, Bratislava, Slovakia, following standard operating procedures. The experimental study protocol was reviewed and confirmed by the hospital ethics committee. The levels of creatinine (crea) were determined by Vitros 5.1 Fusion Clinical Chemistry Analyzer (Ortho Clinical Diagnostics, Rochester, NY, USA). In total, five samples from four AM patients without the ERT administration (positive controls, males aged 5–20 years) were analyzed in addition to three samples from one patient undergoing the ERT treatment (2 years old female). In order to increase the sample size, two positive control samples from one representative patient were included, based on sample availability. Additionally, analysis of samples over time may provide valuable information about the disease progression and changes in biomarker levels of untreated patients. Diagnosis of all patients was confirmed by enzymatic activity assay and DNA sequencing.
Acetonitrile (ACN), sodium cyanoborohydride (NaBH
A volume of urine equivalent of 10
Fluorescent labeling was done using 2-AB according to a previously published
method [16]. Briefly, 5 mg 2-AB was dissolved in 100
Oligosaccharides were analyzed using Thermo Accela HPLC (Thermo Fisher
Scientific, San Jose, CA, USA) on a HILIC ACQUITY UPLC BEH Amide Column (130
Å, 1.7
| Time (min) | Flow (mL/min) | % MP B |
|---|---|---|
| –2 | 0.4 | 90 |
| 0 | 0.4 | 90 |
| 2 | 0.4 | 80 |
| 46 | 0.4 | 65 |
| 47 | 0.25 | 65 |
| 48 | 0.25 | 0 |
| 53 | 0.25 | 0 |
| 58 | 0.4 | 90 |
The analytes were detected using Dionex UltiMate 3100 fluorescence detector
(Dionex Softron, Germering, Germany) with the excitation wavelength set to 250 nm
and the emission wavelength set to 430 nm. A calibration ladder of 5, 10, 50,
100, 150, 200, and 250 nM of both standards was measured in triplicate.
Chromatograms were processed in Chromeleon v. 7.2.10 (Thermo Fisher Scientific,
San Jose, CA, USA). Limits of detection (LOD) and limits of quantification (LOQ)
were calculated from obtained calibration curves. The samples were diluted to
match the calibration range with a mixture of 70% ACN: 30% MP A before analysis.
The concentration of oligosaccharides was calculated from individual peak areas
according to calibration curves of maltotetraose and maltohexaose and expressed
in
Samples prior to HPLC separation, as well as the HPLC eluate, were analyzed by
MALDI-TOF MS in order to match the structures to corresponding HPLC peaks. The
eluate was collected into empty tubes, dried under vacuum, and reconstituted in 3
100
Anomeric H1 signals of all 1,3,6-linked
where [m] and [A
Each sample from a monitored patient was analyzed in triplicates by both
HPLC-FLD and
Neither HPLC-FLD, MALDI-TOF, nor
For an enhancement of signals’ resolution, the
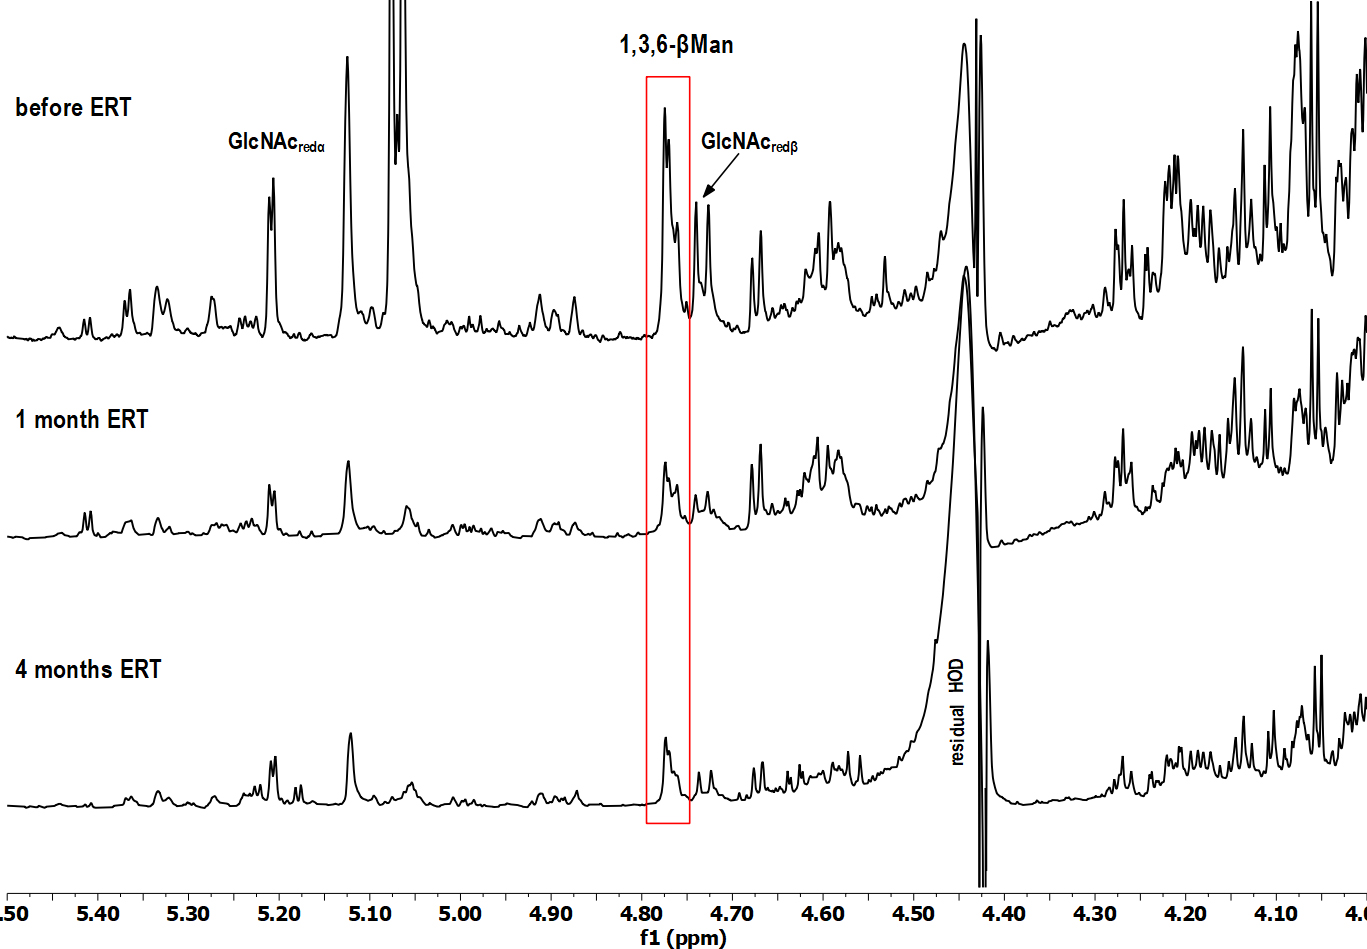 Fig. 1.
Selected region of
HPLC-FLD and NMR methodology for determination of an overall ManOS content was set up on a set of five urine samples collected from four AM patients not subjected to ERT yet. Obtained values are shown in Table 2. Additionally, samples from one representative patient (9 years old male) were collected twice, with a four-month time lapse, on account of monitoring the patient’s status and demonstrating the potential changes in ManOS levels in time.
| AM Patient | ManOS ( | |
|---|---|---|
| HPLC-FLD | ||
| 14y M | 122.6 | 46.3 |
| 20y M | 150.1 | 52.5 |
| 5y M | 287.0 | 84.9 |
| 9y M | 166.0 | 62.2 |
| 9y M | 206.7 | 82.1 |
Pearson’s correlation coefficient was calculated as 0.915. AM, alpha-mannosidosis; crea, creatinine; HPLC-FLD, high-performance liquid chromatography with fluorescence detector; M, male; ManOS, mannose-rich oligosaccharides; NMR, nuclear magnetic resonance.
The different values obtained by both techniques lie in the mode of sample preparation for measurement. While for HPLC-FLD, the derivatization is required for ManOS detection, the urine is used without any treatment for NMR. To compare two different approaches including diverse enrichment methods (sample derivatization for HPLC-FLD analysis), the correlation coefficient was determined. A value of 0.915 of Pearson’s correlation coefficient suggested a strong positive correlation between data obtained by NMR and HPLC-FLD, even though each method produced different absolute values of ManOS concentration in the samples.
Previously optimized HPLC-FLD method was used for further analysis of the set of samples from AM patients without ERT, was applied further for the analysis of urine samples of another patient collected (i) prior to ERT onset, (ii) after one month and (iii) after four months of ERT. Representative MALDI-TOF MS spectrum and HPLC-FLD chromatogram of the sample before ERT onset are shown in Fig. 2. All labeled peaks in the HPLC-FLD chromatogram (Fig. 2B) were identified by MALDI-TOF analysis performed on collected single eluates. Oligosaccharides’ precise isomeric structures cannot be determined by the utilized methods, therefore individual ManOS were quantified as a sum of position isomers. Due to a severe limitation of the MALDI-TOF approach in the distinction of stereoisomers, the identity of mannose units in detected oligosaccharides was confirmed by NMR.
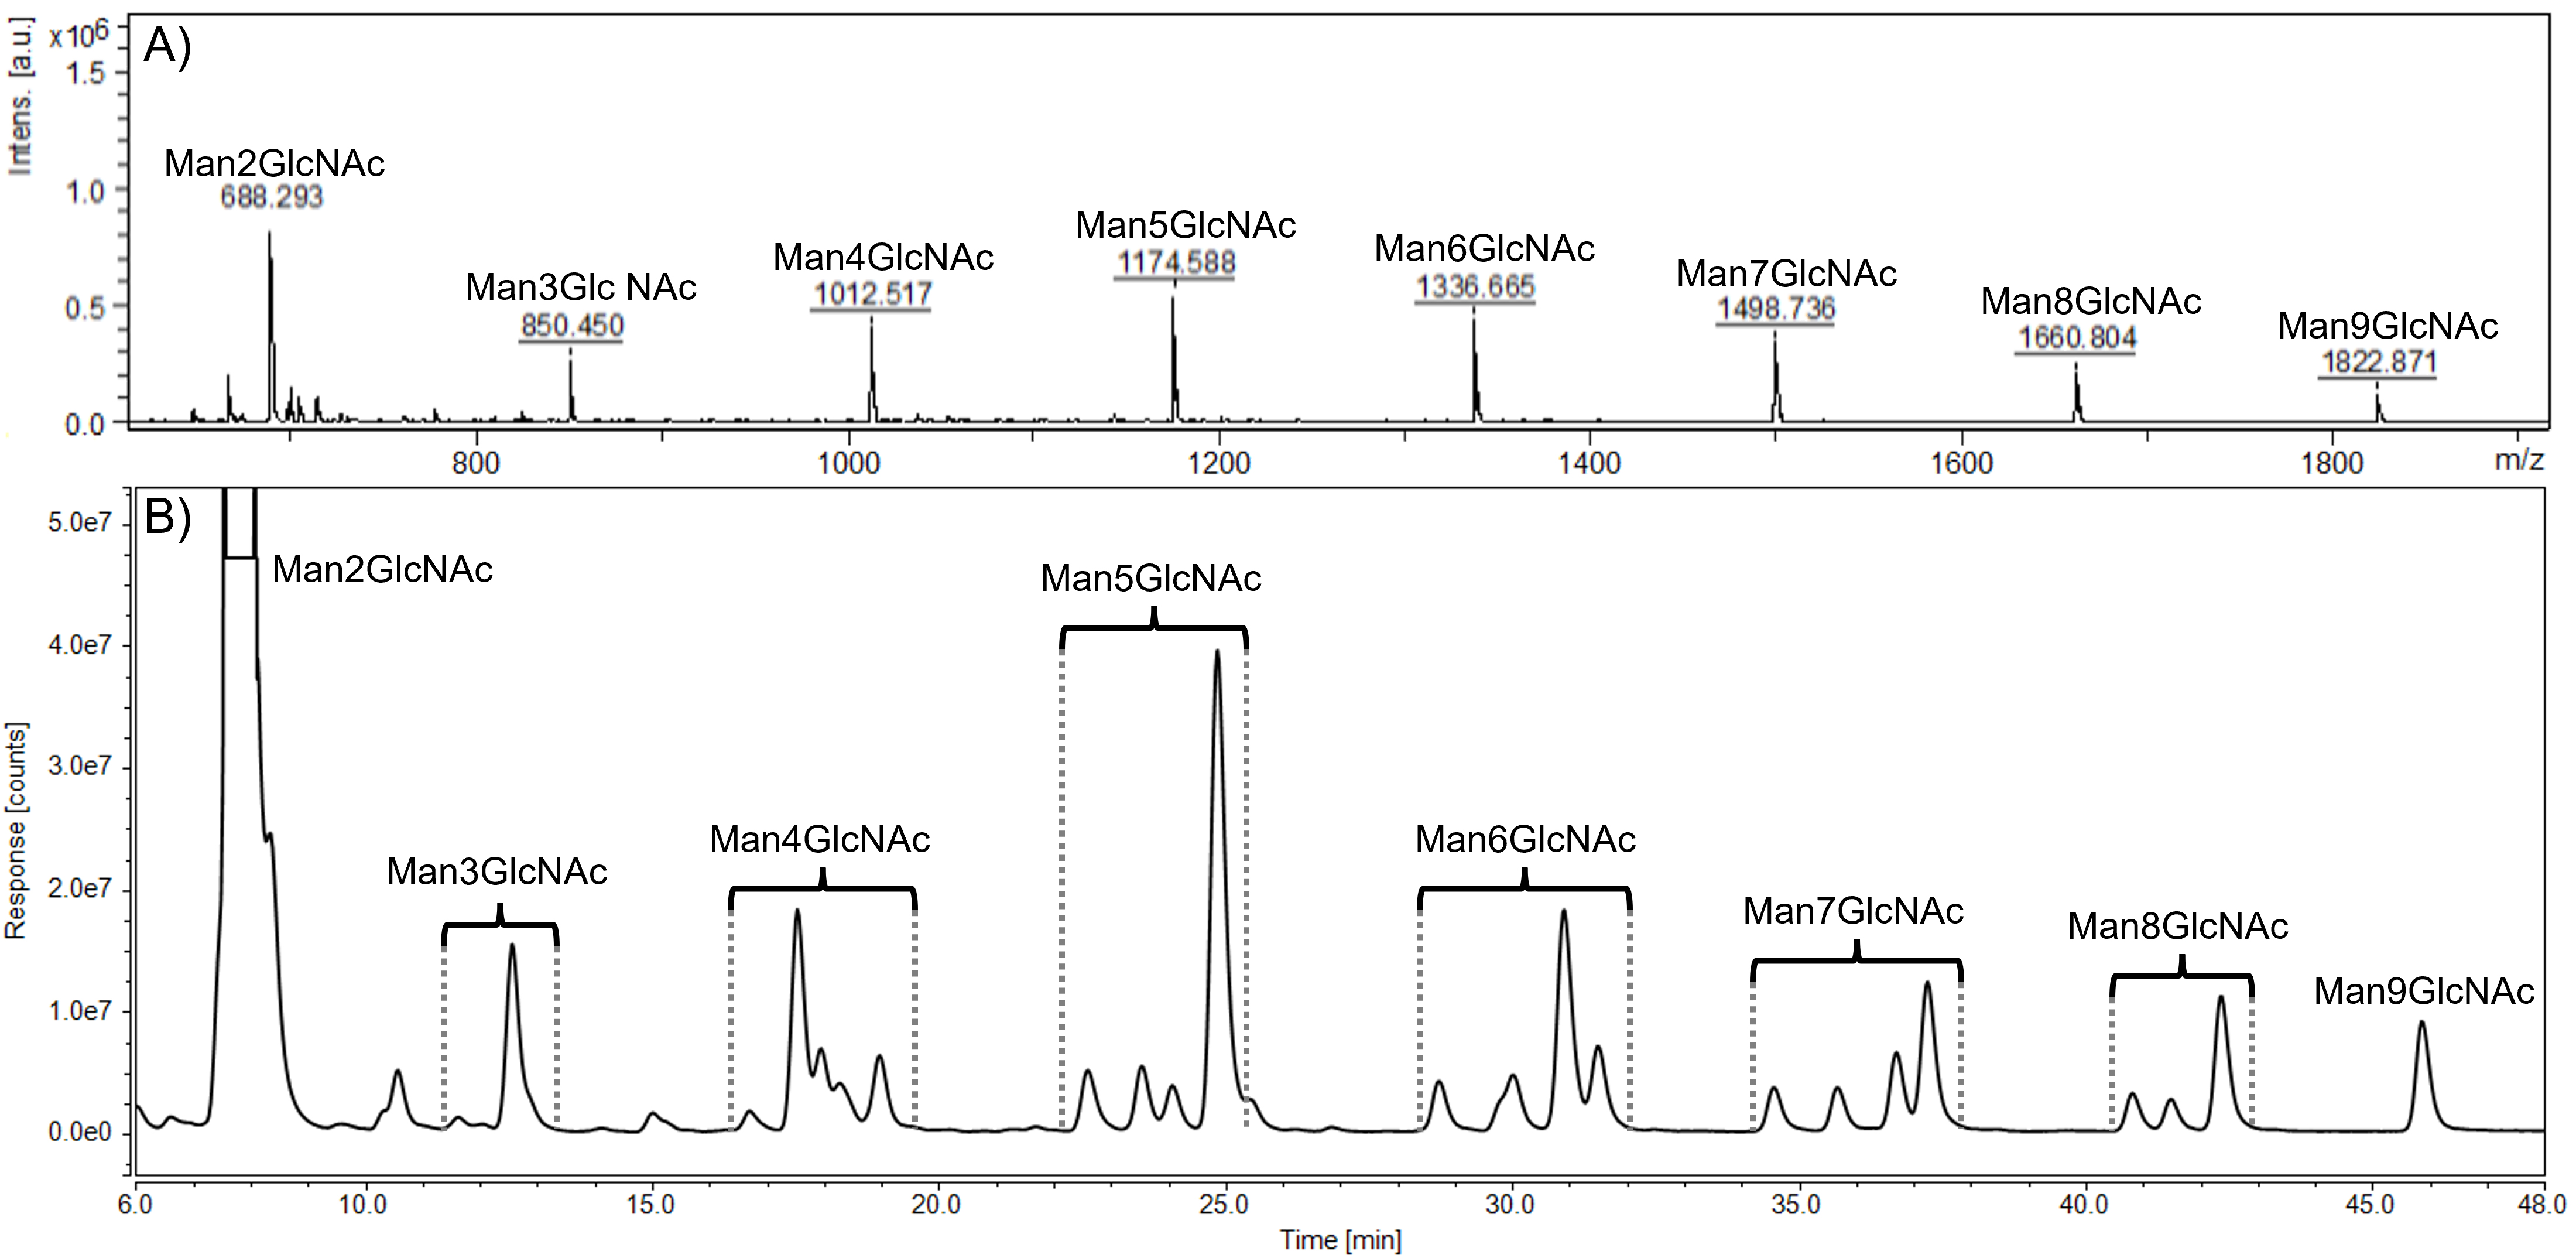 Fig. 2.
Representative MALDI-TOF spectrum (A) and HPLC-FLD chromatogram (B) of urinary oligosaccharides in alpha-mannosidosis. Profiles were determined in the alpha-mannosidosis patient sample before the ERT administration. HPLC peaks within the brackets represent position isomers of mannose-rich oligosaccharides (Man2GlcNAc - Man9GlcNAc). GlcNAc, N-acetylglucosamine; Man, mannose.
Based on the results from HPLC-FLD, prior to ERT onset, the total level of ManOS
(calculated as the sum of single Man2GlcNAc - Man9GlcNAc oligosaccharides) was
107.87
A detailed analysis has shown that in the HSQC spectrum (data not shown) of the
baseline urine sample (before ERT administration), the cross-peak signals,
specific for a trisaccharide Man2GlcNAc, were dominant: the signal of the
terminal
The levels of individual ManOS were determined by HPLC-FLD. For the evaluation
of relative changes of Man2GlcNAc - Man9GlcNAc over the course of ERT, individual
levels of oligosaccharides were normalized to those determined in the sample
before therapy administration. Mean relative changes from baseline values of
individual urinary oligosaccharides over the course of ERT according to HPLC-FLD
are shown in Fig. 3. In the baseline sample, collected prior to the ERT, the
levels of individual ManOS estimated by HPLC-FLD were following (in
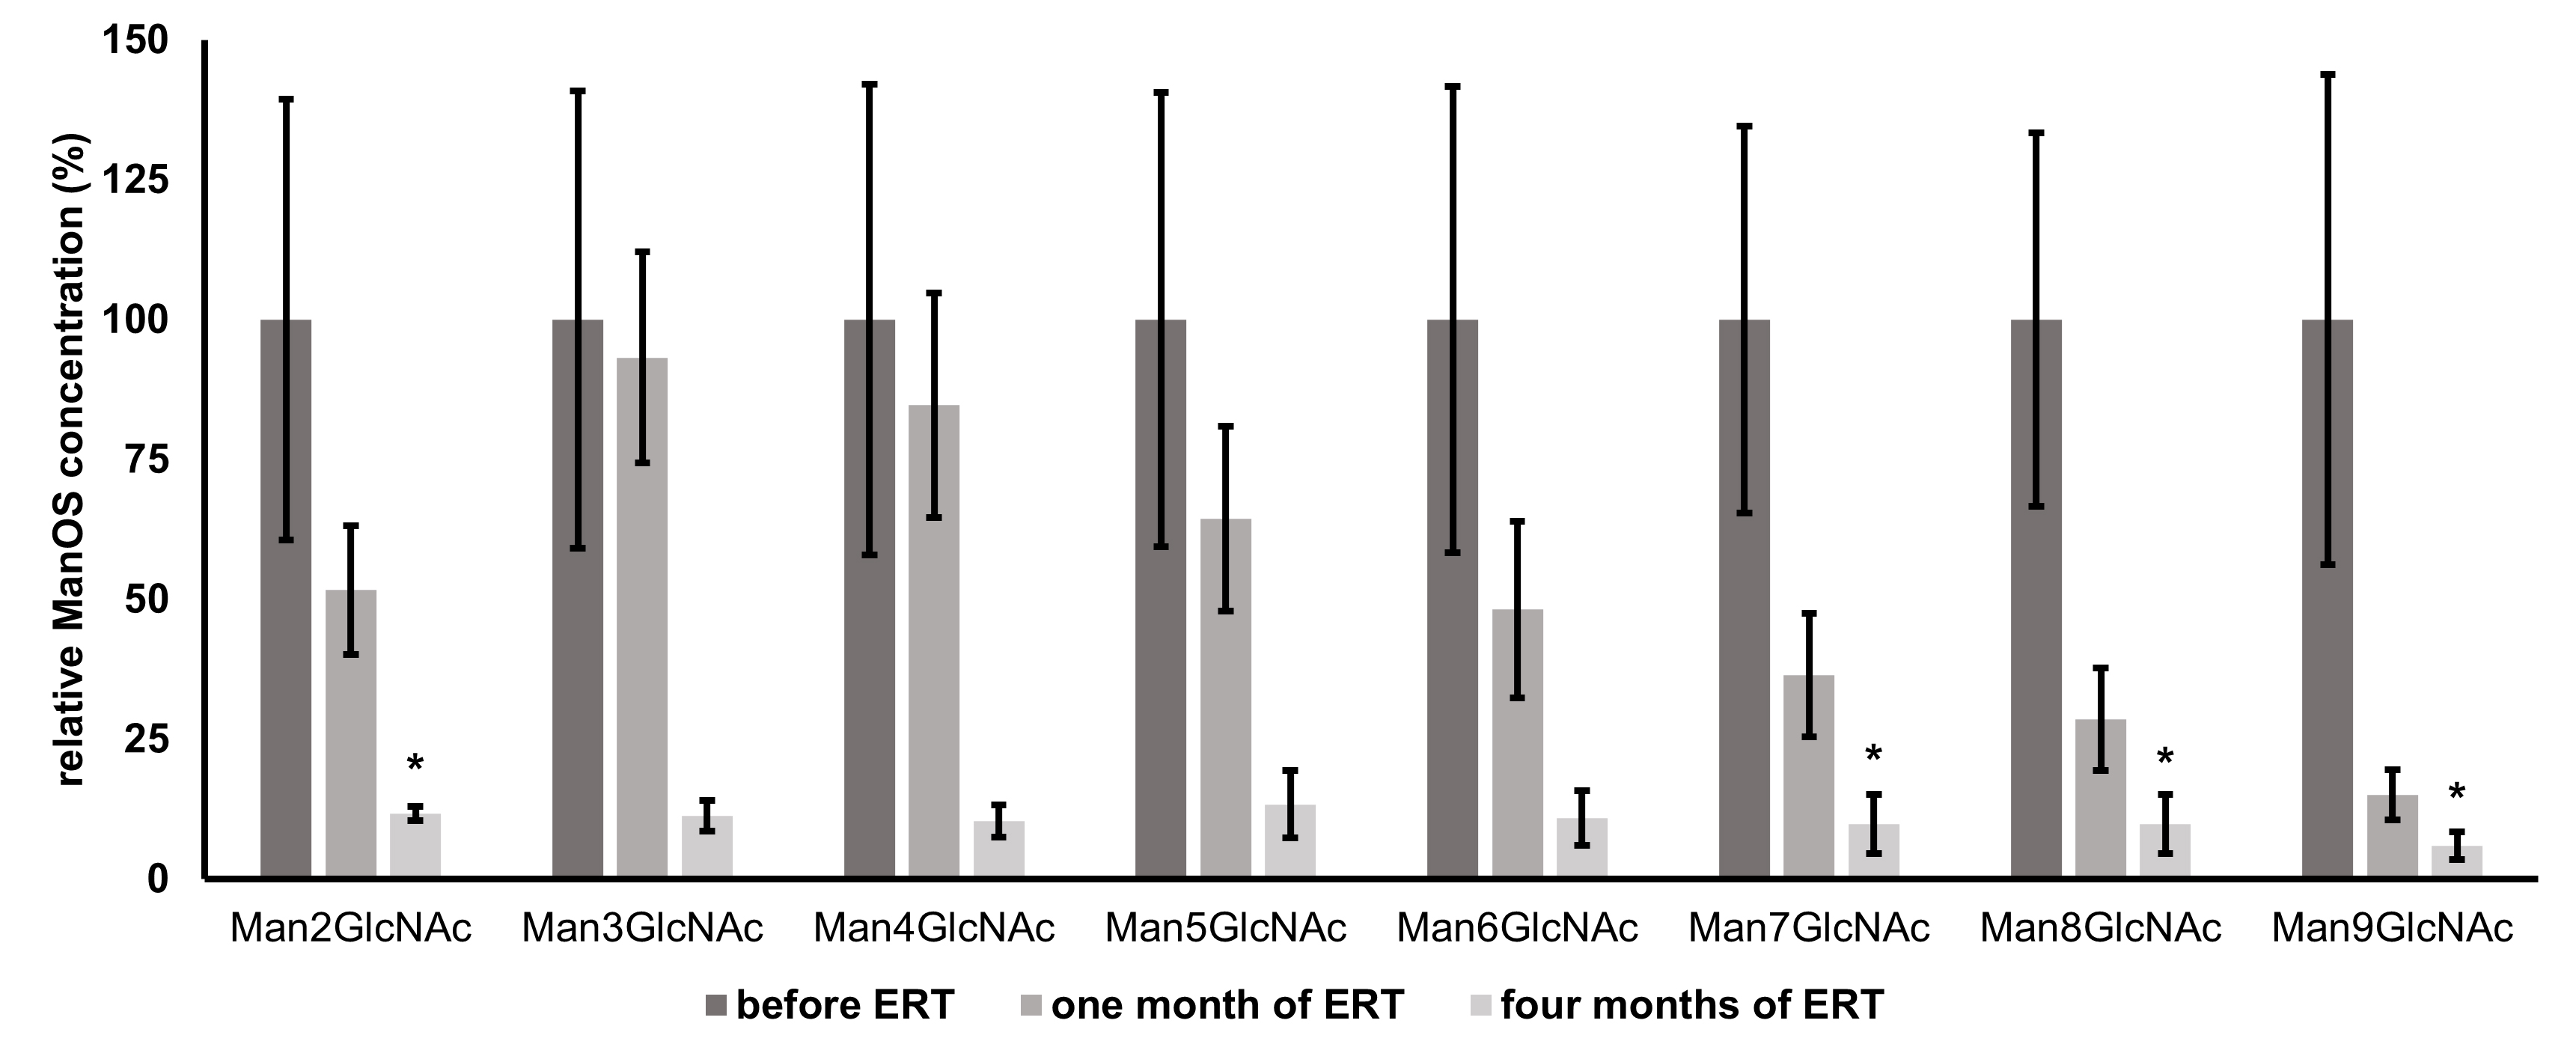 Fig. 3.
Mean relative changes from baseline values (prior to ERT
administration) of individual urinary oligosaccharides (Man2GlcNAc - Man9GlcNAc)
over the course of ERT determined by HPLC-FLD. Individual ManOS concentrations
are normalized to their levels prior to therapy administration (baseline values
represent 100 %); n = 3, error bars represent
After the comparison of
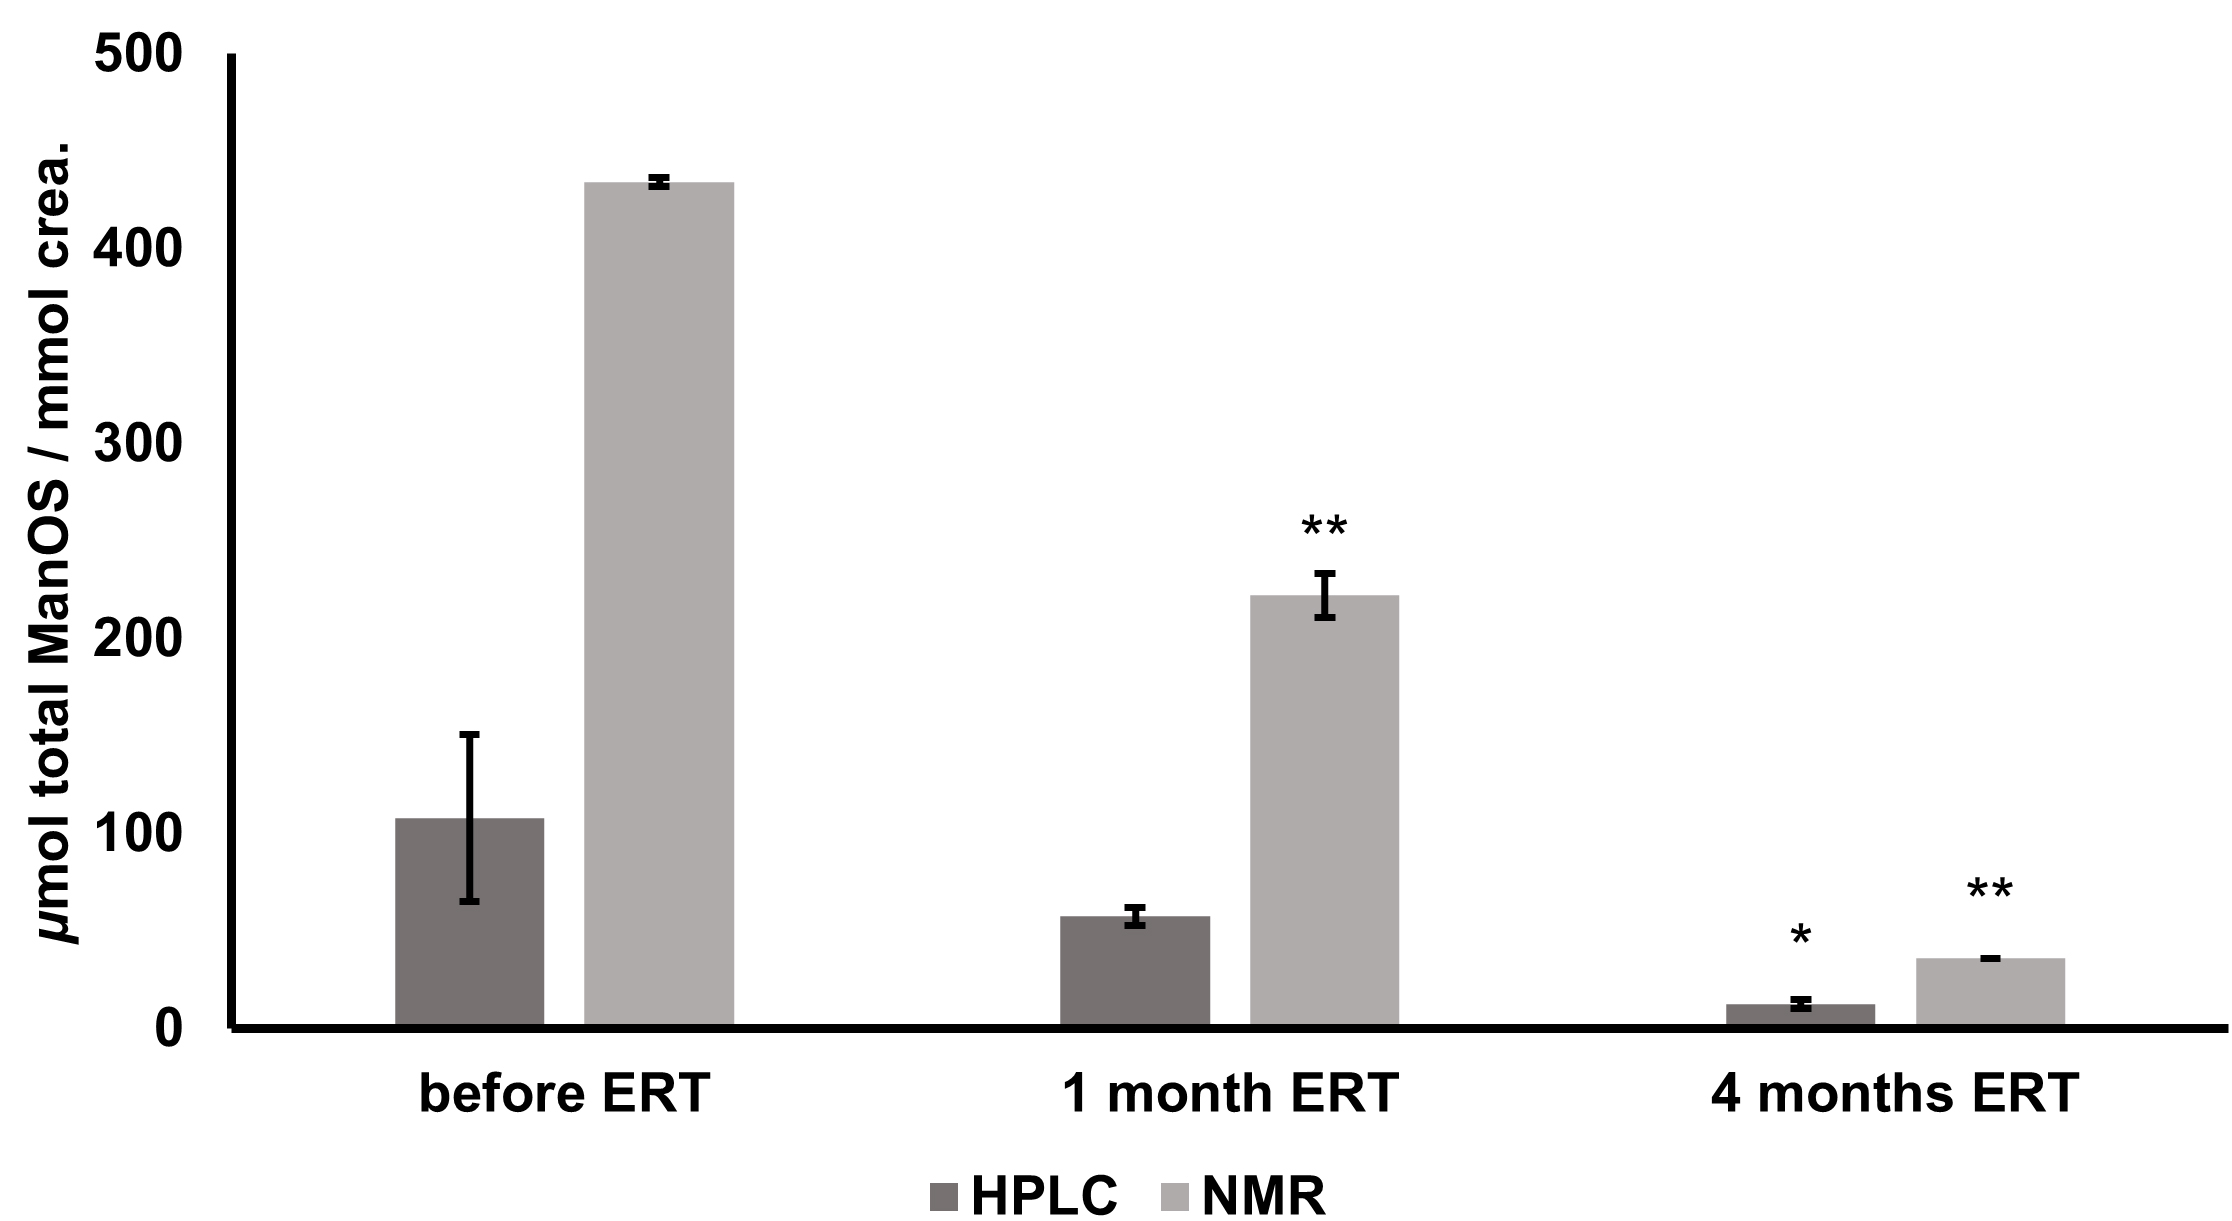 Fig. 4.
Changes in total urinary oligosaccharide levels of alpha
mannosidosis patient during ERT determined by HPLC-FLD and 1H NMR. Expressed as
Pearson’s correlation coefficient for the data from ERT efficacy monitoring
(samples prior to ERT onset, after one month, and after four months of ERT)
obtained from two different analytical approaches was calculated as 0.99
(p
No detected presence of ManOS in healthy controls is in accordance with literature data [15] and our previous results, even though traces of low molecular mass ManOS (Man2GlcNAc - Man4GlcNAc) were reported in some healthy subjects [18]. Despite a higher concentration of lower molecular mass mannose-rich oligosaccharides identified in the urine of AM patients, ManOS with seven to nine mannose units are more specific for alpha-mannosidosis as they were not reported for other LSDs [18, 19].
Urine is a key carrier of hydrophilic waste products, including carbohydrates and their conjugates [20]. Complete chromatographic separation of complex mixtures of urinary oligosaccharides and their isomers is challenging due to frequently occurring overlapping peaks, as was the case of Man4GlcNAc in our study (Fig. 1B). The selected HILIC-based column provides better separation of polar and small hydrophilic molecules as well as glycosidic linkage isomers when compared to reverse-phase columns. This fact makes it suitable for the analysis of free urinary oligosaccharides. For a detailed description of HILIC advantages, we refer to two comprehensive reviews published on this topic [21, 22].
An exceptional capacity of NMR to resolve thousands of peaks in complex
metabolite mixtures such as urine is probably what led NMR to be the technology
of choice to initially develop the field of metabolomics [20, 23, 24, 25]. In
addition, NMR does not require preselection of analysis conditions, sample
preparation is straightforward [26, 27] and each separate resonance observed in
an NMR spectrum is specifically assigned to an individual compound, while
simultaneously providing comprehensive structural information. The main
disadvantage of the application of NMR spectroscopy in the monitoring of ERT
efficacy in alpha-mannosidosis is its inability to distinguish individual ManOS
and their respective levels in urine. However, the combination of both HPLC-FLD
and
Contrary to HPLC-FLD analysis,
When compared with other published literature concerning the absolute quantification of ManOS by HPLC-FLD [12], LC-ESI-MS/MS [31], and HPLC-PAD [32], the quantities determined in our study by HPLC-FLD are in better accordance than those estimated by NMR (Fig. 4). However, the absolute quantification of urinary ManOS by LC-MS/MS is problematic due to a lack of external and internal standards and, in the case of HPLC-FLD, the need for labeling and SPE, which can cause the loss of analytes [13]. Nevertheless, monitoring of ERT efficacy based on the determination of ManOS levels is a unique approach providing complementary information, as usually only the clinical parameters and unspecific improvement of a patient’s subjective condition are monitored. Furthermore, the precise determination of ManOS levels might become an essential addition to the management of AM patients, because it is speculated that high levels of circulating oligosaccharides (in addition to intracellular accumulation) may contribute to the immunodeficiency common in AM patients, since they bind to interleukin-2 (IL-2) receptors, disturbing IL-2-dependent responses [33, 34].
The main advantage of the HPLC-based approach is its relatively adequate accessibility in laboratories in healthcare facilities. MS instruments are also much more commonly found in clinical centers and hospitals compared with NMR spectrometers [23]. However, more sample preparation steps are required, and even if the method can be almost fully automated, the HPLC- based approach is more expensive, reagents- and time-consuming than NMR. On the other hand, hospitals usually do not have access to highly sophisticated NMR instruments, which require advanced maintenance and operation. Thus the collaboration between the scientific community and clinicians is an essential tool to understand the molecular basis of diseases and the biochemical mechanisms of their respective therapies.
Relative intensities of ManOS signals in the MALDI-TOF spectra are in accordance
with published data [15]. Man2GlcNAc trisaccharide was identified as the most
abundant structure in all AM samples in accordance with literature data [19].
Previous studies have linked the ManOS levels to AM severity [12] and treatment
response either by HSCT [35] or ERT [13]. During Phase I-II of clinical testing
of rhLAMAN, Borgwardt et al. [31] observed an overall 54.1% decrease in
urinary ManOS in 10 patients over 12 months. Santoro et al. [13]
reported a 67% decrease in urinary ManOS in a 7-month-old infant after two
months of ERT. In our work, we observed an 88.6% decrease in total urinary ManOS
after four months of ERT. This difference in ERT efficacy can be related to age,
phenotypic variation, residual activity of
A more rapid decrease of urinary ManOS of higher molecular weights in comparison with smaller ManOS was observed. This can be attributed to the conversion of higher to smaller ManOS due to therapeutically increased enzyme activity. These truncated structures then might contribute to the pool of structures of lower molecular weights. Therefore, after just one month, the decrease of levels of Man3GlcNAc - Man5GlcNAc is less significant, even though the overall ManOS decrease is approximately 50%. The full effect of ERT is the most remarkable after a longer period. Early biochemical effects of velmanase alfa in a 7-month-old infant with alpha-mannosidosis were determined recently in the study mentioned above [13], where the OS containing 2, 3, and 4 mannose residues decreased while the other ManOS with higher molecular weight were already undetectable by TLC after 8 weeks of treatment. However, the overall efficacy of ERT might vary from person to person. Immune response and the antibodies against the foreign infused enzyme are important issues of the ERT and play a pivotal role in the patients’ safety as well as the efficacy and success of the treatment. Furthermore, the biodistribution of the enzyme into the difficult sites of pathology (especially into the central nervous system, bones, etc.) still remains a striking challenge [36]. Nevertheless, the treatment should be initiated as early as possible to prevent further development and consequences of the disease as the full impact of this therapy will be fully understood when it is used on a cohort of patients identified soon after birth [37].
The application of both HPLC-FLD and NMR methodologies for quantification of mannose-rich oligosaccharide biomarkers is a suitable approach for monitoring of the enzyme replacement therapy efficacy in alpha-mannosidosis patients. Despite the fact that the data obtained from these different approaches differ in their absolute values, the change of biomarker level during the therapy administration was consistent for both methods. The main limitation of this study is the sample size, which is a typical phenomenon of rare diseases. Future perspectives to generally evaluate the therapy efficacy based on the monitoring of specific glycobiomarkers include adding other patients undergoing ERT into the study since the therapy effectiveness can vary from person to person.
2-AB, 2-aminobenzamide; ACN, acetonitrile; AM, alpha-mannosidosis; crea,
creatinine; D
The datasets are available upon request.
MK, RK, MN, JK and ZP performed the HPLC-FLD and MALDI-TOF experiments and data interpretation. IU and MM performed NMR experiments and respective data interpretation. AŠ, AH and KJ collected the samples and clinical data and reviewed the manuscript. MK, MN, ZP, MM conceptualised and prepared the original draft. PB, JM and JK critically reviewed and edited the manuscript. JM, ZP and MN were responsible for funding acquisition. All authors contributed to editorial changes in the manuscript. All authors read and approved the final manuscript.
All samples were obtained following local ethical and consent guidelines. The experimental study protocol was reviewed and confirmed by the Ethics Committee of National Institute of Children Diseases.
The authors would like to thank Beáta Chválová for technical support and Margita Plšková for administrative work.
This work was supported by grants from Ministry of Health of Slovak Republic under the project registration number 2019/7-CHÚSAV-4; VEGA 2/0060/21; Operational Program Integrated Infrastructure for the project ITMS: 313021Y920, co-financed by the European Regional Development Fund. Coauthors of this work are members of MetabERN - Project ID No. 739543.
The authors declare no conflict of interest.
References
Publisher’s Note: IMR Press stays neutral with regard to jurisdictional claims in published maps and institutional affiliations.