


 , Gang Zhao 1, Mei Gao 1, Yunting Liu 2, Pan Lei 1, Ting Cao 1
1 Department of Gynaecology and Obstetrics, The Second Affiliated Hospital of Xi’an Jiaotong University, 710004 Xi’an, Shaanxi, China
2 Department of Gynaecology and Obstetrics, Shangluo Central Hospital, 726000 Shangluo, Shaanxi, China
Academic Editor: Gea Oliveri Conti
Abstract
Background: Ovarian cancer (OV) is a severe and common gynecological disease. Ferroptosis can regulate the progression and invasion of tumors. The immune system is a decisive factor in cancer. The present study aimed to use gene expression data to establish an immunity and ferroptosis-related risk score model as a prognostic biomarker to predict clinical outcomes and the immune microenvironment of OV. Methods: Common gene expression data were searched from the Gene Expression Omnibus and The Cancer Genome Atlas databases. Immunity-related genes and ferroptosis-related genes were searched and downloaded from the ImmPort and FerrDb databases, followed by the analysis of the overall survival of patients with OV and the identification of genes. Subsequently, the status of the infiltration of immune cells and the association between immune checkpoints and risk score were assessed. Results: A total of 10 prognostic genes (C5AR1, GZMB, IGF2R, ISG20, PPP3CA, STAT1, TRIM27, TSHR, RB1, and EGFR) were included in the immunity and ferroptosis-related risk score model. The high-risk group had a higher infiltration of immune cells. The risk score, an independent prognostic feature of OV was negatively associated with each immune checkpoint. The risk score may thus help to predict the response to immunotherapy. Conclusions: The immunity and ferroptosis-related risk score model is an independent prognostic factor for OV. The established risk score may help to predict the response of patients to immunotherapy.
Keywords
- immunity
- ferroptosis
- ovarian cancer
- signature genes
- prognosis
- tumor immune microenvironment
- immune checkpoint
- immunotherapy
Ovarian cancer (OV) is a severe and common gynecological disease, which often leads to mortality. It causes ~150,000 deaths each year, severely endangering women’s health and safety [1, 2]. OV-associated mortality ranks first in mortality from gynecological tumors [3]. Moreover, due to the early non-specific symptoms, 75% of women with OV are diagnosed at an advanced stage, and the majority of patients relapse following treatment [4]; in addition, the survival rates are not satisfactory [5]. Hence, it is necessary to identify reliable prognostic models for patients with OV [6, 7, 8]. However, the single-gene/factor prediction model is often less accurate. In comparison, the polygenic model generally yields better results in tumor prediction [9]. Thus, the subset of patients with a poor survival can be more accurately identified for more rigorous follow-up and post-treatment adjuvant therapy, which may aid in decision-making and individualized treatments.
Iron is a trace element required by the human body; thus, a lack or excess in iron can have multiple effects on biological processes [10]. Iron deficiency affects cancer cell proliferation [11]. However, it is worth noting that high iron concentrations cause cell death through membrane lipid peroxidation, which is known as ferroptosis [12]. Basuli et al. [13] reported that abnormal iron accumulation in high-grade serous OV tissue was significantly higher than that in normal OV tissue. In addition, iron transport-related genes have also been shown to be dysregulated in a genetic model of OV primary cells. The activation of ferroptosis is associated with progressive disease, and ferroptosis regulates the occurrence, progression and invasion of OV [14]. Ferroptosis may influence the progression of OV by mediating tumor metastasis and the immune landscape.
The immune system, a critical system in the human body, is a decisive factor in the occurrence and progression of cancer [15, 16]. There is evidence to indicate that OV is an immunogenic tumor [17, 18, 19]. Immunotherapy is effective in treating human malignancy [20]. It has been reported that the phenotypes and functions of immune cell subsets in the OV microenvironment are altered by immunotherapy [21].
There are complex mechanisms of action between immunity and ferroptosis. For example, T-cells induce ferroptosis in ovarian tumor-bearing mice [22]. Based on the association between immunity, ferroptosis and OV, in the present study, mRNA analysis data were used to establish an immunity and ferroptosis risk score model to predict the immune microenvironment of OV. In the future, this approach may aid clinicians in making important treatment-related decisions.
Common gene expression data were obtained from the Gene Expression Omnibus (GEO) and The Cancer Genome Atlas (TCGA) databases. In TCGA dataset, RNA sequencing data for gene expression were downloaded from UCSC Xena. For the three datasets of GSE26712, GSE32062 and GSE18521, RNA sequencing data were downloaded from the easyGEO dataset. Among these, TCGA dataset was used as the training set, and the GEO dataset was used as the validation set. The details of the datasets are presented in Table 1, including number of patients, overall survival (OS), tumor stage, and tumor grade.
| Accession number | Platform | Number of normal controls | Number of patients | OS (years) | Tumor stage | Tumor grade | ||||||||||
| 1/4 quartile | Median | 3/4 quartile | I | II | III | IV | Other | 1 | 2 | 3 | 4 | Other | ||||
| GSE26712 | GPL96 | 10 | 185 | 1.81 | 3.19 | 5.15 | 0 | 0 | 144 | 41 | 0 | 0 | 0 | 40 | 144 | 1 |
| GSE32062 | GPL6480 | 0 | 260 | 2.22 | 3.41 | 4.68 | 0 | 0 | 204 | 56 | 0 | 0 | 0 | 131 | 129 | 0 |
| GSE18521 | GPL570 | 10 | 53 | N/A | N/A | N/A | late | high | ||||||||
| TCGA | Illumina RNAseq | 0 | 378 | 1.44 | 2.81 | 4.55 | 1 | 23 | 294 | 57 | 3 | 1 | 45 | 321 | 1 | 10 |
| OS, overall survival. | ||||||||||||||||
Immunity-related genes (IRGs) were obtained from the immunology and ImmPort databases. A comprehensive gene list (involving 1793 IRGs) was downloaded. Ferroptosis-related genes (FRGs) were obtained from the FerrDb database and the related literature [23]. The FerrDb database is the first database that provides updated data of regulators and markers connected with ferroptosis and disease. Finally, 267 FRGs were obtained, including 259 FRGs from the FerrDb database, and 8 genes from the literature [23] as a complement.
According to the data of the TCGA training set and the GSE26712 validation set,
the IRGs and FRGs were screened using univariate Cox analysis.
The intersection of the genes in the two
datasets was considered as the prognosis-related genes (p
In this formula,
The signature genes in each sample were divided into the high- and low-expression groups according to the median expression in TCGA dataset. Kaplan-Meier analysis was applied to analyze the influence of signature genes on survival. The expression of signature genes in cancer and paracancerous tissues was searched from the Gene Expression Profiling Interactive Analysis (GEPIA) database and verified in the GSE26712 and GSE18521 datasets. At the same time, the Human Protein Atlas database was applied to detect the protein expression of signature genes in cancer tissues.
To further validate the expression of signature genes at the mRNA level, RT-PCR assays were performed using the tissue samples. Tumor tissues and paracancerous tissues were collected from 8 patients with OV. The clinical data of the patients are provided in detail in Table 2, mainly including age, tumor size, stage, grade, tumor metastasis, alcohol, smoking and family history. In addition, the increase of CA125, HE4 and CA199 suggests the possibility of malignancy.
| Number | Age (years) | Tumor size (cm) | CA125 (U/mL) | HE4 (pmol/L) | CA199 (U/mL) | Roma index (%) | Tumor stage | Tumor grade | Tumor metastasis | Alcohol history | Smoking history | Family history of OV |
| 1 | 58 | 1 | 811.6 | 96.10 | 7.94 | 82.66 | IIIB | G3 | Yes | No | No | No |
| 2 | 62 | 10 | 305 | 58.86 | 19.18 | 58.31 | IA | G1 | No | No | No | No |
| 3 | 70 | 8 | 631.3 | 736.7 | 7.94 | 97.06 | IIIC | G3 | Yes | No | No | No |
| 4 | 73 | 20 | 982.6 | 5.18 | 98.96 | IIIC | G3 | Yes | No | No | No | |
| 5 | 56 | 10 | 148 | 51.65 | 10.8 | 15.29 | IA | G1 | No | No | No | No |
| 6 | 47 | 12 | 437.9 | 219.9 | 4.65 | 77.14 | IIIC | G2-G3 | Yes | No | No | No |
| 7 | 61 | 15 | 766.2 | 184.9 | 60.63 | IIIB | G1 | Yes | No | No | No | |
| 8 | 52 | 15 | 60.34 | 128.1 | 24.61 | 48.95 | IIIA | G2-G3 | Yes | No | No | No |
| CA125, carbohydrate antigen 125; HE4, human epididymis protein 4; CA199, Carbohydrate antigen199; Roma index, Risk of Ovarian Malignancy Algorithm index; OV, ovarian cancer. | ||||||||||||
The inclusion criteria for the patients with OV were as follows: (1) Patients were diagnosed with OV for the first time; (2) patients had not undergone other treatments prior to diagnosis; (3) patients had no other malignancy; (4) patients had no other autoimmune disease; (5) the age of the patients was 18 to 70 years. The exclusion criteria were as follows: (1) Patients had other malignancies; (2) patients received other treatments prior to surgery; (3) patients had incomplete clinical data; (4) patients had a history of cancer. The Ethics Committee of The Second Affiliated Hospital of Xi’an Jiaotong University approved this study (2021241). Patient informed consent was obtained.
RNA was extracted from the tissue samples. The SYBR-GreenⅠReal Time PCR method
was used to detect the changes in gene expression. Relative gene expression
values were determined using the 2
Based on the DGIdb database (https://dgidb.org/), those drugs related to signature gene were screened out, which may provide new perspectives for OV diagnosis, treatment and research.
For the purpose of further investigating the association between clinical features of OV and risk score, univariate and multivariate Cox analysis were first applied to determine the independent prognostic factors of the risk score different from other clinical factors. After testing for collinearity, the independence of risk was also verified. All independent prognostic parameters and associated clinical parameters were applied to construct prognostic nomograms through stepwise Cox regression models to predict the overall survival (OS) of patients with OV. A nomogram was used to forecast the OS. In addition, differences in risk score in the various clinical subgroups were compared.
The relative abundance of each cell infiltration in the TIME of OV was quantified using single-sample Gene Set Enrichment Analysis (ssGSEA). In the study by Charoentong, gene sets that marked each immune cell type infiltrating the TIME, which is enriched in multiple human immune cell subtypes, were obtained [24, 25]. The stromal score, tumor purity and ESTIMATE score of each patient with OV were calculated using ESTIMATE from R package (version 3.5.3). The Wilcoxon test was applied to compare the differences in immune cell infiltration, stromal score, tumor purity and the ESTIMATE score.
Differences in biological processes were investigated using GSVA between the
high- and low-risk groups. “C2.cp.kegg.v7.2.Symbols” was downloaded from the
Molecular Signature Database. The R package “limma” was applied to calculate
significantly enriched pathways. A false discovery rate (FDR)
The R package “limma” was applied to identify differentially expressed genes
(DEGs) between the high- and low-risk groups under the screening thresholds of
FDR
First, the “maftools” package in R was utilized to calculate the TMB score. Tumor samples were divided into the high- and low-TMB groups based on the median of TMB. The survival curve between risk and TMB was analyzed using the Kaplan-Meier method. In addition, a correlation analysis between the risk score and TMB was performed.
For the purpose of exploring the predictive power of tumor risk score in patients treated with immunotherapy, the expression of multiple immune checkpoints was assessed in the high- and low-risk groups and their correlation with the risk score was determined. Based on immunotherapy cohorts, the responses of patients were analyzed in the high- and low-risk groups. The difference in the risk score in the response and non-response groups was analyzed.
Based on the clinical data of OV cases in TCGA and the GEO datasets, univariate
Cox proportional hazards regression analysis was used to screen genes associated
with immunity and ferroptosis for survival (p
To investigate the impact of immunity and ferroptosis genes on the prognosis of
patients with OV, univariate Cox regression analysis was applied in TCGA and the
GSE26712 datasets with a screening criterion of p
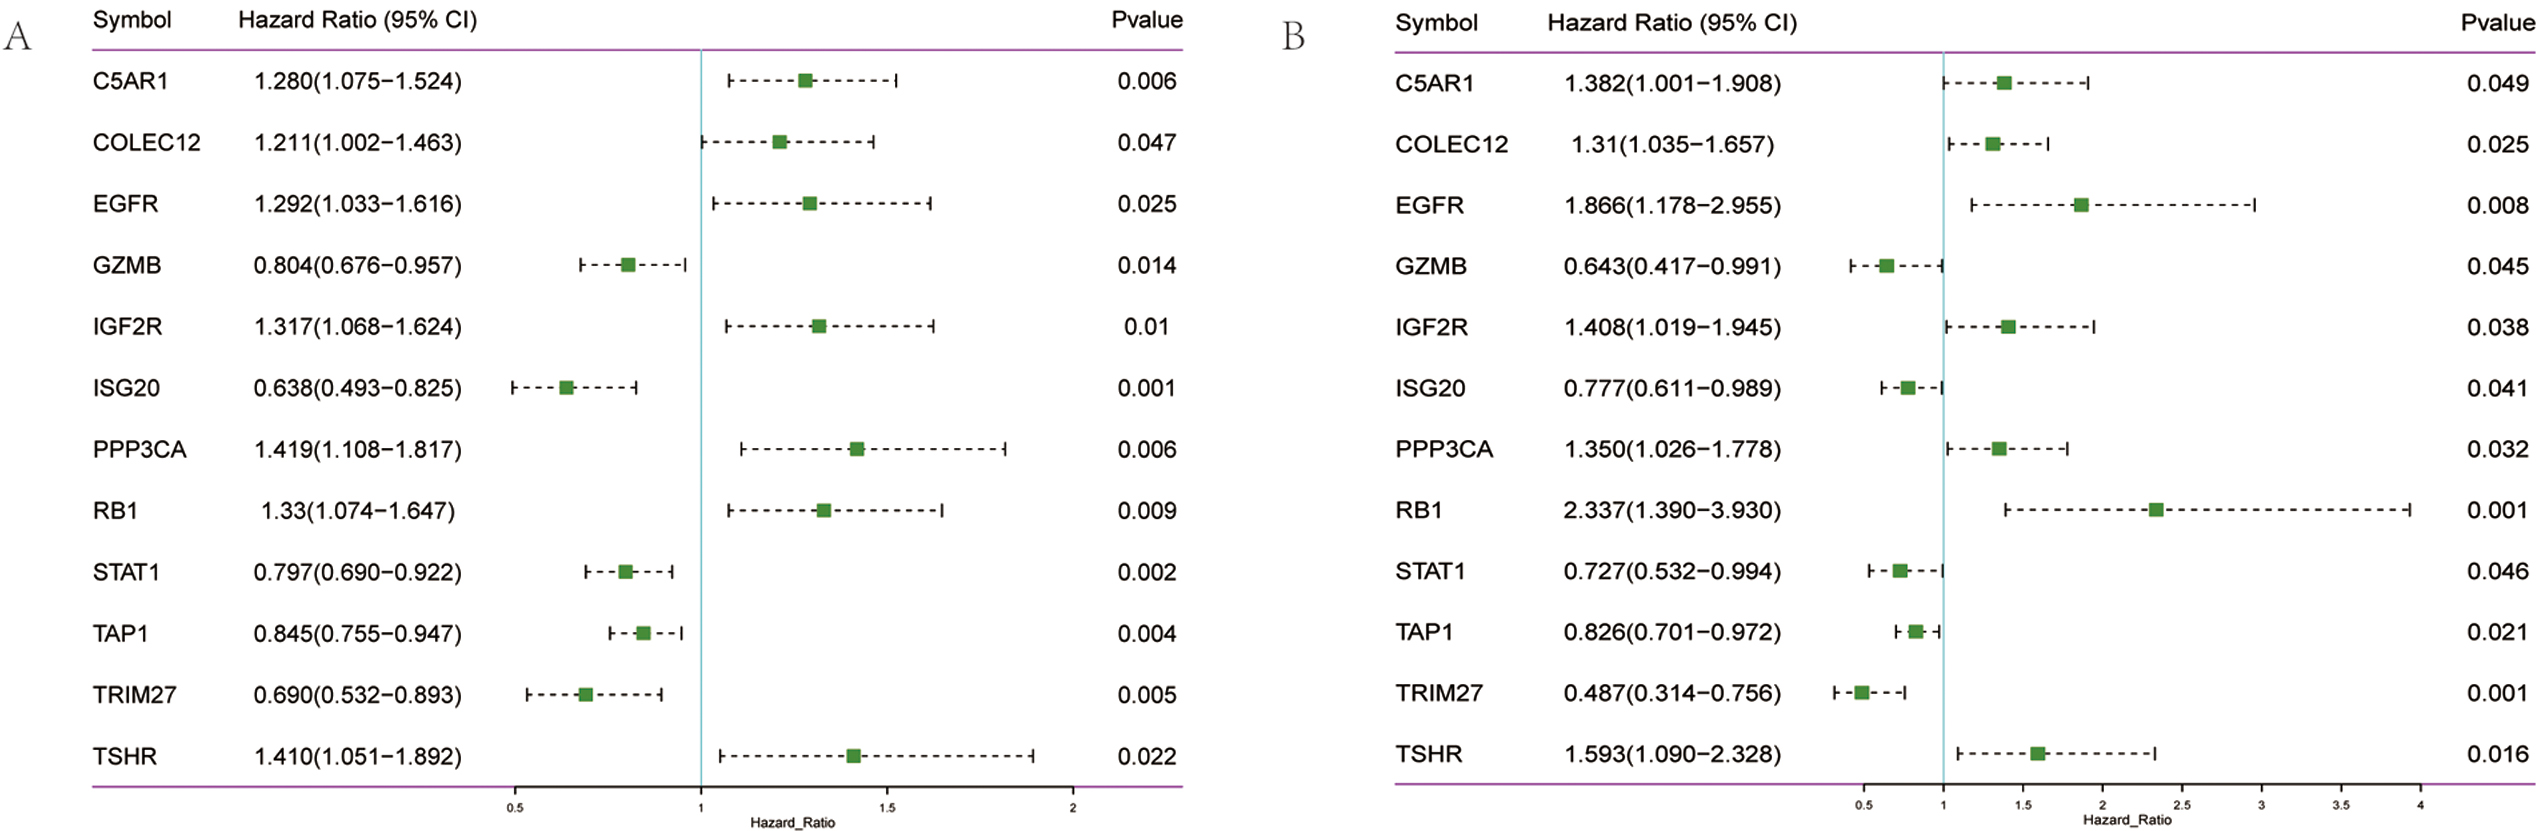 Fig. 1.
Screening of prognostic genes in OV. (A) Forest diagram of 12 prognosis-related genes in TCGA training set. (B) Forest diagram of 12 prognosis-related genes in the GEO validation set.
Given the possible interaction between immunity and ferroptosis, 12 prognostic
genes were used for the construction of the prediction model of OV. The
optimal
Risk score = (C5AR1
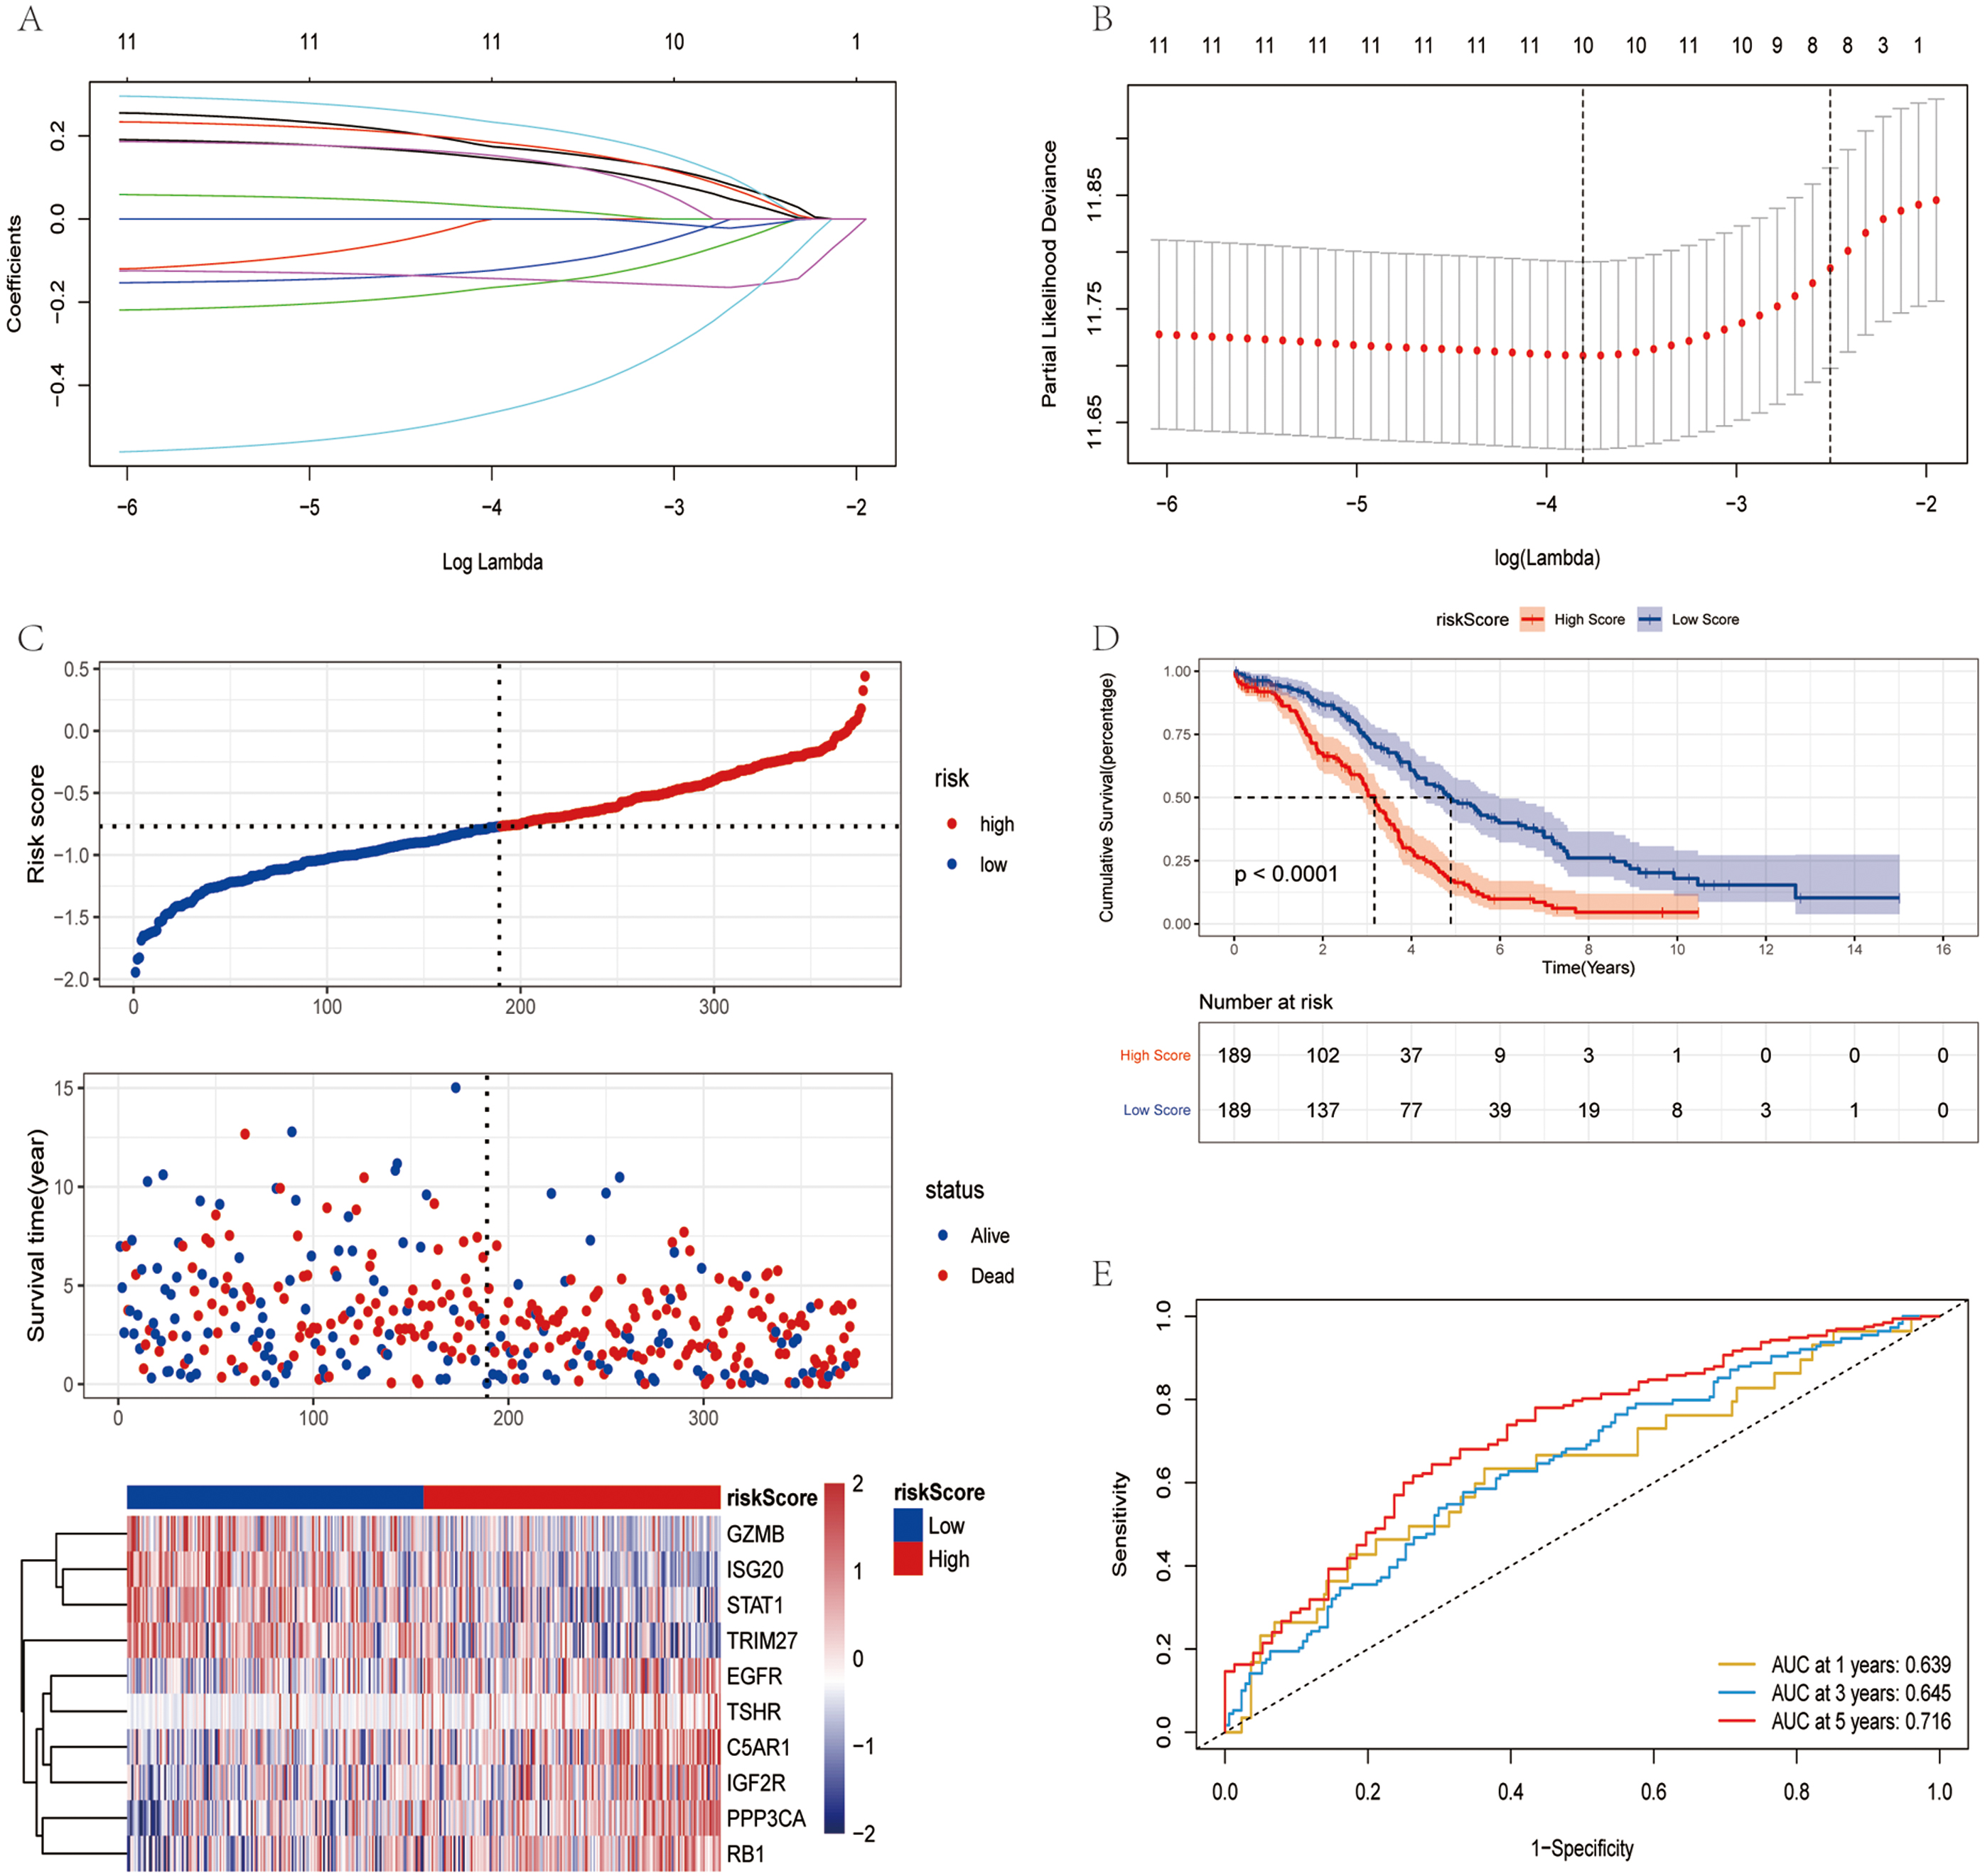 Fig. 2.
Construction of risk model in TCGA training set. (A) Change
trajectory of each independent variable. The horizontal axis and vertical axis
represents the log value of the independent variable lambda and
the coefficient of the independent variable, respectively. (B) LASSO Cox
regression with 10-time cross-validation for optimal parameter (
The influence of the risk score obtained from the construction of 10 immunity and ferroptosis-related genes on OS was further investigated. The risk score was calculated using a formula (detailed results are presented in Supplementary Table 1), the samples were divided into the high- and low-risk groups based on the median risk score. The low-risk group had a higher survival proportion, as shown in Fig. 2C. The OS was significantly lower in patients in the high-risk group (Fig. 2D). The AUC values at 1, 3 and 5 years were 0.639, 0.645 and 0.716, respectively (Fig. 2E). In TCGA training set, the risk score had good predictive power for the OS of patients.
To further evaluate the robustness of the risk score in predicting the OS of patients with OV, two datasets (GSE26712 and GSE32062) were applied to test the prediction capacity of the risk score for OS. First, the risk scores of the tumor samples in the two datasets were calculated separately using the same formula. The samples were divided into the high and low-risk group based on the median risk score (Supplementary Fig. 1A,D). The low-risk group had a higher OS rate. The OS of the patients in the high-risk group was significantly lower (Supplementary Fig. 1B,E). In the GSE26712 dataset, the AUC values were 0.713, 0.73 and 0.731 at 1, 3 and 5 years, respectively (Supplementary Fig. 1C). In the GSE32062 dataset, the AUC values were 0.643, 0.620 and 0.629 at 1, 3 and 5 years, respectively (Supplementary Fig. 1F). In the validation set, it was further demonstrated that the risk score model had a better predictive ability for patients with OV.
The results of survival analysis with the risk score revealed that the OS of the
high-risk group was significantly lower than that of the low-risk group. Based on
the expression values of signature genes in each sample of the TCGA training set,
the samples were divided into the high- and low-expression groups according to
the median expression. The influence of signature genes on survival was analyzed
using the Kaplan-Meier method. The C5AR1, EGFR, RB1
and TSHR genes had no significant effect on survival (p
Since there were no data available for the control group in TCGA dataset, the expression of signature genes in cancer and paracancerous tissues was searched from the Gene Expression Profiling Interactive Analysis (GEPIA) database. STAT1 and GZMB were highly expressed in patients with OV, while EGFR was expressed at low levels in patients with OV. No significant differences were found for the remaining genes examined (Fig. 3). Subsequently, the expression of 10 signature genes was verified in the GSE26712 and GSE18521 datasets. GZMB, ISG20 and TSHR were significantly upregulated in patients with OV, while EGFR, PPP3CA and RB1 in GSE26712 were significantly downregulated in patients with OV. In the GSE18521 dataset, C5AR1 was significantly expressed at low levels in patients with OV, while GZMB, ISG20, STAT1, and TSHR were significantly highly expressed in patients with OV (Supplementary Fig. 3). Of note, GZMB was significantly highly expressed in patients with OV in all data analyzed.
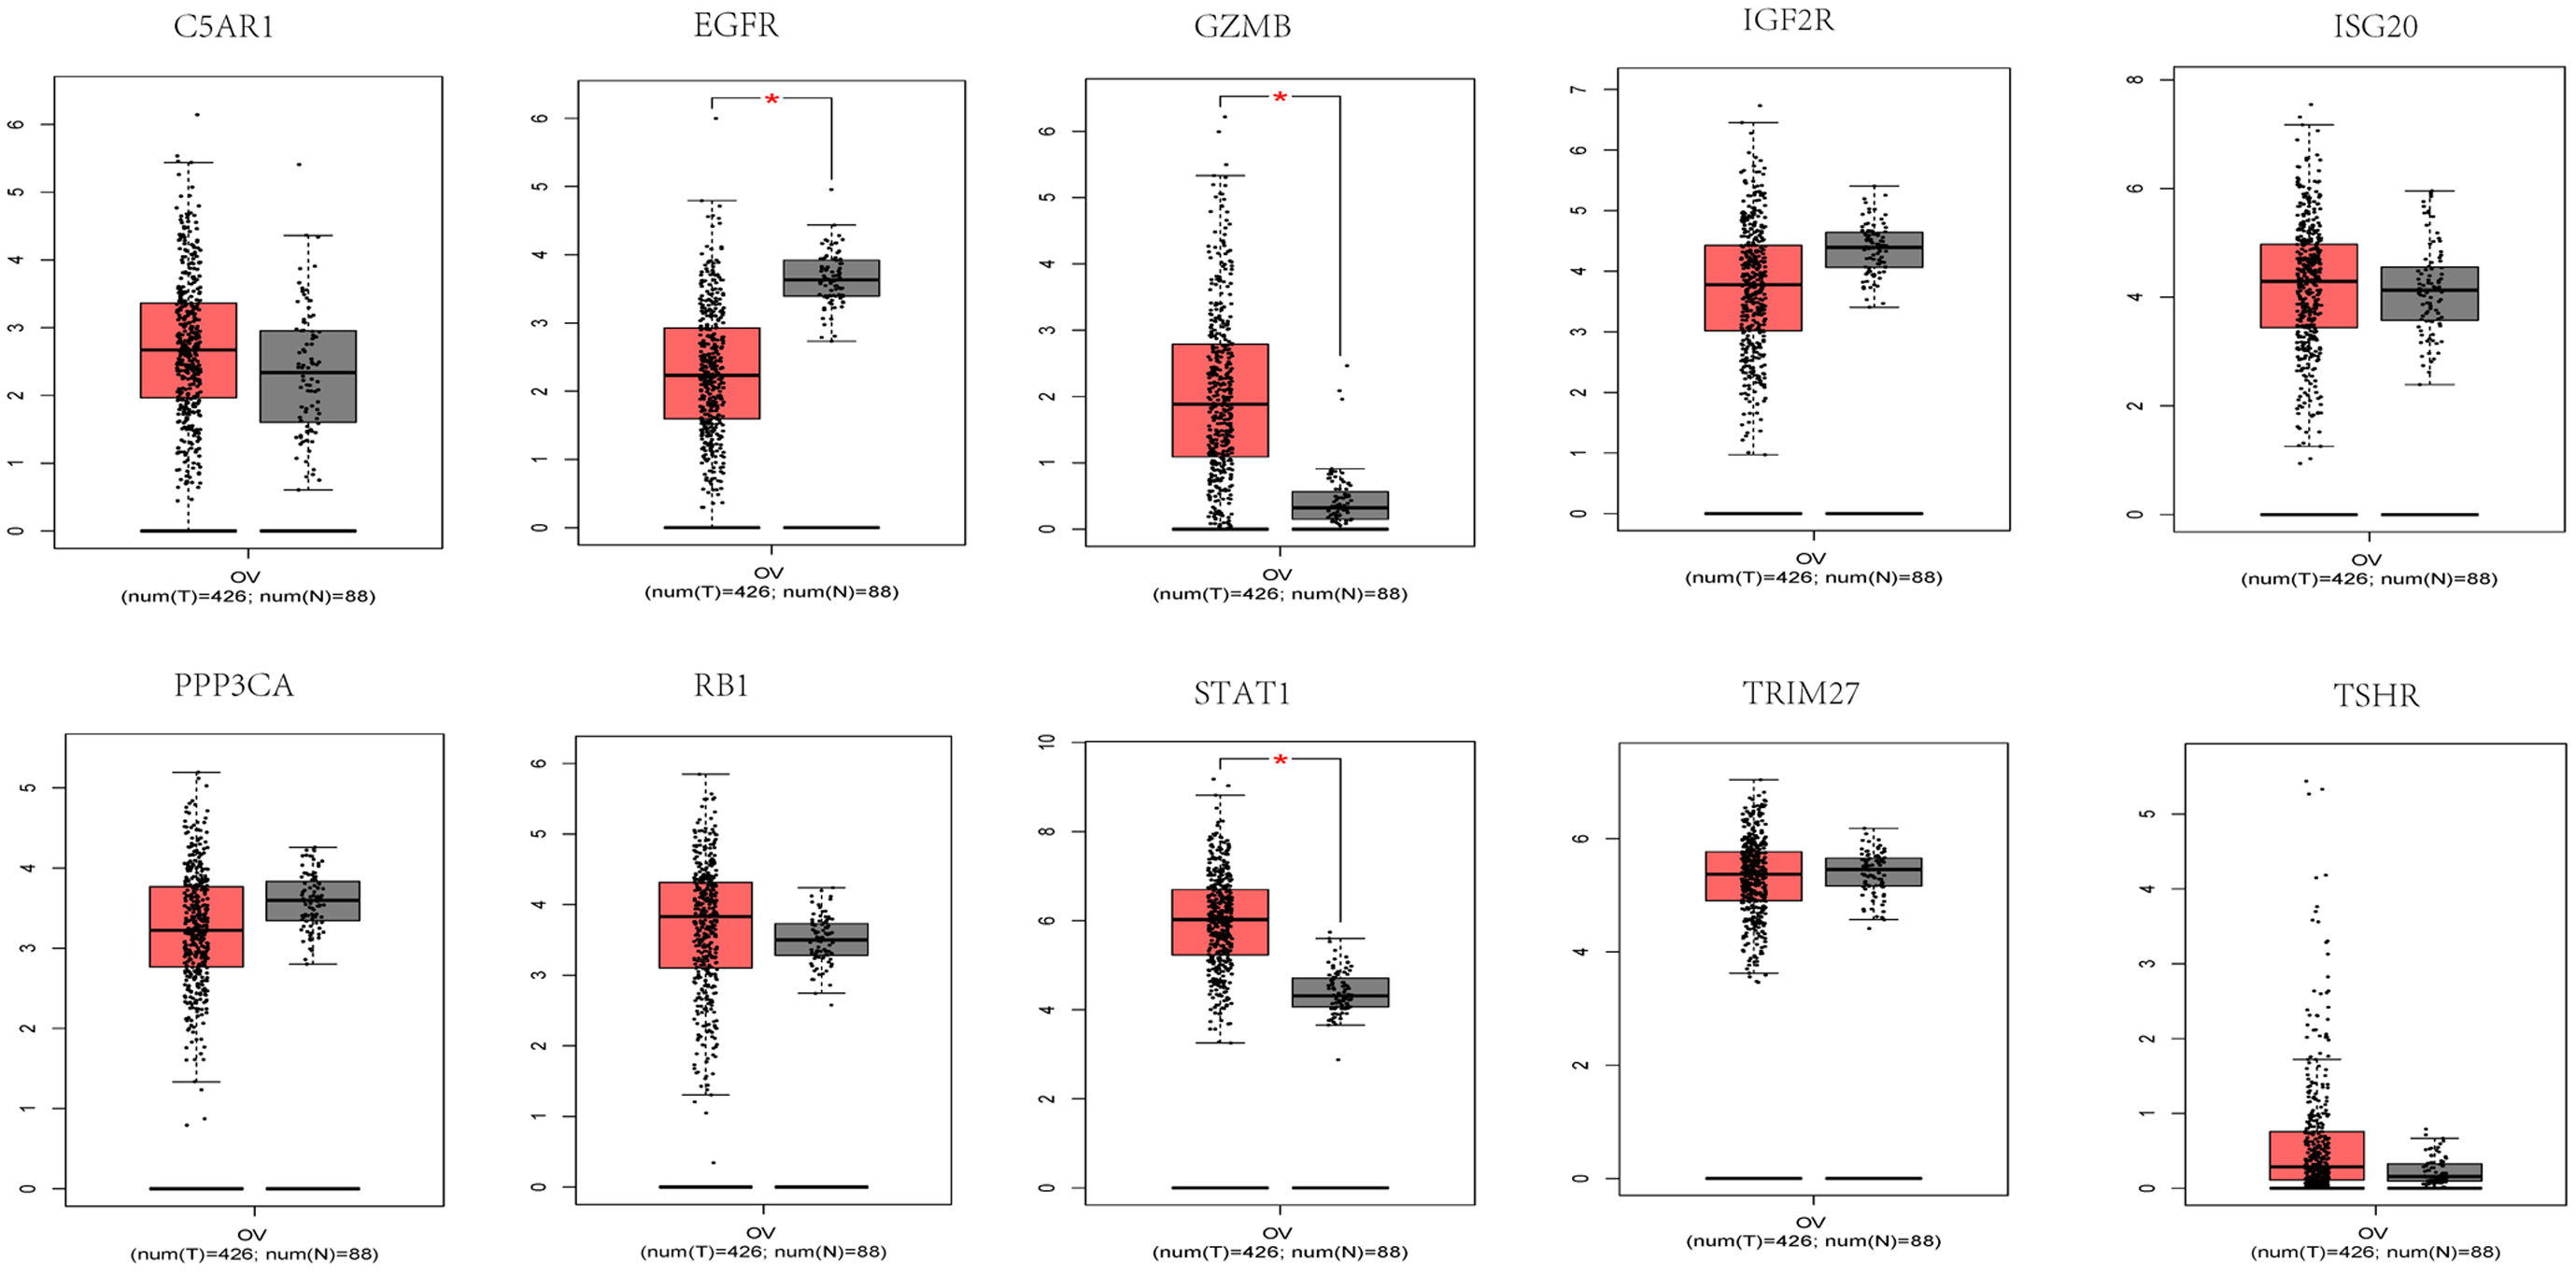 Fig. 3.
Signature genes expression of C5AR1, GZMB,
IGF2R, ISG20, PPP3CA, STAT1, TRIM27,
TSHR, RB1, and EGFR in the GEPIA database. Red and
gray represent the patients with tumor group and normal control group
(T: tumor; N: normal control), respectively.
At the same time, the Human Protein Atlas database was applied to analyze the protein expression levels of STAT1, GZMB and EGFR (Supplementary Fig. 4A). Based on the analysis using the UALCAN database, no significant expression difference was observed for STAT1; however, EGFR and PPP3CA proteins were expressed at low levels in patients with OV (Supplementary Fig. 4B–D).
In addition, RT-PCR detection indicated that GZMB, STAT1 and ISG20 were markedly upregulated in patients with OV (Supplementary Fig. 4E). The OS analysis with individual signature genes revealed that a high expression of the GZMB, STAT1, ISG20 and TRIM27 genes, and a low expression of the IGF2R and PPP3CA genes corresponded to a longer OS rate. However, the analysis of signature genes in cancer and paracancerous tissues revealed that the GZMB, STAT1 and ISG20 genes still had higher expression levels, and that the EGFR and PPP3CAgenes had lower expression levels in cancer tissues.
Based on the DGIdb database, drugs related to anti-tumor and immunotherapy for 10 signature genes were screened out (Supplementary Fig. 5), including 32 drugs and 4 genes (EGFR, PPP3CA, RB1 and STAT1). Among these, cisplatin is widely used in the treatment of various solid tumors [26]. Sunitinib is a novel, multi-targeted oral treatment for cancer. Etoposide, docetaxel and decitabine are cell cycle-specific antitumor agents. Topotecan is indicated for metastatic advanced OV that has failed chemotherapy. Paclitaxel, vorinostat and other drugs are associated with OV treatment [27, 28].
Univariate and multivariate Cox analyses determined the association of the risk score with clinical signatures. Age and risk could be used as independent prognosis factors (Fig. 4A). The independence of risk was verified in the validation set (Fig. 4B). A nomogram was constructed to predict OS probabilities by combining risk and age with significance for independent prognostic indicators in a multivariate Cox analysis (Fig. 4C,D). Each factor was allocated proportionally to its risk contribution to survival. The calibration curve indicated that the combined model (nomogram) revealed a high accuracy in OS at 1 year. In addition, differences in risk scores across clinical subgroups were compared. The risk scores significantly differed by age, status and stage (Fig. 4E).
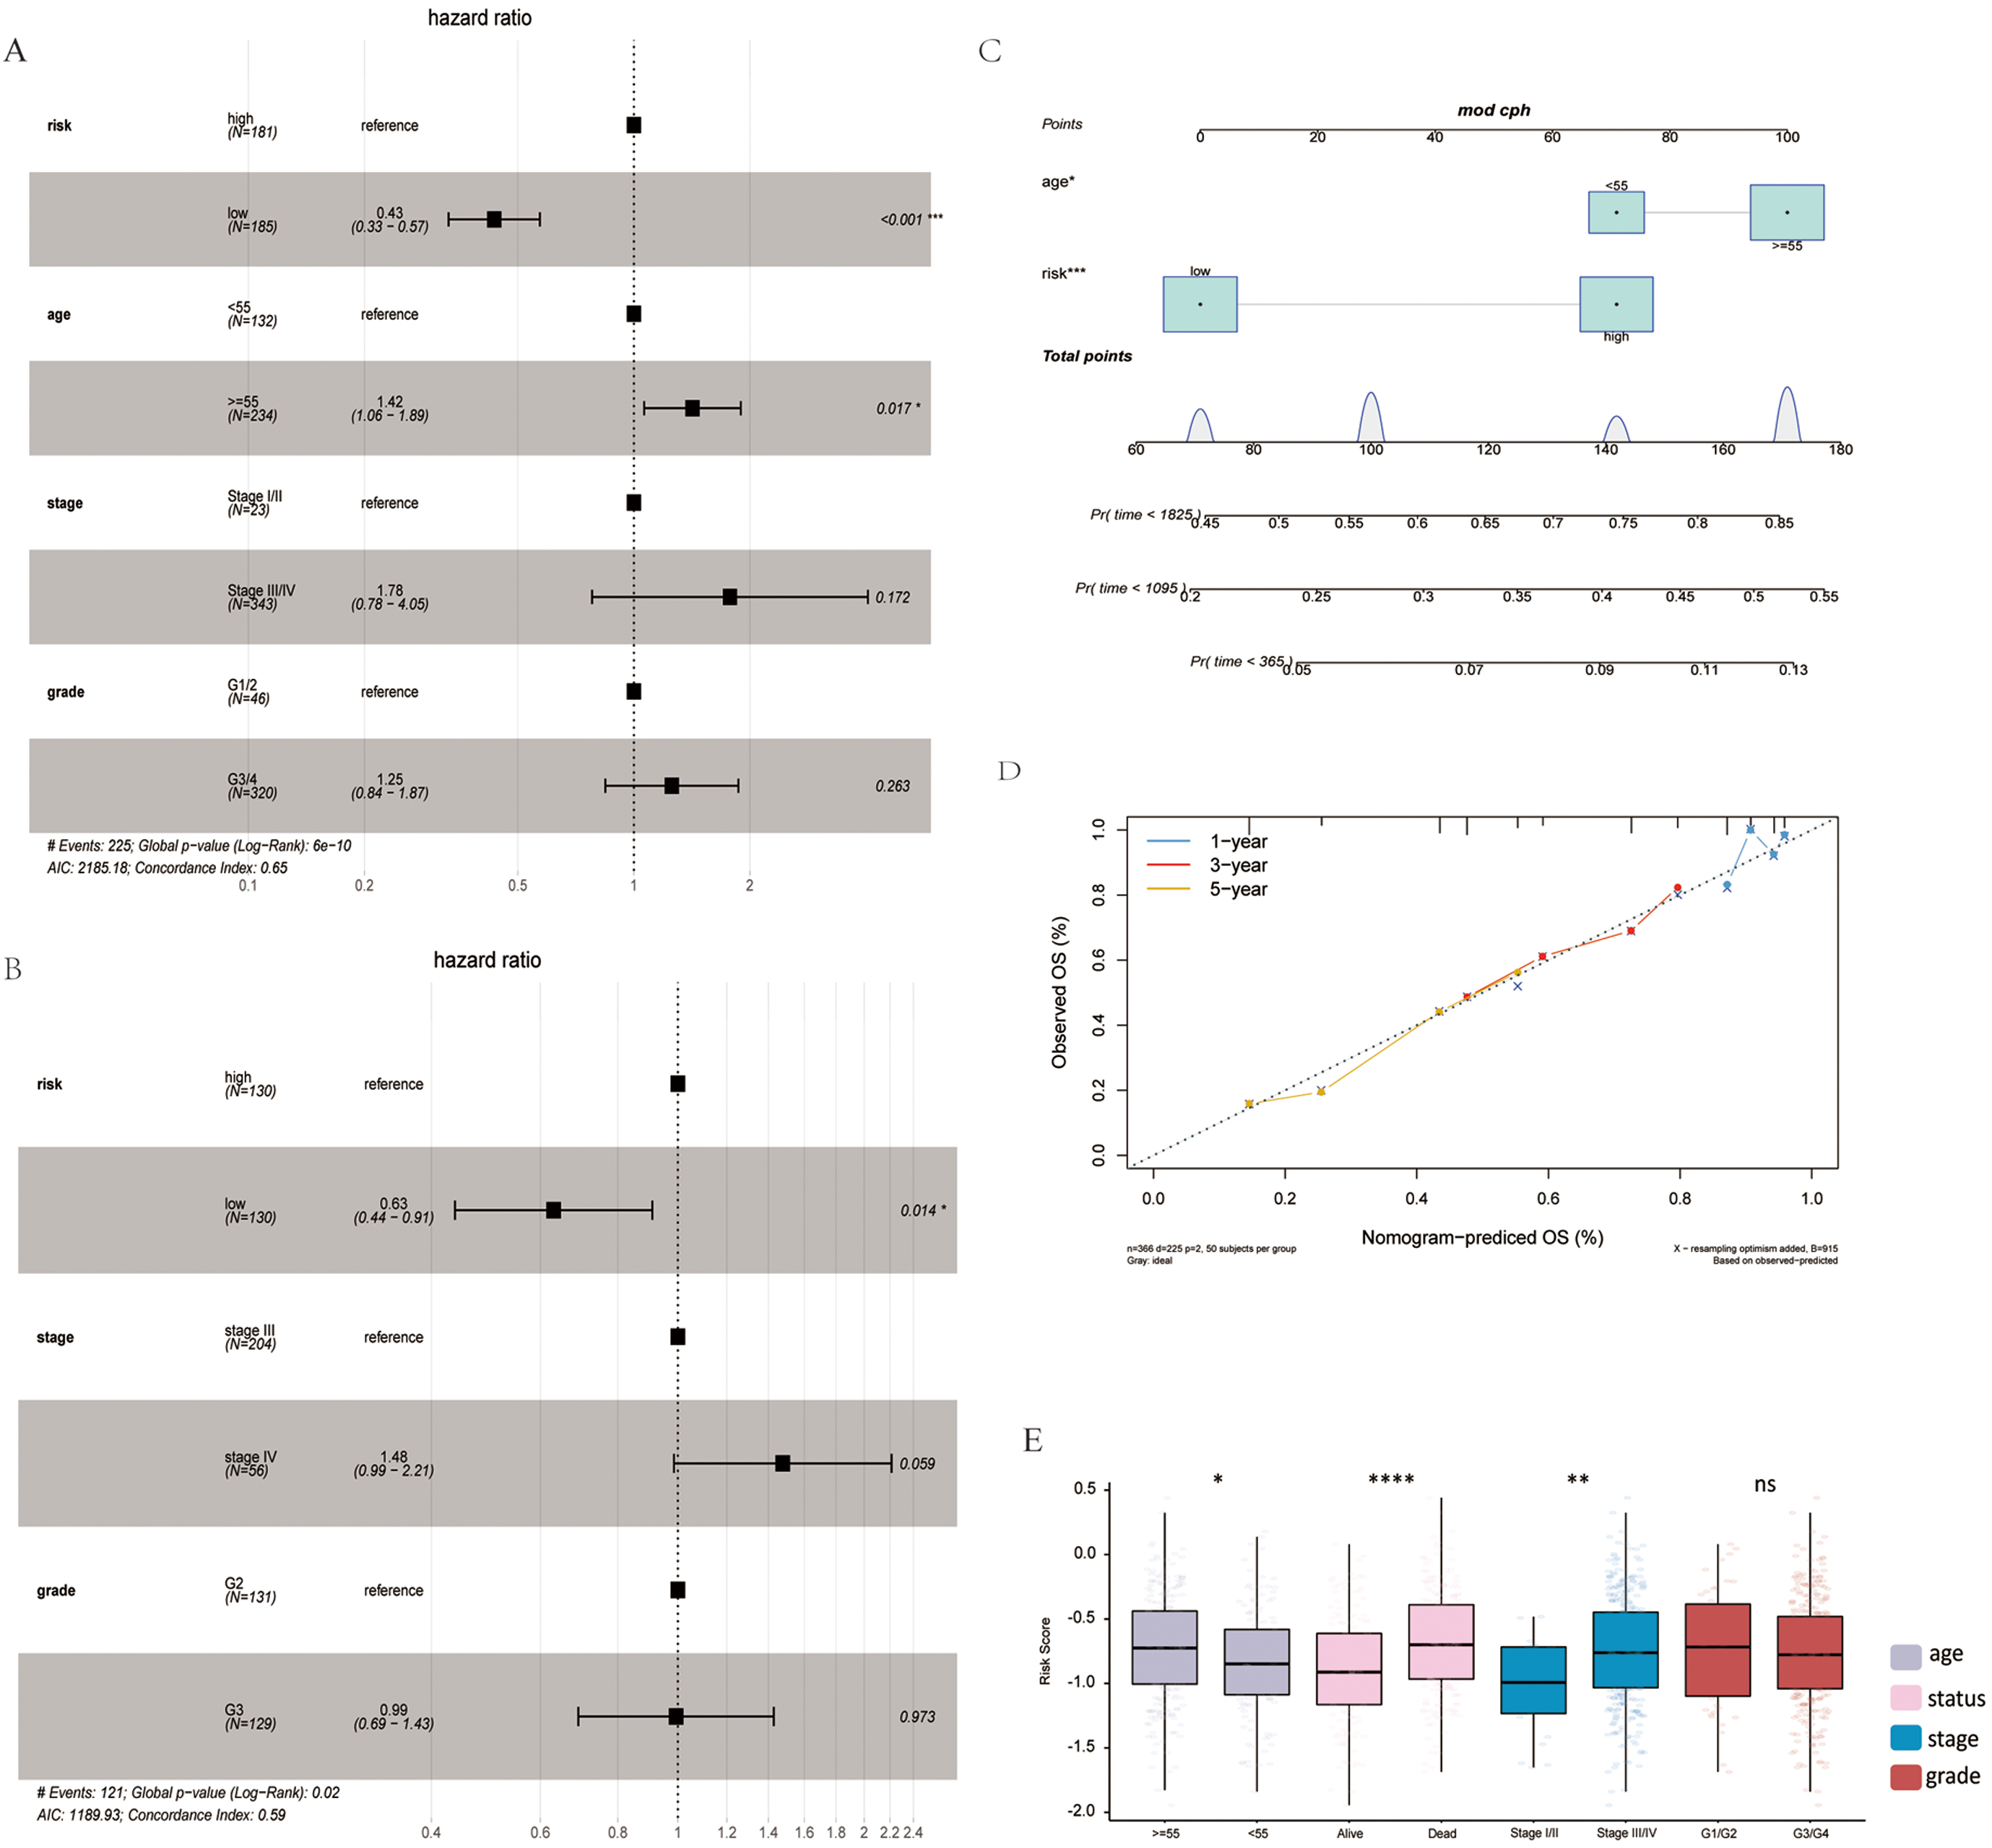 Fig. 4.
Association of risk score with clinical features. (A)
Multivariate Cox analysis in TCGA training set. (B) Multivariate Cox analysis in
the GSE32062 validation set. (C) Nomogram of clinical features and risk score.
(D) Calibration plot of 1-, 3-, and 5-years. (E) Risk score differences in age,
status, stage and grade subgroups.
The infiltration status of 23 immune cells in TCGA dataset was evaluated using ssGSEA. The majority of the immune cells in the high-risk group had more infiltration (Fig. 5A). However, there was no corresponding survival advantage for patients in the high-risk group, and the OS of patients in the high-risk group was significantly lower (Fig. 2D). Epithelial-mesenchymal transition (EMT) 1, EMT2 and EMT3 was significantly higher in the high-risk group subtypes (Fig. 5B). Moreover, the ESTIMATE score, stromal score and tumor purity for each patient with OV was calculated using ESTIMATE. The ESTIMATE score and stromal score were significantly higher in the high-risk group, although tumor purity was low (Fig. 5C–E).
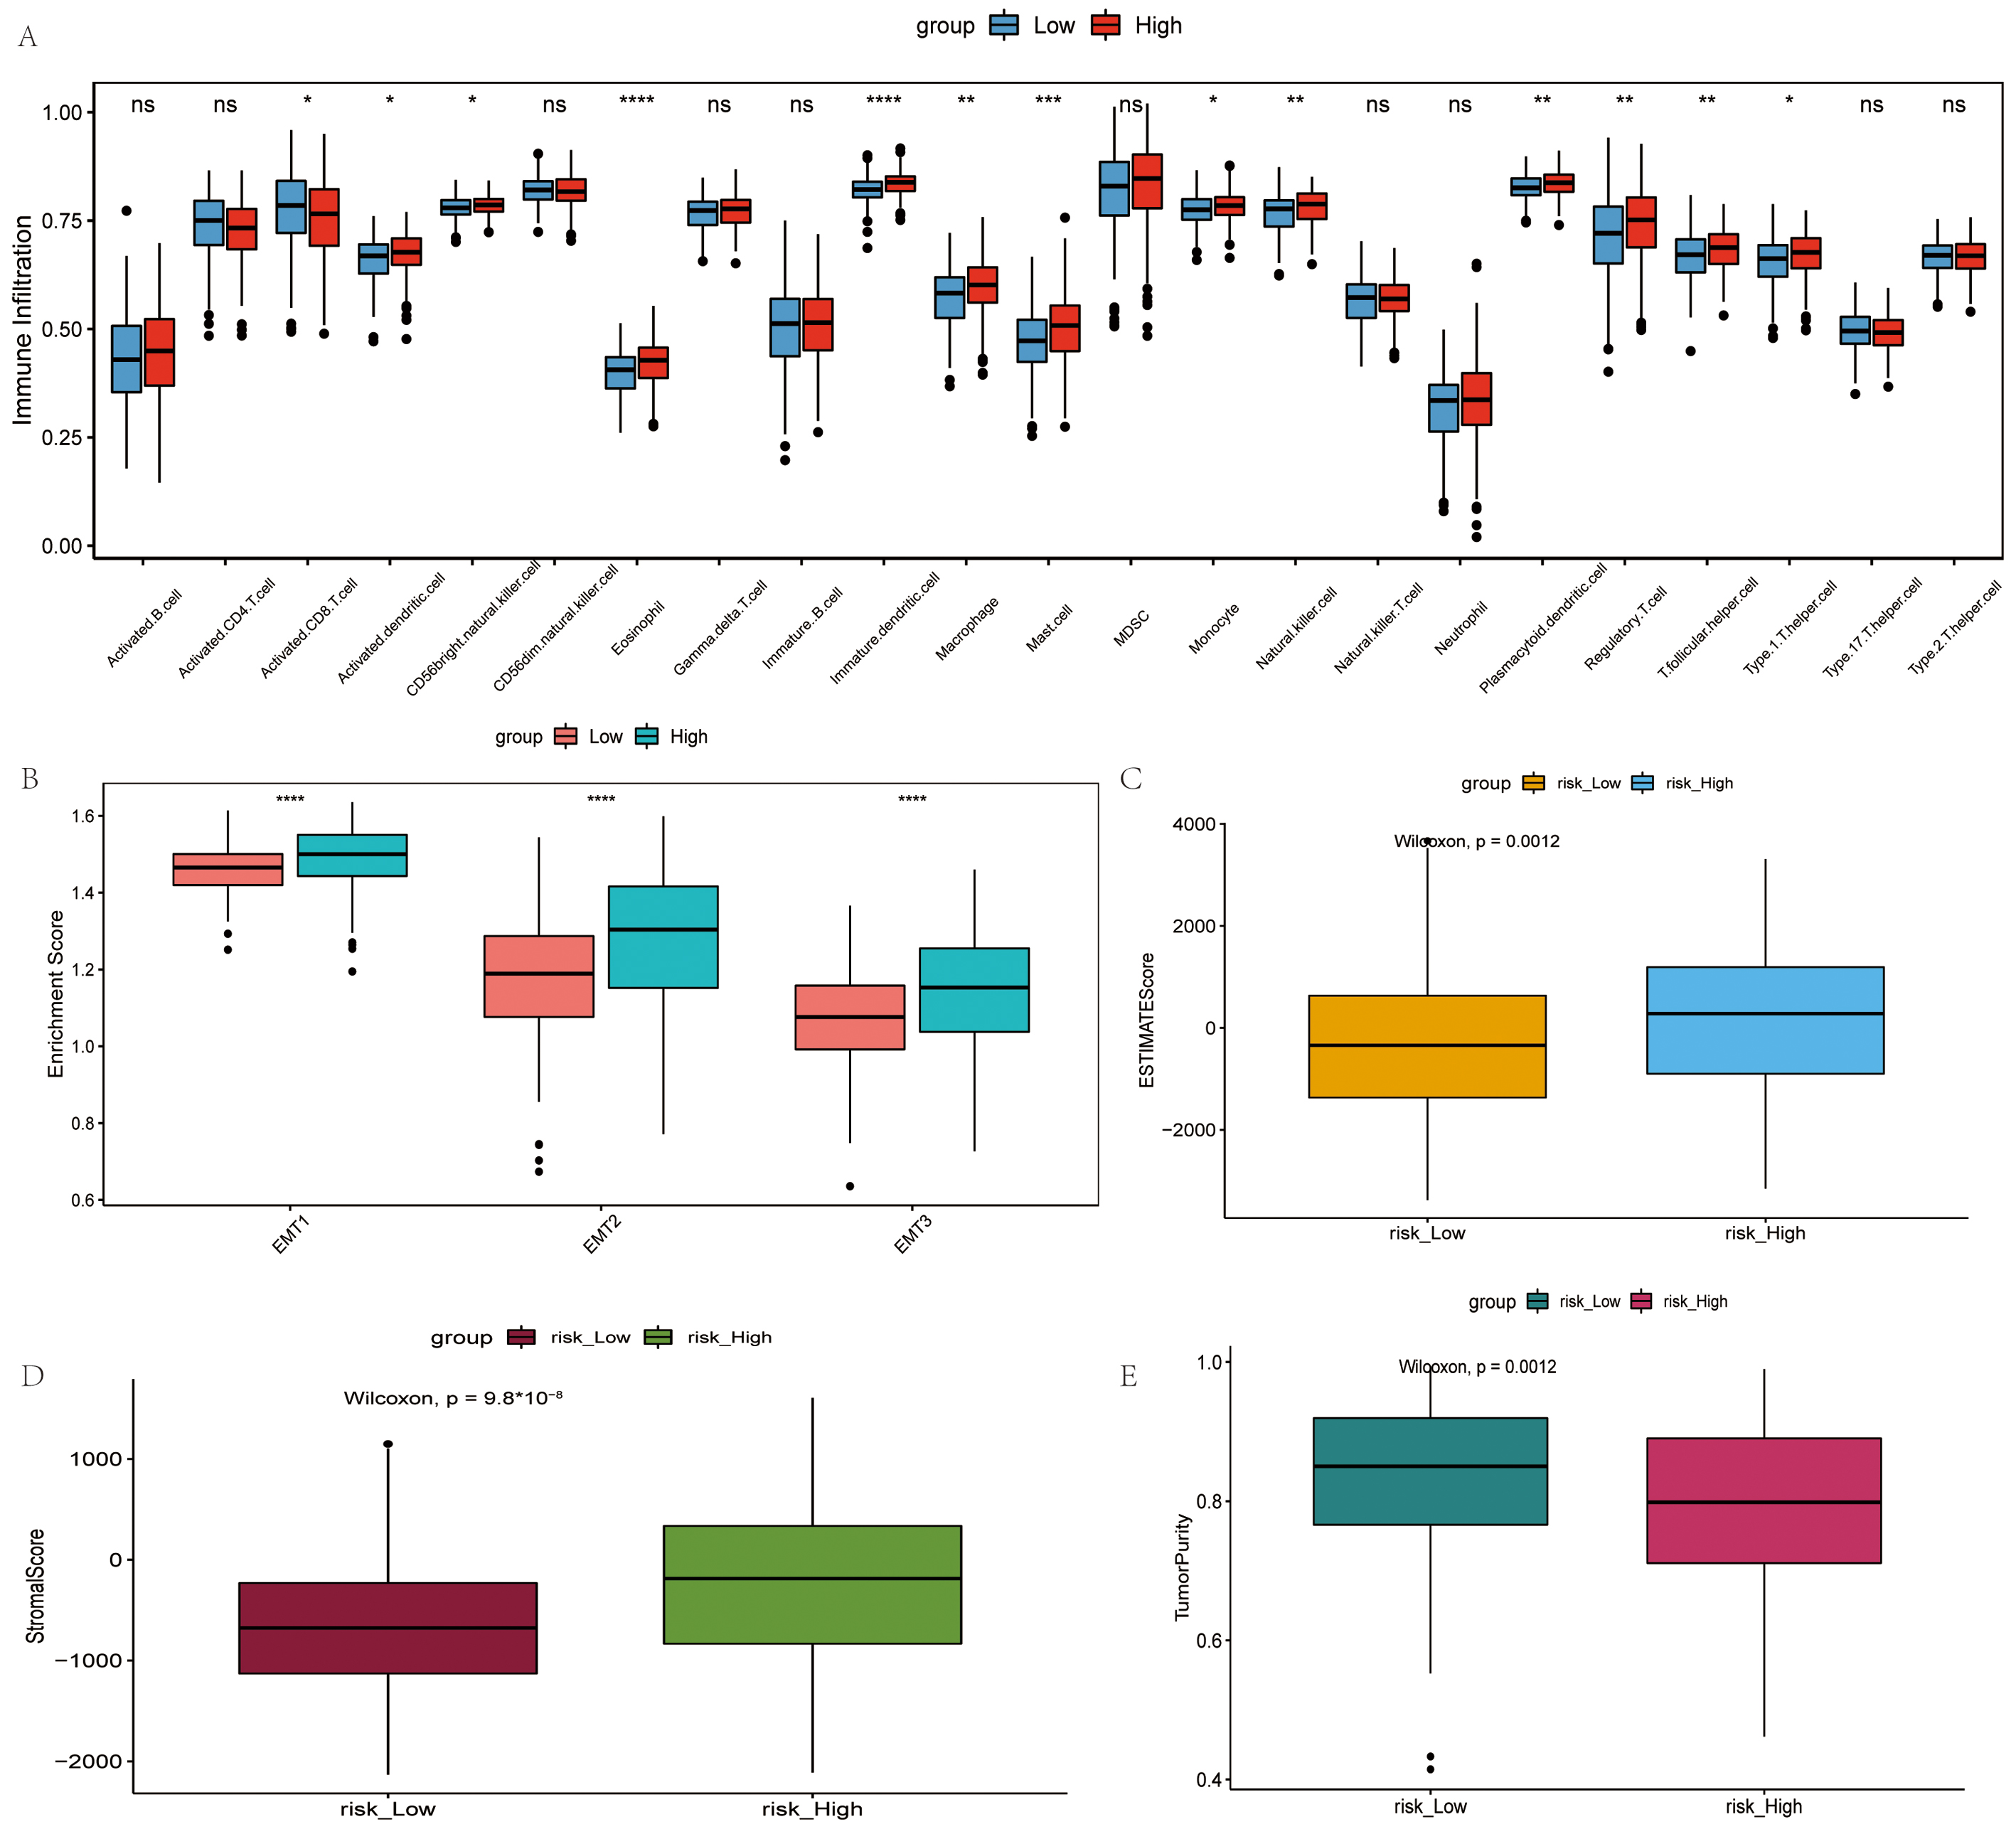 Fig. 5.
Comparison of the immune microenvironment in the high- and
low-risk groups. (A) Difference in the infiltration degree of 23 types of immune
cells. Red and blue represent high-risk and low-risk groups, respectively. (B)
Difference in infiltration degree of EMT, green and pink represent high-risk and
low-risk groups, respectively. (C) Difference in ESTIMATE score, orange and blue
represent high-risk and low-risk groups, respectively. (D) Difference in stromal
score, brown and blue represent high-risk and low-risk groups, respectively. (E)
Difference in tumor purity, purple and green represent high-risk and low-risk
groups, respectively.
Furthermore, the ferroptosis status was also predicted based on suppressor genes (SOFs) and activators (DOFs) of ferroptosis in the literature [29]. Among the 16 repressors of ferroptosis, CD44 and HMOX1 were significantly highly expressed in the high-risk group, while HELLS, HSF1, HSPA5, NQO1, OTUB1 and SLC7A11 were significantly expressed at low levels. In the 22 ferroptosis activators, ANO6, EGFR and ZEB1 were significantly highly expressed in the high-risk group, and CHAC1, ELAVL1, PEBP1 and SAT1 was significantly expressed at low levels. Taken together, the findings indicated that ferroptosis may be more pronounced in the high-risk group (Supplementary Fig. 6).
Significantly enriched pathways were calculated using the R package “limma”
and screened on the condition of FDR
The cancer tissue samples were grouped according to the risk score in TCGA
dataset and DEG analysis was performed. Finally, 158 DEGs were screened, of which
102 upregulated genes and 56 downregulated genes were identified
(Supplementary Fig. 7B). DAVID was used to analyze the function of the
DEGs under the screening threshold of FDR
It was considered meaningful to explore the inner link between the risk score and TMB in order to elucidate the genetic characteristic of each subgroup. Kaplan-Meier analysis of the survival curve revealed that the high-TMB group had a longer survival rate. The increase in the TMB level led to an improvement in survival, while the low-risk and high-TMB group survived the longest (Fig. 6A,B). There was no significant difference in TMB between the high- and low risk groups (Fig. 6C). Furthermore, there is no correlation between risk score and TMB (Fig. 6E). A high TMB induces antitumor immune cell activation and improves the prognosis of patients with OV.
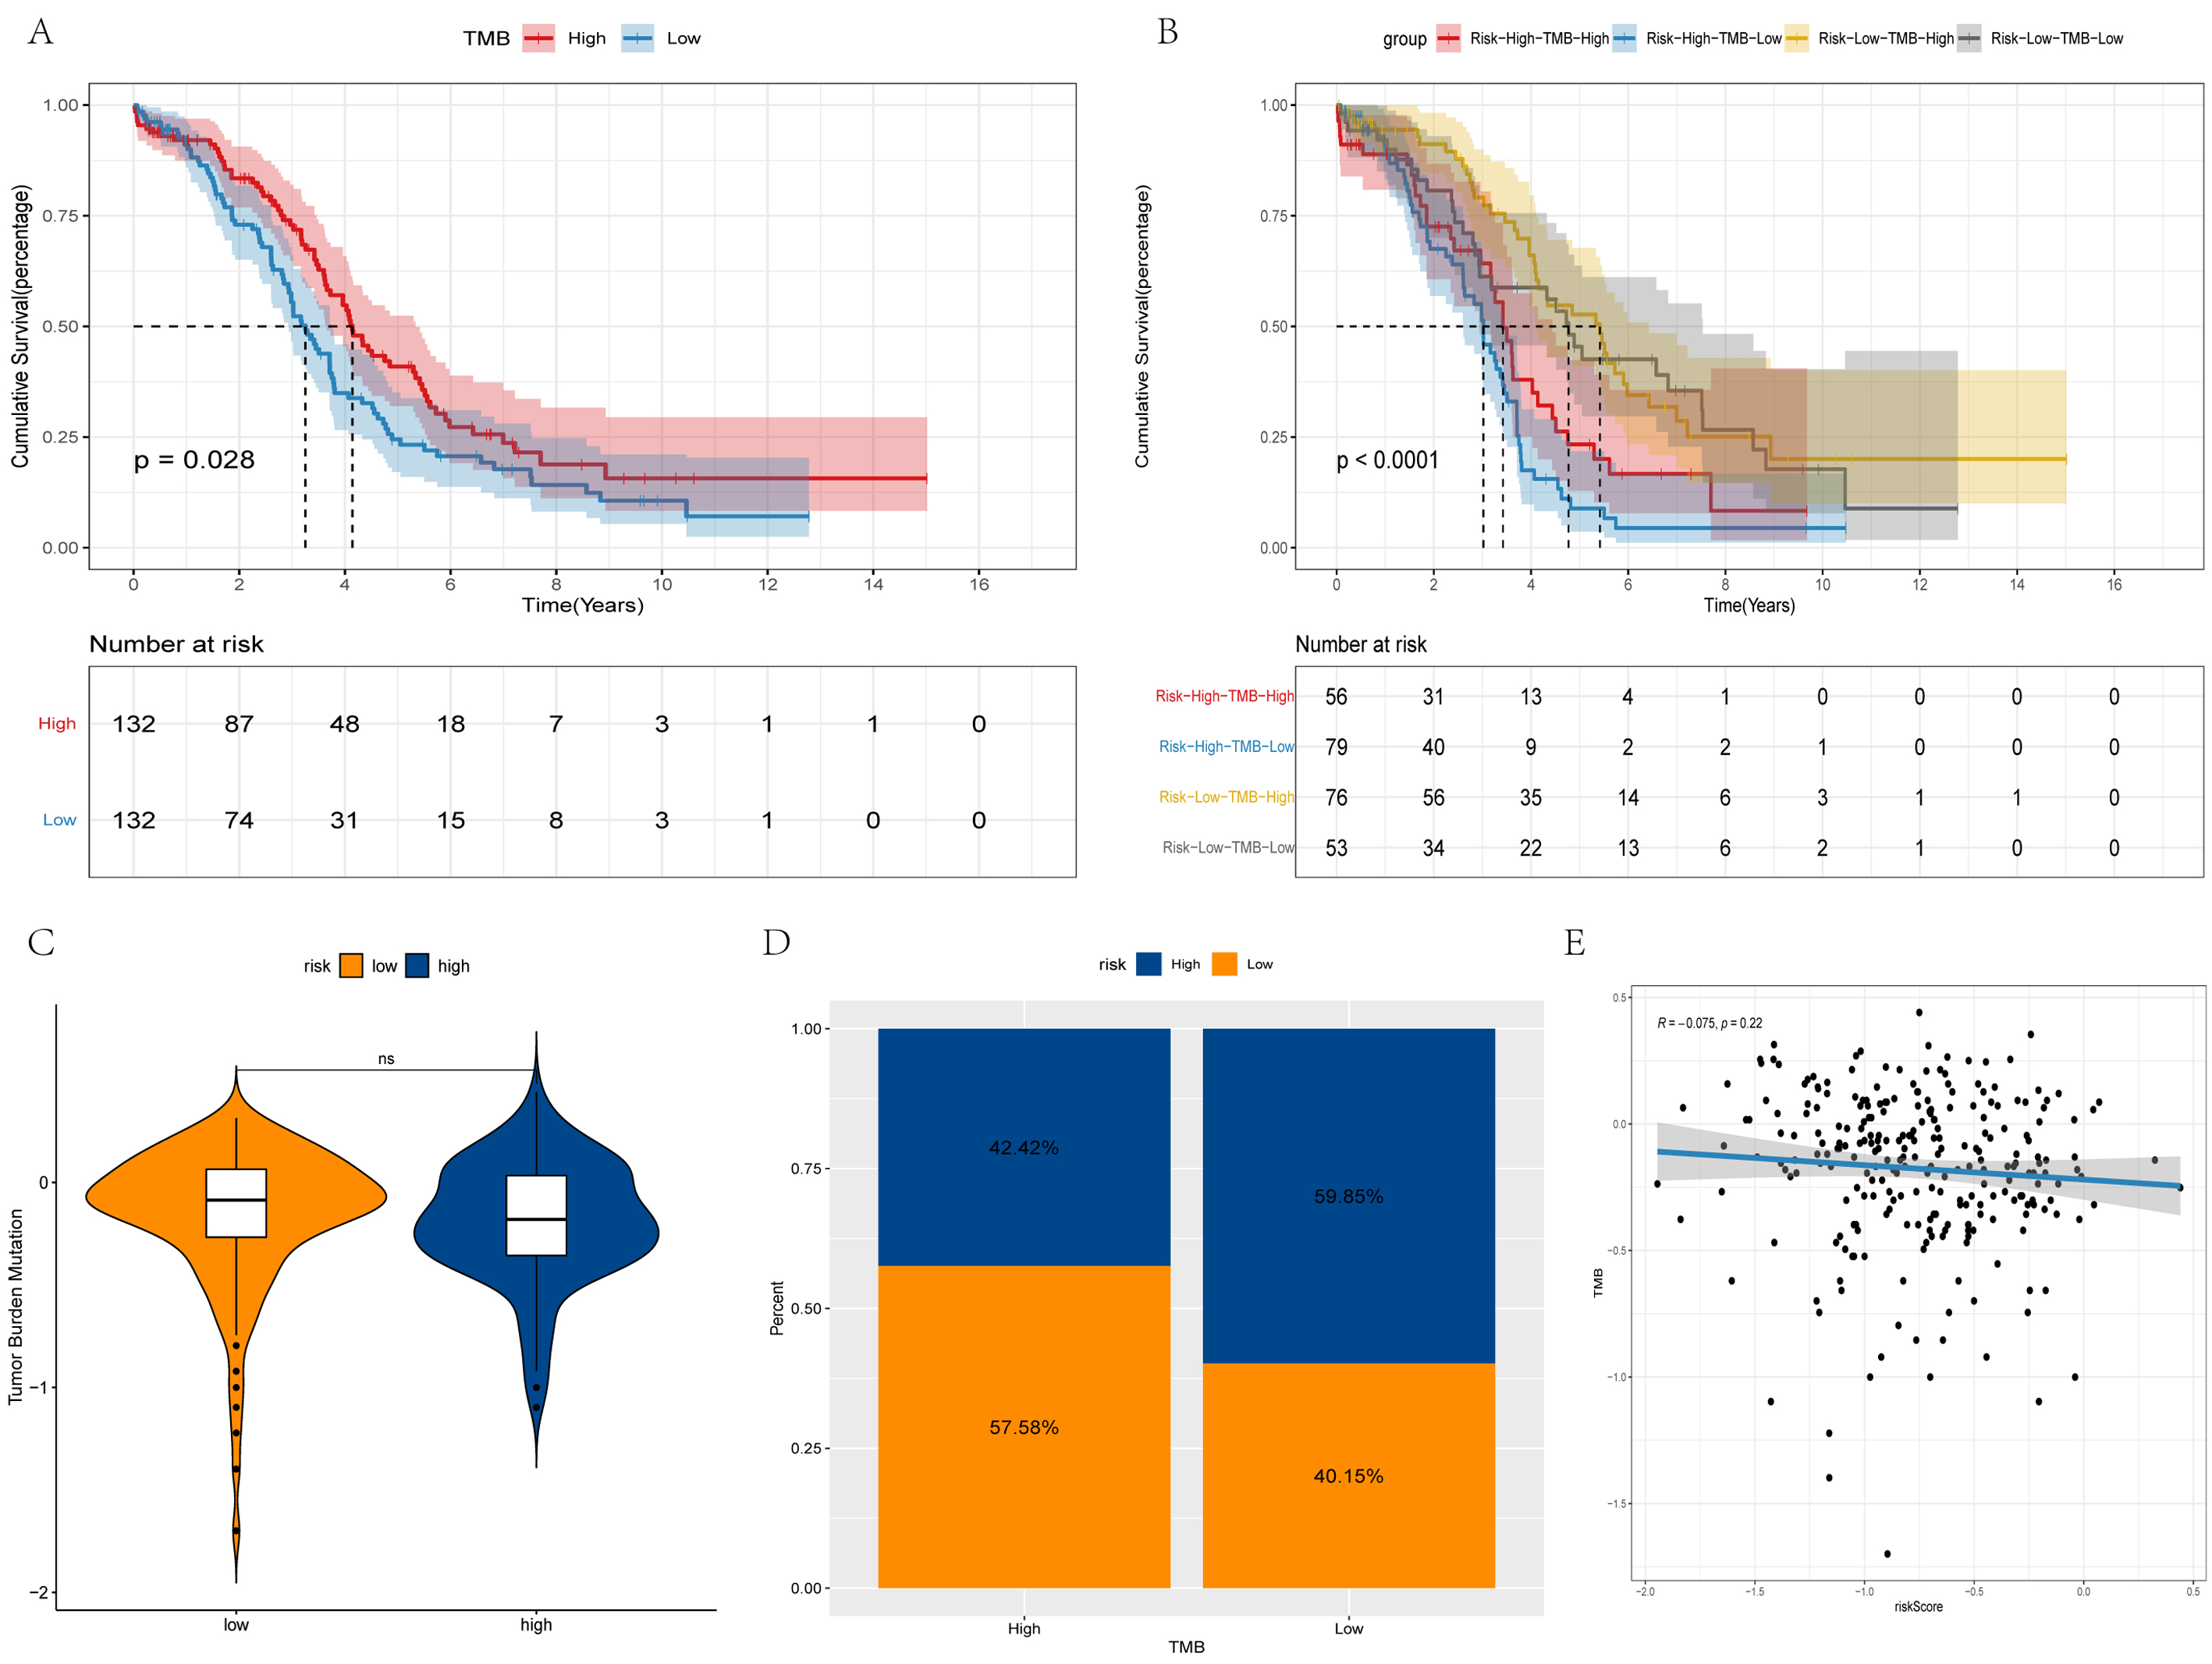 Fig. 6.
Differences in TMB between high and low-risk groups. (A,B) Survival curves of the different groups. (C) Violin plot of TMB. (D) Bar chart of proportional distribution. (E) Correlation between TMB and risk score.
The expression of immune checkpoints, including CD274, CTLA4, KLRC1, LAG3, PDCD1 and TIGIT was assessed in the high- and low-risk groups, followed by the evaluation of the relevance between these immune checkpoints, and risk score and signature genes. In the low-risk group, CD274, CTLA4, KLRC1, LAG3 and PDCD1 were significantly highly expressed. GZMB exhibited a positive association with each immune checkpoint, while the risk score was negatively associated with each immune checkpoint (Fig. 7A,B).
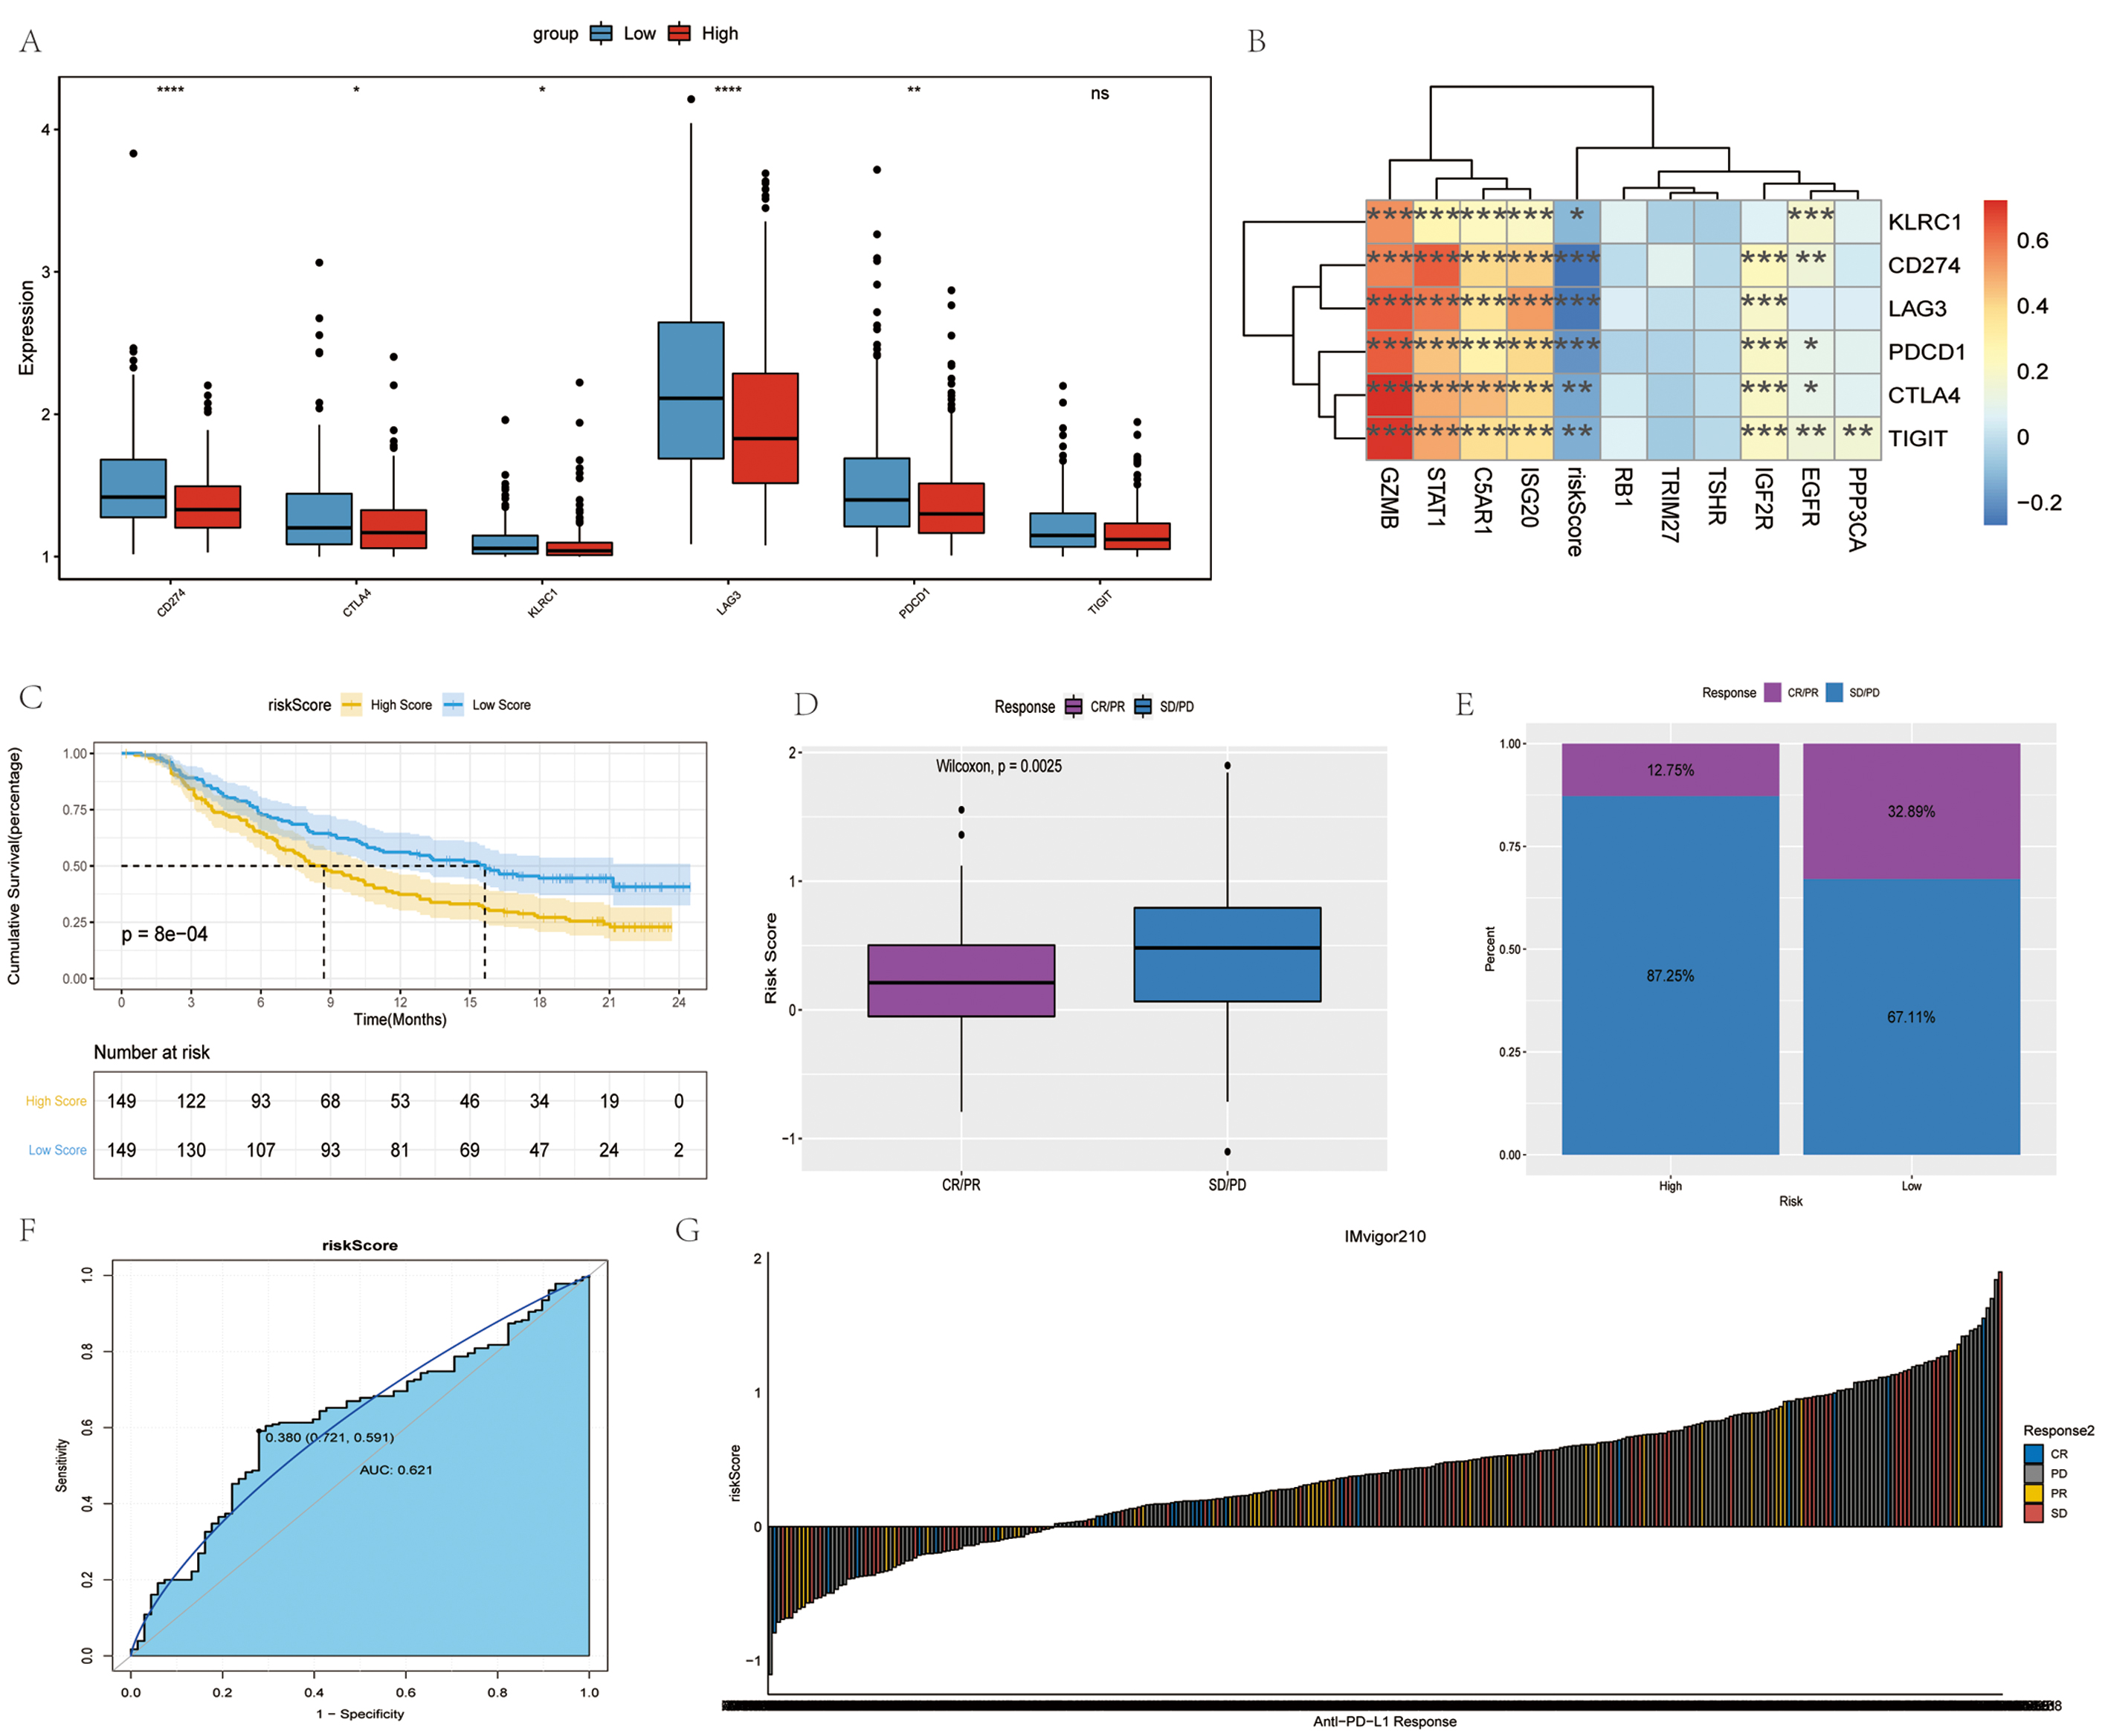 Fig. 7.
Immune checkpoints and anti-PD-1/L1 immunotherapy. (A)
Differences in immune checkpoints between high- and low- risk groups. Red and
blue represent high-risk and low-risk groups, respectively. (B)
Correlation analysis of immune checkpoints. (C) Survival curves of high- and low-
risk groups. (D) Differences in risk scores between different anti-PD-1 clinical
response groups. (E) Proportion of patients responding to anti-PD-1/L1
immunotherapy in high- and low- risk groups. (F) Accuracy of risk score in
differentiating the PD/SD and CR/PR groups. (G) Correlation of risk score with
clinical response to anti-PD-1/L1 immunotherapy.
Immunotherapy represented by the blocking of programmed cell death ligand 1 (PD-L1) and programmed cell death 1 (PD-1) has become a key breakthrough in the treatment of cancer. The present study then investigated whether the risk score can forecast the response of patients to immune checkpoint blockade treatment based on an immunotherapy cohort. In the anti-PD-L1 cohort, patients demonstrated significant clinical benefits and a notable prolonged survival was observed in the low-risk group (Fig. 7D). The therapeutic advantage was confirmed in the low-risk patients (Fig. 7D–F). Finally, the ability of the risk score to distinguish between the disease progression group (PD/SD) and disease remission group (CR/PR) treated with anti-PD-L1 immunotherapy was examined using the ROC curve (Fig. 7G). Overall, the findings of the present study strongly suggest that the risk score is significantly associated with the tumor response to immunotherapy. The risk score established herein may contribute to the prediction of the response to immunotherapy.
OV is a malignant ovarian tumor; 90–95% of cases are primary OV, and the remaining 5–10% cases are metastatic, with the tumor in the ovaries originating from a primary tumor elsewhere in the body. Diagnosis is difficult in the early stages of OV [30]. Among the gynecological malignancies, the high mortality rate associated with OV poses a severe threat to the lives of women [31].
In the present study, a risk score model was constructed consisting of 10 IRGs
and FRGs (C5AR1, GZMB, IGF2R, ISG20,
PPP3CA, STAT1, TRIM27, TSHR, RB1 and
EGFR), which can predict the prognosis of patients with OV. Some genes
were involved in pathophysiological features of OV. GZMB is a serine
protease with the highest content secreted by cytotoxic T-lymphocytes and natural
killer cells [32]. Previous studies have demonstrated that GZMB is
detected in lung carcinomas [33], primary breast carcinomas [34], urothelial
carcinomas [35] and nasal-type NK/T-cell lymphoma [36]. Wang et al.
[37] demonstrated that GZMB was associated with OS and could
affect prognosis through its effect on immune cell infiltration, thus being a
potential target for immunotherapy of OV. The expression of ISG20 is
associated with a variety of chemokines, resulting in the infiltration of various
immune cells into tumors, and the level of ISG20 is positively related
to the expression of PD-1/PD-L1 and CTLA4, which further inhibits T-cell
function, resulting in tumor evasion to the immune response [38]. The
overexpression of STAT1 has been shown to attenuate the TGF-
The independence of the risk score remained robust in the training and validation sets. The nomogram constructed by the combined model could better predict the short-term survival of patients with OV than a single prognostic factor. The OS of patients in the high-risk group was significantly lower than that of those in the low-risk group.
In addition, the present study screened out drugs related to antitumor and
immunotherapy. Sunitinib has been shown to suppress the migration of OV cells
through the negative modulation of TGF-
Furthermore, in the present study, in the high-risk group, a greater number of immune cells were infiltrated. However, the OS of patients in the high-risk group was significantly lower. Macrophages (TAMs) and regulatory T-cells (Tregs) promote OV immune surveillance evasion and tumor transfer. Immune cells in immune-rejecting tumors reside in the stroma surrounding tumor cells, instead of penetrating the tumor. The activation of the stroma in the TIME is considered to be associated with T-cell suppression [46, 47]. Therefore, it was hypothesized that stromal activation inhibited the antitumor function of immunocytes in the high-risk group. EMT is a key process in cancer progression and metastasis, promoting OV invasion [48]. In addition, in the present study, the ESTIMATE score and stromal score were significantly higher in the high-risk group, although the tumor purity was low, which is in line with the findings of previous studies [49, 50, 51, 52, 53]. Low tumor purity and a high stroma infiltrates were negatively associated with a shorter survival [54].
TMB is a hallmark of immunotherapy due to the biological mechanisms and immune responses to somatic mutations [55, 56, 57, 58]. That is, mutations in neoantigens increase when the TMB is higher. It is easier for the immune system to recognize and remove tumor cells. In addition, the survival rate of patients will be improved. The OS of patients with OV with a high TMB is significantly increased [59]. Herein, the combined analysis of the TMB and risk score found that patients with a high TMB and a low risk score had the best prognosis, while those with a low TMB and a high risk score had the worst prognosis. This implies that the risk score and TMB may play a role in different aspects of OV immunotherapy. This statement is also confirmed by the lack of a correlation between the risk score and TMB.
Immune checkpoints regulate the degree of immune activation and prevent the immune system from overactivation. This regulatory mechanism maintains the immune response within the normal physiological range and protects the host against autoimmunity. Based on immune checkpoint analysis, the present study found that CD274, CTLA4, KLRC1, LAG3 and PDCD1 were overexpressed in the low-risk group. Tu et al. [60] assessed the expression and therapeutic response of PD-1 in different types of cancer. Notably, the upregulation of PD-1 expression had a positive effect on OV, and the OS of patients with OV with an upregulated expression of CTLA4 was improved. The inhibitory checkpoint targets may be more efficient in patients with a high risk score in OV [61]. In addition, immune checkpoints were inversely associated with higher risk scores. Using the risk score to predict biological response to anti-immunotherapy in tumor samples may be helpful for OV immunotherapy. In the present study, patients in the low-risk group demonstrated significant clinical benefits and a significantly prolonged survival.
However, there are limitations to the study. Firstly, this study was carried out by using bioinformatics analysis. Although we verified the expression of the genes by RT-PCR in vitro, the sample size is relatively small. In the later stage, the sample size can be increased. Secondly, some various experiments are needed to make the results more convincing, such as cell and animal models experiments. Lastly, the association between clinical value and immunotherapy are needed to further investigate in prospective trials.
In conclusion, the present study constructed a 10-gene risk model that can function as an independent prognostic factor in patients with OV and predict the response to immunotherapy. In addition, the findings obtained may still provide a rational basis for the study of immunotherapy in OV, and the identified signature genes may provide aid future research in OV.
All data generated or analyzed during this study are included in this published article.
CW designed the research study. GZ performed the research. MG, YL, PL and TC provided help and advice on CW analyzed the data. CW wrote the manuscript. All authors contributed to editorial changes in the manuscript. All authors read and approved the final manuscript.
The Ethics Committee of the Second Affiliated Hospital of Xi’an Jiaotong University approved this study (2021241). Patient informed consent was obtained.
Not applicable.
This study was funded by Natural Science Basic Research Program of Shaanxi Province (2019JZ-46) and Xi’an Science and Technology Plan Project (201805098YX6SF32-4).
The authors declare no conflict of interest.
References
Publisher’s Note: IMR Press stays neutral with regard to jurisdictional claims in published maps and institutional affiliations.