


1 Guangzhou Key Laboratory of Forensic Multi-Omics for Precision Identification, School of Forensic Medicine, Southern Medical University, 510515 Guangzhou, Guangdong, China
2 Microbiome Medicine Center, Department of Laboratory Medicine, Zhujiang Hospital, Southern Medical University, 510280 Guangzhou, Guangdong, China
3 School of Forensic Medicine, Kunming Medical University, 650500 Kunming, Yunnan, China
4 Key Laboratory of Shaanxi Province for Craniofacial Precision Medicine Research, College of Stomatology, Xi’an Jiaotong University, 710000 Xi’an, Shaanxi, China
†These authors contributed equally.
Academic Editor: Said El Shamieh
Abstract
Background: The latest development in molecular biology has offered an opportunity to construct multiplex panel with better applicability for forensic purpose, and a self-developed 64-plex panel, including 59 autosomal diallelic InDels, 2 miniSTRs, 2 Y-InDels, and an Amelogenin gene, was validated to be an effective forensic tool in the previous study. Methods: By applying the 64-plex panel for DNA profiling, the obtained genotypes and the corresponding frequency data were used to investigate the forensic characteristics and population genetic structures of the Chinese Manchu group from the Inner Mongolia Autonomous Region and the Chinese Zhuang group from the Yunnan province. Results: The 64-plex panel was qualified to perform human identification and paternity testing with the combined powers of discrimination of 0.99999999999999999999999999758 and 0.99999999999999999999999999691; and cumulative probabilities of exclusion of 0.99999866 and 0.99999880 in the studied Manchu and Zhuang groups, respectively. Relatively closer genetic relationships were found between the Chinese Manchu group and Han population in Beijing; and between the Chinese Zhuang group and Vietnamese Kinh population. Conclusions: It could be indicated from the results that, with the preliminary ability to distinguish ancestral components from all the studied groups, the 64-plex panel can not only serve as a robust forensic panel in the Manchu and Zhuang groups, but also offer genetic insights into the genetic differentiations and substructures of these populations.
Keywords
- insertion/deletion polymorphism
- miniSTR
- Manchu
- Zhuang
- forensic efficiency
- population genetics
As one of the most abundant genetic markers in the human genome that displays length-based polymorphism, diallelic insertion and deletion (InDel) possesses the advantages of single nucleotide polymorphism (SNP) and short tandem repeat (STR), for being binary and detectable genetic marker in the capillary electrophoresis (CE) platform [1]. With no stutter peak, a short amplicon and a relatively low mutation rate, the InDel genetic marker has demonstrated better performance in DNA profiling of the highly degraded sample [2, 3] and ancestral information inference [4] when compared with the STR genetic marker. Even though most of the diallelic InDel-based different panels could meet the need for individual identification, they still fail to obtain comparable efficacies to that of STRs in paternity testing and are not so instructive when interpreting and deconvoluting DNA mixture [5]. In contrast, by shortening the lengths of the upstream and downstream flanking sequences of the core repetition region in the STR marker, miniSTR has dozens of alleles like traditional common STR and a shorter size of amplicon, resulting in its higher polymorphic information and better forensic applicability in mixture analysis than those of InDel genetic marker [6, 7]. However, due to the multi-allelic nature of miniSTR which consists of multiple different repeat motifs with 2–6 bp in length, some loci with more alleles in the commercial miniSTR kits, such as MiniFiler™ PCR Amplification kit, still are relatively big amplicon sizes of over 200 bp, which limits the number of loci within the same color fluorescence lane, and also potentially leads to DNA typing failure in the highly degraded sample, where allele dropout is more likely to happen in those miniSTRs with bigger amplicons. Attributed to the construction of the home-made 6-dye multiplex amplification panel [8], which is comprised of 59 autosomal InDels, 2 miniSTRs, 2 Y-InDels and an Amelogenin (AMEL) gene, it is now possible to further improve the efficacy of the multiplex panel for individual identification and paternity testing by combining diallelic InDels with shorter amplicons and miniSTRs with higher polymorphisms in a multiplex panel. Moreover, as a result of the addition of two miniSTRs, the 64-plex panel was able to indicate the presence of a mixture sample by observing the presence of the third or more alleles in one miniSTR locus, and the minor component was explicitly detected in those samples with the mixed ratios of 1:9 and 9:1 in the former validation study [7]. Although the forensic applicability of the novel self-developed 64-plex has been preliminarily validated [7], the polymorphic data of various populations from China still need to be investigated by the panel, and to further evaluate the robustness of the panel for the efficacies of individual identification and paternity testing.
According to the 7th national population census of China (http://www.stats.gov.cn/tjsj/pcsj/rkpc/7rp/indexch.htm), Manchu is the sixth largest ethnic group in China, with a population of over 10.4 million; and Zhuang is the second largest ethnic group, with over 19 million people. The native languages of the Manchu and Zhuang groups are the Manchu-Tungus and Kra–Dai language, which belong to the Altaic language family [9] and the Sino-Tibetan language family [10], respectively. Despite being one of the ethnic minorities, the Manchu people exerted a great influence on Chinese history [11, 12] from the Jin Dynasty (1115–1234 AD) to the Qing Dynasty (1636–1912 AD), which were founded by Jurchens and their successor Manchus respectively. Furthermore, the Chinese Manchu in the Inner Mongolia Autonomous Region (CMI) are the second largest ethnic minority in this region, as well as an important part of the local culture for leaving historical legacies such as the General’s government office of Suiyuan province during the Qing Dynasty. As for the Zhuang, their predecessors, the Luoyue, had settled in the ancient Lingnan region long before the Qin Dynasty (221–224 BC) unified here [13]. Being part of this region inhabited by numerous ethnic groups which belong to the Sino-Tibetan, Kra–Dai, and Austro-Asiatic language families, Yunnan province has acted as the center of trade and cultural exchanges between the Chinese civilization and the Mainland Southeast Asian civilization for millennia [14]. Thus, the genetic background investigation of the Chinese Zhuang group in Yunnan province (CZY) is also meaningful.
However, the genetic polymorphic data of CMI and CZY groups have not yet been systematically analyzed so far. Most of the studies about these two ethnic groups are still focused on the fewer populations living in Liaoning [15, 16, 17, 18, 19, 20, 21], Heilongjiang [22], Jilin [23] and Guangxi [24, 25, 26, 27, 28] provinces. Attributed to the unique geographical environments and cultural conventions of Yunnan province and Inner Mongolia Autonomous Region, CMI and CZY groups may have different genetic substructures and admixture histories from the same ethnic groups in other regions. In this study, the population polymorphic data of CMI and CZY groups were studied and applied using multiple genetic analysis methods, aiming to validate the forensic efficacy of the previous self-developed 64-plex panel labeled by six-color fluorescent dyes, and to further dissect the potential population genetic substructures of the two studied groups.
All of the 286 participants, including Manchu (n = 187) and Zhuang (n = 99) individuals from the Inner Mongolia Autonomous Region and Yunnan province, respectively, who were healthy and genealogically unrelated, had signed written informed consents before providing their bloodstain samples. This present study strictly complied with the Declaration of Helsinki (2013), as revised by the 64th World Medical Association General Assembly. The experimental procedure was consistent with the ethical guidelines of the Southern Medical University and Xi’an Jiaotong University Health Science Center, and was also reviewed by the Ethics Committee of Xi’an Jiaotong University Health Science Center (NO. 2019-1039).
As for the control of the following population genetic analysis, except for the 5 loci of 2 miniSTRs, 2 Y-InDels and the AMEL gene, the genotype data of other 59 InDel loci were obtained from the 1000 Genomes Project Phase 3 dataset [29]. The population dataset contained the allelic variations of the 2504 individuals of the 26 reference populations in five continental regions, including East Asian populations: CDX, CHB, CHS, KHV and JPT; African populations: ACB, ASW, GWD, ESN, LWK, MSL, and YRI; European populations: FIN, CEU, GBR, IBS and TSI; South Asian populations: BEB, GIH, ITU, STU and PJL; American populations: CLM, PUR, MXL and PEL. The detailed information of the 64 selected loci and full names for the abbreviations of the aforementioned populations were illustrated in Supplementary Tables 1,2, respectively.
After extracting human genomic DNA from 286 bloodstain samples using PrepFiler BTA™ Forensic DNA Extraction kit (Thermo Fisher Scientific, MA, USA), a multiplex PCR amplification was performed with the self-developed 6-dye 64-plex panel on the GeneAmp PCR System 9700 Thermal Cycler (Applied Biosystems, Foster City, CA, USA) according to the previously reported research. And then the PCR products were removed from the PCR cycler and then genotyped by capillary electrophoresis on an ABI 3500xL Genetic Analyzer (Applied Biosystems, Foster City, USA). The DNA profiles of the 64-plex panel were visualized and analyzed by GeneMapper ID-X software version 1.5 (Applied Biosystem, Foster City, USA).
In the CMI and CZY groups, the allele frequencies and forensic parameters of the
61 autosomal loci, including match probability (MP), power of discrimination
(PD), probability of exclusion (PE), polymorphic information content (PIC),
typical paternity index (TPI), observed heterozygosity (Ho) and expected
heterozygosity (He), were calculated by the STRAF online program version 1.0.5
(http://cmpg.unibe.ch/shiny/STRAF/) [30], while Hardy-Weinberg equilibrium (HWE)
and linkage disequilibrium (LD) tests were operated by the Arlequin Software
(version 3.5.1.2, Excoffier & Lischer, Switzerland) [31]. Violin plots of the
relevant forensic parameters in the two studied groups and five reference East
Asian populations were generated by the ‘ggstatsplot’ package (Patil, Germany)
[32] of R software (version 4.0.5, R Foundation for Statistical
Computing, Vienna, Austria), where Kruskal-Wallis chi-square tests and Dunn’s
tests adjusted by Holm’s method were performed among all the pairwise
populations. F
A biplot of principal component analysis (PCA) at the population level and the
corresponding cos2 factor map for the 59 InDels with the above-average level of
contributions to the total variance were performed by the R packages of
‘ggplot2’ (Wickham, New Zealand), ‘FactorMineR’ (Sébastien & Julie &
François, France), ‘factoextra’ (Kassambara & Mundt, France) and ‘corrplot’
(Wei & Simko, China) [34, 35]. The bar plot of variable contributions to the top
two principal components (PC) was also generated by the ‘factoextra’ package,
while the PCA of the individual level was performed by OriginPro 2021 software
(version 9.8.0.200, OriginLab Corporation, Northampton, MA, USA). On the basis of
D
Apart from two Y-InDels and the AMEL gene, HWE and LD tests were performed on 59
InDels and 2 miniSTRs in the CMI and CZY groups. The p values of HWE and
LD tests were available in Supplementary Tables 3–5. In the HWE tests,
some of the loci showed p values lower than 0.05, which included four
loci (rs55965654, rs35828751, rs56160634 and rs3833559 loci) in the CMI group;
and five loci (rs10556197, rs3082950, rs34802628, rs3988323 and D1S1656 loci) in
the CZY group. But after applying Bonferroni’s correction (p
As shown in Fig. 1, the distributions of the forensic parameters for all loci with medians labeled accordingly were demonstrated in the seven East Asian populations. Since the MP values can be converted to 1-PD, the corresponding distributions of MP values were not shown in this figure. Supplementary Fig. 1 provided an overview of the allelic frequency, Ho and He values of each InDel locus. Insertion allele frequencies of the 59 InDel loci in CMI and CZY groups ranged from 0.313 (rs3833559) to 0.711 (rs3830338), and from 0.3081 (rs144378883) to 0.6566 (rs5833522), respectively. Moreover, the detailed forensic parameters of all 61 loci were available in Supplementary Table 3. As demonstrated in Fig. 1A,B, the ranges of PD and PIC values were from 0.6512 (rs10594574) to 0.5528 (rs3582875), and 0.3749 (rs10536238) to 0.3264 (rs3830338) in CMI group; and from 0.6665 (s34802628) to 0.4450 (rs10556197), and 0.3750 (rs10581929) to 0.3355 (rs144378883) in CZY group, with the corresponding medians about 0.62 and 0.37 in both groups. Comparing the two studied groups, the median values of PD and PIC in the CMI group were slightly greater (Fig. 1A,B), while the median values of PE and TPI in the CZY group were appreciably higher (Fig. 1C,D). In addition, the smaller interquartile ranges of parameters in the CMI group suggested that the forensic efficacy of these 59 loci demonstrated better consistency in this group. It was worth noting that some loci were observed as outliers in the distributions for forensic parameters in the two studied groups. As regards the PD distributions in both of the two groups, only the rs35828751 locus among the 59 InDels in the CMI group was observed as an outlier, with relatively lower efficiency. However, the rs56160634 and rs10556197 loci of 59 InDels showed relatively higher efficacy for paternity testing in the CMI and CZY groups, respectively. Overall, no significant differences were observed among the distributions of forensic parameters in all pairs of the seven East Asian populations, demonstrating a consistency of efficacy for forensic applications in the seven East Asian populations. The CHS group had the smallest spreads of parameters’ distributions among these populations, with the 59 InDel loci exhibiting a better robustness in this population. The distributions of PD and PIC values were symmetrically or negatively skewed in all the studied and reference East Asian groups, indicating that half or more of the 59 InDels were with above-average efficacies in these groups. Positively skewed distributions could be observed in the PE and TPI values among most of the groups, except for the JPT group, in which an evident negatively skewed pattern was consistently demonstrated in all the forensic parameters.
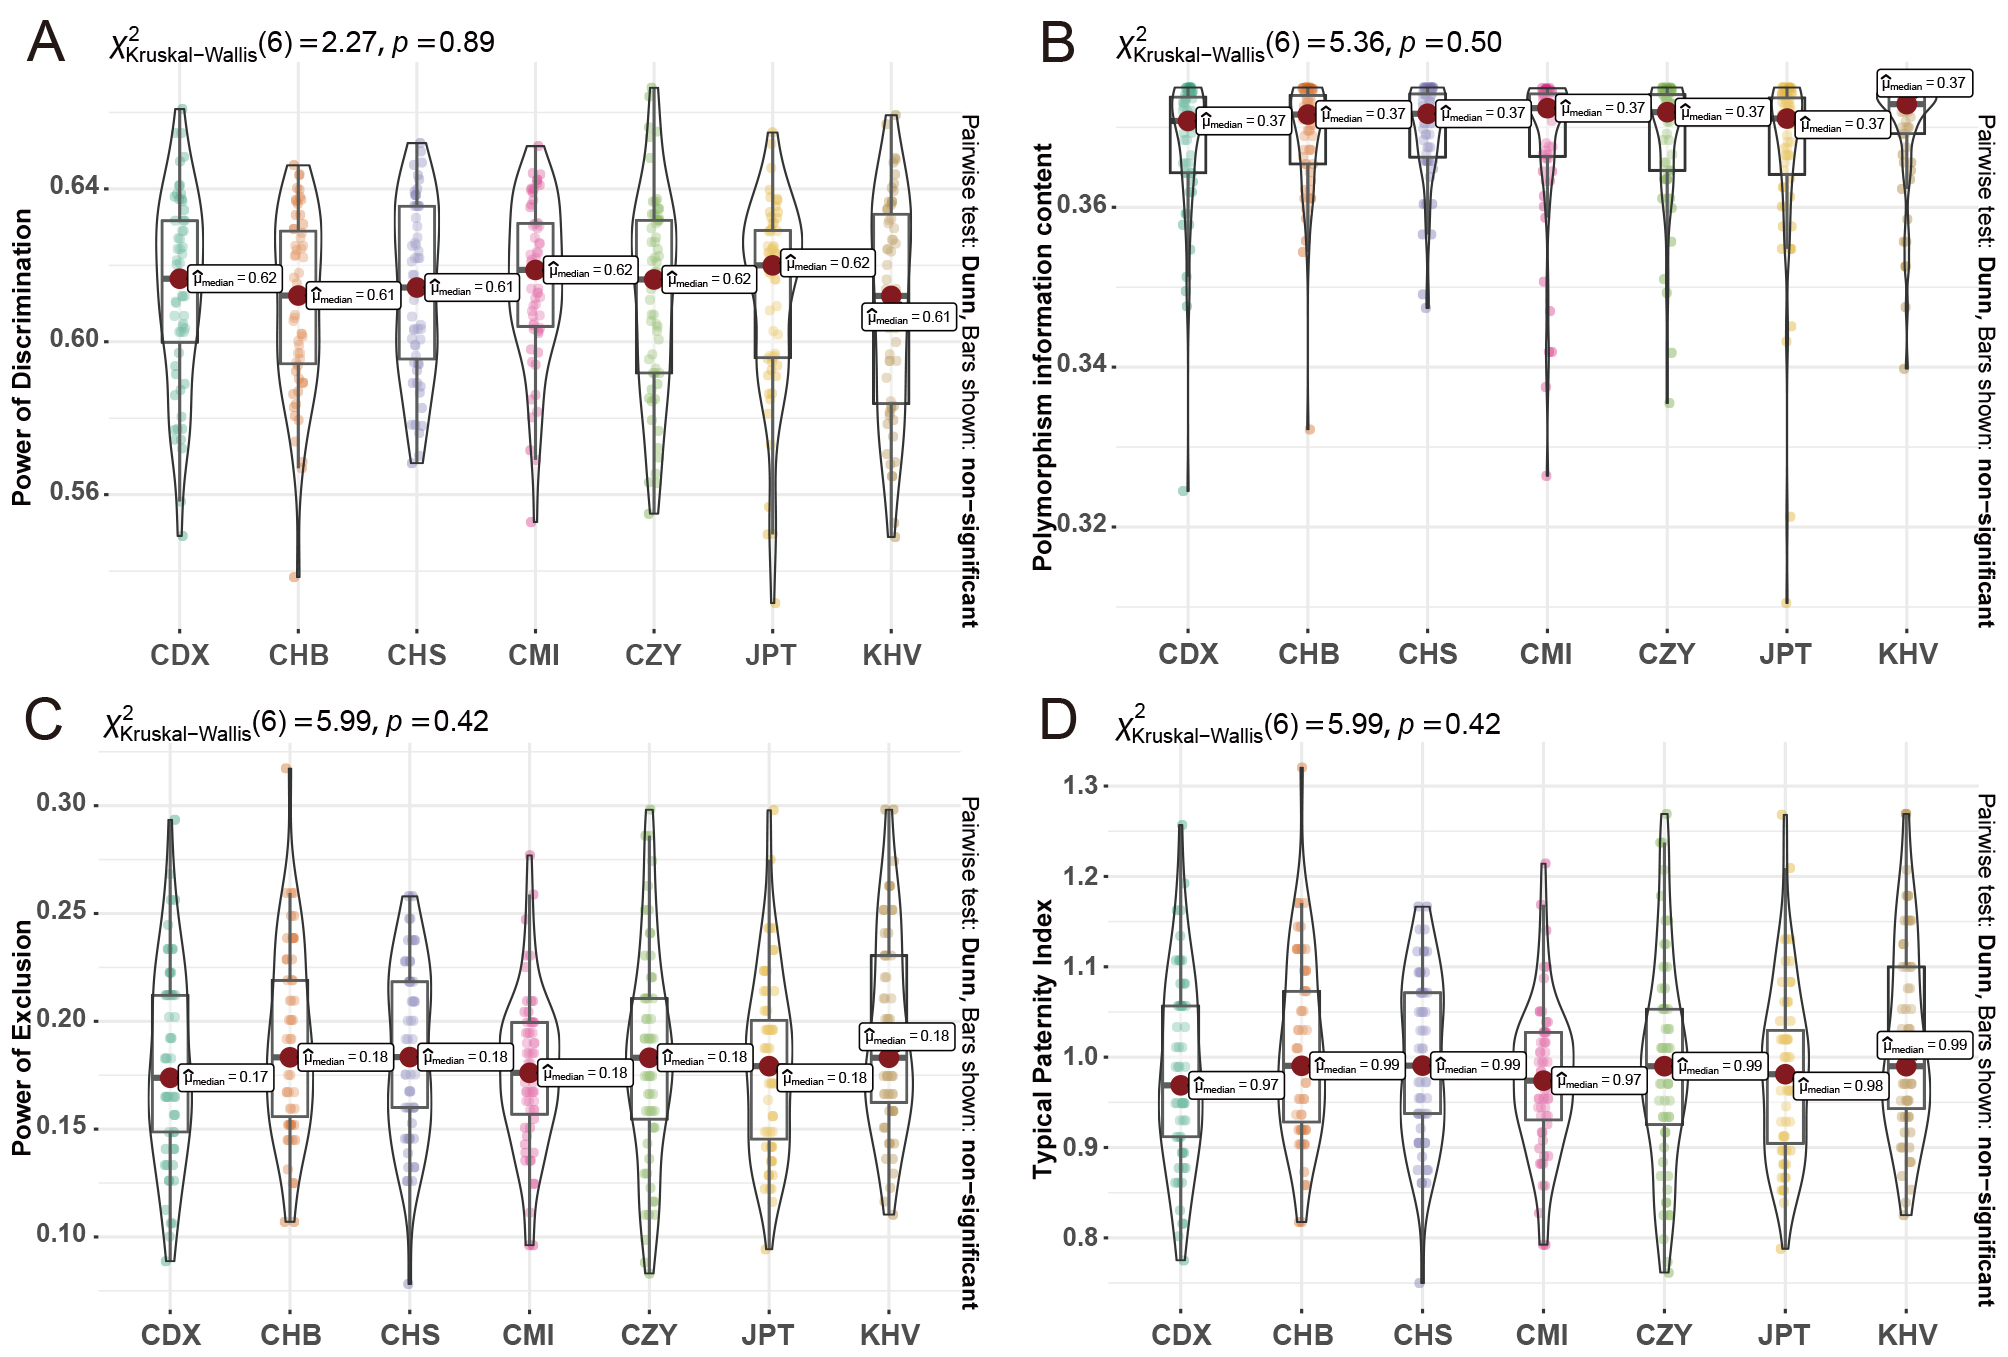 Fig. 1.
Violin plots of forensic parameters for the 59 InDel loci in East Asian populations. The distributions of PD values (A), PIC values (B), PE values (C), and TPI values (D) of the 59 loci in East Asian populations were shown in the form of violin plots. CMI, Chinese Manchu in the Inner Mongolia Autonomous Region; CZY, Chinese Zhuang in Yunnan province; CDX, Chinese Dai in Xishuangbanna; JPT, Japanese in Tokyo; KHV, Kinh in Ho Chi Minh City; CHB, Chinese Beijing Han; CHS, Chinese Southern Han.
As common multi-allelic genetic markers with higher polymorphisms, the miniSTRs of D3S1358 and D1S1656 showed better efficacies than the 59 InDels for individual identification. As for the CZY group, the PE, PD, PIC, and He values of the two miniSTRs were 0.364, 0.870, 0.656, 0.709, as well as 0.692, 0.948, 0.834, 0.851, respectively. With TPI values of over 1.4, the two miniSTRs also showed their preponderance of efficacy in paternity testing when compared with the 59 InDels. Moreover, the cumulative values of match probabilities (CMP), powers of discrimination (CPD) and probabilities of exclusion (CPE) of the selected 61 loci were 2.4227E-27 and 3.0937E-27; 0.999999999999999999999999998 and 0.999999999999999999999999997; and 0.99999866 and 0.99999880 in the CMI and CZY groups, respectively. Moreover, Supplementary Fig. 2 was drawn to give a landscape of the insertion allele frequencies of the 59 InDels, and the corresponding frequency of each locus could be referred from the color of the grid. For example, the redder the grid was, the greater the value of the insertion allele frequency for the related locus was, and vice versa. The clustering analysis for the 59 InDel loci was also performed when generating the heatmap. The 59 InDels were firstly clustered into two main branches and then the second main branch was separated into two subbranches. In addition, the allele frequencies of the 59 InDels fluctuated around 0.5 in East Asian populations, including CHB, CHS, CDX, KHV, JPT, CMI and CZY groups.
Locus-by-locus AMOVA analyses were performed to measure the genetic variances
for the 59 InDels among pairwise populations, and the corresponding p
values were shown in Supplementary Tables 6,7. After
Bonferroni’s correction (p
The F
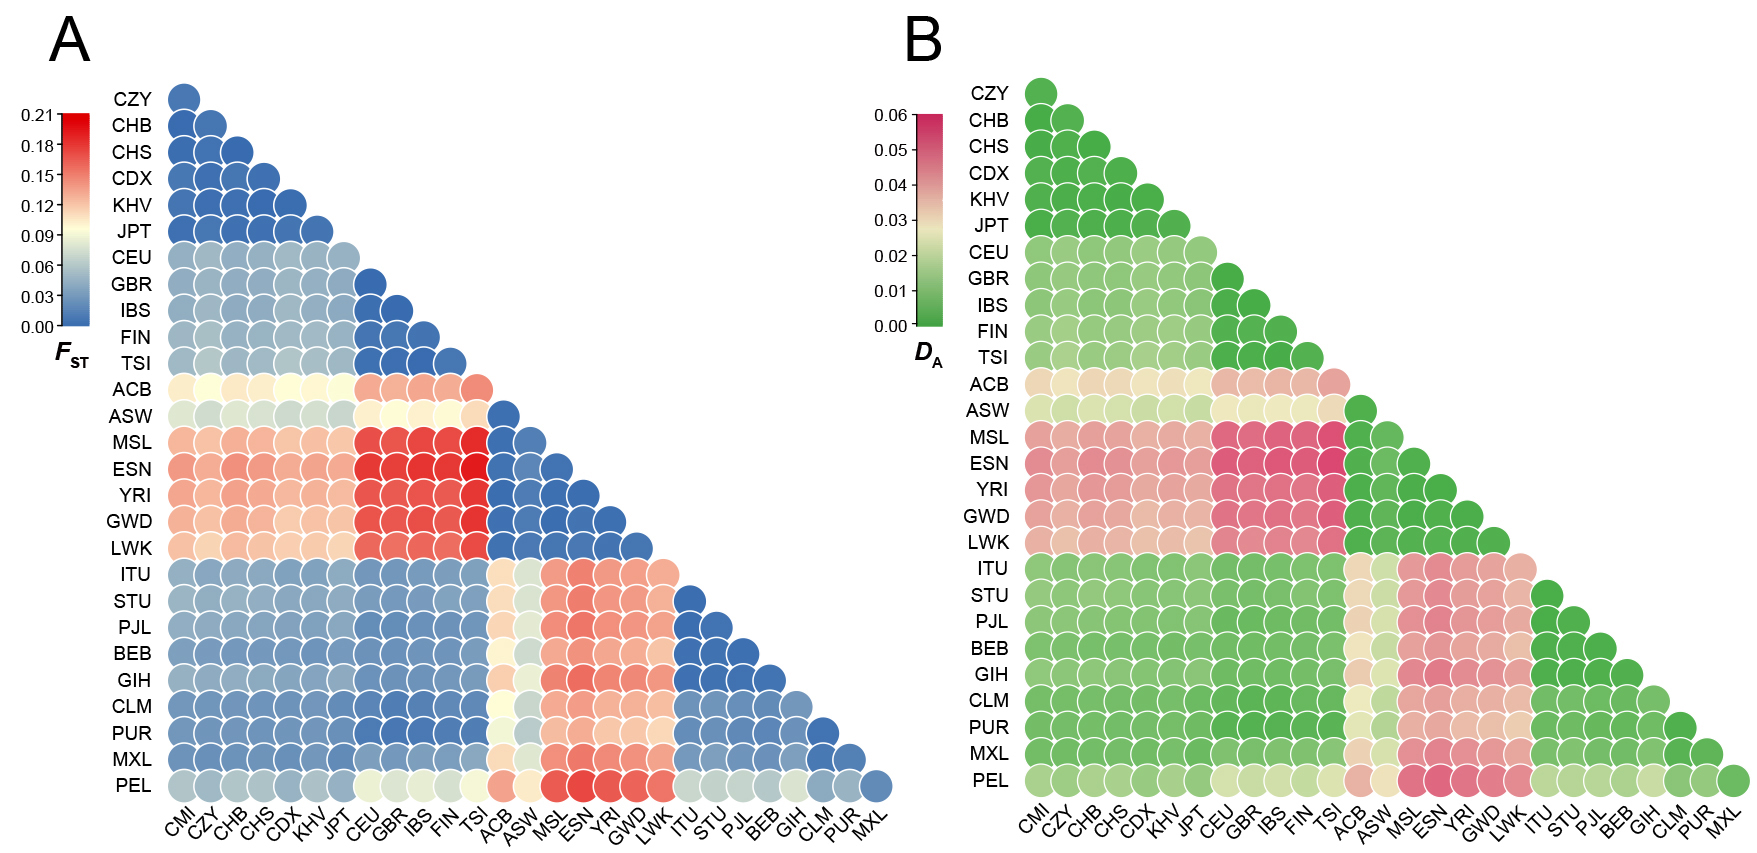 Fig. 2.
Heatmaps on the basis of pairwise F
As shown in Fig. 2B, the distribution pattern of the heatmap was similar to that
of Fig. 2A. The pairwise genetic distances among the 28 populations could be
discerned from the heatmap based on D
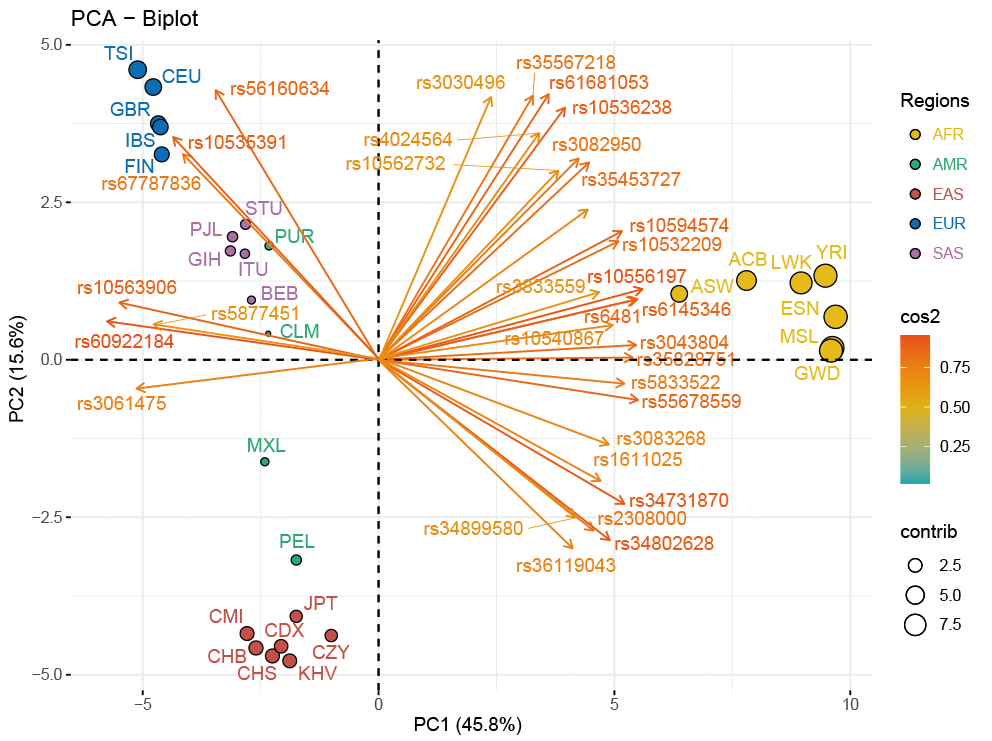
The PCA-biplot of population level based on the allele frequencies data of the 28 populations was employed to explore the genetic relationships among these populations. As demonstrated in Fig. 3, 61.4% of the total variance was explained by the top two principal components of PC1 (45.83%) and PC2 (15.57%). Populations from the three continental regions of Africa, Europe and East Asia were assigned to three corresponding clusters distributed in the upper left, lower left and middle right of the PCA plot, while the remaining American and South Asian populations scattered between the two clusters of East Asians and Europeans. As shown in the Supplementary Fig. 3, a histogram was used to compare contributions of the 59 selected loci to the first two PCs, and loci with contribution values higher than the average value (i.e., higher than that of the rs33928328 locus) were also presented in the cos2 plot of the PCA-biplot (Fig. 3), where the color and length of each arrow stood for the related cos2 value of its corresponding locus. Besides, the contribution of each population for inferring ancestral information was revealed by the size of each point. In other words, the bigger the size of the dot was, the more the corresponding ancestral information components the population has.
 Fig. 3.
PCA-biplot in population level for the CMI, CZY and 26 reference populations. The PCA result of population level for the CMI, CZY groups and the 26 reference populations was visualized by a biplot. The color and length of each arrow stood for the related cos2 value of its corresponding locus. CMI, Chinese Manchu in the Inner Mongolia Autonomous Region; CZY, Chinese Zhuang in Yunnan province; CDX, Chinese Dai in Xishuangbanna; JPT, Japanese in Tokyo; KHV, Kinh in Ho Chi Minh City; CHB, Chinese Beijing Han; CHS, Chinese Southern Han; ACB, African Caribbean in Barbados; ASW, African Ancestry in Southwest USA; MSL, Mende in Sierra Leone; ESN, Esan in Nigeria; YRI, Yoruba in Ibadan; GWD, Gambian in Western Division; LWK, Luhya in Webuye, Kenya; FIN, Finnish in Finland; CEU, Utah residents with Northern and Western European ancestry; GBR, British in England and Scotland; IBS, Iberian populations in Spain; TSI, Toscani in Italy; ITU, Indian Telugu in the UK; PJL, Punjabi in Lahore; STU, Sri Lankan Tamil in the UK; BEB, Bengali in Bangladesh; GIH, Gujarati Indian in Houston; CLM, Colombian in Medellin; PUR, Puerto Rican in Puerto Rico; MXL, Mexican Ancestry in Los Angeles; PEL, Peruvian in Lima; AFR, African populations; SAS, South Asian populations; EUR, European populations; EAS, East Asian populations; AMR, American populations.
According to the PCA of individual level based on the raw genotype data of the
Africans, East Asians and Europeans (Supplementary Fig. 4), a
three-dimensional PCA plot was drawn to evaluate the efficiency of the panel when
practicing a more fine-scale ancestral inference from the individual perspective.
As a result, 11.2% of the total variance was defined by PC1 (6.5%), PC2 (2.4%)
and PC3 (2.2%), while the clusters representing Africans, Europeans and East
Asians (including the CMI and CZY groups) could be roughly separated.
Additionally, an MDS analysis was also performed based on the pairwise
F
A rooted NJ phylogenetic tree (Fig. 4A) and an unrooted UPGMA tree (Fig. 4B)
were reconstructed on the basis of pairwise D
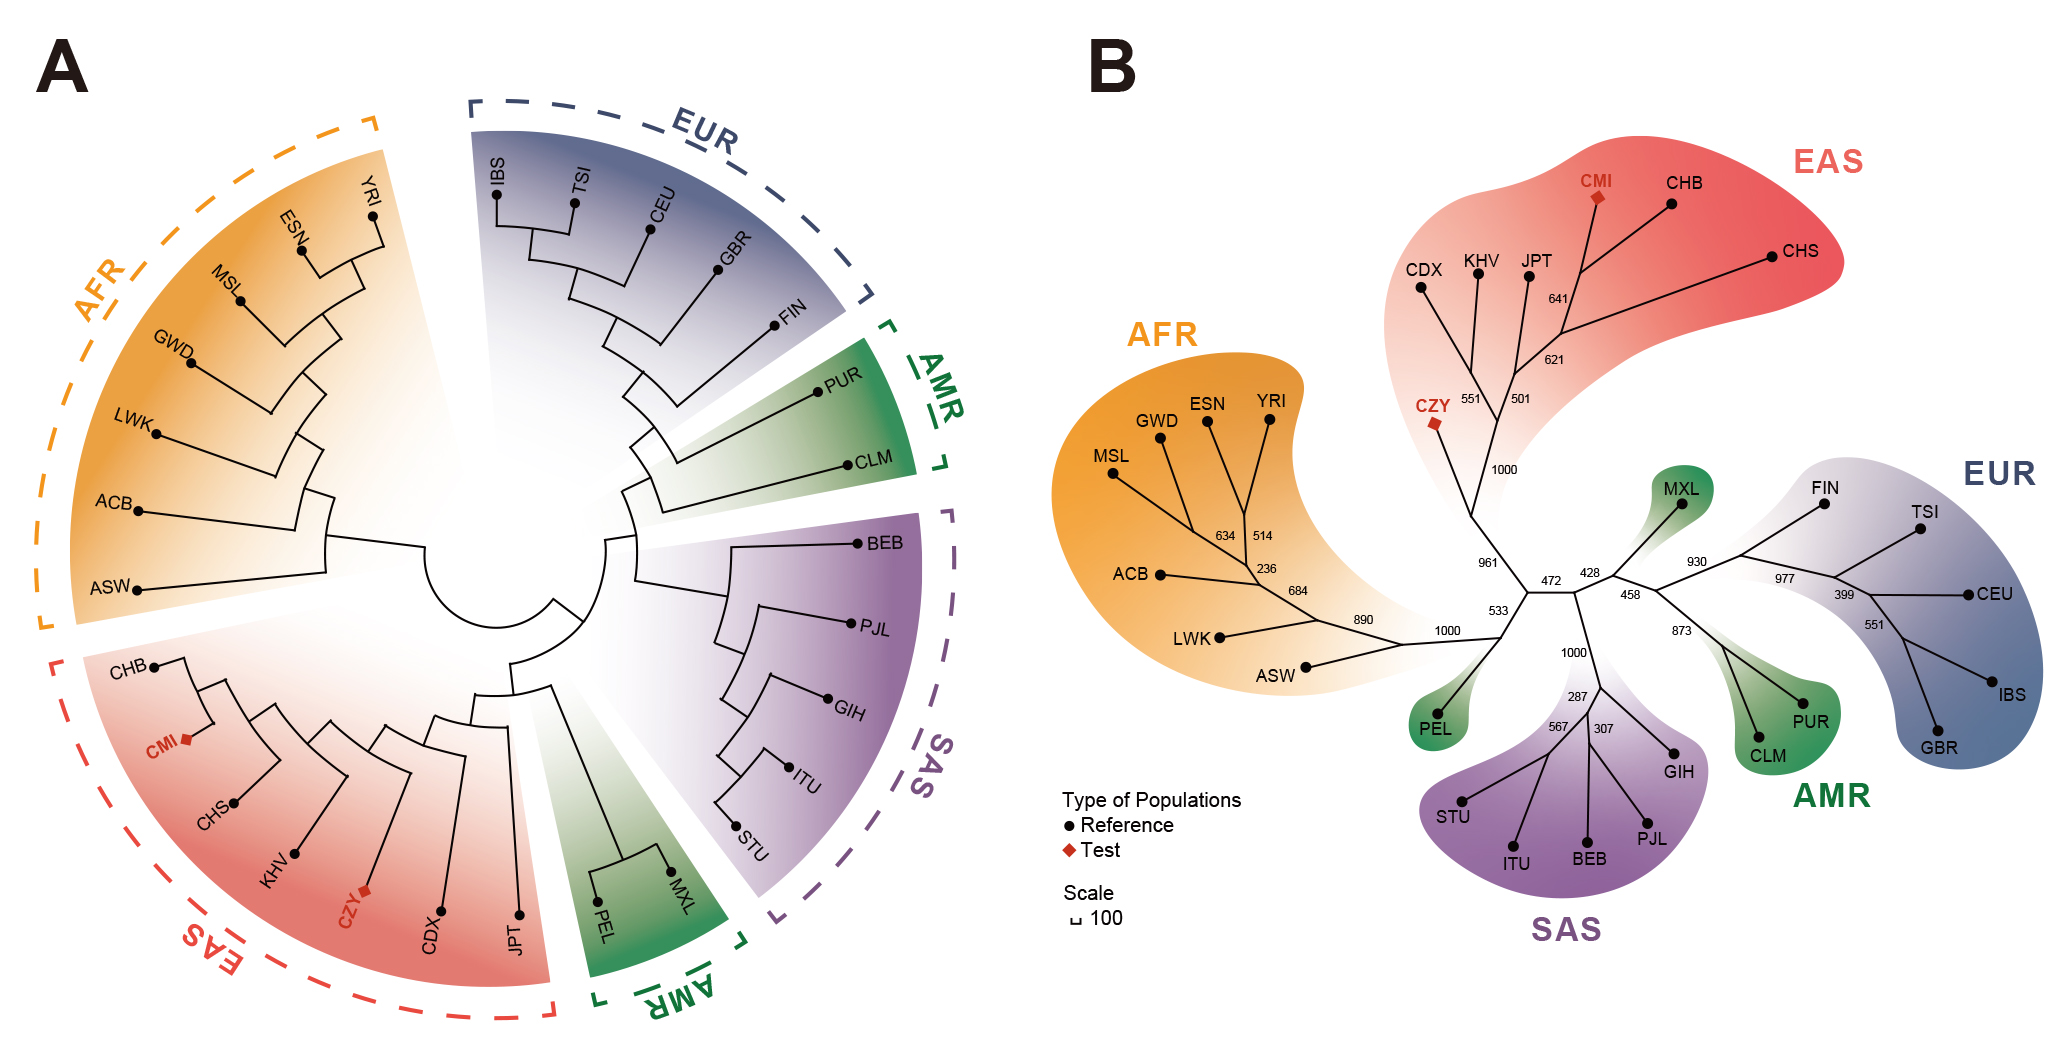 Fig. 4.
Reconstructions of phylogenetic trees of the CMI, CZY groups and
the 26 reference populations. (A) A rooted NJ phylogenetic tree based on
pairwise D
 Fig. 5.
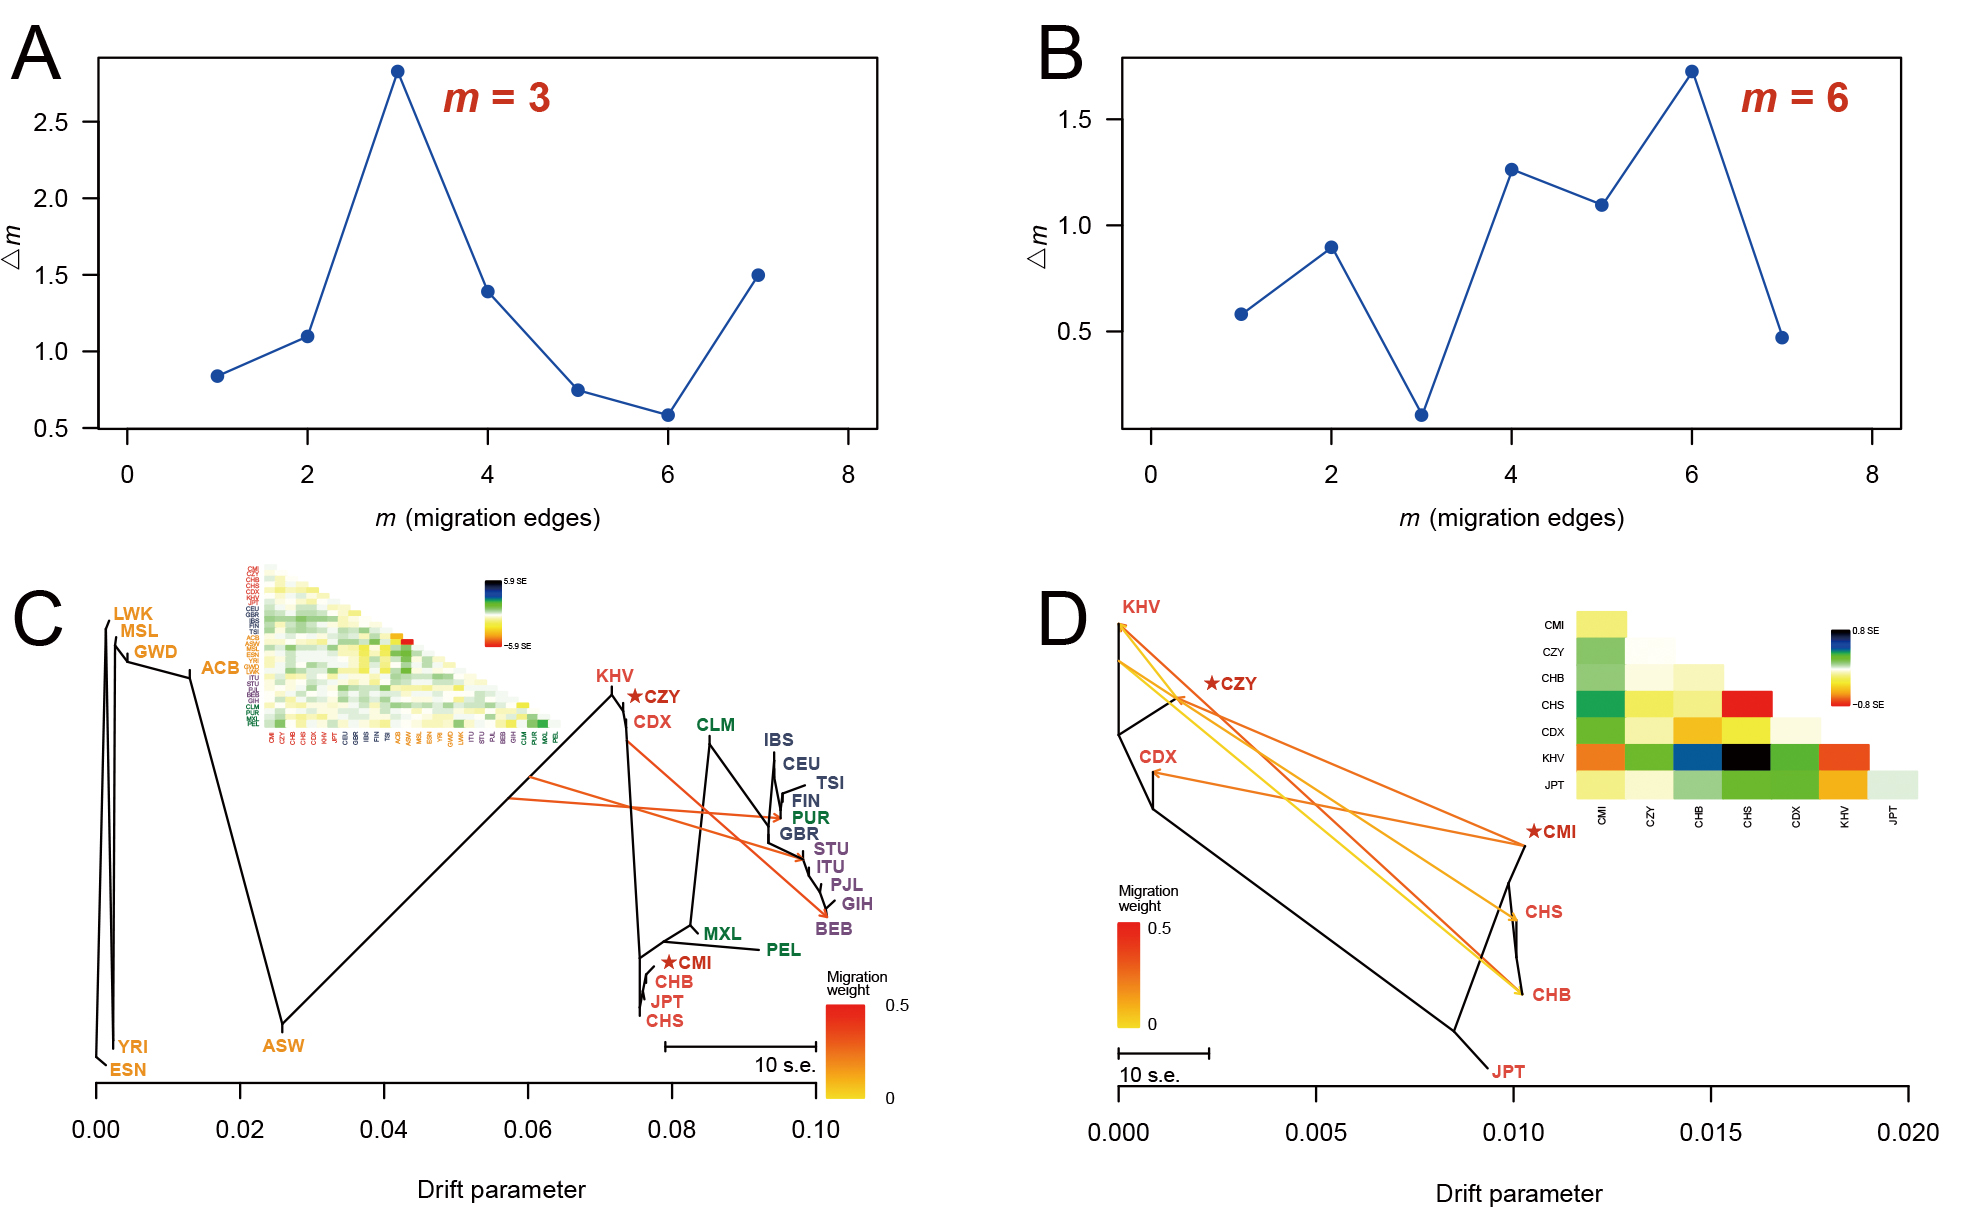
DeltaM plots and the corresponding maximum likelihood trees. A series of maximum likelihood trees with different numbers of migration events (m = 1–8) were generated for 5 iterations by TreeMix analyses. The deltaM plots (A,B) indicated the optimum numbers of migration events for all the 28 populations (m = 3) and populations from East Asia (m = 6). The corresponding maximum likelihood trees were reconstructed when m = 3 (C) and m = 6 (D), with each arrow indicating a certain migration event and its weight. The residual covariance matrices (C,D) were applied to measure the model fit of trees (i.e., the genetic relationships between the pair of populations with values greater than zero are underestimated by the model and vice versa). CMI, Chinese Manchu in the Inner Mongolia Autonomous Region; CZY, Chinese Zhuang in Yunnan province; CDX, Chinese Dai in Xishuangbanna; JPT, Japanese in Tokyo; KHV, Kinh in Ho Chi Minh City; CHB, Chinese Beijing Han; CHS, Chinese Southern Han; ACB, African Caribbean in Barbados; ASW, African Ancestry in Southwest USA; MSL, Mende in Sierra Leone; ESN, Esan in Nigeria; YRI, Yoruba in Ibadan; GWD, Gambian in Western Division; LWK, Luhya in Webuye, Kenya; FIN, Finnish in Finland; CEU, Utah residents with Northern and Western European ancestry; GBR, British in England and Scotland; IBS, Iberian populations in Spain; TSI, Toscani in Italy; ITU, Indian Telugu in the UK; PJL, Punjabi in Lahore; STU, Sri Lankan Tamil in the UK; BEB, Bengali in Bangladesh; GIH, Gujarati Indian in Houston; CLM, Colombian in Medellin; PUR, Puerto Rican in Puerto Rico; MXL, Mexican Ancestry in Los Angeles; PEL, Peruvian in Lima.
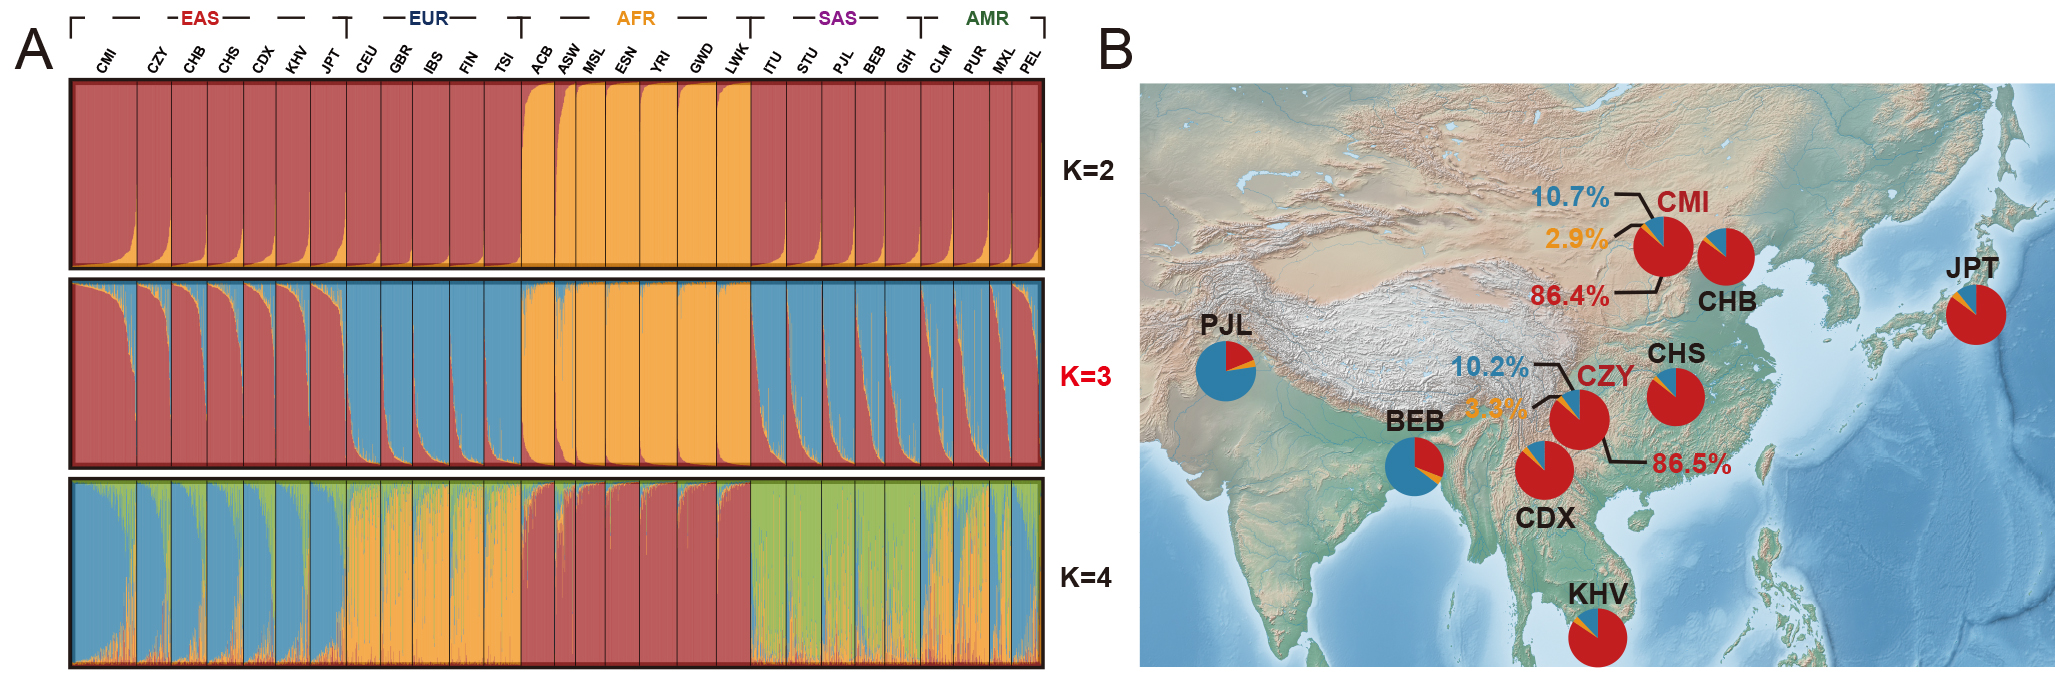
To further dissect the population genetic structures of the 28 worldwide populations, a STRUCTURE analysis was performed based on raw genotype data, and the results at K = 2–4 were shown in Fig. 6A. According to the InPK and deltaK plots (Supplementary Fig. 6) generated by the online Structure Harvester program, the optimum K value was eventually confirmed (K = 3). Thereafter, a series of pie charts were applied to visualize the ancestral components of the populations from South Asia and East Asia when K = 3, and subsequently labeled to their corresponding geographical locations on the map displayed in Fig. 6B. In summary, the two studied groups demonstrated comparatively large proportions of the East Asian ancestral information component (86.4% and 86.5%). It could be inferred from the Supplementary Fig. 6 in which African populations were the first identified population (K = 2), and then the East Asian, European and South Asian populations were successively distinguished as the K values increased from 2 to 7 (Supplementary Fig. 7), while American populations consistently exhibited admixture patterns of genetic structures.
 Fig. 6.
STRUCTURE analyses of the two studied groups and 26 reference populations, with the corresponding pie charts of ancestral information components geographically labeled on the map when K = 3. (A) STRUCTURE analyses of the two studied groups and 26 reference populations based on the 59 InDel loci (K = 2–4). (B) Pie charts of the ancestral information components for the BEB, PJL and the populations from East Asia when K = 3, and each pie chart was labeled to the geographical location of the corresponding population. The open-source map is available in the QGIS Geographic Information System (https://www.qgis.org/). Different colors represented different ancestral information components, among which the red color represented the East Asian ancestral component, the blue color represented the European ancestral information component, and the yellow color represented the African ancestral component. CMI, Chinese Manchu in the Inner Mongolia Autonomous Region; CZY, Chinese Zhuang in Yunnan province; CDX, Chinese Dai in Xishuangbanna; JPT, Japanese in Tokyo; KHV, Kinh in Ho Chi Minh City; CHB, Chinese Beijing Han; CHS, Chinese Southern Han; ACB, African Caribbean in Barbados; ASW, African Ancestry in Southwest USA; MSL, Mende in Sierra Leone; ESN, Esan in Nigeria; YRI, Yoruba in Ibadan; GWD, Gambian in Western Division; LWK, Luhya in Webuye, Kenya; FIN, Finnish in Finland; CEU, Utah residents with Northern and Western European ancestry; GBR, British in England and Scotland; IBS, Iberian populations in Spain; TSI, Toscani in Italy; ITU, Indian Telugu in the UK; PJL, Punjabi in Lahore; STU, Sri Lankan Tamil in the UK; BEB, Bengali in Bangladesh; GIH, Gujarati Indian in Houston; CLM, Colombian in Medellin; PUR, Puerto Rican in Puerto Rico; MXL, Mexican Ancestry in Los Angeles; PEL, Peruvian in Lima; AFR, African populations; SAS, South Asian populations; EUR, European populations; EAS, East Asian populations; AMR, American populations.
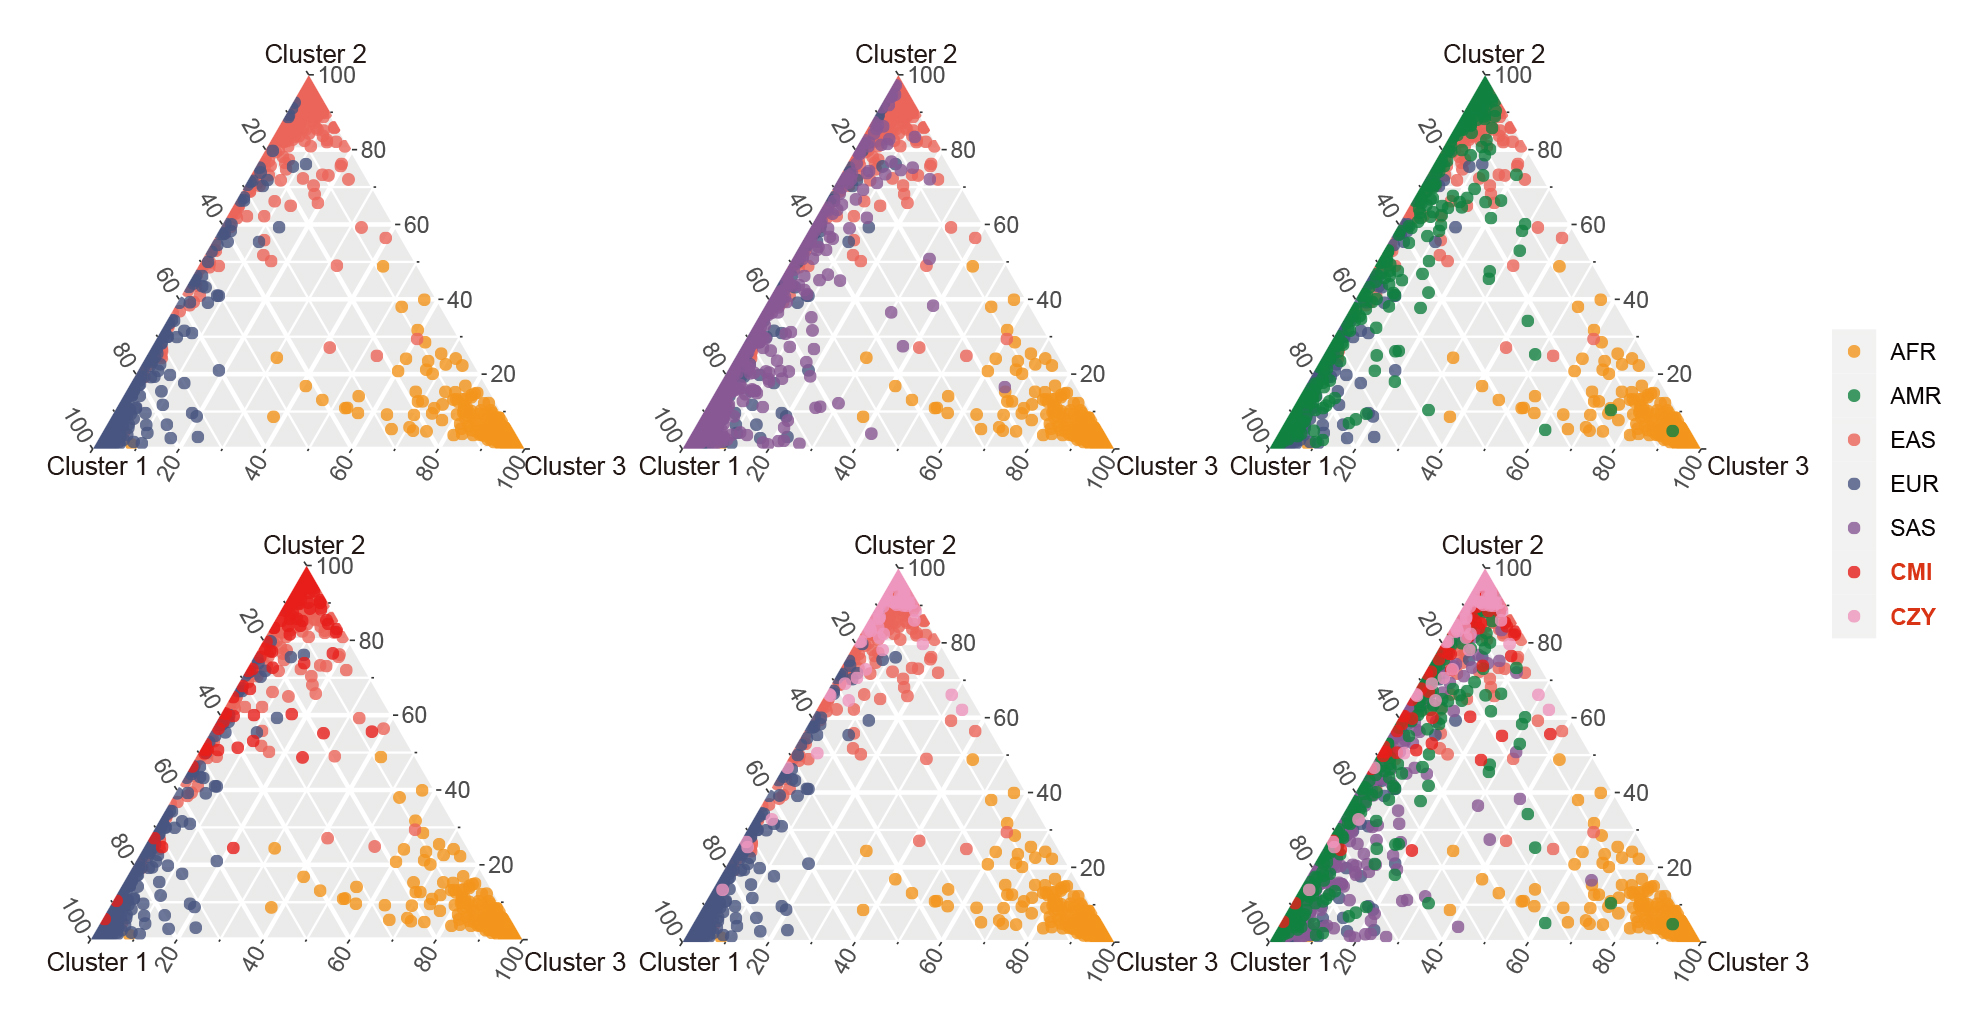
Based on the three clusters of African, East Asian and European populations, a series of ternary plots were made by gradually adding individuals from different continental regions to intuitively discern their ancestral information components when K = 3 (Fig. 7). Most of the individuals from CMI and CZY groups overlapped with East Asian populations, while few individuals distributed along the left edge of the ternary plots, indicating their relatively higher proportions of the European ancestral information component.
 Fig. 7.
Clustering analyses for individual ancestry estimation among the CMI, CZY and the 26 reference populations when K = 3. A series of ternary plots were made by gradually adding individuals from a new population to intuitively discern their ancestral information components when K = 3, with the coordinates of each point representing the proportions of its ancestral information components. AFR, African populations; SAS, South Asian populations; EUR, European populations; EAS, East Asian populations; AMR, American populations; CMI, Chinese Manchu in the Inner Mongolia Autonomous Region; CZY, Chinese Zhuang in Yunnan province.
In the present study, we assessed the genetic polymorphisms of 59 InDels and 2 miniSTRs in the CMI and CZY groups. The detected results showed that all 59 InDels and 2 miniSTRs demonstrated no deviations from HWE and no LDs in the CMI and CZY groups, and most of the 59 InDel loci showed relatively moderate levels of genetic polymorphisms, with PIC values of over 0.36. The additional miniSTRs displayed the highest polymorphisms with PIC values of over 0.65, and their additions further improved the efficiency of the multiplex panel. The CPD and CPE values of the 61 autosomal loci in the CMI and CZY groups were 0.99999999999999999999999999758, 0.99999866; and 0.99999999999999999999999999691, 0.99999880, satisfying the needs for forensic individual identification and paternity testing. Even though the above results indicated that the 64-plex panel could be applied as an effective tool for forensic genetic applications in the two studied groups, more populations are still needed to be included in future research to further confirm the robustness of this panel. However, only 25, 28 loci of the 59 InDels in the CMI and CZY groups displayed the PE and TPI values greater than 0.186 and 1.0. This might eventually lead to the slightly positive skewness in distributions of PE and TPI values in the CMI group, where less than half of the 59 InDels were with above-average efficacies. In fact, their limited efficiencies were inevitably attributed to their diallelic nature. Therefore, future development of InDel panel for complex paternity testing should take multi-allelic InDels into consideration.
Multiple statistics analyses were performed to further survey the effectiveness of the 59 InDel loci for forensic ancestral information inference purpose and reveal the population genetic backgrounds of CMI and CZY groups. The results of the insertion allele frequency heatmap and follow-up cluster analysis indicated that the CMI and CZY groups shared a similar pattern of the allele frequencies distributed equably at approximately 0.5, implying that the 64-plex panel was suitable for forensic individual identification and paternity testing in the two studied groups. As shown in the Supplementary Fig. 2, the loci in the subbranch B-a demonstrated considerable discrepancies in allelic frequency distributions between European populations and African populations, while the loci in branch B-b were lower frequencies in the seven East Asian populations than those in the others. Evident divergences of allele frequency distributions were found among the five continental populations in some loci, such as rs60922184, rs10556197, and rs34731870 from the subbranches A, B-a and B-b (Supplementary Fig. 2), indicating that these loci could be potential markers for ancestral information inference. The results of population differentiation analyses illustrated closer genetic relationships among CMI, CZY groups and other five East Asian populations, especially between CMI and CHB, CZY and KHV groups. The MDS and PCA plots were applied to further visualize the clustering analyses results of the biological-geographic origins at the population and individual levels. Meanwhile, we performed a feature dimension reduction analysis by calculating the cos2 value for each locus, and several promising loci in ancestral information inference were found with cos2 values of over 0.75, including rs60922184 and rs10556197 loci. Even though the NJ tree and the maximum likelihood tree of all 28 intercontinental populations in the TreeMix analysis remained generally consistent, there were a few differences between the topologies of the NJ tree and the unrooted UPGMA tree. As for the UPGMA tree based on allele frequency data, the PEL was located in one of the primary branches. However, for the NJ tree which is constructed by taking into account the effects of evolution rate and genetic drift, the PEL was clustered with MXL on an outer branch, indicating the intimate genetic relationship between the two above-mentioned populations and the better performance of the NJ tree when inferring ancestral information. Interestingly, in the TreeMix analysis performed within East Asian populations, the estimated optimal number of migration events rose to 6, reflecting the smaller geographic scale in this study.
Although CMI and CHB groups belong to different language families, the two
groups still demonstrated a close genetic relationship in multiple statistical
analyses, which was highly consistent with the results of previous population
genetic studies involving the Manchu group and northern Han populations from
Liaoning, Henan and Beijing provinces [15, 19, 20]. With the development of
Chinese society and economy, intermarriages between the above-mentioned groups
have become more common [43], and the Manchu-Han intermarriage rate in Liaoning
province reached 39.3% in the riverside area as early as 2002 [20]. Many
population genetic studies about Chinese Manchu based on Y-SNPs indicated that
the Y chromosome haplogroup C3* and its descendant ‘Manchu cluster’ C3b2a-M48
expanded approximately 1333
In this study, we investigated the forensic characteristics using a self-developed 6-dye 64-plex PCR system comprising 59 InDels, 2 miniSTRs, 2 Y-InDels and an Amelogenin gene, and the population structures of the Chinese Manchu in Inner Mongolia Autonomous Region and Zhuang in Yunnan province. The 64-plex panel could not only meet the demands of forensic individual identification and paternity testing in the CMI and CZY groups but have the preliminary ability to distinguish the African, European, and Asian ancestral information components from the two studied groups and 26 reference populations. In addition, we further explored the genetic backgrounds and relationships of the CMI and CZY groups using the reference population polymorphic data, and the two aforementioned groups were believed to have relatively closer genetic relationships with other reference East Asian populations, especially the CHB and KHV groups. Future population genetic studies involving more populations will provide substantial supports for the enrichment of polymorphic population genetic information resources and further validate the robustness of the self-developed 6-dye 64-plex panel in forensic and population genetic research.
FL and MC both performed the experiment and wrote the original manuscript. FL also analyzed the data and plotted accordingly. BZ designed this study, offered instructions and also revised the manuscript. HX, QL and XB had provided essential helps and suggestions on the frameworks and details of the research. SN collected samples and offered some suggestions when revising the manuscript. All authors contributed to editorial changes in the manuscript revision.
All of the participants included in this research had signed written informed consents before providing samples. This study strictly abided by the Declaration of Helsinki, and the experimental procedure was consistent with the ethical guidelines of the Southern Medical University and Xi’an Jiaotong University Health Science Center. The experiment procedure was also reviewed by the Ethics Committee of Xi’an Jiaotong University Health Science Center (NO. 2019-1039).
Contributions of the participants and peer reviewers to this study are sincerely appreciated.
The study was funded by the National Natural Science Foundation of China (No. 81930055).
The authors declare no conflict of interests.
Publisher’s Note: IMR Press stays neutral with regard to jurisdictional claims in published maps and institutional affiliations.