


1 Research Center, Fourth Hospital of Hebei Medical University, 050011 Shijiazhuang, Hebei, China
2 Department of Oncology, Hebei General Hospital, 050051 Shijiazhuang, Hebei, China
3 Department of Thyroid and Breast Surgery, People’s Hospital of Shijiazhuang City, 050000 Shijiazhuang, Hebei, China
4 Laboratory of Pathology, Hebei Cancer Institute, The Fourth Hospital of Hebei Medical University, 050011 Shijiazhuang, Hebei, China
5 Department of Thoracic Surgery, Fourth Hospital of Hebei Medical University, 050011 Shijiazhuang, Hebei, China
†These authors contributed equally.
Academic Editor: Zhongjie Shi
Abstract
Objective: Abnormal expression of transforming acidic coiled-coil protein 3 (TACC3) has been reported in many types of human malignancies. However, the expression of TACC3 and its clinical significance have not been well characterized in lung carcinoma (LUAD). The aim of this study was to investigate possible associations between tumor expression of TACC3 and the clinicopathological characteristics and prognosis of LUAD patients. Methods: The expression of TACC3 in LUAD patients was determined using the Oncomine, Gene Expression Profiling Interactive Analysis (GEPIA), UALCAN, and Cancer Genome Atlas (TCGA) databases. The expression of TACC3 in LUAD tissues was also determined by qRT-PCR. Results: TACC3 was found to be significantly overexpressed in LUAD tumors compared with non-tumor tissue in the above public databases. Receiver operating characteristic (ROC) curve analysis indicated that TACC3 could have diagnostic value in LUAD patients. Kaplan-Meier analysis further indicated that high TACC3 expression in tumors was significantly associated with worse overall survival (OS) in LUAD patients. In addition, univariate and multivariate Cox regression analyses showed that high TACC3 expression was an independent factor for worse OS in LUAD patients. Finally, based on gene set enrichment analysis (GSEA 3.0), we identified several potential pathways related to TACC3 that were enriched in the high TACC3 expression phenotype. Conclusions: The present study provides evidence that TACC3 expression is upregulated in LUAD and may be an independent risk factor for worse prognosis in these patients.
Keywords
- TACC3
- prognosis
- survival
- outcome
- lung carcinoma (LUAD)
Lung cancer, including mainly small cell lung cancer and non-small cell lung cancer (NSCLC), is the most common malignancy and causes a large number of deaths worldwide [1]. NSCLC includes adenocarcinoma, squamous and large cell lung cancer [2]. The 5-year overall incidence of lung carcinoma (LUAD) in China has remained low for the past 30 years [3]. Surgery, radiotherapy, chemotherapy, and targeted therapies are the first-line treatments for this cancer type. However, the above treatment strategies often have limited efficacy in locally advanced, metastatic and recurrent disease, and hence the treatment of LUAD requires new therapeutic approaches [4]. Exploration of the underlying mechanism of LUAD development and progression is therefore vital for the identification of novel therapeutic strategies.
TACC (transforming acidic coiled-coil protein) family members, including TACC1, TACC2 and TACC3, were first discovered in multiple myeloma [5]. In addition to maintaining centrosome microtubule nucleation and regulating centrosome integrity during mitosis [6], the TACC family has also been implicated in tumorigenesis. Recently, abnormal expression of TACC1 and/or TACC3 was observed in ovarian, breast, melanoma, bladder, NSCLC and prostate cancers [7, 8, 9, 10, 11, 12]. Abnormal expression of TACC2 was also reported in prostate cancer [13], breast carcinoma and hepatocellular carcinoma [14, 15]. Furthermore, fibroblast growth factor (FGFR) 1-TACC1 and FGFR3-TACC3 gene fusions, which are associated with aneuploidy and have oncogenic activities, have been reported in various cancer types [16, 17]. These findings suggest that TACC3 may potentially contribute to tumorigenesis.
Mounting evidence has shown that TACC3 overexpression is associated with tumor aggressiveness and poor prognosis in prostate [8], breast [7], colorectal [9], gastric [10], and human renal cancers [18]. However, the expression status of TACC3 in LUAD remains largely unclear. Here, we investigated the relationship between TACC3 expression and the outcome of LUAD patients using bioinformatic analysis. Our findings indicate that TACC3 could serve as a potential prognostic biomarker in these patients.
Fresh tissue (n = 6) with histologically confirmed cancer was obtained from LUAD patients who had not undergone any prior treatments and who were admitted to the Fourth Hospital of Hebei Medical University.
The Oncomine database is a powerful set of analysis functions that compute gene expression signatures, clusters and gene-set modules, thus automatically extracting biological insights from 715 datasets and 86,733 samples (https://www.oncomine.org/resource/login.html) [19]. The expression levels of TACC3 in LUAD were determined here by Oncomine Database analysis. The following threshold was considered as statistically significant: p = 0.0001, fold change = 1.5, gene rank = all.
GEPIA (http://gepia.cancer-pku.cn/) is a newly developed interactive web server
for analyzing RNA sequence expression data for 9736 tumor and 8587 normal samples
from the TCGA and GTEx projects using a standard processing pipeline [20]. TACC3
expression in LUAD was determined in the single gene expression analysis using
the following thresholds:
UALCAN is a comprehensive and interactive web resource
(http://ualcan.path.uab.edu/index.html)
designed to provide easy access to publicly available cancer OMICS data (TCGA and
MET500), thus facilitating the identification of candidate biomarkers. The
expression of TACC3 and patient survival data were selected from the TCGA
databases, with p
Gene expression and patient data for LUAD were downloaded from Genomic Data commons (GDC) (https://portal.gdc.cancer.gov/) using the GDC data transfer tool. Gene expression data were analyzed by R (version: 3.6.1, Boston, MA, USA) with related R packages. Clinical parameters such as age, gender, survival status, and tumor stage were extracted from the patient data and matched to each patient using the PERL script.
Based on a meta-analysis, the Kaplan Meier plotter (http://kmplot.com/analysis/) is capable of assessing the association of 54,000 genes with patient survival in 21 cancer types [21, 22]. The correlation between TACC3 expression and overall survival (OS) in LUAD, as well as with First Progression (FP), was analyzed using mRNA data. Patients were divided according to the median value, with the cutoff value set as auto select.
To assess the diagnostic value of TACC3, ROC curves were generated using SPSS 26 (IBM SPSS Statistics, Chicago, IL, USA). The AUC was determined and is shown for each panel.
To identify potential mechanisms that underlie the associations of TACC3
expression in LUAD, KEGG analysis was performed to determine whether an a
priori defined set of genes was differentially expressed between high and low
TACC3 expression groups [23]. Gene sets with a normal p-value of
qRT-PCR was performed to determine the expression of TACC3 mRNA. Briefly, total
RNA from the surgically obtained paired (tumor and normal) tissues (n = 6) was
isolated using the TRI Reagent RNA Isolation Reagent (Sigma-Aldrich) according to
the manufacturer’s instructions. The first-strand template complementary DNA
(cDNA) was synthesized using a reverse transcription kit (Takara, Japan). The
primer sequences were as follows: TACC3: 5’-CCTCTTCAAGCGTTTTGAGAAAC-3’ (sense)
and 5’-GCCCTCCTGGGTGATCCTT-3’ (antisense);
All analyses of the TCGA data were conducted using R software (version 3.6.1).
Univariate Cox regression analysis was used to select potential prognostic
factors, and multivariate Cox analysis was performed to determine the correlation
between TACC3 expression and survival, as well as with other clinical features.
Statistical analyses were performed using SPSS 26 (IBM SPSS Statistics, USA),
with p
Clinical data for 467 patients was downloaded from the TCGA database and included age, gender, stage, TMN classification and survival status (Table 1).
| Characteristic | N (%) | |
| Age (years) | ||
| 155 (33.19) | ||
| 312 (66.81) | ||
| Gender | ||
| Female | 254 (54.39) | |
| Male | 213 (45.61) | |
| Stage | ||
| I | 251 (53.75) | |
| II | 108 (21.13) | |
| III | 75 (16.06) | |
| IV | 25 (5.35) | |
| Not available | 8 (3.71) | |
| T classification | ||
| T1 | 162 (34.69) | |
| T2 | 244 (52.25) | |
| T3 | 39 (8.35) | |
| T4 | 19 (4.07) | |
| TX | 3 (0.64) | |
| M classification | ||
| M0 | 314 (67.24) | |
| M1 | 24 (5.14) | |
| MX | 125 (26.77) | |
| Not available | 4 (0.85) | |
| N classification | ||
| N0 | 300 (64.24) | |
| N1 | 87 (18.63) | |
| N2 | 66 (14.13) | |
| N3 | 2 (0.43) | |
| NX | 11 (2.36) | |
| Not available | 1 (0.21) | |
| Survival status | ||
| Deceased | 158 (33.83) | |
| Alive | 309 (66.17) | |
TACC3 mRNA expression in LUAD was determined from the Oncomine, GEPIA and UALCAN databases. The level of TACC3 expression was higher in LUAD tissues compared with normal tissues (Fig. 1A–C). These results were further confirmed by analysis of the TCGA database (p = 2.672e-11, Fig. 1D). In addition, a significant difference in TACC3 expression was observed in a paired comparison of LUAD with adjacent normal tissues (p = 2.343e-15, Fig. 1E). These results demonstrate that TACC3 was highly expressed in LUAD compared with normal tissues.
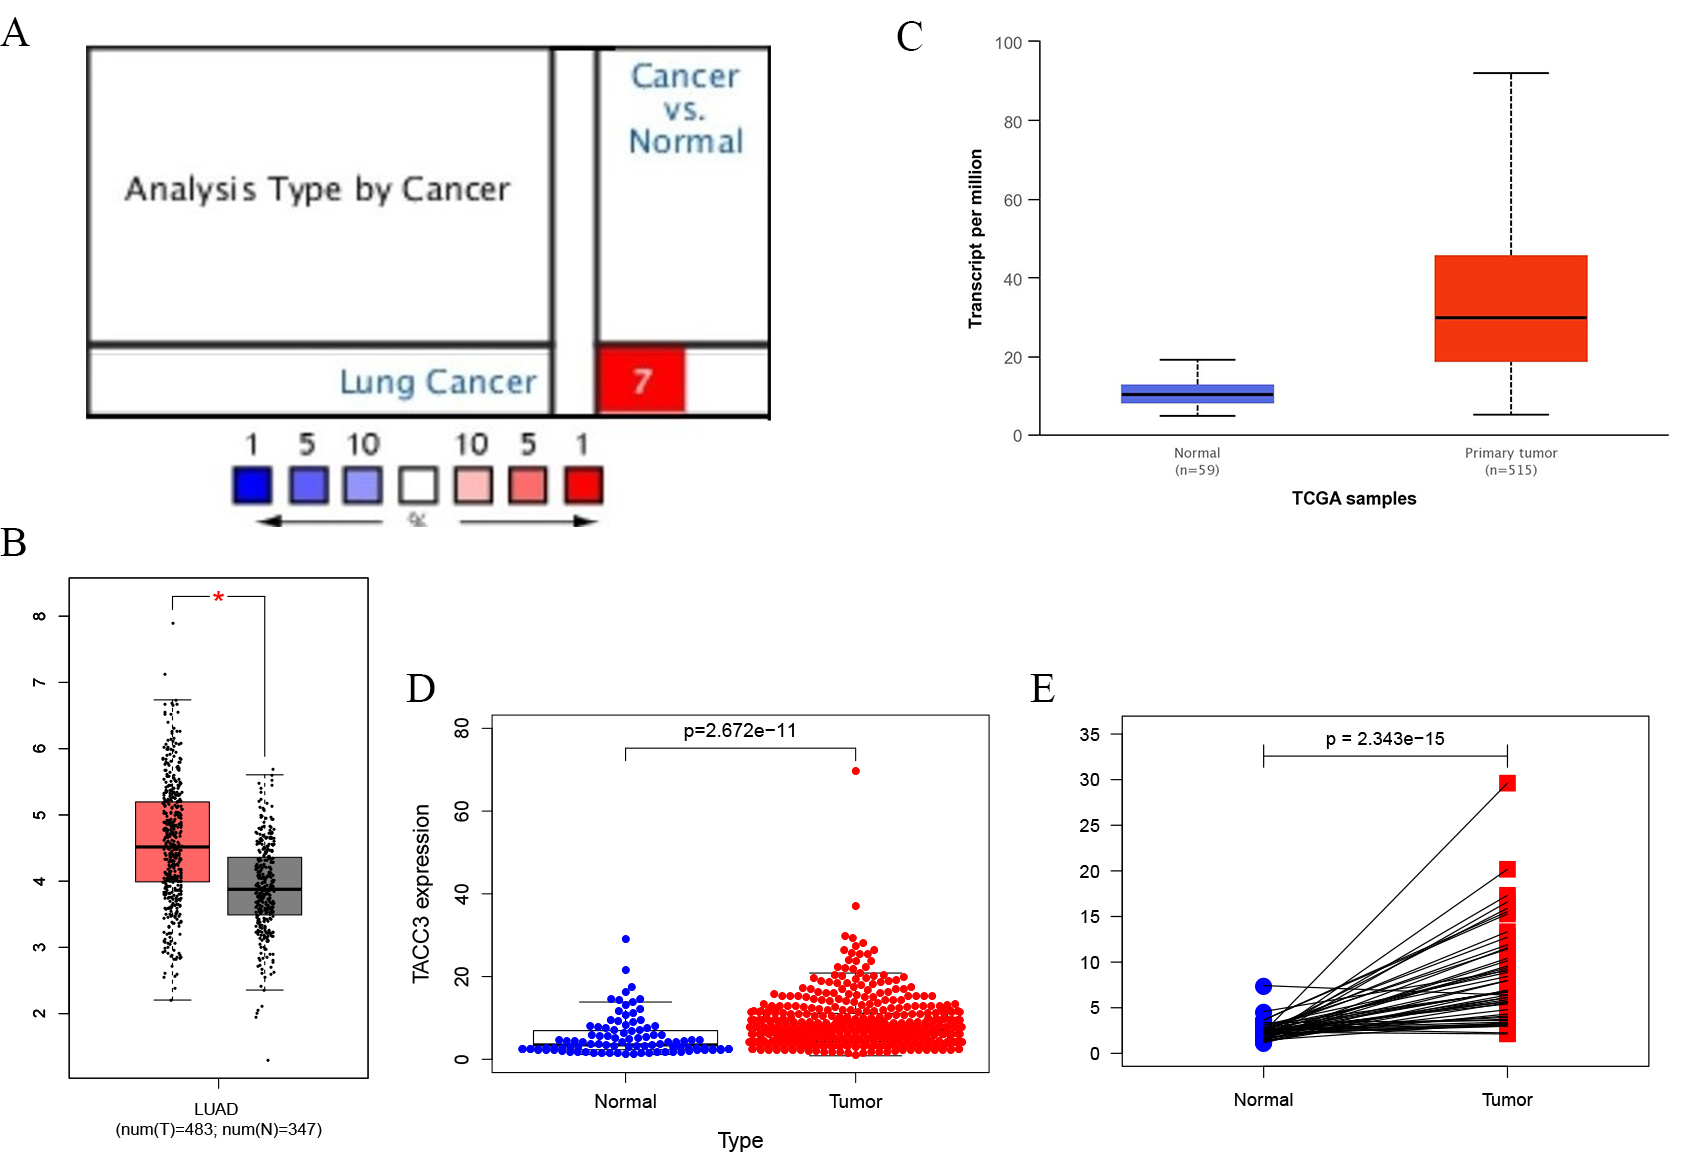 Fig. 1.
TACC3 expression levels in LUAD cancer determined using four
databases. (A) Oncomine database. Cell color is determined by the best gene rank
percentile for the analyses within the cell. (B) GEPIA database. Significant
differences between cancer types are shown in red, p
The prognostic value of TACC3 expression in LUAD patients was determined using
the Kaplan-Meier Plotter, GEPIA, UALCAN, and TACG databases. No significant
difference was observed for disease free survival (DFS) with GEPIA (Log rank
p = 0.05, HR = 1.4; Fig. 2D). However, high TACC3 mRNA expression was
significantly associated with poor OS of LUAD patients in Kaplan-Meier Plotter
(Log rank p = 1.7e-07, HR = 1.88; Fig. 2B), UALCAN (p
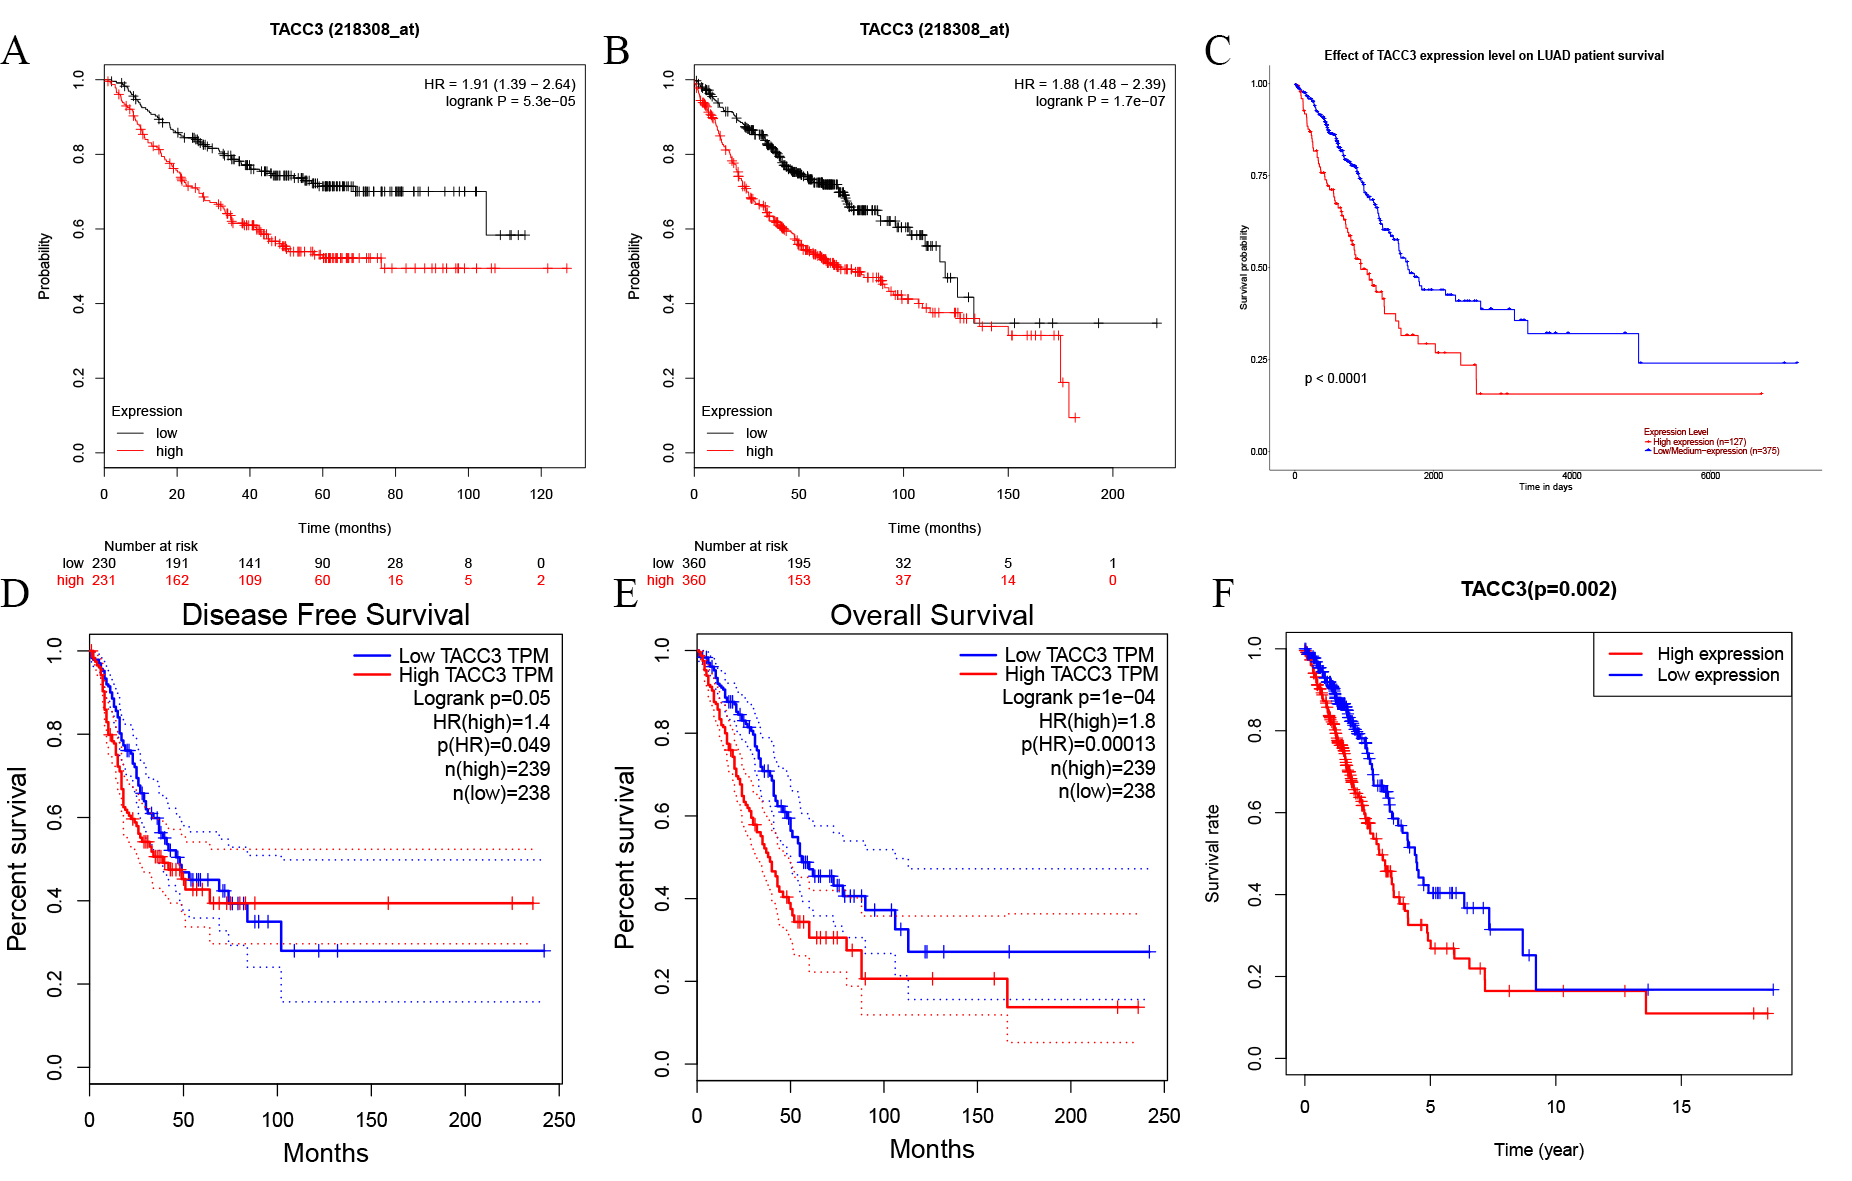 Fig. 2.
Kaplan-Meier survival curves for TACC3 expression in LUAD as determined using four databases. (A,B) OS and RFS from Kaplan-Meier Plotter database. (C,D) OS and DFS from GEPIA database. (E) OS from UALCAN database. (F) OS from TCGA database. OS, Overall Survival; RFS, Relapse-Free Survival; DFS, Disease Free Survival.
The relationship between TACC3 expression and the survival of various clinicopathological subgroups of LUAD patients was determined using Kaplan-Meier plotter. As shown in Table 2, TACC3 mRNA expression was negatively associated with OS in both female and male patients (p = 0.0084, p = 9.1e-4, respectively), as well as in LUAD patients who were smokers (p = 0.008). High expression of TACC3 was also associated with worse OS in stage 1, 3, AJCC stage T1, stage N0, and M0 patients (p = 9.7e-5, p = 0.023, p = 5.2e-4, p = 0.0035 and p = 7.6e-4, respectively). TACC3 expression was also associated with FP in males, non-smokers, and stage 1 LUAD patients (p = 5.1e-4, p = 0.027 and p = 0.0058, respectively). No significant associations were observed between TACC3 expression and the PPS of LUAD patients. These results suggest that TACC3 expression is mainly associated with OS in LUAD patients.
| Clinicopathological characteristics | OS | FP | PPS | |||||||
| N | HR (95% CI) | Log rank p | N | HR (95% CI) | Log rank p | N | HR (95% CI) | Log rank p | ||
| Gender | ||||||||||
| Female | 318 | 1.67 (1.14–2.46) | 0.0084** | 235 | 1.52 (0.96–2.4) | 0.071 | 59 | 1.19 (0.6–2.38) | 0.62 | |
| Male | 344 | 1.75 (1.25–2.44) | 9.1e-4*** | 226 | 2.16 (1.38–3.37) | 5.1e-4*** | 125 | 0.72 (0.38–1.37) | 0.32 | |
| Smoking history | ||||||||||
| Never smoked | 22 | 1.47 (0.2–10.89) | 0.7 | 143 | 2.01 (1.07–3.78) | 0.027* | 41 | 0.62 (0.26–1.48) | 0.27 | |
| Smoked | 246 | 1.91 (1.17–3.11) | 0.008** | 461 | 1.51 (0.97–2.33) | 0.064 | 82 | 0.84 (0.47–1.48) | 0.54 | |
| Stage | ||||||||||
| 1 | 370 | 2.25 (1.48–3.42) | 9.7e-5*** | 283 | 1.99 (1.21–3.27) | 0.0058** | 66 | 1.06 (0.53–2.1) | 0.88 | |
| 2 | 105 | 1.62 (0.93–2.80) | 0.085 | 103 | 0.94 (0.54–1.64) | 0.84 | 38 | 0.52 (0.23–1.15) | 0.099 | |
| 3 | 24 | 3.54 (1.11–11.26) | 0.023* | 10 | - | - | 1 | - | - | |
| 4 | 4 | - | - | 0 | 0 | - | - | |||
| AJCC stage T | ||||||||||
| 1 | 123 | 3.18 (1.6–6.32) | 5.2e-4*** | 47 | 1.56 (0.35–7) | 0.56 | 7 | |||
| 2 | 105 | 1.62 (0.93–2.8) | 0.085 | 93 | 1.62 (0.86–3.06) | 0.13 | 38 | 0.52 (0.23–1.15) | 0.099 | |
| 3 | 4 | - | - | 2 | - | - | 1 | - | - | |
| 4 | 0 | - | - | 0 | - | - | 0 | - | - | |
| AJCC stage N | ||||||||||
| 0 | 184 | 2.07 (1.26–3,4) | 0.0035** | 102 | 1.31 (0.61–2.84) | 0.49 | 25 | 0.73 (0.27–1.95) | 0.53 | |
| 1 | 44 | 1.15 (0.53–2.49) | 0.72 | 38 | 1.24 (0.5–3.06) | 0.65 | 19 | - | - | |
| 2 | 3 | - | - | 2 | - | - | 2 | - | - | |
| AJCC stage M | ||||||||||
| 0 | 231 | 1.99 (1.32–2.99) | 7.6e-4*** | 142 | 1.73 (0.97–3.09) | 0.06 | 46 | 0.62 (0.3–1.28) | 0.19 | |
| 1 | 1 | - | - | 0 | - | - | 0 | - | - | |
| - Sample number too low for meaningful analysis. *p | ||||||||||
ROC analysis was performed to assess the diagnostic value of TACC3 expression in LUAD patients. The observed AUC of 0.940 suggests that TACC3 mRNA expression has strong diagnostic value for LUAD (Fig. 3A). We further examined the diagnostic value of TACC3 in stage I, II, III, and IV LUAD patients (Fig. 3B–E). These showed AUCs of 0.930, 0.956, 0.973, and 0.904, respectively, indicating that TACC3 is a potential diagnostic biomarker for LUAD.
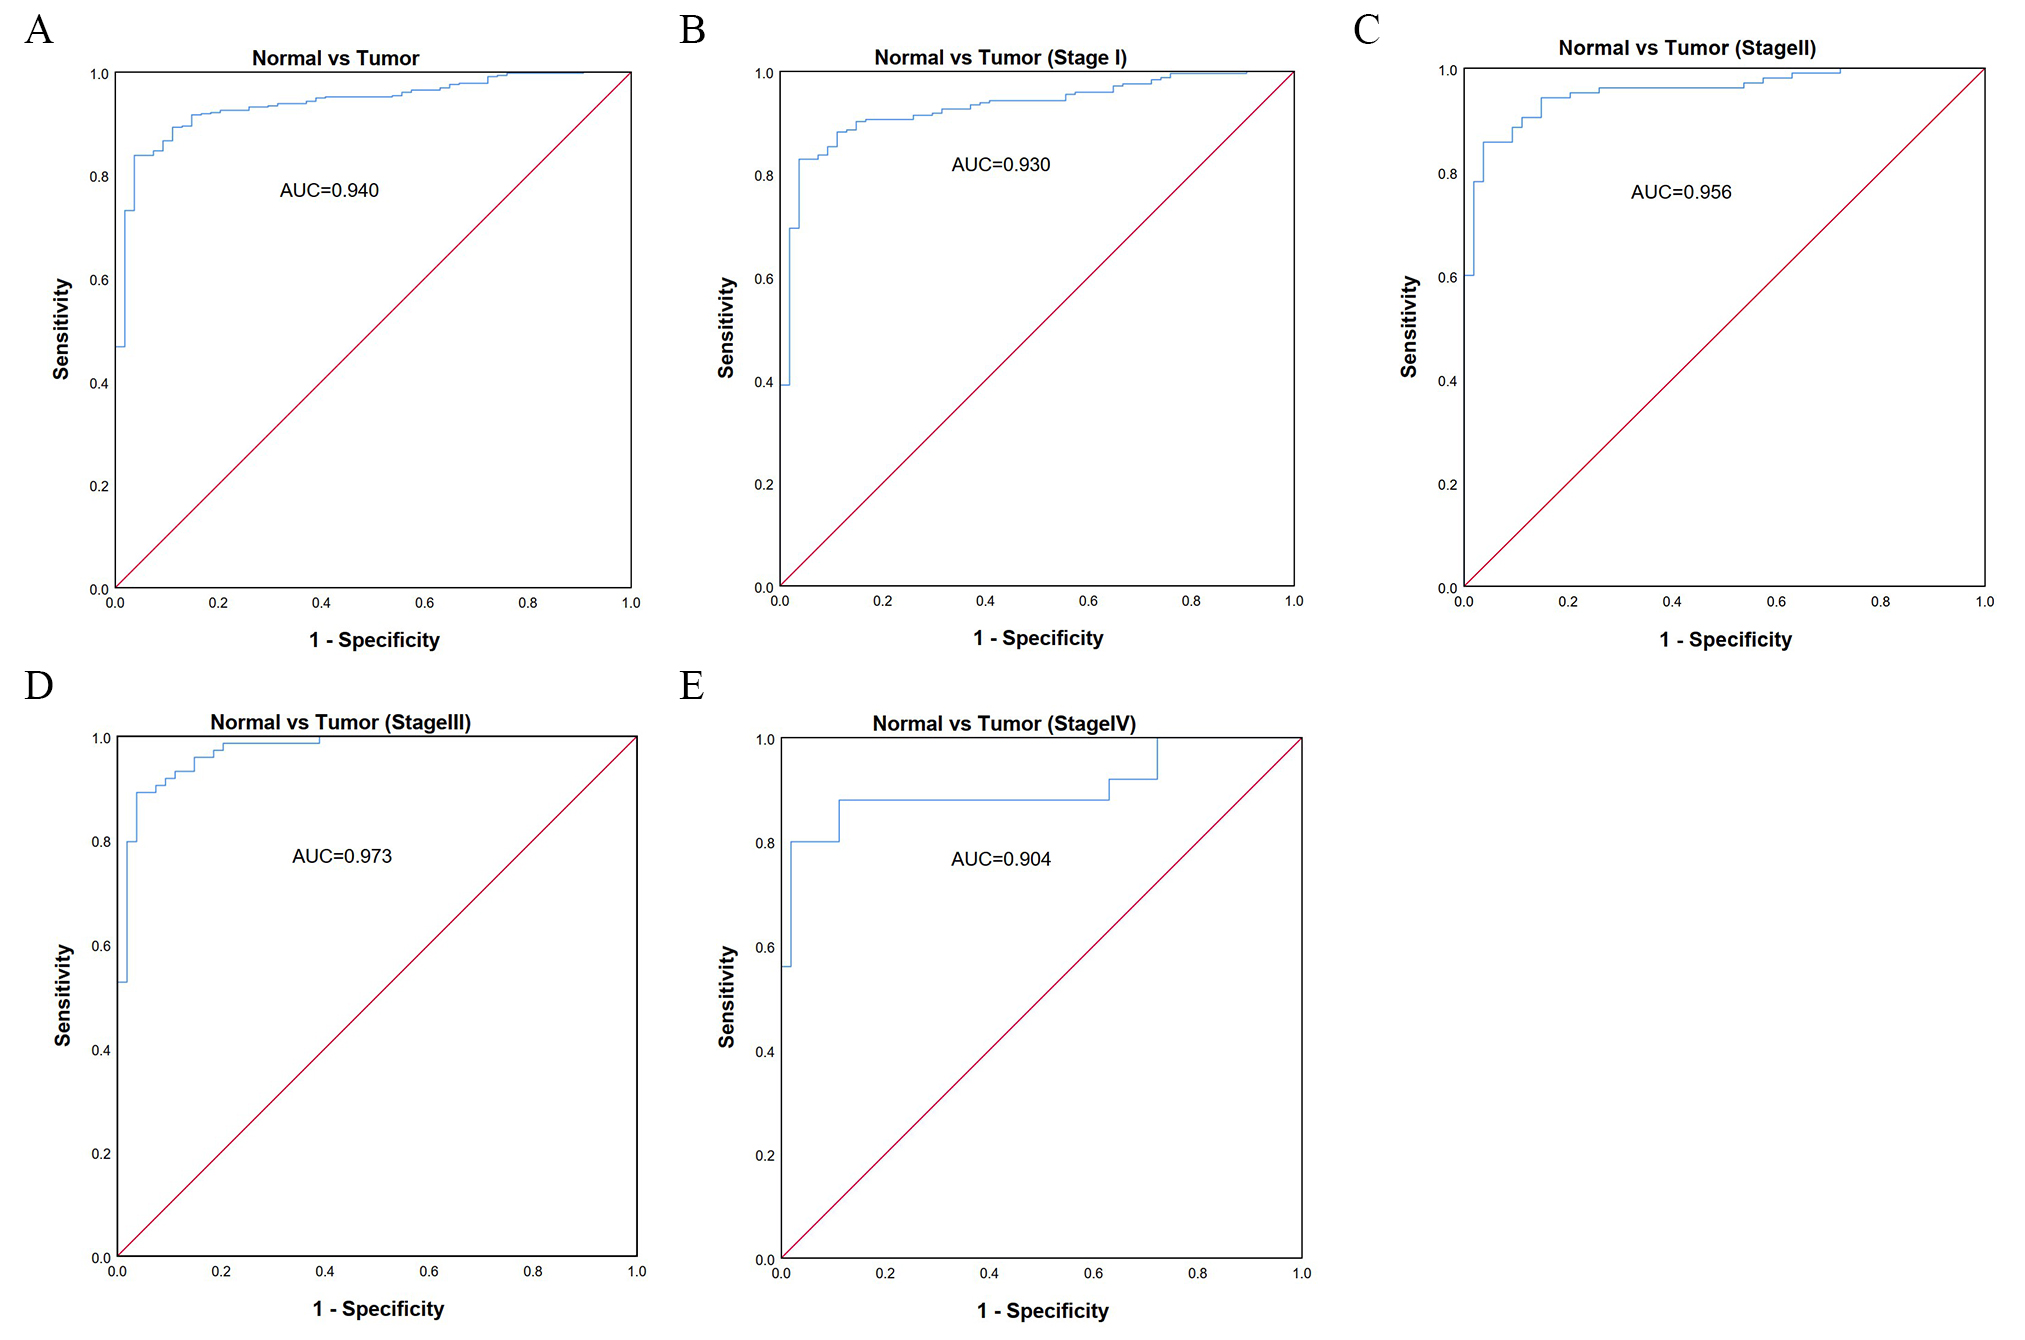 Fig. 3.
Diagnostic value of TACC3 expression in LUAD using ROC analysis. (A) ROC curve for TACC3 mRNA expression in normal and LUAD tissues. (B–E) ROC curves for TACC3 mRNA expression in different stages (I, II, III, IV) of LUAD. All AUCs are shown for each ROC curve. AUC, area under ROC curve.
We next performed univariate and multivariate Cox regression analyses using R
script to determine whether TACC3 expression was an independent risk factor for
OS in LUAD patients. Stage, T and N classification, and TACC3 expression were all
independent risk factors for OS in univariate Cox analysis (p =
3.07e-11, 2.24e-5, 7.17e-9, and 8.23e-3, respectively; Table 3). In multivariate
Cox analysis, only stage and TACC3 expression were identified as independent risk
factors (p = 2.2e-4 and p = 4.1e-4, respectively). These
results indicate that TACC3 expression is an independent risk factor for worse OS
in LUAD patients (HR = 1.43, 95% CI: 1.17– 1.7, p
| Parameter | Univariate analysis | Multivariate analysis | ||||
| p-value | HR | 95% CI | p-value | HR | 95% CI | |
| Age | 1.01 | 1.00–1.03 | 0.15 | |||
| Gender | 1.08 | 0.79–1.49 | 0.62 | |||
| Stage | 1.65 | 1.43–1.92 | 3.07e-11**** | 1.51 | 1.21–1.87 | 2.2e-4*** |
| T classification | 1.53 | 1.26–1.87 | 2.24e-5**** | 1.16 | 0.94–1.44 | 0.15 |
| N classification | 1.70 | 1.42–2.03 | 7.17e-9**** | 1.14 | 0.90–1.46 | 0.28 |
| TACC3 | 1.02 | 1.01–1.04 | 0.00823** | 1.43 | 1.17–1.70 | 4.1e-4*** |
| HR, hazard ratio; CI, confidence interval. **values indicate p | ||||||
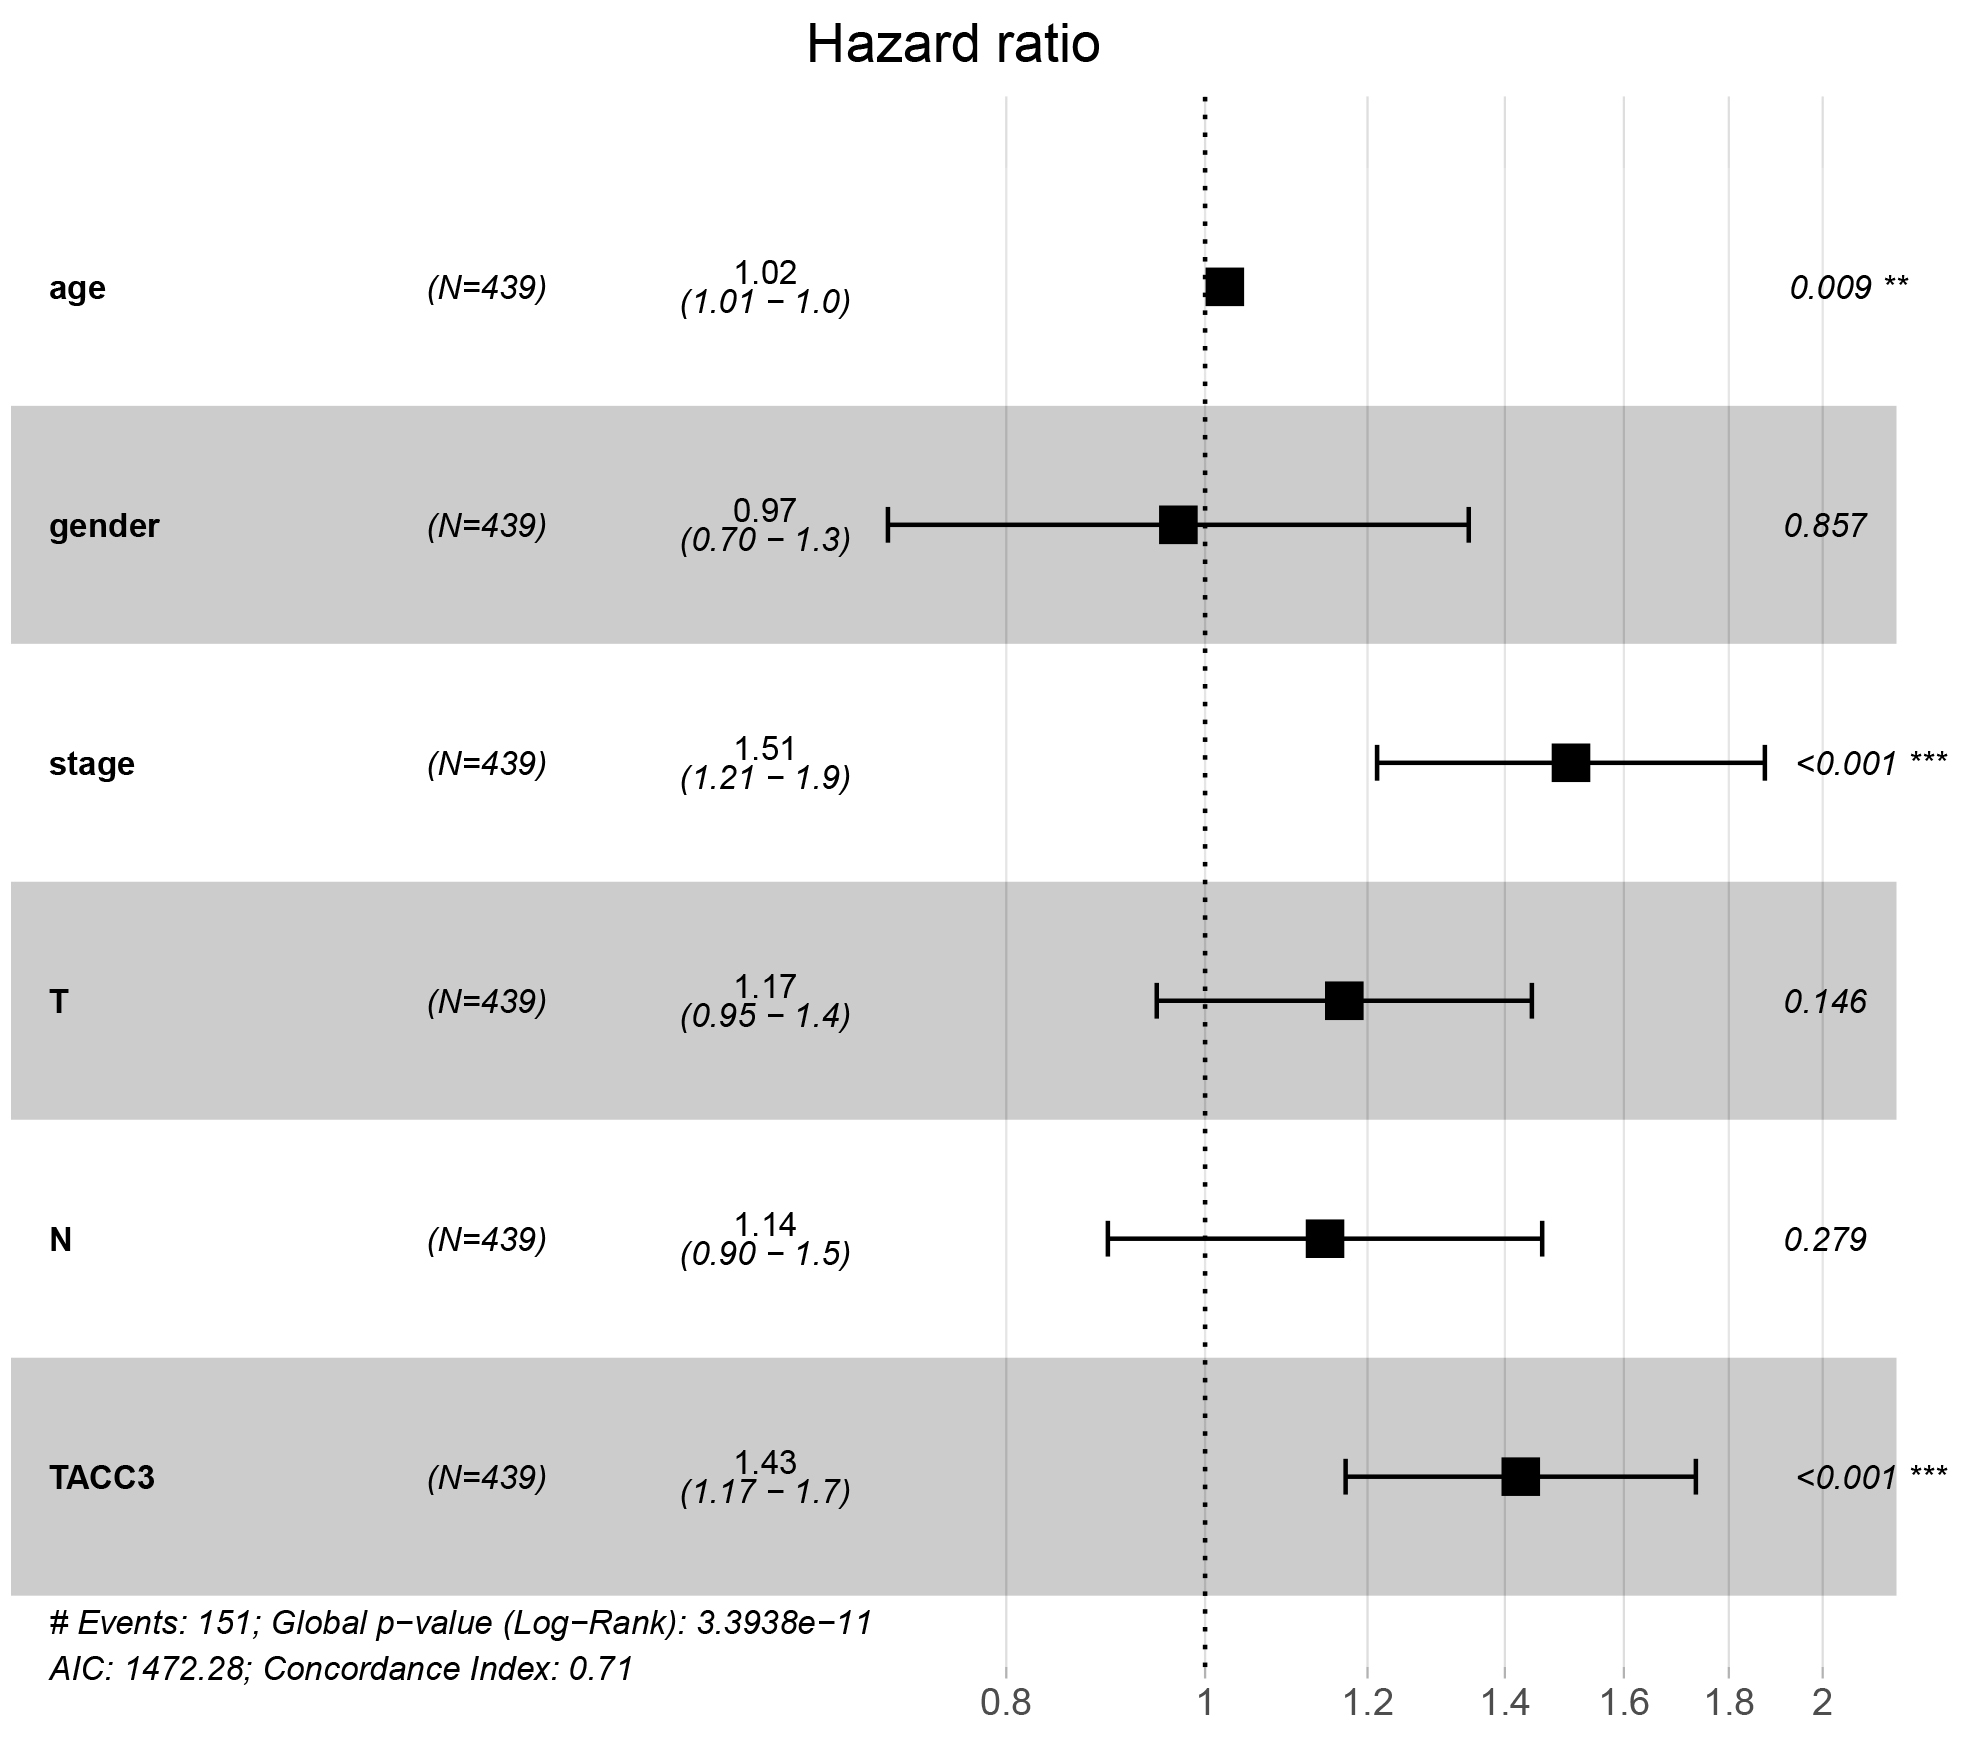 Fig. 4.
Multivariate Cox regression analysis shows that TACC3 is an
independent risk factor for OS among LUAD patients. **p
Real-Time PCR was performed to determine TACC3 mRNA levels in 6 pairs of matched
LUAD tissues and their adjacent non-cancerous tissues. The expression of TACC3
mRNA was upregulated in LUAD cancer tissues compared to adjacent noncancerous
tissues (p
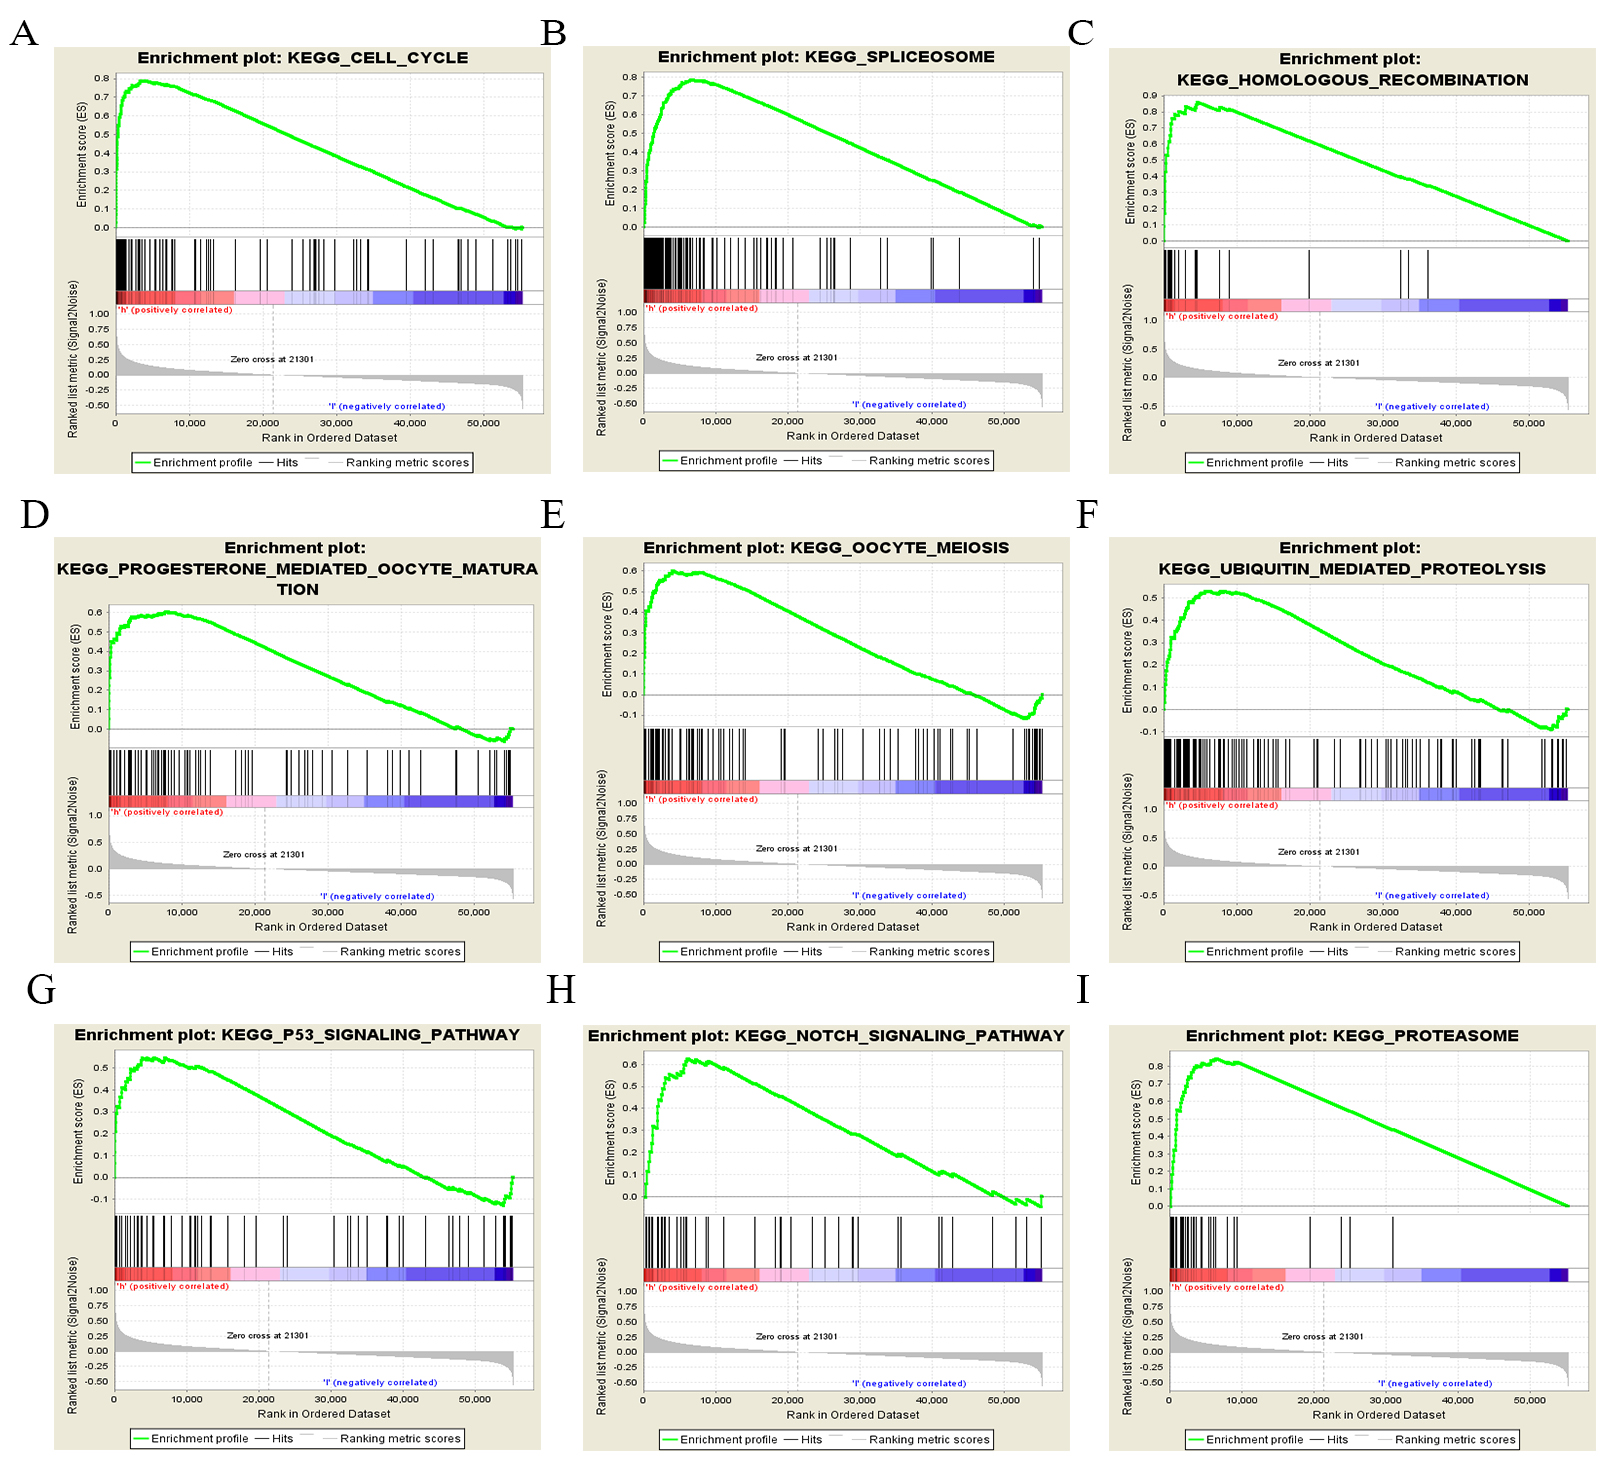 Fig. 5.
Enrichment plots for LUAD cases with high TACC3 expression using GSEA 3.0. GSEA results showing differential enrichment of genes related to various pathways. (A) Cell cycle. (B) Spliceosome. (C) Homologous recombination. (D) Progesterone-mediated oocyte maturation. (E) Oocyte meiosis. (F) Ubiquitin-mediated proteolysis. (G) p53 signaling pathway. (H) Notch signaling pathway. (I) Proteasome.
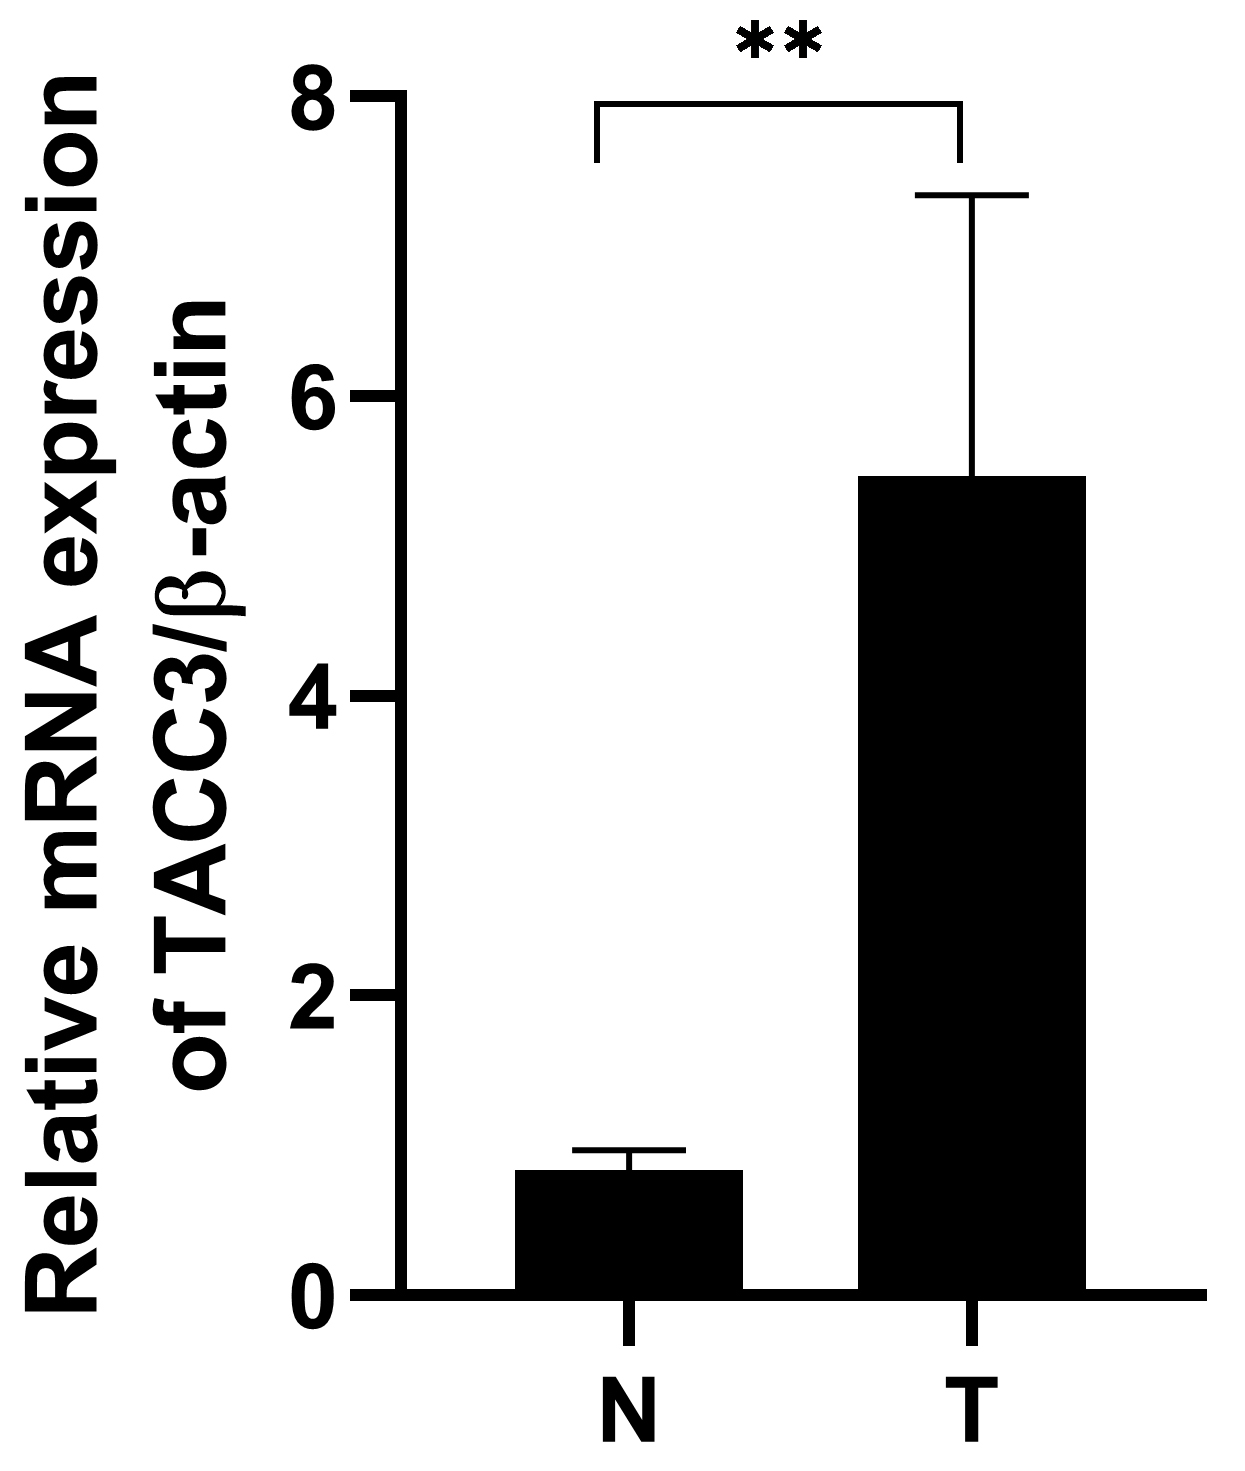 Fig. 6.
TACC3 mRNA expression is upregulated in LUAD tissue compared to
adjacent normal tissue. T: LUAD tissues; N: noncancerous tissues. The results
shown are the mean
Increasing evidence suggests that TACC3 is associated with various types of human cancers, including breast [7, 24, 25], prostate [8], colorectal [9], bladder [26], gastric [10], ovarian [27], melanoma [28], and liver [29] cancers. However, little is known about the expression of TACC3 in LUAD. Recently, genomic alterations in members of the FGFR family were reported in several tumor types including breast, bladder, prostate, and lung cancer. FGFR3-TACC3 fusions have also been identified as novel genomic alterations in LUAD, mostly in patients who were never or limited smokers [16]. These results suggest that TACC3 could play an important role in LUAD progression. The present study demonstrated a significant relationship between TACC3 expression and patient survival in LUAD. This was further validated using Cox regression and ROC curve analyses.
Various databases including Oncomine, TMIER, Kaplan-Meier plotter, GEPIA, UALCAN, and TCGA were analyzed in this study to evaluate the prognostic significance of TACC3 expression in LUAD. Although different databases and methods were used, similar results were obtained. Our study found that abnormally high TACC3 expression in LUAD was associated with the poor survival of these patients, suggesting that TACC3 may play an important role in the progression of LUAD. Univariate and multivariate Cox analyses confirmed that TACC3 expression may be a valuable prognostic biomarker for LUAD, and ROC curve analysis strongly validated the diagnostic value of TACC3 in LUAD.
A growing number of studies have proposed possible mechanisms to explain the relationship between TACC3 expression and patient prognosis in malignant cancers. In cervical cancer, TACC3 may promote the epithelial-mesenchymal transition (EMT) phenotype through activation of the PI3K/AKT and ERK signaling pathways [11]. TACC3 knockdown was also shown to inactivate PI3K/AKT signaling in kidney renal clear cell carcinoma [18]. These studies suggest that TACC3 may promote the EMT phenotype in cancer cells by regulating PI3K/AKT signaling. However, in the current study we found no significant enrichment of PI3K/AKT signaling pathway genes in LUAD using GSEA3.0 software (UC San Diego, CA, USA). This discrepancy may be due to the different materials and raw data, and/or to the different analysis methods used in the present study. More experiments are required to investigate the possible involvement of TACC3 with EMT and PI3K/AKT signaling in LUAD. However, we found that other cancer-associated signaling pathways, including non-small cell lung cancer and small cell lung cancer, as well as other tumor types, were associated with the high TACC3 expression phenotype, indicating that TACC3 may also be involved in other cancer types (Table 4).
| GENE set name | NES | NOM p-val | FDR q-val |
| KEGG_CELL_CYCLE | 2.51 | 0 | 0 |
| KEGG_SPLICEOSOME | 2.47 | 0 | 0 |
| KEGG_HOMOLOGOUS_RECOMBINATION | 2.32 | 0 | 0 |
| KEGG_PROGESTERONE_MEDIATED_OOCYTE_MATURATION | 2.31 | 0 | 0 |
| KEGG_OOCYTE_MEIOSIS | 2.29 | 0 | 0 |
| KEGG_NUCLEOTIDE_EXCISION_REPAIR | 2.25 | 0 | 0 |
| KEGG_PYRIMIDINE_METABOLISM | 2.24 | 0 | 0 |
| KEGG_BASE_EXCISION_REPAIR | 2.22 | 0 | 0 |
| KEGG_MISMATCH_REPAIR | 2.22 | 0 | 0 |
| KEGG_DNA_REPLICATION | 2.18 | 0 | 0.001 |
| KEGG_GLYOXYLATE_AND_DICARBOXYLATE_METABOLISM | 2.18 | 0 | 0.001 |
| KEGG_RNA_DEGRADATION | 2.16 | 0 | 0.001 |
| KEGG_UBIQUITIN_MEDIATED_PROTEOLYSIS | 2.14 | 0 | 0.001 |
| KEGG_P53_SIGNALING_PATHWAY | 2.09 | 0 | 0.003 |
| KEGG_BASAL_TRANSCRIPTION_FACTORS | 2.07 | 0 | 0.003 |
| KEGG_NOTCH_SIGNALING_PATHWAY | 2.07 | 0 | 0.003 |
| KEGG_AMINOACYL_TRNA_BIOSYNTHESIS | 2.07 | 0 | 0.003 |
| KEGG_PROTEASOME | 2.06 | 0 | 0.003 |
| KEGG_PATHOGENIC_ESCHERICHIA_COLI_INFECTION | 2.05 | 0 | 0.003 |
| KEGG_SMALL_CELL_LUNG_CANCER | 2.04 | 0 | 0.003 |
| KEGG_PURINE_METABOLISM | 2 | 0 | 0.006 |
| KEGG_PATHWAYS_IN_CANCER | 1.89 | 0 | 0.016 |
| KEGG_CHRONIC_MYELOID_LEUKEMIA | 2.05 | 0.002 | 0.003 |
| KEGG_CYSTEINE_AND_METHIONINE_METABOLISM | 1.94 | 0.002 | 0.012 |
| KEGG_PANCREATIC_CANCER | 1.93 | 0.002 | 0.012 |
| KEGG_BLADDER_CANCER | 1.93 | 0.002 | 0.012 |
| KEGG_PENTOSE_PHOSPHATE_PATHWAY | 1.93 | 0.002 | 0.012 |
| KEGG_ENDOCYTOSIS | 1.79 | 0.002 | 0.033 |
| KEGG_RENAL_CELL_CARCINOMA | 1.93 | 0.004 | 0.012 |
| KEGG_ONE_CARBON_POOL_BY_FOLATE | 1.92 | 0.004 | 0.012 |
| KEGG_GLIOMA | 1.9 | 0.004 | 0.015 |
| KEGG_N_GLYCAN_BIOSYNTHESIS | 1.86 | 0.006 | 0.019 |
| KEGG_PROSTATE_CANCER | 1.83 | 0.006 | 0.023 |
| KEGG_GAP_JUNCTION | 1.78 | 0.008 | 0.034 |
| KEGG_GLYCOLYSIS_GLUCONEOGENESIS | 1.78 | 0.008 | 0.034 |
| KEGG_CYTOSOLIC_DNA_SENSING_PATHWAY | 1.76 | 0.008 | 0.038 |
| KEGG_LYSINE_DEGRADATION | 1.95 | 0.01 | 0.012 |
| KEGG_GALACTOSE_METABOLISM | 1.72 | 0.01 | 0.045 |
| KEGG_REGULATION_OF_ACTIN_CYTOSKELETON | 1.78 | 0.012 | 0.034 |
| KEGG_NEUROTROPHIN_SIGNALING_PATHWAY | 1.77 | 0.012 | 0.036 |
| KEGG_FC_GAMMA_R_MEDIATED_PHAGOCYTOSIS | 1.84 | 0.015 | 0.023 |
| KEGG_ERBB_SIGNALING_PATHWAY | 1.72 | 0.016 | 0.044 |
| KEGG_NON_SMALL_CELL_LUNG_CANCER | 1.74 | 0.024 | 0.042 |
| KEGG_ACUTE_MYELOID_LEUKEMIA | 1.7 | 0.029 | 0.049 |
| KEGG_RNA_POLYMERASE | 1.7 | 0.033 | 0.049 |
| NES, normalized enrichment score; NOM, nominal; FDR, false discovery rate. Gene
sets with NOM p-value | |||
In conclusion, analysis of the Oncomine and TCGA databases revealed that a high level of TACC3 expression was associated with poor prognosis in LUAD. This result was further verified by Cox regression and ROC analysis. Therefore, TACC3 may be a clinically useful prognostic biomarker in LUAD patients.
XZ, XF and DH designed the studies. XZ, XF, XL, YW and DH wrote the paper. Part of TAGA analysis were performed by YZ, YL, JZ and DH.
The study protocol was approved by the Institutional Research Ethics Committee of the Fourth Hospital of Hebei Medical University. All patients gave informed consent for the study.
Not applicable.
The present study was supported by Natural Science Foundation of Hebei Province (H20206360), Projects from Health and Family Planning Commission of Hebei Province (Grant No. 20190738, 20190007, 20200745 and 20200573).
The authors declare no conflict of interest.
Publisher’s Note: IMR Press stays neutral with regard to jurisdictional claims in published maps and institutional affiliations.