


1 Laboratory Department, Tangshan Maternal and Child Health Care Hospital Affiliated to North China University of Science and Technology, 063000 Tangshan, Hebei, China
Academic Editor: Taeg Kyu Kwon
Abstract
Background: Metabolic activities of tumor cells lead to a depletion of nutrients within the tumor microenvironment, which results in the dysfunction of infiltrating T cells. Here, we explored how glutamine (gln) metabolism, which is essential for biosynthesis and cellular function, can affect the functions of cytotoxic T lymphocytes (CTLs). Methods: Activated CTLs were co-cultured with hepatoma cells. Western blot was used to analyze changes of proteins and ELISA was used to analyze changes of effector. RNA-sequencing was used to detect differentially expressed genes in CTLs. The status of the endoplasmic reticulum (ER) was investigated using transmission electron microscopy experiments. Results: Co-culturing CTLs and hepatoma cells revealed that CTLL-2 cells in the co-culture group expressed high levels of PD-1 (Programmed cell death protein 1), TIM-3 (T cell immunoglobulin and mucin domain-containing protein-3), GRP78 (Glucose regulated protein 78), and P-PERK (phosphorylated protein kinase RNA-activated-like endoplasmic reticulum kinase) and secreted low levels of Granzyme B and perforin. Additionally, the substructure of the ER was severely damaged. When CTLs were treated with an inhibitor of ER stress, their functions were restored. Next, complete medium without Gln was used to culture cells, causing CTLs to display dysfunction and ER stress. WB results revealed decreased expression levels of GLS2 and SLC1A5 (Solute carrier family 1 member 5) in CTLs in the co-culture group. Subsequently, glutaminase (GLS) inhibitors were added to the cultures. As expected, CTLs treated with a GLS2 inhibitor had increased protein content of PD-1 and TIM-3, decreased secretion of Granzyme B and perforin, and an enhanced ER stress response. Conclusions: In summary, CTLs are functionally downregulated induced by hepatoma cells through the Gln-GLS2-ERS pathway.
Keywords
- CTLs
- dysfunction
- glutamine
- GLS2
- endoplasmic reticulum stress
Cytotoxic T lymphocytes (CTLs) are important components of the tumor microenvironment (TME). These immune cells mainly secrete effector molecules such as perforin and granzyme [1] to kill target cells or induce target cell apoptosis through the Fas/FasL pathway [2]. However, the TME can hamper the antitumor immunity of CTLs, including through hypoxia, low nutrition, immunosuppressive cytokines, and immunosuppressive cells [3]. Among these, nutritional deficiency has been shown to suppress CTL-mediated antitumor responses, such as glucose deficiency [4]. However, the specific metabolic mechanisms that regulate the function of CTLs remain to be explored.
The endoplasmic reticulum (ER) is the main site of protein synthesis and
folding, maintaining Ca
Any factor that causes an increased secretory load of proteins and the presence of mutant proteins under pathological conditions can induce the ER stress response. The main factors include undernutrition [9], hypoxia [10], viral infection [11], and accumulation of reactive oxygen species [12]. The deprivation of nutrients such as amino acids [13] and glucose [11, 14] and the study of ER function have gradually attracted attention in the field. Glutamine (Gln) is the most abundant free amino acid in serum and is an essential nutrient for cells [15]. In tumor cells, Gln deficiency can induce ER stress [16]. Whether Gln can regulate the ER processes of tumor-infiltrating CTLs is still unclear.
In this study, we therefore investigated if Gln can regulate CTL functions through the ER stress pathway to clarify the relationship between the Gln metabolism pathway and CTL dysfunction, as well as to explore new metabolic pathways.
Hepa1-6 cells (American Type Culture Collection (ATCC)) and Huh-7 cells (ATCC)
were cultured in buffered Dulbecco’s modified eagle medium (DMEM, C11995500,
Gibco, China). CTLL-2 cells (359785, BeNa Culture Collection (BNCC), China) and
CD8
4-Phenylbutyric acid (4-PBA) (P21005) was obtained from Sigma-Aldrich (Germany). Glutaminase C-IN-1/Compound 968 (HY-12682) and Telaglenastat/CB-839 (HY-12248) were purchased from MedChemExpress (MCE) (USA). DMSO (D8371) was obtained from Solarbio (China).
The primary antibodies included anti-Glutaminase (M01272-3, Boster Biological Technology, 1:1000, China), anti-GLS2 (A05334-1, Boster Biological Technology, 1:800, China), SLC1A5 (AF6610, Affinity Biosciences, 1:1000, USA), GRP78 (AF5366, Affinity Biosciences, 1:1000, USA), Phospho-PERK/Thr982 (DF7576, Affinity Biosciences, 1:1000, USA), PERK (ab229912, abcam, 1:1000, UK), PD-1 (ab214421, abcam, 1:1000, UK), TIM-3/D3M9R (83882, Cell Signaling Technology, 1:1000, USA), and anti-GAPDH (BM1623, Boster Biological Technology, 1:5000, China). The Goat anti-rabbit IgG secondary antibody (BA1054, 1:10,000) was obtained from Boster Biological Technology (China).
Co-cultures were performed in 6-well plates coated with poly-2-hydroxyethyl
methacrylate (poly-Hema) (TCS011006, JET, China). In 6-well plates, 1.5
Normal human peripheral blood was obtained from healthy volunteer donors with
informed consent. Peripheral blood mononuclear cells (PBMCs) were obtained from
these samples by centrifugation (800
Total RNA was extracted from CD8
Cell culture supernatants were collected from each group and were then
centrifuged for 20 min at 1000
The Gln content (EGLN003, BioAssay Systems, USA) in the supernatant
(ELx800
Cells in each group were digested to prepare 1
Cells were harvested and lysed with protein sample loading buffer (1
The data was represented as the Mean
We previously found that a large number of CTLs can infiltrate liver cancer tissues. To clarify whether hepatoma cells can regulate the function of CTLs, we co-cultured CTLL-2 (CTLs) cells with Hepa1-6 (hepatoma) cells. Compared with cells in other groups, CTLL-2 cells co-cultured with Hepa1-6 cells expressed high levels of PD-1 and TIM-3 and secreted low levels of Granzyme B and perforin (Fig. 1). High expression of immune checkpoint-related proteins and low secretion of effector molecules suggested that Hepa1-6 cells can induce a functional downregulation of CTLL-2 cells.
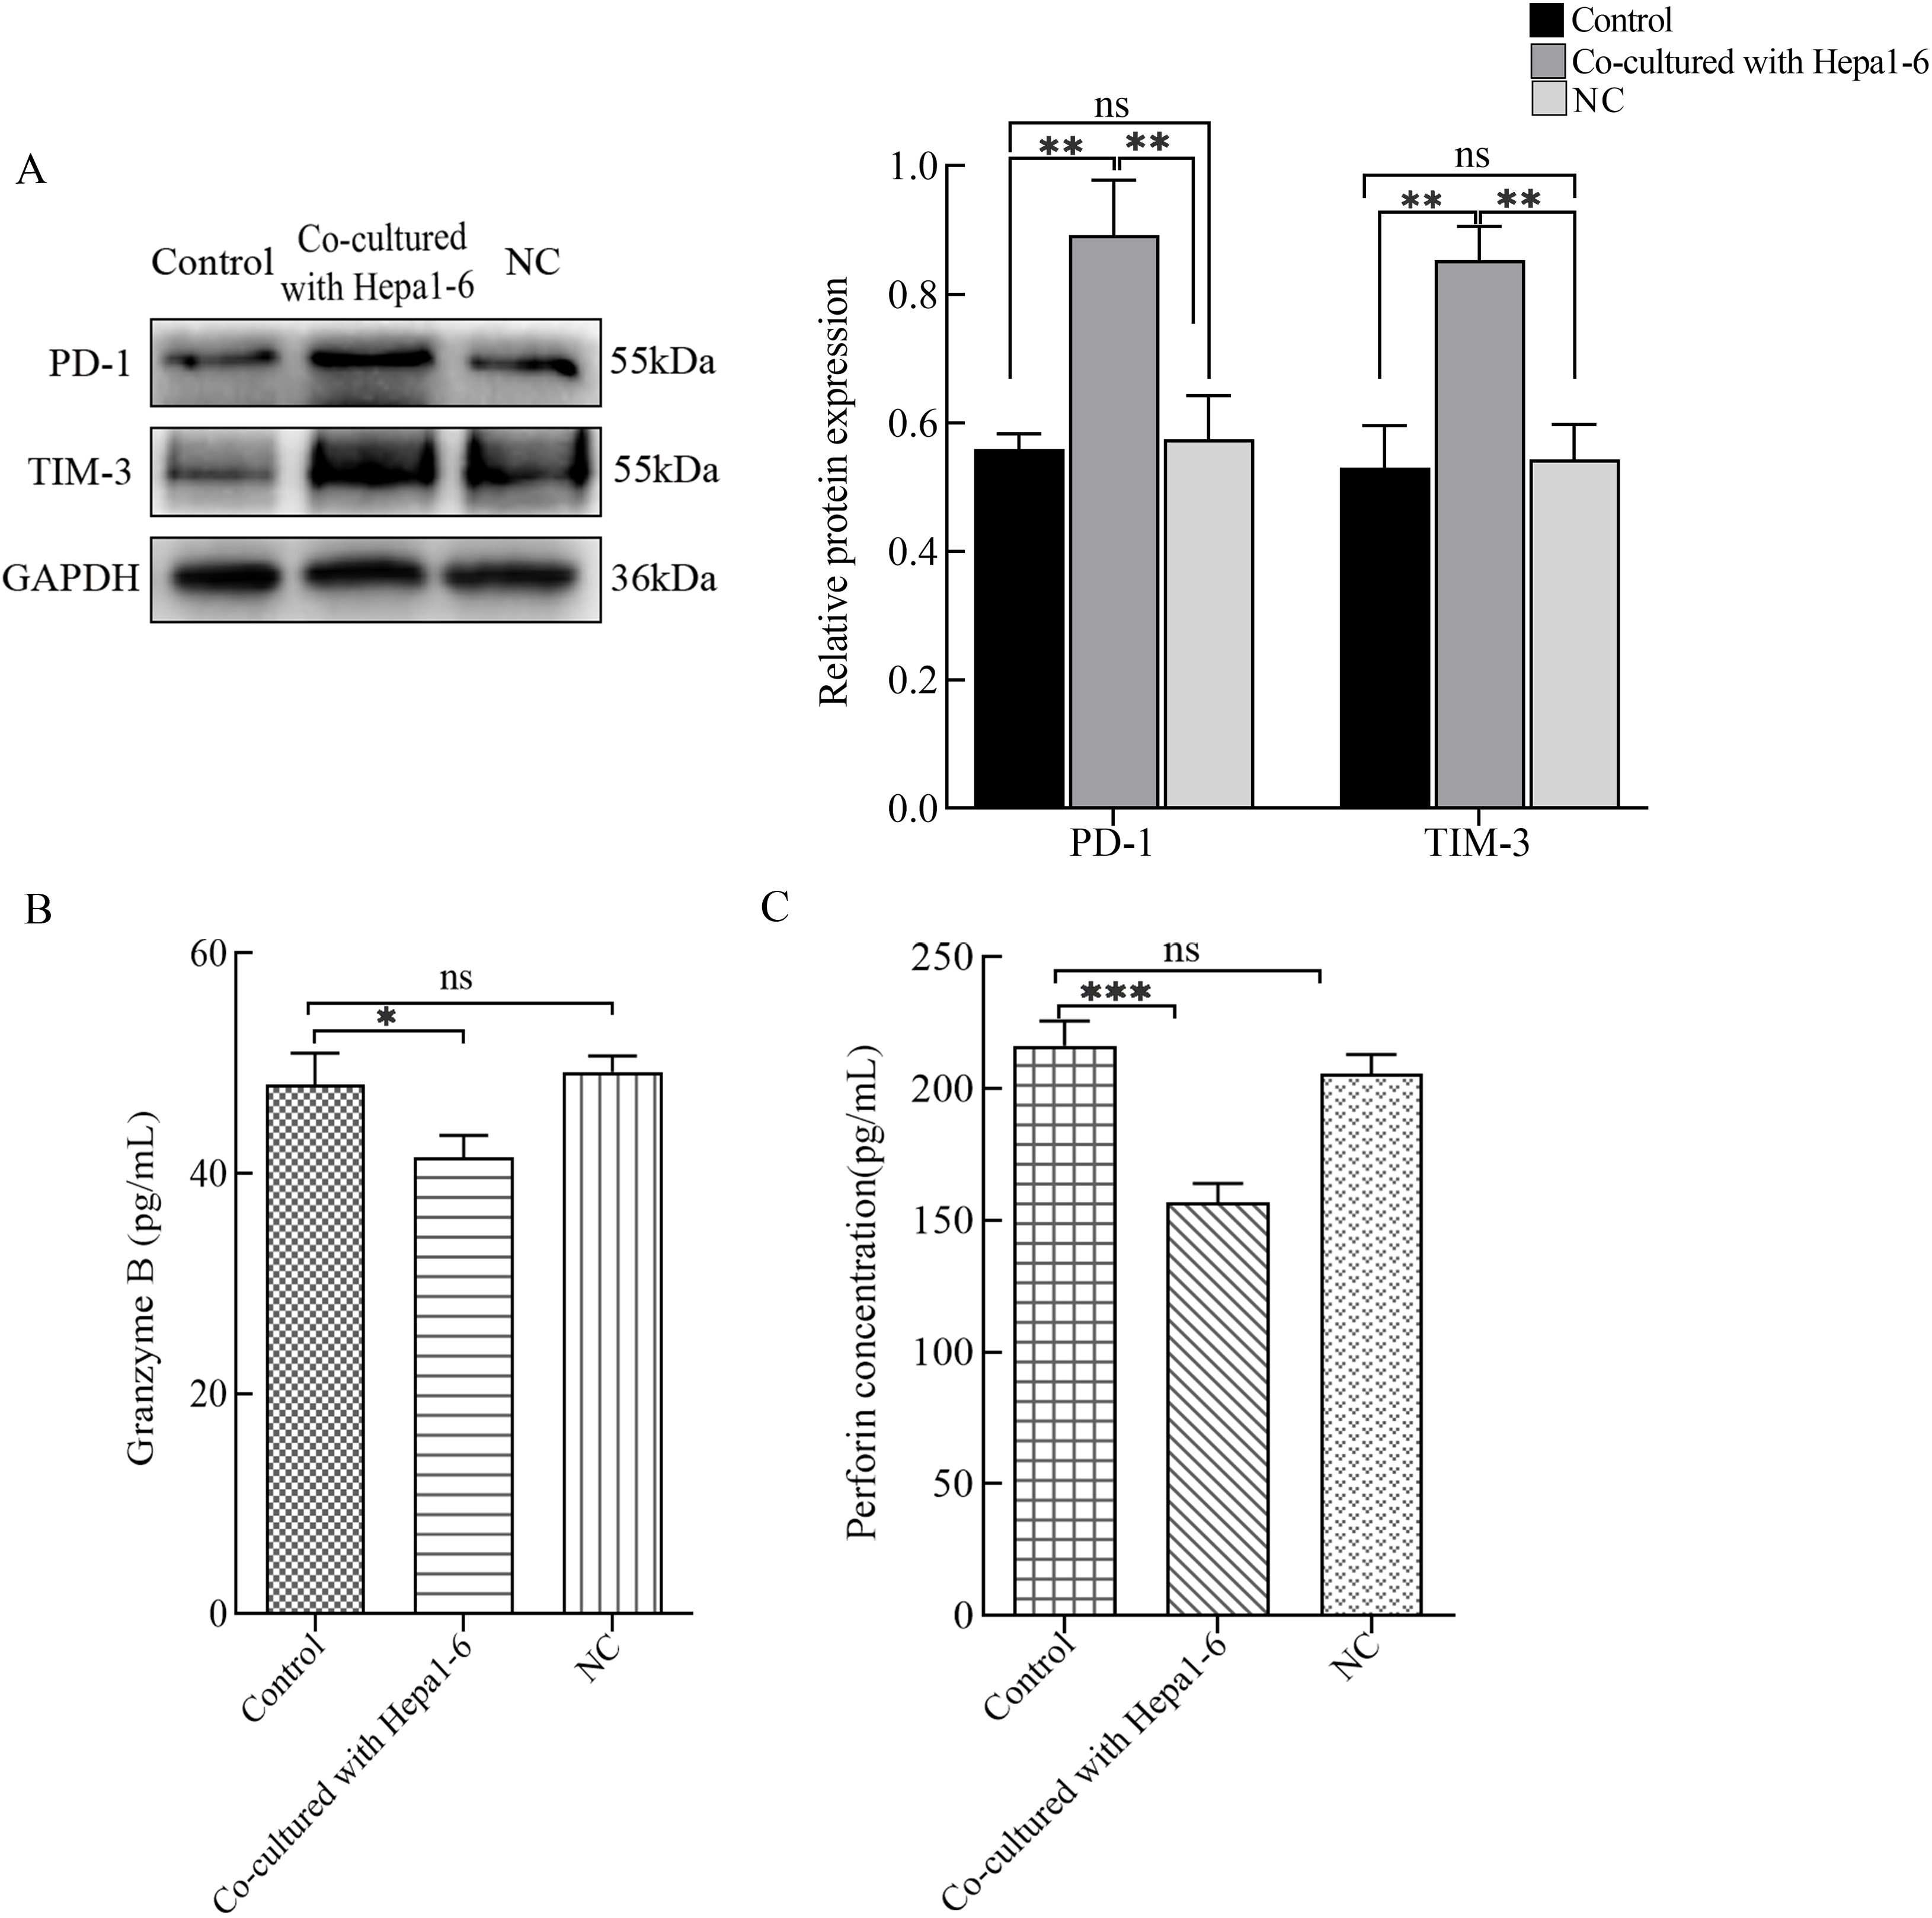 Fig. 1.
Detection of cytotoxic T lymphocyte (CTL) functions. Hepatoma
cells and CTLs were co-cultured. (A) Western blots were used to detect the
protein expression levels of PD-1 and TIM-3. The levels of (B) Granzyme B and (C)
perforin in the cell culture supernatants were assessed by enzyme-linked
immunosorbent assays (ELISAs). *p
To investigate the functional changes of CTLs, we performed RNA-Seq on CD8
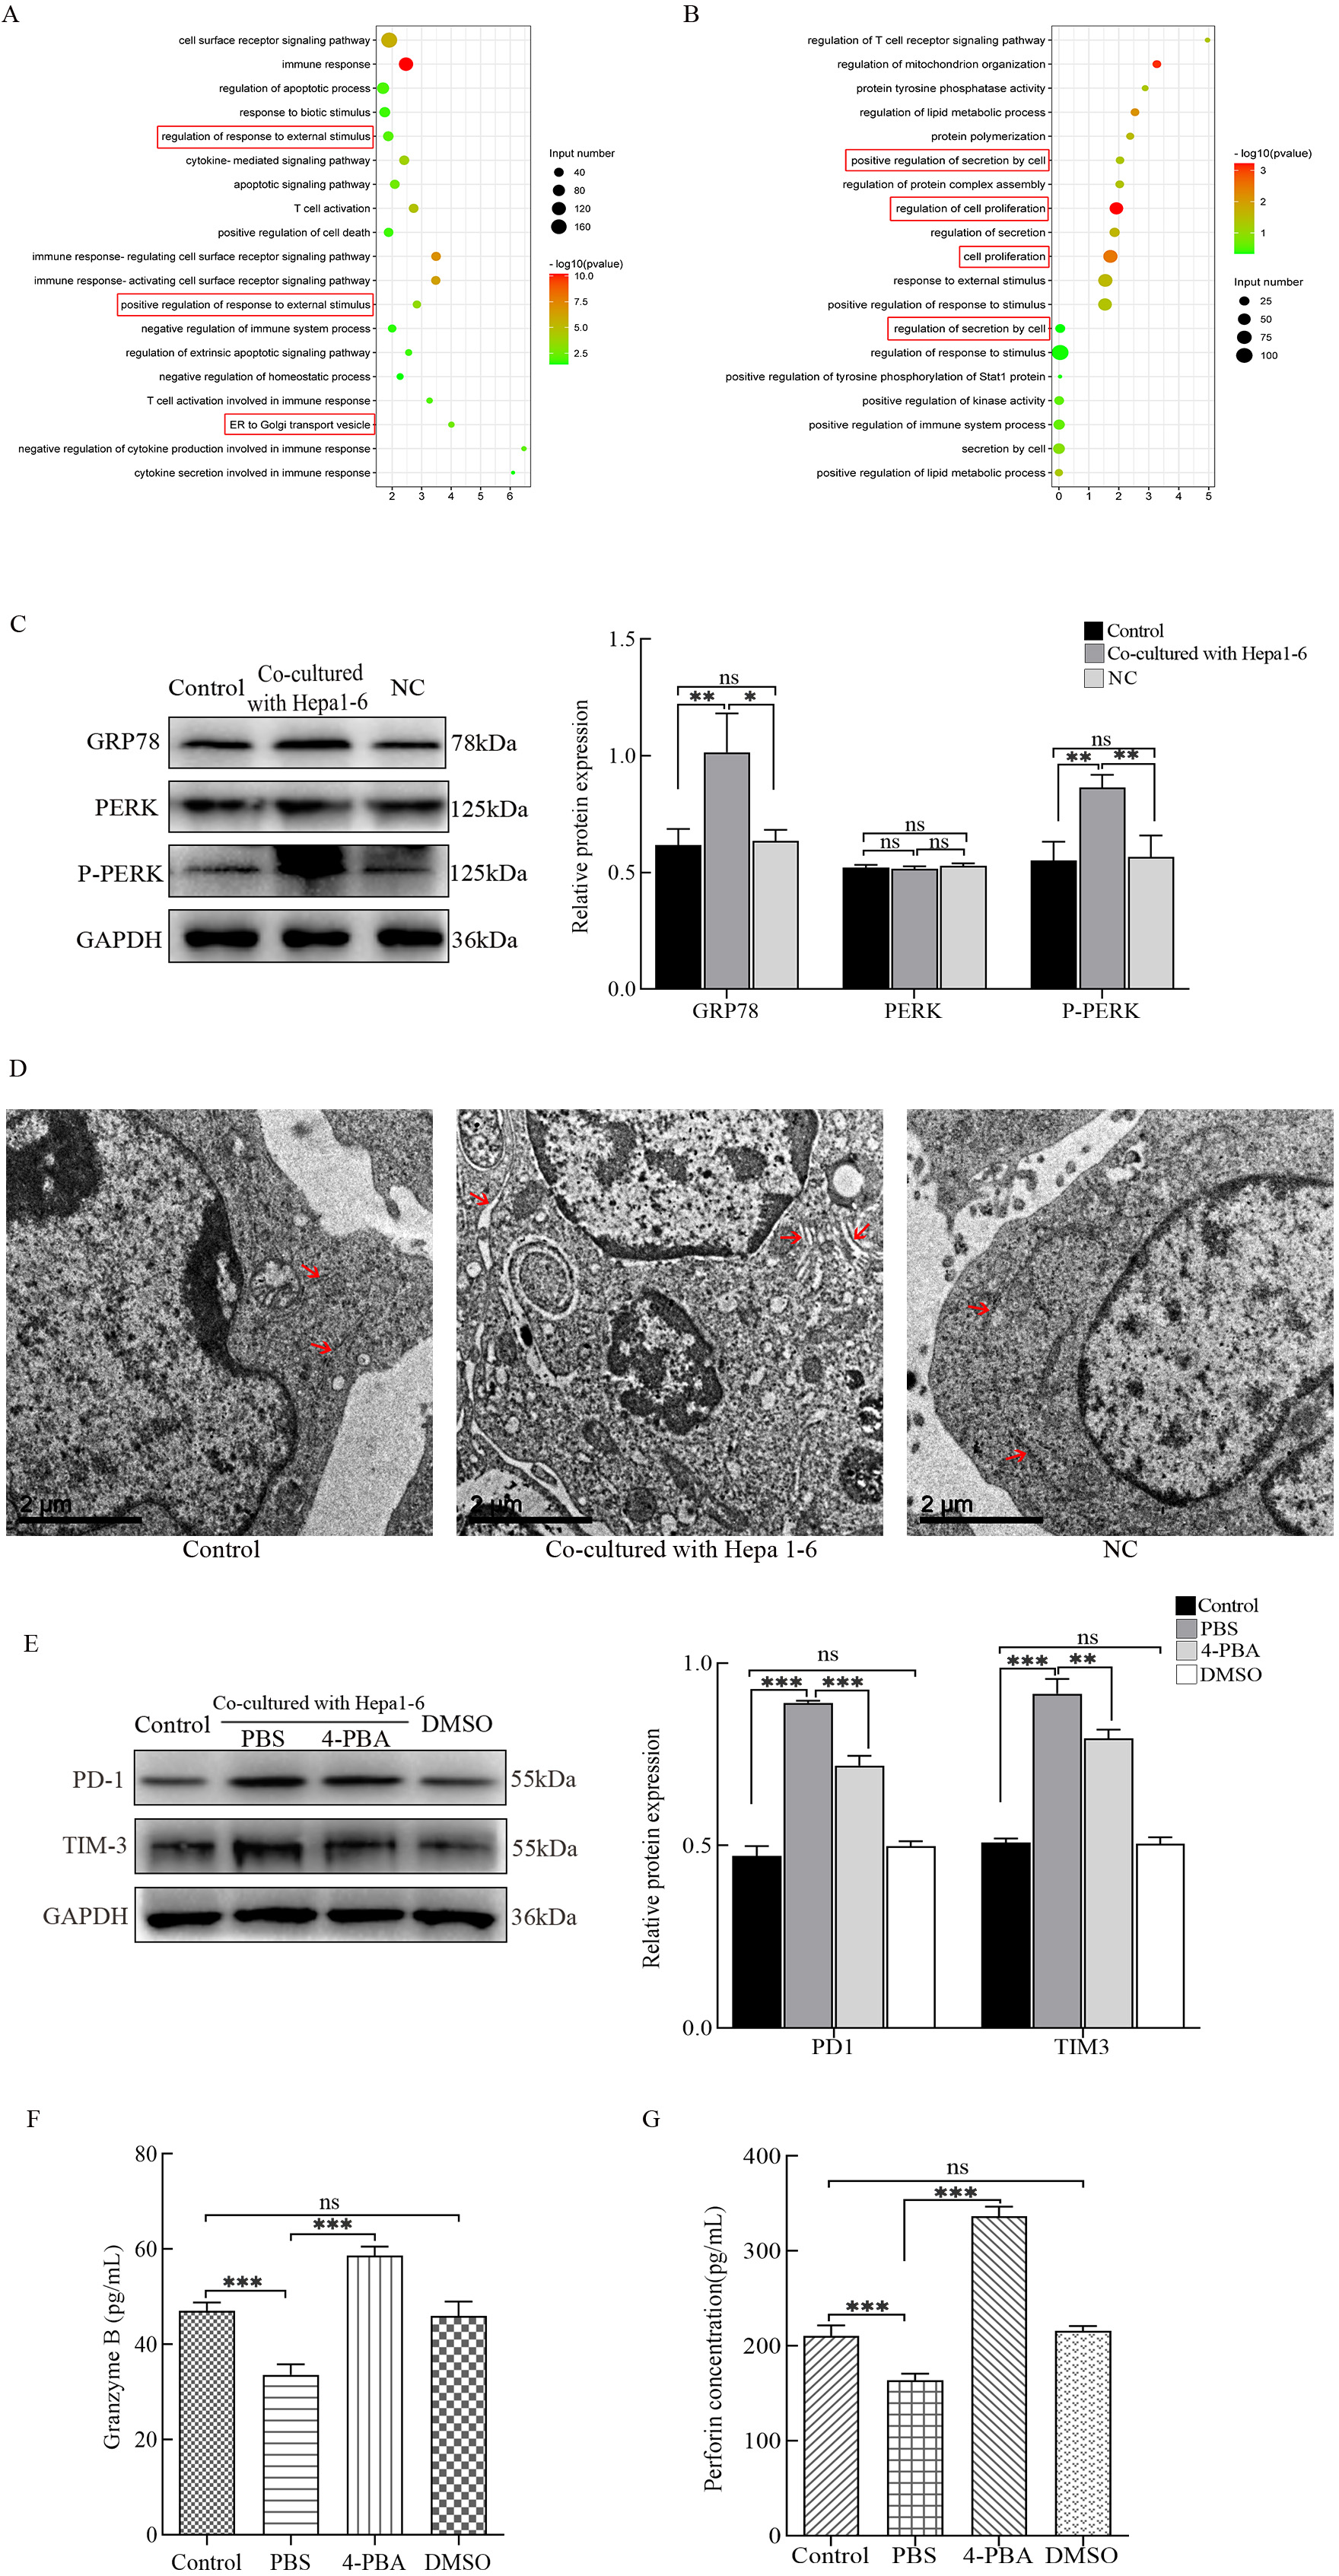 Fig. 2.
Detection of endoplasmic reticulum (ER) stress and its effects
on cytotoxic T lymphocyte (CTL) functions. RNA-seq was used to detect
differentially expressed genes in hepatocarcinoma-infiltrating CTLs. (A) Gene
ontology (GO) Enrichment Plot of upregulated genes. (B) GO Enrichment Plot of
downregulated genes. (C) The protein expression levels of GRP78, PERK, and P-PERK
in CTLs were detected by western blots. (D) Morphological changes of the ER were
observed by transmission electron microscopy. (E) Protein levels of PD-1 and
TIM-3 in CTLs cultured with 4-PBA were analyzed using western blots. The secreted
levels of (F) Granzyme B and (G) perforin in CTLs cultured with 4-PBA were
assessed by enzyme-linked immunosorbent assays (ELISAs). *p
Next, we determined if hepatoma cells have any regulatory effects on the ER of CTLL-2 cells. The status of the ER in different groups was analyzed using western blots by detecting the expression of ER stress-related proteins. In contrast to the other groups, GRP78 and P-PERK protein expression levels were significantly upregulated in CTLL-2 cells co-cultured with Hepa1-6 cells (Fig. 2C). Secondly, the substructure of the ER was observed using TEM. The substructure of the ER in the control and NC groups were arranged in order and continuously. The substructure of the ER in the co-culture group was severely damaged, showing gross expansion and degranulation (Fig. 2D). These results show that hepatoma cells can induce CTLs to undergo ER stress.
Based on the role of ER stress in cellular function, we investigated whether ER stress was involved in the hepatoma cell-induced dysfunction of CTLL-2 cells. 4-PBA, an inhibitor of ER stress, was added to the co-culture system. The results showed that after 4-PBA intervention, the expression levels of PD-1 and TIM-3 were downregulated (Fig. 2E), while the secretion of Granzyme B (Fig. 2F) and perforin (Fig. 2G) were increased. Taken together, these data suggest that ER stress is involved in the hepatoma cell-mediated inhibition of CTL functions.
The RNA-Seq results (Fig. 2A) showed that genes related to the amino acid stimulation response were upregulated in CTLs after co-culture with hepatoma cells (Fig. 2A), while Gln is essential for cell metabolic and cellular proliferation. Therefore, we hypothesized that Gln is involved in the process by which hepatoma cells inhibit CTL functions. To examine this, we measured the Gln concentration in each group. The data indicate that cells in the co-culture group consumed more Gln (Fig. 3A). Next, we cultured CTLL-2 cells using Gln-free medium. The results show that CTLs in the group lacking Gln had increased expression levels of PD-1 and TIM-3 (Fig. 3B) and decreased secretion of Granzyme B and perforin (Fig. 3C,D). These data demonstrate that CTL functions are impaired following Gln deprivation. Finally, we examined the state of the ER. When cultured without Gln, there were elevated protein expression levels of GRP78 and P-PERK (Fig. 3E), as well as swollen ER (Fig. 3F). This suggests that ER stress has occurred. However, when 4-PBA was added to the medium when Gln was deprived, the expression levels of GRP78 and P-PERK were not significantly different from those of the control group. Additionally, no significant ER swelling was observed with these conditions. Overall, hepatoma cells compete with CTLs for Gln availability. Gln deficiency inhibited the function of CTLs and induced ER stress.
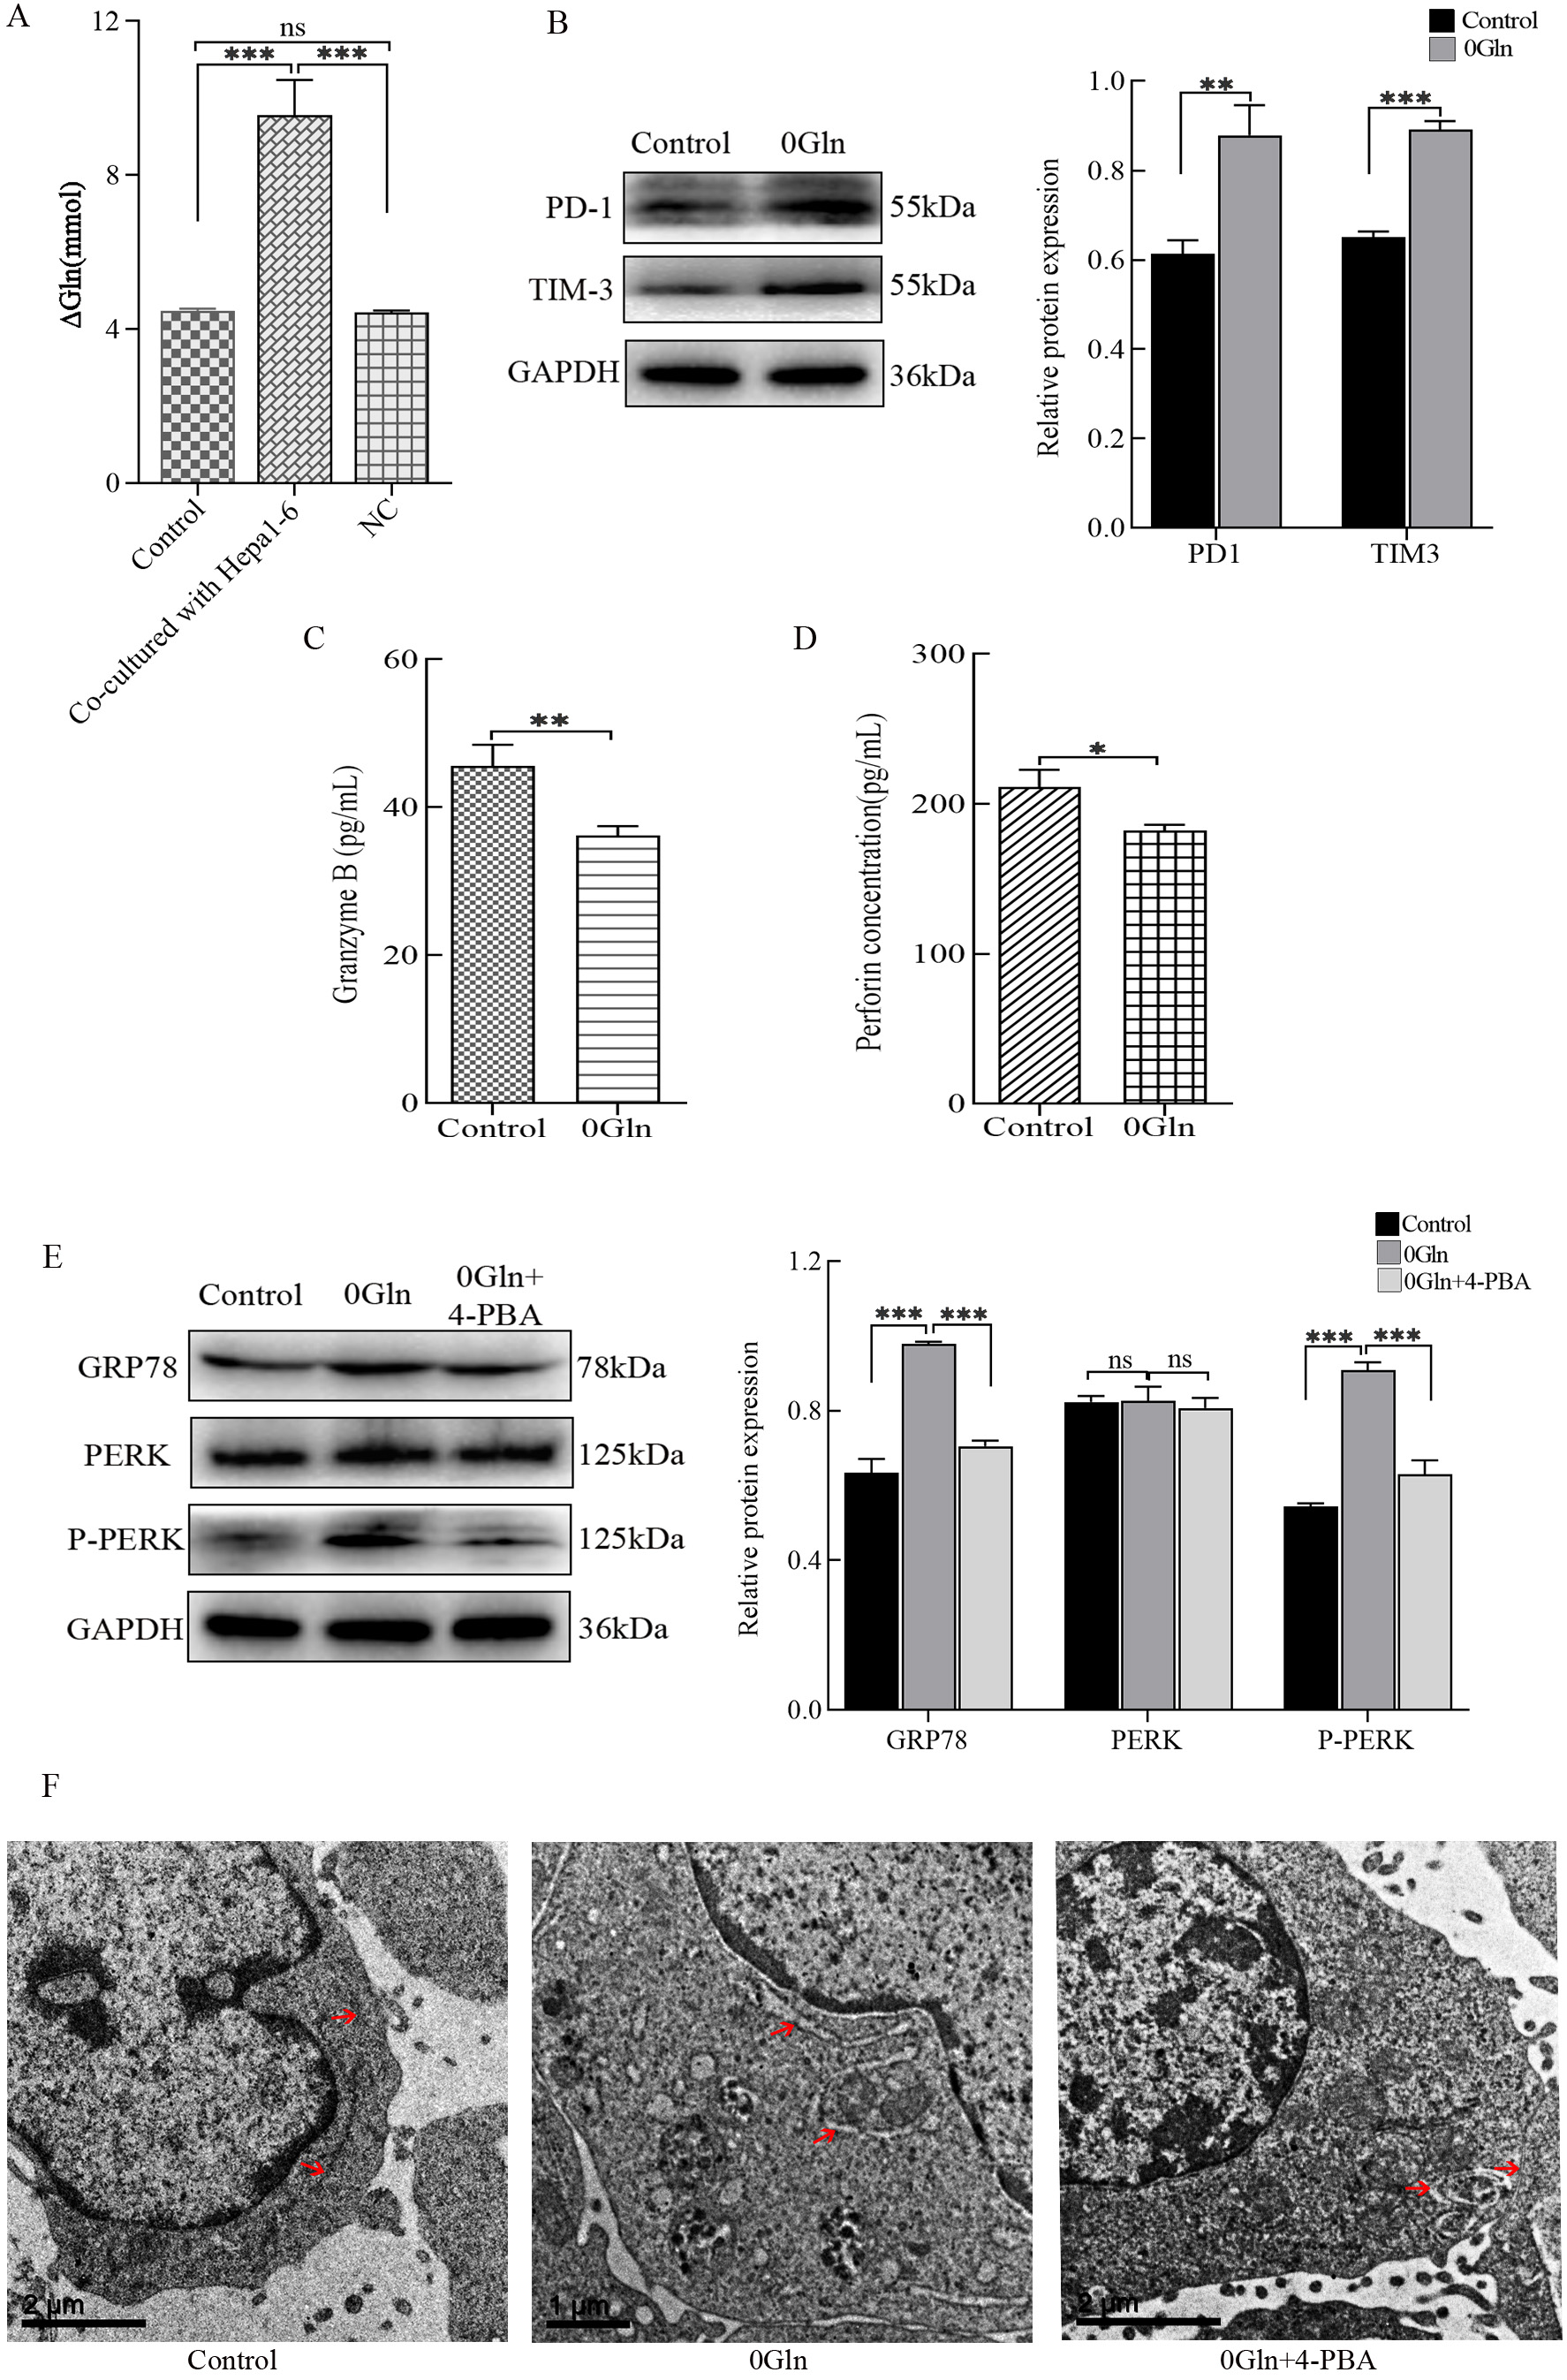 Fig. 3.
Effect of glutamine (Gln) deprivation on cytotoxic T lymphocytes
(CTLs) co-cultured with hepatoma cells. (A) The Gln content in the supernatant
of each culture group was detected by colorimetry. Activated CTLs were cultured
in Gln-deprived RPMI 1640 medium, and (B) PD-1 and TIM-3 protein expression was
detected by western blots. (C) Granzyme B and (D) perforin secretion was detected
by enzyme-linked immunosorbent assays (ELISAs). (E) 4-PBA was added to
Gln-deprived RPMI 1640 medium, and western blots were used to assess GRP78, PERK,
and P-PERK protein expression levels. (F) Transmission electron microcopy was
used to observe the morphology of the ER in these cells. *p
To investigate how Gln is utilized by CTLs, we detected the expression of
glutaminase and glutamine transporters (SLC1A5) in cells. The expression levels
of GLS2 and SLC1A5 proteins were significantly reduced in CTLL-2 cells
co-cultured with Hepa1-6 cells (Fig. 4A). Next, CTLs deprived of Gln also showed
low GLS2 and SLC1A5 expression levels (Fig. 4B). Additionally, there was no
significant difference in GLS1 expression. Unlike CTLs, GLS1 protein expression
levels were significantly reduced in Hepa1-6 cells in the absence of Gln (Fig. 4B). Thus, we speculated that CTLs mainly use GLS2 to utilize Gln. GLS inhibitors
(CB-839 and Compound 968) were added to the medium to further investigate the
role of glutaminase. From the western blot results, we set the effective
concentration of CB-839 to 4
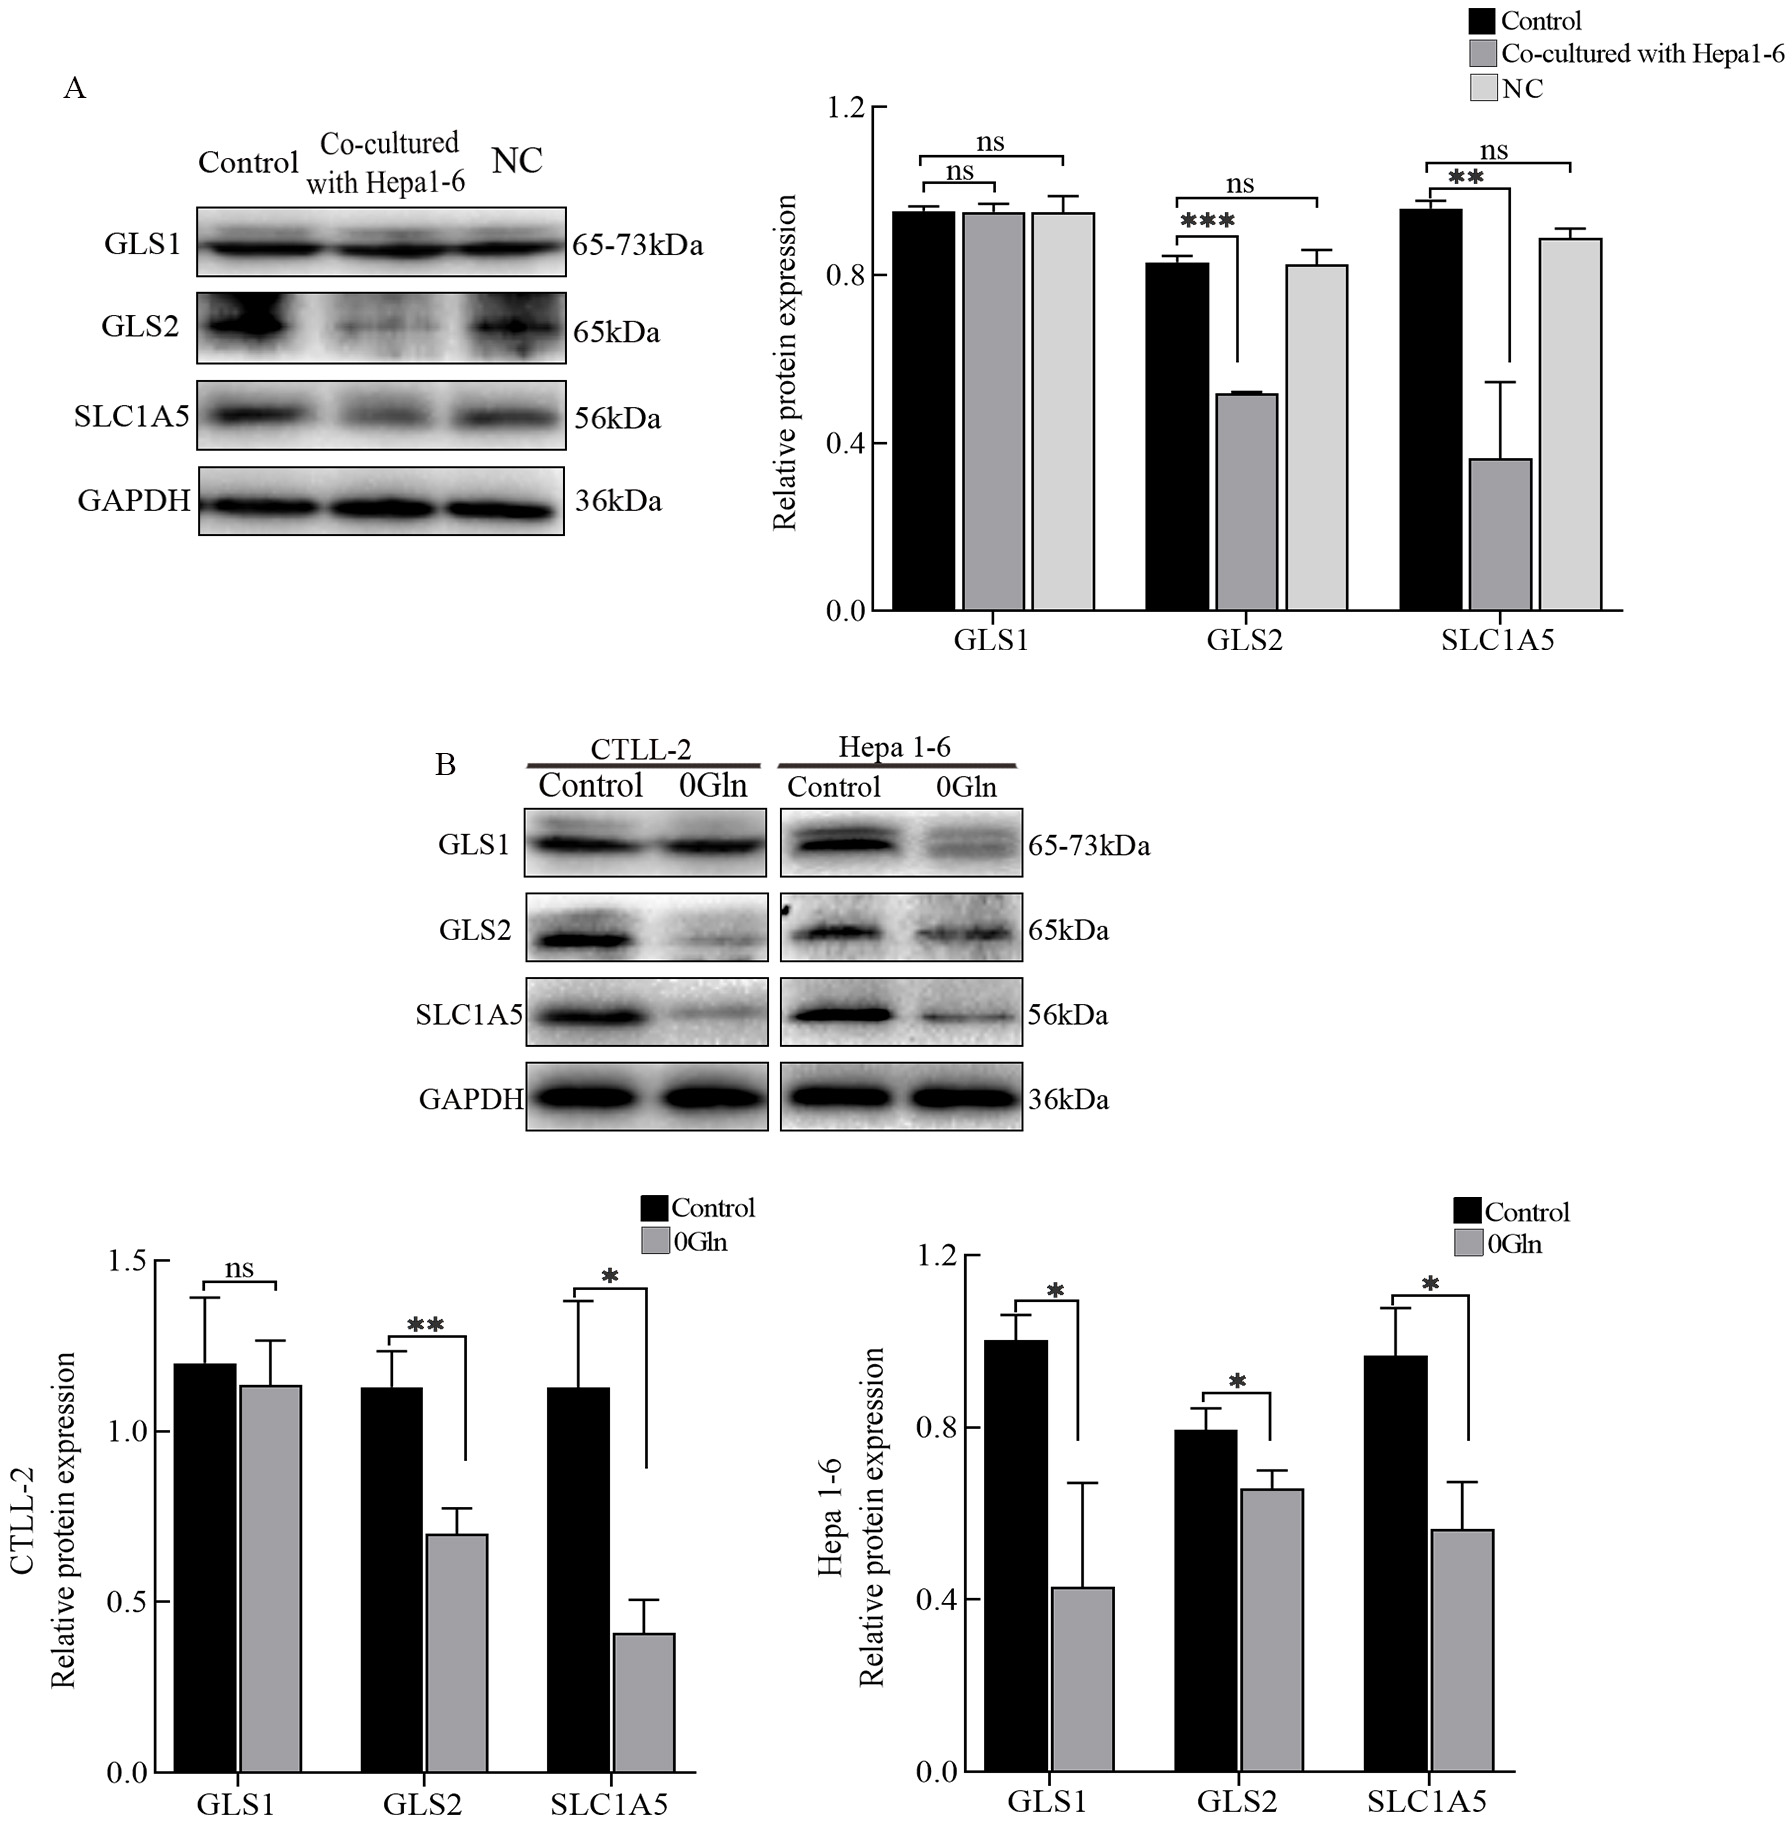 Fig. 4.
Glutamine (Gln) utilization in cytotoxic T lymphocytes (CTLs)
and hepatoma cells. (A) Western blots were used to detect the protein expression
levels of GLS1, GLS2, and SLC1A5 in the different groups. (B) After Gln
deprivation, protein expression levels of GLS1, GLS2, and SLC1A5 in both CTLs and
hepatoma cells were assessed by western blots. *p
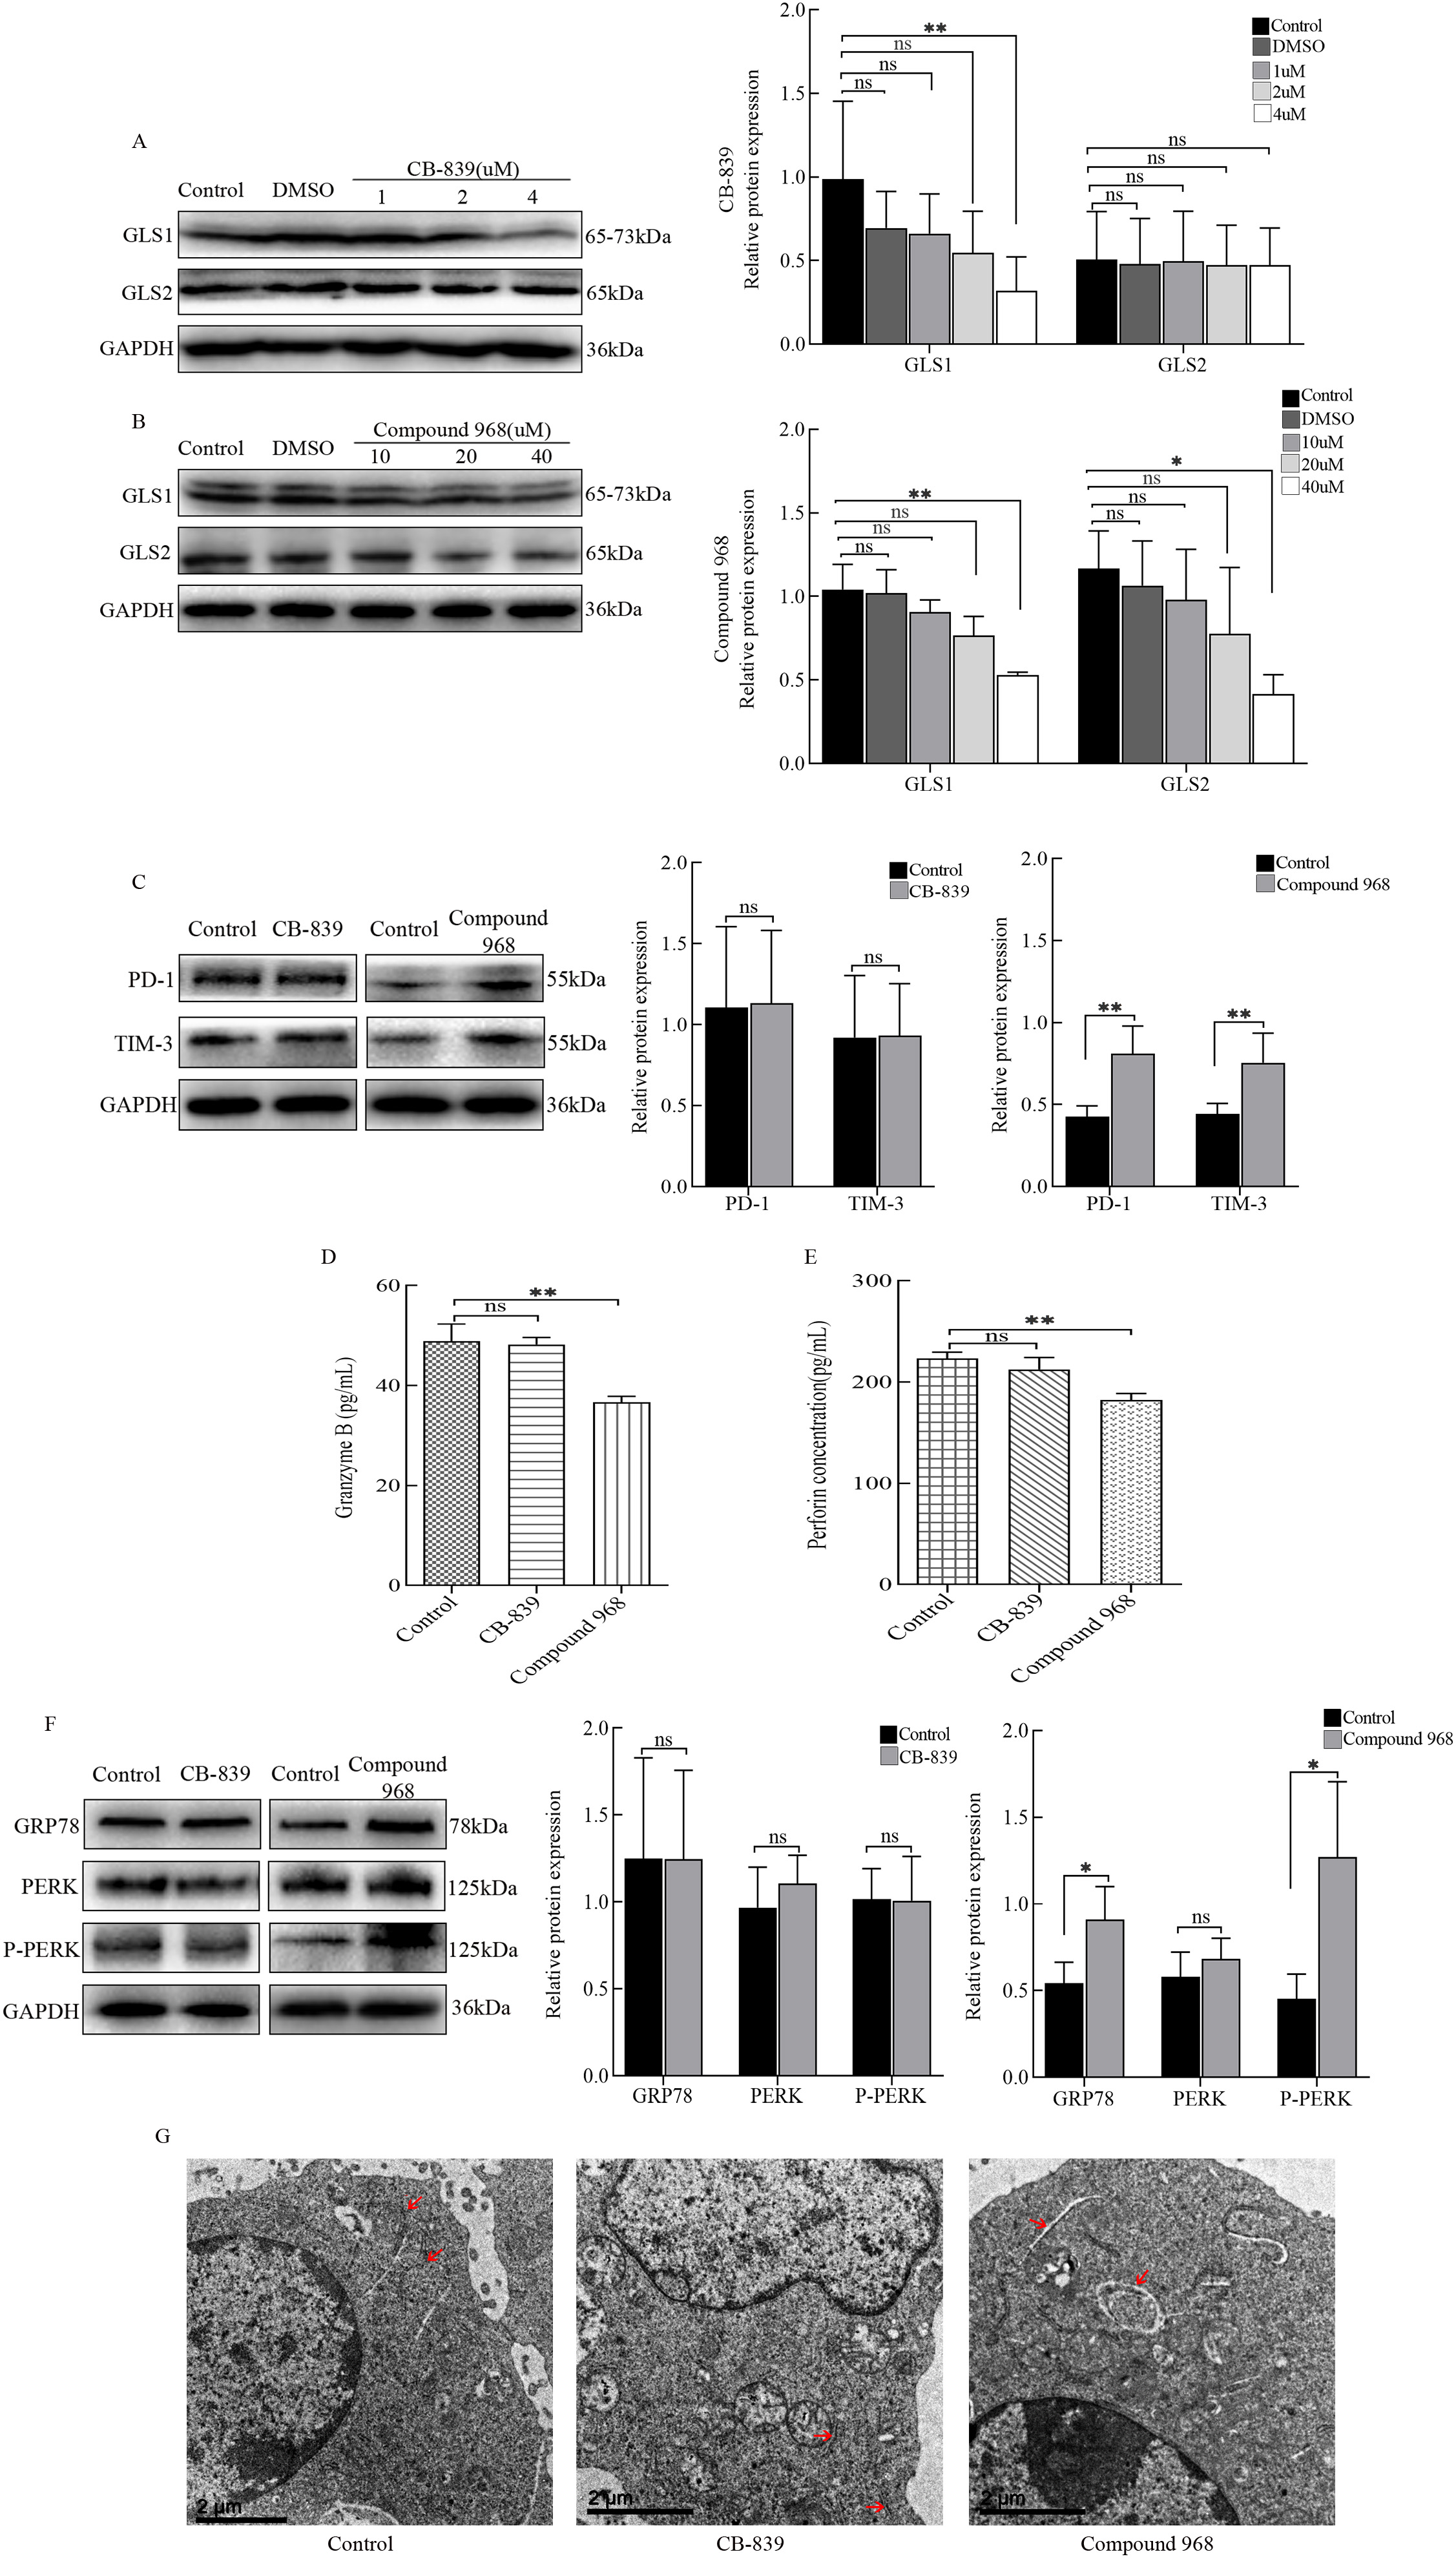 Fig. 5.
Regulation of cytotoxic T lymphocytes (CTLs) by various
glutaminases. (A) CTLs were cultured using RPMI 1640 medium containing different
concentrations of CB-839, and the protein expression levels of GRP78, PERK, and
P-PERK were detected by western blots. (B) CTLs were cultured using RPMI 1640
containing different concentrations of Compound 968, and the protein levels of
GRP78, PERK, and P-PERK were detected by western blots. CTLs were cultured using
RPMI 1640 containing 4
Tumor-infiltrating CTLs exhibit loss of antitumor immunity due to altered organelle function and abnormal protein expression caused by long-term antigen exposure, tumor microenvironment inhibition [3], and regulation of signaling molecules (e.g., MYD88) [17]. Dysfunctional CTLs highly express inhibitory receptors, such as PD-1, TIM-3, CTLA-4, and 2B4 [18]. Additionally, decreased expression of effector molecules such as Granzyme B and perforin is another important feature of dysfunctional CTLs. Under conditions of chronic viral infection or cancer, immune checkpoint molecules are highly induced on activated T cells to keep the immune response in check [19]. Our experiments here showed that stimulation with hepatoma cells increased the expression levels of PD-1 and TIM-3 in CTLs, while decreasing the secretion of Granzyme B and perforin. These results indicate that an inhibition of CTL functions is induced by hepatoma cells.
The regulation of cellular functions is closely related to organelle functions, such as those of the ER [20] and mitochondria [21]. Reactive metabolic byproducts induced by the TME, like 4-hydroxynonenal (4-HNE), promote the development of ER stress responses in infiltrating tumor-associated dendritic cells (tDCs) [22]. Our RNA-Seq results indicated that there is an upregulation of genes involved in ER-related reactions. This suggested that the ER of CTLs is altered upon stimulation by hepatoma cells. Further experiments demonstrated that CTLs expressed high levels of GRP78 and PERK, and their ER was swollen after hepatoma cell stimulation. These findings suggest that the ER stress response is activated and ER morphology is altered in CTLs under hepatoma cell induction. Inhibition of the ER stress signaling pathway results in the development of memory T cells responding to acute infection [23]. Next, we explored the relationship between ER stress and cellular function in CTLs. As mentioned earlier, 4-PBA is an ER stress inhibitor. Our data using 4-PBA showed that after ER stress was inhibited, the expression levels of PD-1 and TIM-3 in CTLs were reduced. Additionally, the secretion of Granzyme B and perforin was increased, suggesting the recovery of CTL functions. These data show that inhibition of the ER stress response can upregulate the effector functions of CTLs.
Normally, homeostasis of the ER internal environment is a fundamental condition for maintaining proper ER function. However, hypoxia [12], low pH [4], nutrient deficiency [11], or hyperalimentation (e.g., high glucose) [24], and ER dysfunction can cause ER stress to occur. Multiple stressors enriched in the TME can provoke maladaptive ER stress responses to control the effector function of infiltrating T cells [14]. Because of the high metabolic demand and unlimited proliferative ability of tumor cells, the nutrient availability within the microenvironment is changed, making it difficult for the infiltrating immune cells to obtain the key nutrients required for protein folding [25]. Our RNA-Seq results showed that genes associated with amino acid stimulation responses and the ER in CTLs induced by hepatoma cells were regulated, such as “the regulation of the lipid metabolic process”, “cellular secretion” and “positive regulation of secretion by cells”. Gln deprivation had a negative effect on the M2 macrophage activation program, reducing the committed cell population by approximately 50% [26]. In ovarian cancer, T cell mitochondrial dysfunction can be caused by inhibition of X-box binding protein 1 (XBP1)-mediated Gln influx [27]. These results shown in the literature suggest a close link between Gln metabolism and organelle function. In the present study, hepatoma cells consumed more Gln when co-cultured. With Gln deprivation, the ER of CTLs became swollen and expression levels of GRP78 and PERK were elevated. This suggested that CTLs underwent the ER stress response. Simultaneously, expression of PD-1 and TIM-3 increased and the secretion of Granzyme B and perforin decreased, indicating that the functions of CTLs were inhibited. These results suggest that Gln deprivation can downregulate CTL functions and the induction of the ER stress response.
Gln is transported into cells through one of many transporter proteins, such as the solute carrier family 1 neutral amino acid transporter member 5 (SLC1A5; also known as ASCT2) [28], and is then available for biosynthesis by glutaminase. Glutaminase, which exists in multiple tissue-specific versions, is encoded by two genes in mammals, kidney-type glutaminase (GLS1) and liver-type glutaminase (GLS2) [29]. GLS1 is more widely expressed in normal tissues and thought to be highly expressed in many cancers, such as liver cancer [30]. However, the data in this study showed that GLS2 was highly expressed in CTLs induced by hepatoma cells. When Gln deprived, CTLs had low GLS2 expression, whereas the change in GLS1 levels was not significant. The CTL functions and the ER status were not affected by the GLS1 inhibitor CB-839. Upon addition of the glutaminase inhibitor compound 968, the protein levels of PD-1 and TIM-3 in CTLs increased, and the secretion of Granzyme B and perforin decreased. GRP78 and P-PERK expression levels also increased, and the ER became swollen. These results indicate that when GLS2 is inhibited, CTLs undergo the ER stress response and further downregulate cellular functions. Overall, GLS2 has an important role in the Gln utilization process in CTLs, which is different from the use of GLS1 by hepatoma cells.
In summary, CTLs are functionally downregulated induced by hepatoma cells through the Gln-GLS2-ERS pathway.
JW conceived the idea and designed the research study. WW and MG performed the research. ZB and WB provided help and advice on data analysis. WW, WC and YS analyzed the data. WW wrote the manuscript. All authors contributed to editorial changes in the manuscript. All authors read and approved the final manuscript.
The study was approved by the Tangshan Maternal and Child Health Care Hospital affiliated to North China University of Science and Technology (No. 2022-064-01).
We thank the laboratory platform: Hebei Key Laboratory for Chronic Diseases, Tangshan Key Laboratory for Preclinical and Basic Research on Chromic Diseases, School of Basic Medical Sciences, North China University of Science and Technology.
This research was funded by High-End Talent Funding Project in Hebei Province, grant number A202003005. This research was funded by Hebei Provincial Health Commission Office, grant number G2019074. This research was funded by Natural Science Foundation of Hebei Province, grant number H2019209355.
The authors declare no conflicts of interest.
Publisher’s Note: IMR Press stays neutral with regard to jurisdictional claims in published maps and institutional affiliations.