
Academic Editors: Wei Lan, Qingfeng Chen and Khondaker Miraz Rahman
Background: Premature coronary artery disease (PCAD) has a poor
prognosis and a high mortality and disability rate. Accurate prediction of the
risk of PCAD is very important for the prevention and early diagnosis of this
disease. Machine learning (ML) has been proven a reliable method used for disease
diagnosis and for building risk prediction models based on complex factors. The
aim of the present study was to develop an accurate prediction model of PCAD risk
that allows early intervention. Methods: We performed retrospective
analysis of single nucleotide polymorphisms (SNPs) and traditional cardiovascular
risk factors (TCRFs) for 131 PCAD patients and 187 controls. The data was used to
construct classifiers for the prediction of PCAD risk with the machine learning
(ML) algorithms LogisticRegression (LRC), RandomForestClassifier (RFC) and
GradientBoostingClassifier (GBC) in scikit-learn. Three quarters of the
participants were randomly grouped into a training dataset and the rest into a
test dataset. The performance of classifiers was evaluated using area under the
receiver operating characteristic curve (AUC), sensitivity and concordance index.
R packages were used to construct nomograms. Results: Three optimized
feature combinations (FCs) were identified: RS-DT-FC1 (rs2259816, rs1378577,
rs10757274, rs4961, smoking, hyperlipidemia, glucose, triglycerides), RS-DT-FC2
(rs1378577, rs10757274, smoking, diabetes, hyperlipidemia, glucose,
triglycerides) and RS-DT-FC3 (rs1169313, rs5082, rs9340799, rs10757274,
rs1152002, smoking, hyperlipidemia, high-density lipoprotein cholesterol). These
were able to build the classifiers with an AUC
Coronary artery disease (CAD) is a complex disease with multiple genetic and environmental determinants [1]. Although some progress has been made in the prevention and treatment of atherosclerosis, CAD remains a leading cause of death and disability worldwide, with the incidence increasing in many regions. There has also been a marked increase in the incidence of premature coronary artery disease (PCAD) [2, 3]. Many genetic factors associated with the risk of CAD including genetic variations in single gene such as LDLR, APOB, PCSK9, LRP6, MEF2A and APOE have been discovered by pedigree or Mendelian randomization research [4, 5, 6, 7]. However, most of the monogenic variations with a strong CAD risk association are quite rare and account for only a small part of the heritability of CAD. Polygenic common genetic variations (CGVs) with minor effects are thought to contribute most of the heritability of CAD [8]. Genome-wide association studies (GWAS) have identified a large number of CGVs related to CAD, most of which are single nucleotide polymorphisms (SNPs). About 40% of these CGVs can be attributed to known CAD risk pathways involving low density lipoprotein cholesterol (LDL-c), triglycerides (TG), inflammation and hypertension. However, the remainder cannot be clearly linked to the known molecular pathways involved in CAD risk [4, 9]. Numerous cohort studies and case-control studies have attempted to confirm or to identify new CAD risk variants. To date, hundreds of candidate CGVs have been reported for CAD [10], but using this genetic information to develop effective prevention and control strategies remains a major challenge for clinicians or researchers.
The recent emergence of a genetic risk score (GRS) for CAD is an important step in the use of genetic information to identify populations at risk for this disease, while related studies have further established the polygenic nature of CAD [8, 11, 12]. CAD events were found to occur significantly more often in individuals with a high GRS, but could be reduced or delayed if these individuals adopted a favorable lifestyle [13]. GRS models can improve CAD risk prediction beyond that provided by traditional cardiovascular risk factors (TCRFs), thus allowing individuals who will benefit the most from lifestyle improvements or drug prevention to be identified with greater accuracy [5, 11]. Individuals who are aware of being at high genetic risk for CAD are better able to achieve active control of their TCRFs, such as LDL-c, compared to those who were only aware of their TCRF phenotype [14]. PCAD is associated with high recurrence and mortality rates, as well as poor long-term prognosis [15, 16]. Early warning of PCAD risk is very important for high-risk groups in that it allows timely application of prevention and treatment strategies.
Machine learning (ML) is a branch of artificial intelligence that focuses on building application programs, using systematic algorithm and statistical processing steps to train models with a large amount of data. This allows patterns and features to be identified, which in turn allows predictions to be made with new data [17]. The aim of this study was to combine SNPs and TCRFs information in order to develop a high-performance prediction model for PCAD. Forty-eight SNP loci associated with 43 candidate genes previously reported to be associated with CAD or with carotid intima-media thickness (IMT) were analyzed in southern Han Chinese. Several SNPs combined with several TCRFs were used to construct a high-performance classifier (HPC) using logistic regression classifier (LRC), random forest classifier (RFC) and gradient boosting classifier (GBC). These HPCs could accurately distinguish PCAD individuals from controls. Three feature combinations (FCs) used to establish the HPC were further used to build nomograms. These could directly classify the PCADs and controls with high accuracy and may therefore have clinical value.
All participants in this study were southern Han Chinese from the Guangdong
province of China. Whole blood samples and the electronic medical records of each
participant were collected between 2008 to 2012 and studied retrospectively.
Inclusion criteria for the PCAD group were: (1) males aged
A total of 140 patients with PCAD and 195 controls were selected as the subjects in this study. After the exclusion of individuals whose SNP genotype information or clinical data could not be obtained, 131 patients with PCAD and 187 controls were included in the final analysis.
Two milliliters of whole blood was collected from each individual in an ethylenediamine tetra-acetic acid disodium (EDTA) anticoagulant tube. The following information was collected from the electronic medical record of each participant: sex, age, smoking history, hypertension, diabetes, hyperlipidemia, as well as biochemical test results for high-density lipoprotein cholesterol (HDL-c), LDL-c, glucose (GLU), TG and total cholesterol (CHOL).
Peripheral blood samples were used to isolate the genomic DNA with the E-Z
96
Candidate SNPs were selected from SNPs previously reported in the literature to
be associated with CAD or with carotid intima-media thickness. Those with a
frequency of
SNPs were genotyped using multiplex polymerase chain reaction (PCR) and single base primer extension in a 48-PLEX GENOMELAB SNPSTREAM® system. Briefly: 96 unique primers (shown in Supplementary Table 2) having no interaction with each other were designed using the Beckman Coulter’s Autoprimer multiplex primer design system for 48-plex PCR. The primers were automatically divided into 6 categories according to the allele type: C/A, T/A, A/G, C/G, T/C and T/G. The 5-prime end of each was linked with a tag sequence that was complementary to the corresponding tag sequence in the SNPware tag array board. The primers and enzyme mix for SNPstream analysis were provided by Beckman Coulter’s Biomek® FX. SNPstream analysis was performed on the Beckman Coulter’s Biomek® FX automatic laboratory workstation, resulting in genotype information for each SNP.
Associations between SNP genotype or allelotype and PCAD were analyzed with the
PLINK-model program package. This performs four tests (1df dominant gene action,
1df recessive gene action, 2df genotypic, and Cochran-Armitage trend) and outputs
the combined results. Correlations were evaluated with the Chi-square test and an
asymptotic p-value was produced. A significant correlation was
considered as p
General statistical analysis was performed using the statistical package R
(https://www.r-project.org/; version x64
4.0.2). Classification variables were represented by n (%), and the significance
of differences between groups was tested using Pearson’s Chi-squared test with
Yates’ continuity correction. Continuous variables with a normal distribution and
homogeneous variance were represented as the mean
SNPs and TCRFs with a missing value ratio of greater than 20% were excluded.
Feature combination (FC) was used to indicate all independent variables (termed
“feature” in ML) that were combined to build a ML model. FCs were determined in
3 ways. (1) The FCs included SNPs or TCRFs that showed a significant difference
(sd-SNPs and sd-TCRFs, respectively) between the PCAD and control groups, as well
as the sd-SNP plus the sd-TCRFs. (2) The features in the FCs were selected from
the sd-SNPs and the sd-TCRFs, or from the SNPs with a differential trend
(dt-SNPs) (p
Next, for each FC a new data sheet was generated from the original data wherein the variables in the new data were the factors included in the FC and the response variable (group). In each new data sheet, the rows with missing values were removed. The remained rows were then divided into a training dataset and a test dataset using Scikit-learn (https://scikit-learn.org/stable/; v.0.23.1) (function ‘train_test_split’ with test_size = 0.25, random_state = 0). The training dataset was used to construct the classifier, while the test dataset was used to evaluate performance. ‘StandardScaler’ function in the Scikit-learn module was used to standardize the feature values of continuous variables before constructing the logistic regression classifier.
Scikit-learn is a Python module that integrates a wide range of state-of-the-art ML algorithms for medium-scale supervised and unsupervised problems [21]. RFC, LRC and GBC are used to build classifiers for predicting disease risk, progression, prognosis, and so on. RFC in the ‘sklearn.ensemble’ module is one of the averaging algorithms in ensemble methods and is a perturb-and-combine technique specifically designed for trees. In practice, variance reduction due to the introduction of randomness in the classifier construction is often significant, hence yielding a better model overall [22]. The probabilities that describe possible outcomes of a single trial are modeled using a logistic function known as LRC in the ‘sklearn.linear_model’. GBC is a boosting method and builds an additive model in a forward stage-wise fashion that allows for the optimization of arbitrary differentiable loss functions. Base estimators in GBC are built sequentially, with several weak models having to be combined to produce a powerful ensemble that reduces the bias of the combined estimator [23]. The classifiers constructed with the ML algorithm of RFC, LRC or GBC are referred to in this study as the RFC model (RFCM), LRC model (LRCM) and GBC model (GBCM), respectively.
The classifiers for each FC in this study were built using RFC, LRC and GBC in the Scikit-learn module and with the training dataset. Five-fold cross for model validation was performed and the hyper-parameters for model tuning are shown in Supplementary Table 3. The predictive performance of the classifiers was evaluated with the test dataset by computing the area under the receiver operating characteristic curve (AUC), sensitivity, specificity and average precision (AP) for the prediction of positive cases (using the ‘sklearn.metrics.auc’, ‘sklearn.metrics.recall_score’ and ‘sklearn.metrics.plot_precision_recall_curve’ functions, respectively). The final models and FCs were determined according to the performance of the models, with higher AUC and sensitivity corresponding to better performance.
Nomograms representing a regression model (lrm) fitted with ‘rms’ were drawn with the nomogram model in the ‘rms’ R package, which can be used manually to obtain predicted values. The nomogram has a reference line for reading scoring points (default range 0–100). Once the reader manually totals the points, the predicted values can be read at the bottom. Bias-corrected (overfitting-corrected) estimates of predicted vs. observed values were performed with the ‘calibrate’ model in the ‘rms’ R package by using bootstrapping (B = 1000) or cross-validation. Validation of ‘lrm’ models was performed with the ‘validate’ function in the ‘rms’ R package using the training dataset followed by the test dataset. The performance of the nomogram model for predicting outcomes was evaluated by calculating the concordance index (C-index). The nomogramFomula R package was used to calculate the total nomogram points for each sample, and optimal cutpoints for each nomogram model were computed with the OptimalCutpoints R package (methods = “Youden”). Decision curve analysis for each ‘lrm’ model was performed with the ‘rmda’ R package.
Fig. 1 shows the design of the study and the process of data acquisition, data processing, model construction and verification.
 Fig. 1.
The flow chart of this study. PCAD, premature coronary artery disease; CVD, cardiovascular disease; AUC, the area under the receiver operating characteristic curve; C-index, consistency index; SNP, single nucleotide polymorphism; TCRF, traditional cardiovascular risk factor; LRCM, logistic regression classifier model; RFCM, random forest classifier model; GBCM, gradient boosting classifier model.
The aim of this study was not to identify PCAD-related SNPs that were independent of TCRFs, but rather to construct ML models with predictors that included TCRF and SNP information and to assess whether these had superior performance compared to ML models built with TCRF predictors only. Hence, the present study was different to usual case-control studies in that the TCRFs were intentionally not matched between the two groups.
There was no significant difference in the gender ratio between the PCAD and control groups. The median age of the PCAD and control groups was 48 and 68 years, respectively, with the control group being older due to the admission criteria. The incidence of smoking, hypertension, diabetes, and hyperlipidemia were all significantly higher in the PCAD group than in the control group. Plasma levels of GLU and TG in the PCAD group were significantly higher than in the control group, whereas HDL-c was significantly lower. There was no significant difference in the plasma levels of CHOL and LDL-c between the two groups (Table 1).
| PCAD (n = 131) | Control (n = 187) | p value | 95% CI | |
| Male, n (%) | 88 (67.18%) | 125 (66.84%) | 0.9998 | - |
| Age, median (1st Qu., 3rd Qu.) |
52 (48.0, 54.5) | 68 (61.0, 74.0) | -Inf - (–14.00) | |
| Smoking, n (%) | 48 (36.64%) | 11 (5.88%) | - | |
| Hypertension, n (%) | 41 (31.30%) | 35 (18.72%) | 0.014 | - |
| Diabetes, n (%) | 19 (14.50%) | 2 (1.07%) | - | |
| Hyperlipemia, n (%) | 36 (27.48%) | 14 (7.47%) | - | |
| GLU (mmol/L), median (1st Qu., 3rd Qu.) | 5.70 (5.02, 6.96) | 4.83 (4.50, 5.44) | 0.570–1.100 | |
| TG (mmol/L), median (1st Qu., 3rd Qu.) | 1.42 (1.07, 2.05) | 1.11 (0.87, 1.47) | 0.180–0.440 | |
| CHOL (mmol/L), mean (SD) |
4.63 (1.19) | 4.86 (0.80) | 0.072 | –0.488–0.021 |
| HDL-c (mmol/L), median (1st Qu., 3rd Qu.) | 1.00 (0.86, 1.28) | 1.25 (1.03, 1.49) | –0.280–(–0.130) | |
| LDL-c (mmol/L), mean (SD) | 2.92 (1.41) | 2.99 (0.71) | 0.64 | –0.354–0.219 |
| Notes: | ||||
Of the 48 SNP loci examined, three SNPs (rs3791398, rs1256049 and rs2071406)
failed genotyping and were excluded from further analysis. rs10757274, rs10757278
and rs2383206 each showed a significant correlation with PCAD using the recessive
and genotype genetic model test (p
MDR analysis revealed the best single factor model that correlated with PCAD was rs10757274. The cross-validation consistency of this model was 7/10, and the test balance accuracy was 0.533. The best two-factor model that correlated with PCAD was comprised of rs10757274 and rs3850641, with a cross-validation consistency of 5/10, a test balance accuracy of 0.564 and a sign test p-value of 0.055. The best three-factor model was comprised of rs2048327, rs16147 and rs1801708, and showed the highest training balance accuracy (0.680), the lowest detection balance accuracy (0.477), and the lowest consistency of cross-validation (3/10) (Table 2). Therefore, the two-factor model obtained by MDR analysis was considered to be the best model. Fig. 2 shows the interaction between the two-locus genotypes. The combinations of rs10757274 (GA) with rs3850641 (AA), and of rs10757274 (GG) with rs3850641 (GA) were associated with an increased risk of PCAD.
| SNPs | Training balanced accuracy | Testing balanced accuracy | Sign Test (p) | Cross validation consistency |
| rs10757274 | 0.5793 | 0.5327 | 0.1719 | 7/10 |
| rs10757274, rs3850641 | 0.6281 | 0.5644 | 0.0547 | 5/10 |
| rs2048327, rs16147, rs1801708 | 0.6801 | 0.4770 | 0.9453 | 3/10 |
 Fig. 2.
PCAD risk associated interaction between the SNPs. In each cell, the left bar indicates the positive score, the right bar represents the negative score. When the absolute value of the positive score is greater than that of the negative score, increased risk is considered in the cell, otherwise, decreased risk in the cell. Risk-increased cells are indicated by dark gray, risk-decreased cells by light gray, and empty cells by white. (A) The best single factor model for correlation between SNPs and PCAD. (B) The best two-factor model for correlation between SNPs and PCAD.
The AUCs of the LRCM, RFCM and GBCM constructed with four sd-SNPs (rs10757274, rs10757278, rs2383206 and rs7291467) were 0.61, 0.63 and 0.62, respectively (Fig. 3A). The AUCs of the LRCM, RFCM and GBCM built with 7 sd-TCRFs (smoking, hypertension, hyperlipemia, diabetes, Glu, TG and HDL-c) were 0.82, 0.85 and 0.84, respectively (Fig. 3B). The AUCs of the LRCM, RFCM and GBCM constructed with four sd-SNPs plus 7 sd-TCRFs were 0.88, 0.85 and 0.86, respectively (Fig. 3C). The performance of the classifiers constructed with the sd-SNPs plus the sd-TCRFs was slightly improved.
 Fig. 3.
The receiver operating characteristic curve (ROC) of the classifiers constructed using the factors significantly associated with PCAD. LogisticRegression, RandomForestClassifier, and GradientBoostingClassifier are three different machine learning algorithms. GLU, Glucose; TG, triglycerides; HDL, high density lipoprotein cholesterol. (A) The ROC of the classifiers constructed with the sd-SNPs. (B) The ROC of the classifiers constructed with the sd-TCRFs. (C) The ROC of the classifiers constructed with the sd-SNPs plus the sd-TCRFs.
An optimized FC with 7 features (LASSO-7F-FC: rs10757274, rs10757278, smoking, diabetes, hyperlipemia, GLU and HDL-c) was selected by using the LASSO regression model from the sd-SNPs and sd-TCRFs (Fig. 4A). The AUCs of the LRCM, RFCM and GBCM constructed with the LASSO-7F-FC were 0.89, 0.84 and 0.84, respectively (Fig. 4B). The APs of the classifiers for the prediction of PCAD were 0.86, 0.78 and 0.78, respectively (Fig. 4C), while the sensitivity of the classifiers was 0.71. An optimized FC with 8 features (LASSO-8F-FC: rs10757278, rs4537545, smoking, hypertension, diabetes, hyperlipemia, GLU and HDL-c) was selected using the LASSO regression method from 18 dt-SNPs (including sd-SNPs) and sd-TCRFs (Fig. 4D). The AUCs of the LRCM, RFCM and GBCM constructed with the LASSO-8F-FC were 0.84, 0.86 and 0.83, respectively (Fig. 4E). The APs of the classifiers for the prediction of PCAD were 0.78, 0.77 and 0.76, respectively (Fig. 4F), while the sensitivity of the classifiers was 0.64. Although the classifiers built with LASSO-7F-FC and with LASSO-8F-FC showed high accuracy, their low sensitivity makes them less useful for identifying individuals at high risk for PCAD.
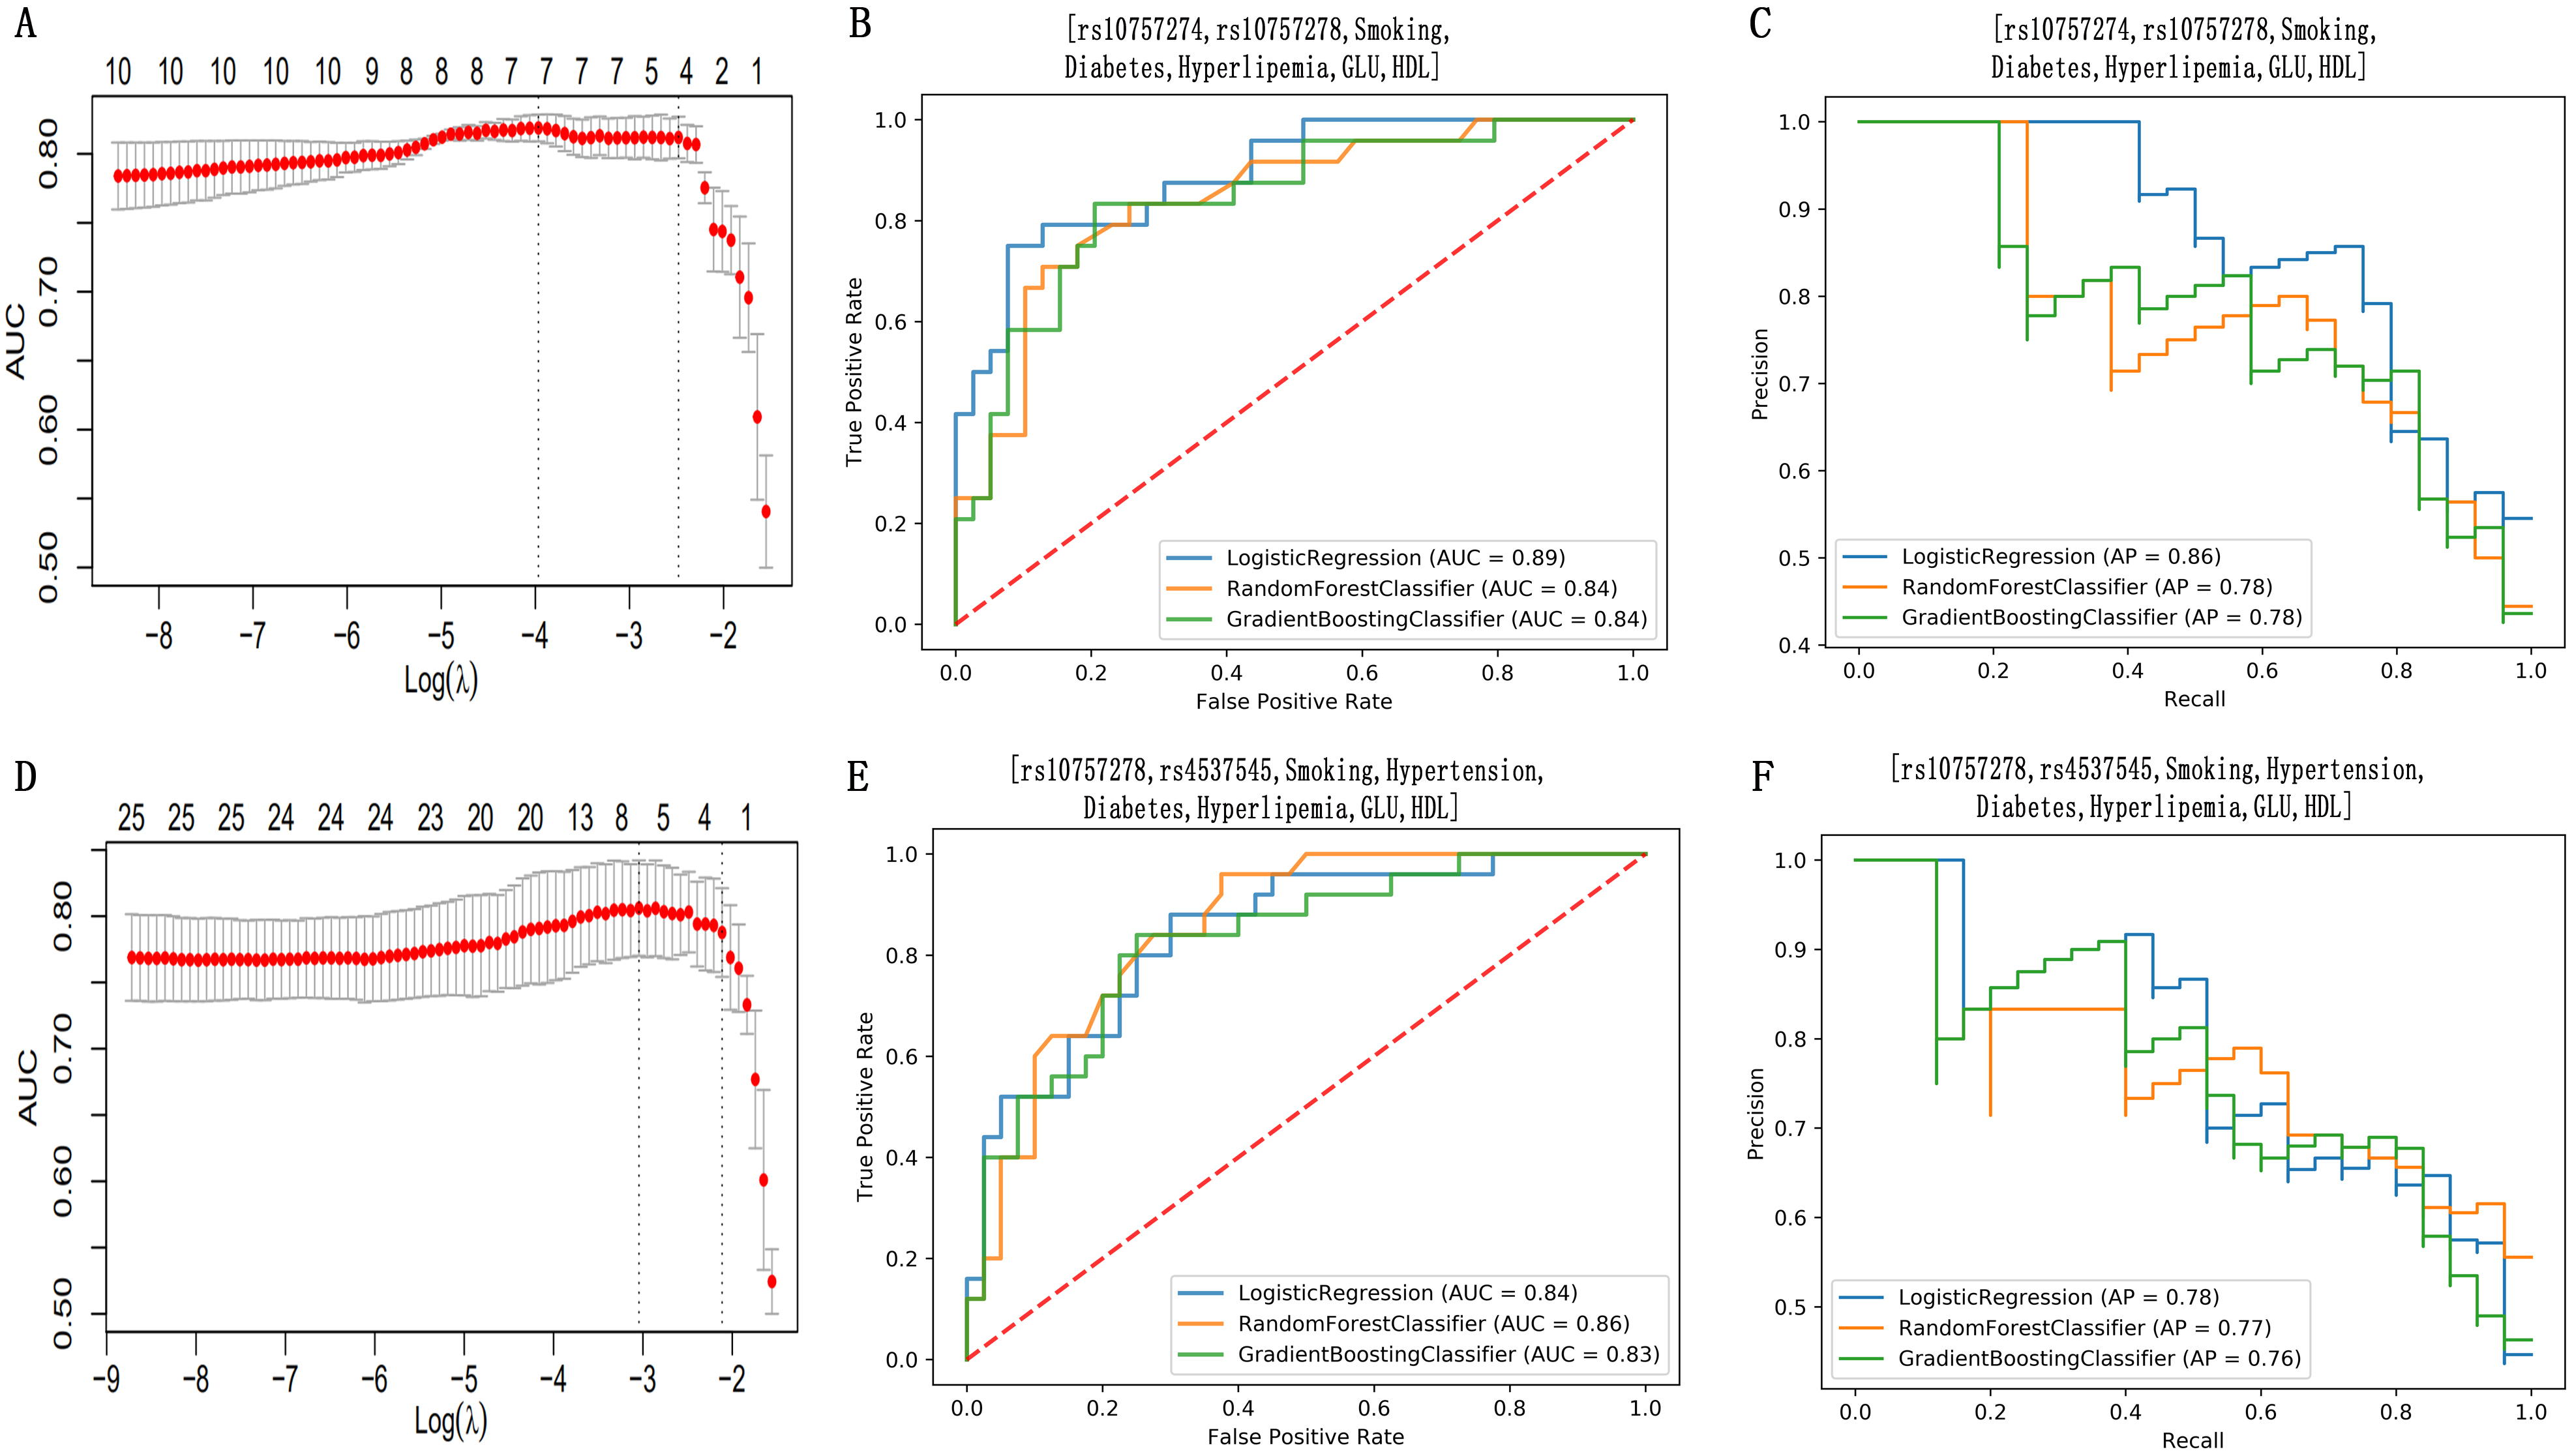 Fig. 4.
Feature selection using the least absolute shrinkage and
selection operator (LASSO) regression method and the performance assessment for
the classifiers established with the features selected with LASSO. The
LASSO regression analysis showed that increasing the number of features beyond 8 did not improve the performance of the model. Therefore, only FCs containing one to eight factors were randomly selected using an iterator and subsequently used to establish classifiers. Among the FCs composed of features randomly selected from the sd-SNPs and sd-TCRFs (RS-SD-FCs), we found that RS-SD-FC1 (rs2383206, smoking, diabetes, hyperlipemia, TG, HDL-c), RS-SD-FC2 (rs10757278, diabetes, hyperlipemia, GLU, TG, HDL-c) and RS-SD-FC3 (rs10757274, rs7291467, smoking, diabetes, hyperlipemia, GLU, TG) could be used to construct classifiers with high performance (Supplementary Fig. 1A,D,G). Indeed, classifiers built with RS-SD-FC1, RS-SD-FC2 and RS-SD-FC3 showed better performance than those constructed by LASSO-8F-FC and LASSO-7F-FC. RS-SD-FC1, RS-SD-FC2 and RS-SD-FC3 were each comprised of one or two sd-SNPs and several sd-TCRFs. Classifiers built only with sd-SNPs (Supplementary Fig. 1B,E,H) or only with sd-TCRFs (Supplementary Fig. 1C,F,I) showed markedly lower performance (Supplementary Fig. 1).
Among the FCs containing features that were randomly selected from dt-SNPs and
sd-TCRFs (RS-DT-FCs), we found that RS-DT-FC1 (rs2259816, rs1378577, rs10757274,
rs4961, smoking, hyperlipemia, GLU, TG), RS-DT-FC2 (rs1378577, rs10757274,
smoking, diabetes, hyperlipemia, GLU, TG) and RS-DT-FC3 (rs1169313, rs5082,
rs9340799, rs10757274, rs1152002, smoking, hyperlipemia, HDL-c) could be used to
build classifiers with high performance (Fig. 5A,C,E). All of the AUCs for the
classifiers built with RS-DT-FC1, RS-DT-FC2 and RS-DT-FC3 using LRC, RFC or GBC
were higher than 0.90 (Fig. 5A,C,E). Classifiers constructed with RS-DT-FC1 or
RS-DT-FC2 had an AP of
 Fig. 5.
Comparison of the performance of the classifiers built with three FCs composed of the factors that were randomly selected from the dt-SNPs and sd-TCRFs. (A) The ROC of the classifiers constructed with RS-DT-FC1 (rs2259816, rs1378577, rs10757274, rs4961, Smoking, Hyperlipemia, GLU, TG). (B) The precision recall curve (PRC) of the classifiers constructed with the RS-DT-FC1. (C) The ROC of the classifiers constructed with RS-DT-FC2 (rs1378577, rs10757274, Smoking, Diabetes, Hyperlipemia, GLU, TG). (D) The PRC of the classifiers constructed with RS-DT-FC2. (E) The ROC of the classifiers constructed with RS-DT-FC3 (rs1169313, rs5082, rs9340799, rs10757274, rs1152002, Smoking, Hyperlipemia, HDL). (F) The PRC of the classifiers constructed with RS-DT-FC3.
Classifiers constructed with RS-DT-FC1, RS-DT-FC2 and RS-DT-FC3 had better performance compared to all of the other classifiers mentioned above. Therefore, RS-DT-FC1, RS-DT-FC2, and RS-DT-FC3 were considered the optimal FCs and were used to construct the nomograms described below.
Decision curve analysis helps clinical decision makers to balance the advantages and disadvantages of intervention and thus determine the best intervention point. It can also be used to evaluate whether a given model has practical value [24]. The decision curves for the logistic regression models constructed with RS-DT-FC1, RS-DT-FC2 and RS-DT-FC3 were distant from the baseline for a wide range of risk thresholds (Supplementary Fig. 2), suggesting that all of these models have high net benefits and potential practical value.
Nomogram is a graphic tool used for complex calculations. It can transform the logistic regression model into a simple and intuitive scoring system that has more practice value for clinicians [25]. Nomograms built using RS-DT-FC1, RS-DT-FC2 and RS-DT-FC3 (RS-DT-FC1-nom, RS-DT-FC2-nom and RS-DT-FC3-nom, respectively) show in graphic form the effect of each factor on the risk of PCAD (Fig. 6A,C,E). The calibration curves for the nomogram models showed good agreement between the predictions and actual observations (Fig. 6B,D,F). RS-DT-FC1-nom, RS-DT-FC2-nom and RS-DT-FC3-nom also showed good discrimination, with C-indexes of 0.79 (95% CI: 0.73, 0.86), 0.82 (95% CI: 0.76, 0.88) and 0.79 (95% CI: 0.72, 0.86) respectively for validation with the training dataset, and 0.94 (95% CI: 0.88, 1.0), 0.94 (95% CI: 0.85, 1.0) and 0.90 (95% CI: 0.82, 0.98) respectively for validation with the test dataset.
 Fig. 6.
Nomogram and calibration curve. To use the nomograms in clinical practice, find the points corresponding to the variable value on the variable axis, draw a line vertically up to the points axis, read and record the score corresponding to each variable value, and sum the scores obtained. Then, find the points corresponding to the total score on the total points axis and draw a line straight down to the probability axis, and read the probability of PCAD. The arrow indicates the optimal cutpoints on the total points axis. If the individual’s total score is greater than the optimal cutpoints, it will be predicted high PCAD risk and marked as PCAD. On the category variable axis, ‘1’ indicates that the event represented by the variable name has occurred, and ‘0’ indicates that the event represented by the variable name has not occurred. The feature (variable) names are showed on the left of each nomogram. (A), (C) and (E) represent the nomograms constructed with RS-DT-FC1, RS-DT-FC2 and RS-DT-FC3, respectively. (B), (D) and (F) showed the calibration curve of the nomograms corresponding to (A), (C) and (E), respectively.
The optimal cutpoints for RS-DT-FC1-nom, RS-DT-FC2-nom and RS-DT-FC3-nom were computed using the R package ‘OptimalCutpoints’. These were 101.29, 27.74 and 186.01, respectively. Nomogram scores for each test sample were calculated using RS-DT-FC1-nom, RS-DT-FC2-nom and RS-DT-FC3-nom. If the total nomogram score for a sample was greater than or equal to the cutpoint for that nomogram model, it was predicted to be from a PCAD patient, otherwise it was predicted to be from a control. Samples in the test dataset were classified by comparing the total points, as calculated by reference to the nomograms, with the cutpoints. The results obtained using RS-DT-FC1-nom, RS-DT-FC2-nom and RS-DT-FC3-nom showed a prediction sensitivity of 0.92, 0.96 and 0.86, and an AUC of 0.89, 0.93 and 0.83, respectively (Supplementary Fig. 3).
This study found that the combination of genetic information and TCRFs, using machine learning algorithm could build HPCs, which effectively distinguished the PCAD patients from the controls. We developed three practical nomograms and calculated their optimal cutpoints. This could be compared directly with the total nomogram score of individual samples, allowing prediction of whether the sample was from a PCAD patient. Hence, these nomograms have potential application for the prediction of PCAD risk.
Interestingly, classifiers built using the most significant differential factors between the PCAD and control groups did not show better performance. Only a combination of specific factors gave an effective HPC, and changing the feature combination markedly altered the performance of the classifier. No obvious epistasis amongst the SNPs was revealed by MDR analysis. Therefore, some of the factors and especially some of the SNPs may function inversely to contribute to the PCAD phenotype, they could also play a similar but not an additive effect, which should be avoided to be used together when developing prediction models. This highlights the importance of FC selection in optimizing the performance of ML model. By comparing several methods for the selection of FCs, we found that optimal FCs could be identified using iterative method to randomly select from as many factors as possible. Next, models were built with each FC using three ML algorithms and their performance was evaluated. This not only showed the advantages of ML for the prediction of PCAD, but also for the selection of features. A recent study using ML reported that serum sphingolipids were cholesterol-independent biomarkers of CAD, again highlighting the advantages of ML for the discovery of novel CAD markers [26].
It is not difficult to understand why although a considerable number of common genetic variation loci are included in the early prediction models which is not much better in risk assessment of CAD than that with TCRFs [27]. In the present study, the performance of classifiers constructed only with TCRFs was much better than with SNPs alone. This was mainly attributed to the fact that TCRFs truly represent the disease state or the detrimental substances. Phenotypic correlations are often accompanied by genetic correlations [7]. CAD is a complex trait determined by a large number of common genetic variations, many of which are strongly correlated with known TCRFs [7]. Indeed, TCRFs such as hyperlipidemia and diabetes are determined by multiple genetic variations [28]. Abnormality in any of the TCRFs is likely to be a comprehensive manifestation of many genetic variations and is therefore more strongly correlated with the risk of CAD than most single genetic variations. Genetic variations eventually cause disease by disrupting the normal cellular balance, damaging cells or through the accumulation of harmful substances via their genetic products or via their effect on the expression of other gene products. Individuals with a high GRS are more likely to have vulnerable cells and to accumulate harmful substances that cause disease. However, this is not inevitable if they maintain a good lifestyle and remain healthy [13], indicating that the combined effect of various factors determines the final disease phenotype.
In previous studies, rs2259816, rs1378577, rs4961 and rs10757274 were reported to be independent of the TCRFs [29, 30, 31]. In the current study, these variants were included in the FCs (RS-DT-FC1 and RS-DT-FC2) capable of building the HPCs and nomograms, suggesting that using the factors independent of each other to build a prediction model may achieve the best result. rs10757274 is located in the chromosome (Chr) 9p21 and was reported to be closely linked to PCAD [5]. Previous studies have consistently shown that the contribution of Chr 9p21 to the risk of CAD is independent of known risk factors such as blood lipids, blood pressure, diabetes, age and sex [32]. rs10757274 was again found to be significantly associated with PCAD in the present study and was included in most of the FCs used to build HPCs. Together, the evidence strongly suggests that rs10757274 is a good genetic marker for predicting the risk of PCAD. This marker has also been associated with vascular disease phenotypes such as carotid atherosclerosis [33], stroke [34, 35], peripheral artery disease [36], and abdominal aortic aneurysm [37]. However, the underlying mechanism for the involvement of rs10757274 in cardiovascular disease is still not clear [32]. Recent studies have shown that rs10757274 risk allele can cause metabolic dysregulation of the lysophospholipid/autotaxin axis and increase the risk of CAD, which may be helpful for the identification of novel CAD risk markers that are independent of TCRFs [38].
Many predictive models for cardiovascular diseases have been proposed. The number of predictors contained in these models (2–80) and their predictive performance (AUC: 0.61–1.0) varies greatly (systemically reviewed in ref. [39]). Among the established models, the most widely validated and continuously improved is the Framingham score. This has been applied to predict outcomes for fatal or non-fatal CVD [39, 40]. Although the Framingham score is commonly used in the clinic, its predictive accuracy still needs improvement [40]. Other models including the GRS, HellenicSCORE, QRISK Hippisley-Cox, and PROCAM Assman (systemically reviewed in ref. [39]) are rarely used, mainly because they have poor predictive performance, or have too many predictors that are difficult to obtain, or have poor interpretation of the model [39]. For example, GRS models are based on the genotyping of dozens of genetic loci, but do not show high accuracy for the prediction of cardiovascular events [12, 13, 41]. The HellenicSCORE has an acceptable predictive accuracy (85%), but its specificity (20%) was very poor [42]. In the current study, we constructed three ML model that showed high accuracy and sensitivity for the classification of PCAD patients and controls. These were constructed using only 2 to 5 SNPs and several TCRFs. The small number of features required by this model means that the necessary information is readily obtained for most individuals and thus amenable to further prospective validation and clinical application. The nomograms provide an explicit explanation for each predictor, thus allowing the clinician to read the result and make a decision according to the optimal cutpoint. High sensitivity is a requirement for PCAD prediction models. The models constructed with RS-DT-FC1 and RS-DT-FC2 had higher accuracy and sensitivity than the model built with RS-DT-FC3 and were therefore recommended for future work.
Despite the high-performance classifiers and nomograms, this study has some limitations. Firstly, the data was from a single center and the sample size was relatively small. Secondly, this was a retrospective rather than a prospective study. Although the models could accurately classify individuals into PCAD and control groups, the predictive power of the models requires further validation in large prospective studies. This study also did not include other factors identified over the past 10 years and that may be linked to PCAD. Finally, the sample population was derived from a single race, thus limiting the universality of the models. Ideally, these models should be tested with larger samples and with different populations.
The selection of features required to build a ML model is likely to be the key determinant of the performance of that model. Addition of SNP information to TCRF information can improve the performance of ML models for the prediction of PCAD. A combination of features such as rs2259816, rs1378577, rs4961, rs10757274, hyperlipemia, smoking, GLU and TG or of rs1378577, rs10757274, smoking, diabetes, hyperlipemia, GLU and TG can be used to build high-performance prediction models for PCAD. However, further prospective research is required prior to application in practice. The nomograms presented in this study have widespread potential value and may help clinicians to score and interpret the results directly according to each eigenvalue. rs10757274 may be an important genetic marker associated with PCAD risk.
RS-DT-FC1, rs2259816, rs1378577, rs10757274, rs4961, smoking, hyperlipoidemia, glucose, triglyceride; RS-DT-FC2, rs1378577, rs10757274, smoking, diabetes, hyperlipemia, glucose, triglyceride; RS-DT-FC3, rs1169313, rs5082, rs9340799, rs10757274, rs1152002, smoking, hyperlipemia, high-density lipoprotein cholesterol; AP, Average precision of the positive recall (recall of PCAD); AUC, the area under the receiver operating characteristic curve; CAD, Coronary artery disease; CHOL, total cholesterol; C-index, concordance index; CGV, common genetic variations; FC, feature combination; GWAS, genome-wide association study; GRS, genetic risk score; GBC, gradient boosting classifier; GBCM, GBC model; GLU, Glucose; HDL-c, high-density lipoprotein cholesterol; HPC, high-performance classifiers; LDL-c, low density lipoprotein cholesterol; LASSO, the least absolute shrinkage and selection operator; LRC, logistic regression classifier; LRCM, LRC model; ML, machine learning; PCAD, Premature coronary artery disease; PCR, polymerase chain reaction; RFC, random forest classifier; RFCM, RFC model; SNP, single nucleotide polymorphisms; dt-SNPs, the SNPs with a differential trend; sd-SNPs, the SNPs with a significant difference; sd-TCRFs, the TCRFs with significant difference; TCRF, traditional cardiovascular risk factor; TG, triglyceride.
BL, CWT and SML conceived the project, designed the experiments, analyzed the data, constructed the models, wrote and approved the manuscript. LF, YX (Yujuan Xiong) and QD did the experiments, wrote and approved the manuscript. YX (Yang Xiang) and XC developed the case-control group including recruiting the patients and controls, and collecting the clinical and demographic data, wrote and proofread the manuscript. All authors have made a final approval of the manuscript.
This study conformed to the provisions of the Declaration of Helsinki (as revised in 2013), and was approved by the Institute Research Medical Ethics Committee of the Second Affiliated Hospital, Guangzhou Medical University (Approval No. 2016-ks-02). Written informed consent was waved due to this is a retrospective study.
We are very grateful to Yong-Gui Fu in the School of Life Science, Sun Yat-Sen University, for his contributions related to the methods in genotyping of SNPs and statistical analysis.
This work was funded by the General Programs of the National Natural Science Foundation of China (81873474), the Key Medical Disciplines and Specialties Program of Guangzhou (2021–2023), and Bureau of Education of Guangzhou Municipality (Grant Number: 14CXY03).
The authors declare no conflict of interest.
Publisher’s Note: IMR Press stays neutral with regard to jurisdictional claims in published maps and institutional affiliations.