


 , Edward J. M. Joy 3, Silvia Alonso 4, Solomon Gizaw 4, Samuel Gameda 5, E. Louise Ander 6, Elizabeth H. Bailey 7, Lolita Wilson 7, R. Murray Lark 7, Diriba B. Kumssa 7, Martin R. Broadley 7,8
1 Center for Food Science and Nutrition, Addis Ababa University, 1176 Addis Ababa, Ethiopia
2 Department of Food Science and Applied Nutrition, Addis Ababa Science and Technology University, Addis Ababa, Ethiopia
3 Faculty of Epidemiology and Population Health, London School of Hygiene & Tropical Medicine, Keppel Street, WC1E 7HT London, UK
4 Animal and Human Health Program, International Livestock Research Institute (ILRI), 1138 Addis Ababa, Ethiopia
5 International Maize and Wheat Improvement Center (CIMMYT), 1138 Addis Ababa, Ethiopia
6 Inorganic Geochemistry, Centre for Environmental Geochemistry, British Geological Survey, NG12 5GG Nottingham, UK
7 School of Biosciences, University of Nottingham, Sutton Bonington Campus, Loughborough, LE12 5RD Leicestershire, UK
8 Rothamsted Research, West Common, Harpenden, AL5 2JQ Hertfordshire, UK
Academic Editor: Elad Tako
Abstract
Introduction: Selenium (Se) is an essential mineral for livestock
health and productivity. In cattle, Se deficiency is associated with delayed
conception, growth retardation, and increased morbidity and mortality.
Methods: We conducted a survey of cattle serum (n = 224) and feed (n =
81) samples from two areas with contrasting human and cereal grain Se
concentration in Ethiopia. The fodder samples include stover, straw, hay and
pasture grass. Se concentration of the samples were measured using inductively
coupled plasma-mass spectrometry. Results: Serum Se concentration ranged
from 14.9 to 167.8
Keywords
- Amhara region
- cattle feed
- cattle selenium deficiency
- Ethiopia
Selenium (Se) is an essential mineral for humans and livestock. In livestock, Se is important for fertility and disease prevention [1]. Sufficient Se increases fertility rate, improves antioxidant defense systems and immunological potential [2]. Selenium-enriched diets improve milk production [3], reduce inflammatory diseases of the mammary gland [4, 5, 6], and improve growth performance [7]. Animal feeds high in Se help dairy cows to relieve oxidative stress during their transition from late gestation to early lactation due to increased metabolic activity [8]. Selenium deficiency in cattle is associated with several problems, including delayed conception, muscular degenerative disease in calves, myocardial necrosis and heart failure, immune dysfunction, increased risk of mastitis, abortion and perinatal mortality, and growth retardation in young animals [9]. It is also associated with white muscle disease which causes mortality to newborn calves and reduced productivity in growing and adult cattle [1].
We previously reported the presence of widespread human Se deficiency among the population of Ethiopia, with a strong spatial component [10]. For example, in the Amhara region, there was strong evidence of greater prevalence of Se deficiency among all demographic groups in western Amhara, but little or no deficiency was observed in eastern Amhara. This was consistent with studies of children reported previously [11]. Studies have since shown that the Se status of the Ethiopian populations is correlated with grain Se concentration of the most consumed cereal crops in Ethiopia (including maize, teff, and wheat), which in turn is linked to variation in soil and landscape properties [12, 13].
To our knowledge, there is no published information on Se status of cattle in Ethiopia. However, based on studies of soils, grains, and blood Se in people, we can expect Se deficiency to be widespread. Crop residues and stover are commonly utilized as cattle feed in Ethiopia, whose grains have already been shown to be highly variable in Se status [12, 13]. The constraining effect of Se deficiency to the livestock production is likely to be of great importance to countries like Ethiopia where the livestock sector contributes up to 80% of farmers’ incomes and 20% of the agricultural gross domestic product (GDP). In addition, Ethiopia is among the countries with the largest cattle population in the world [14]. Selenium improves the chemical composition of milk through increased Se concentration, and can reduce the concentration of saturated fatty acids, increase polyunsaturated fatty acids, and improve the organoleptic property of associated dairy products [15]. The present study analyzed Se concentration in serum of free grazing cattle, and in feed samples, using a design informed by previous studies [10, 11, 12, 13]. We hypothesized that cattle serum Se concentration in Ethiopia have similar spatial variation pattern with Se concentration in cereal grain and humans.
The study was conducted in East Amhara (South Wollo) and West Amhara (West Gojjam), Ethiopia Fig. 1). These areas were selected because we previously reported the presence of spatial variability among humans and staple crop Se status such that few or none of the populations from East Amhara had Se inadequacy while the majority (91.1%) of the populations in West Amhara were Se deficient [11, 12].
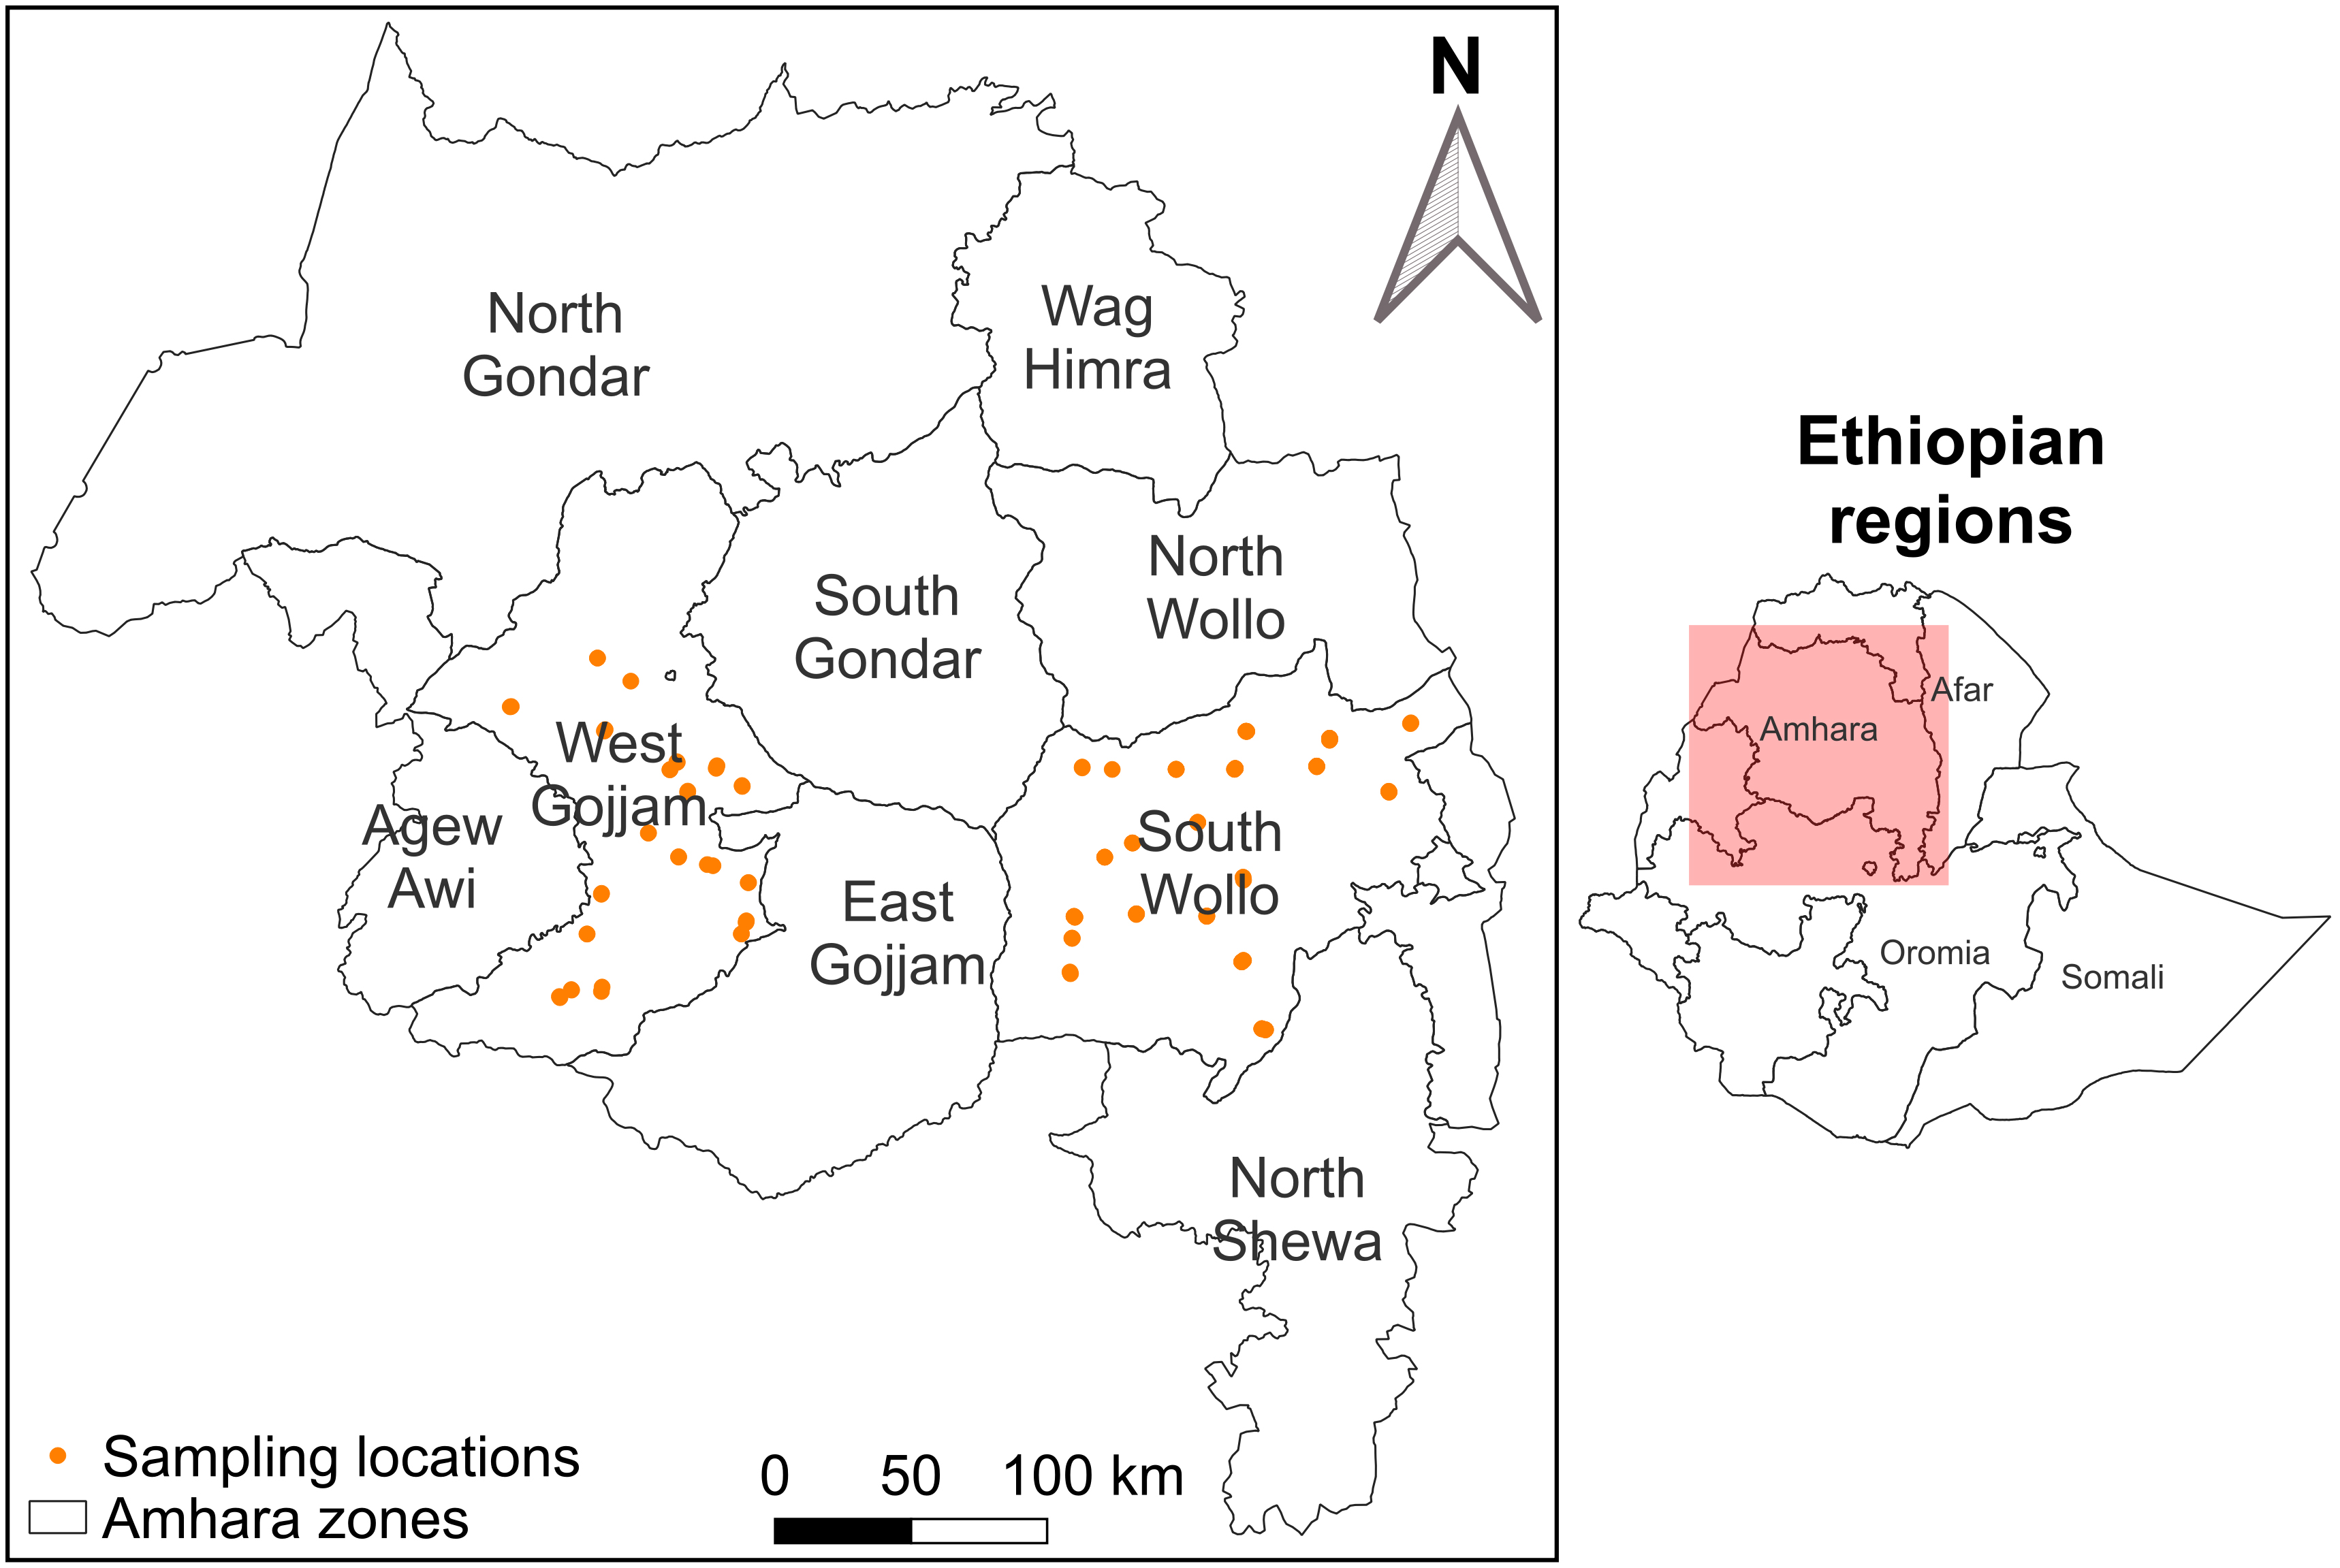 Fig. 1.
Sampling village locations (n = 20 villages per zone).
Using satellite imagery, 40 villages (20 in each zone) were selected to give reasonable spatial coverage over the target sampling areas of the two selected zones of the Amhara region. In each village, two farming households possessing cattle were selected from a pre-defined list and invited to participate in the study. The lists of farming households were obtained from the district agriculture bureau.
Sampling was conducted by personnel working at the respective zonal agriculture bureaus of the Amhara region. Vets and extension workers were part of the sampling teams. Training was provided on sample collection and preparation and assessment of potential risks on the field using standard procedures. Cattle blood sampling was conducted by qualified personnel after refresher training. The locations of sampling villages were loaded on computer tablets for mapping. In addition, the teams were provided with GPS devices to navigate to the villages from where cattle feed and blood samples were to be collected. Blood samples from cattle and feed samples were collected, subject to farmers’ consent.
Cows (lactating or non-lactating), confirmed as healthy by vets, were targeted for blood sampling (up to 3 per farm). Oxen or heifers were also included in the sampling in cases where the number of healthy cows in a farm were inadequate. The study included 224 cattle, including Zebu local breeds (n = 200) and Holstein Zebu cross breeds (n = 24). The cattle were in the age range of 1 to 13 years. The animals were squeeze chuted (allowed to pass through parallel fences that allows them to move forward only) and their heads elevated to locate the jugular vein. The neck area was wiped with antiseptic gauze to remove dirt and any debris. Approximately 10 mL of whole blood was drawn from the neck jugular vein using vacutainer needles by venipuncture. The samples were kept in an icebox until coagulation. Serum was separated by centrifugation in the field and transferred into vials. Duplicate subsamples were stored at –20 °C in the nearest health facility and transported to the laboratories of the International Livestock Research Institute (ILRI) in Addis Ababa, Ethiopia. One aliquot of each sample was transported on dry ice to the University of Nottingham, UK, for analysis.
Only the dominant feed types in the study areas, such as stover, straw, hay, or pasture grass, were included in the sampling. Commonly, cattle in Ethiopia graze freely on pasture and farmers were asked to locate the pastureland for their herds, where grass samples were collected from five spots 200–300 m apart and combined to represent one sample. In addition, samples of straw, stover and husks were collected (five sub-samples to represent one sample) from the center of stalks to avoid contamination with soil particles. Photographs of the sampling area and sample bags were taken for quality assurance purposes. The feed samples were kept in paper bags that allowed moisture escape, and transported to the laboratory at the Center for Food Science and Nutrition, Addis Ababa University. The samples were oven dried (60 °C, 12 h) and milled in a stainless-steel coffee grinder. The grinder was wiped clean before use and between samples with a non-abrasive cloth. About 20 g of each sample were shipped to the University of Nottingham for multi-element analysis. Only Se concentration result is included in the present study.
Approximately 0.4 g of dried and milled feed samples were digested in acid (68%
HNO
The concentration of Se in serum and feed samples was determined using inductively coupled plasma mass spectrometry (ICP-MS) at the University of Nottingham (Thermo Fisher Scientific iCAPQ, Thermo Fisher Scientific, Bremen, Germany). The detailed analytical procedure and conditions of the instrument are reported elsewhere [10, 12]. Accuracy was verified by the use of two Seronorm™ reference materials: L-1 (Lot 1801802) and L-2 (Lot 1801803) (Nycomed Pharma AS, Billingstad, Norway). These were reconstituted and then diluted in an identical way to the samples. Average Se recovery (%; n = 2) when compared to accredited values determined was 102% and 104% for L-1 and L-2, respectively.
Statistical analysis of data was performed using R software [16]. Descriptive statistics were computed for the residuals from an exploratory linear model for cattle serum Se concentration, with fixed effects set as sample origin (sub-region), livestock group (lactating or non-lactating) and livestock age. The analysis only considered cows (lactating and non-lactating) because, unlike oxen and heifers, these were reasonably balanced in terms of sample size between east and west Amhara. Similar exploratory analysis was done with a model for feed Se concentration with fixed effects set as sample origin and feed type.
The residuals from the exploratory models for both serum and feed samples were positively skewed. In addition, there was a pronounced increase in the dispersion of the residuals as the corresponding fitted value increased for both variables. These were both corrected by transformation of the Se data to natural logarithms. For the feed samples, one datum appears to be an outlier on the log scale falling out with Tukey’s outer fences [17]. This was one maize straw sample from west Amhara. This outlier was removed to avoid undue influence on variance parameter estimates.
Because the villages selected for sampling were chosen to give good spatial coverage, rather than randomly and independently, a linear mixed model was used for the final analysis of the data. The model had a spatial auto-correlated random effect with a Matérn correlation function. Distances between locations were computed from latitude and longitude by a spherical approximation, and so the smoothness parameter of the correlation function has an upper bound of 0.5. The profile likelihood function was used to select a value, which was at this upper bound for both variables. The model was fitted with fixed effects, in sequence as follows (i) a constant mean the only fixed effect, (ii) separate means for east- and west-Amhara as the fixed effects and (iii) sub-regional mean plus livestock type (lactating or non-lactating) as fixed effects (livestock type not retained). (iv) sub-regional mean plus livestock age as fixed effects (age not retained). On the addition of each fixed effect from (ii) onward, the null hypothesis of no relation between serum Se and the new effect was tested by the log-likelihood ratio [18], and the effect was retained or dropped accordingly. Similarly, for the feed samples, the linear mixed model (LMM) was fitted with (i) a constant mean the only fixed effect, (ii) separate means for east- and west-Amhara as the fixed effects and (iii) sub-regional mean plus feed type as fixed effects.
To compare Se concentration among feed types and feed sample origin (east vs west Amhara), four prior contrasts were selected before data analysis and presented standardized by their standard errors so that values outside [–2, 2] are of interest. These comparisons were included because showed a strong east-west trend in Se in staple grains [12, 13]. In addition, sorghum grain seemed to have a larger concentration of Se than did grain of other crops, and barley grain had a smaller concentration than others [13]. This defines two of the prior contrasts. In addition, we compared grazed grass with the other (dry) feeds, and compared grass hay with crop straw. After this analysis of prior contrasts, all pair-wise comparisons were computed among the main crop residues barley, maize, teff and wheat, and the p-values for these contrasts were adjusted by the criterion of [19] to control the family-wise error rate over the whole set of post-hoc comparisons at 0.05.
Statistics are reported for cows in the study set. Their serum Se concentration
ranged from 14.9–167.8
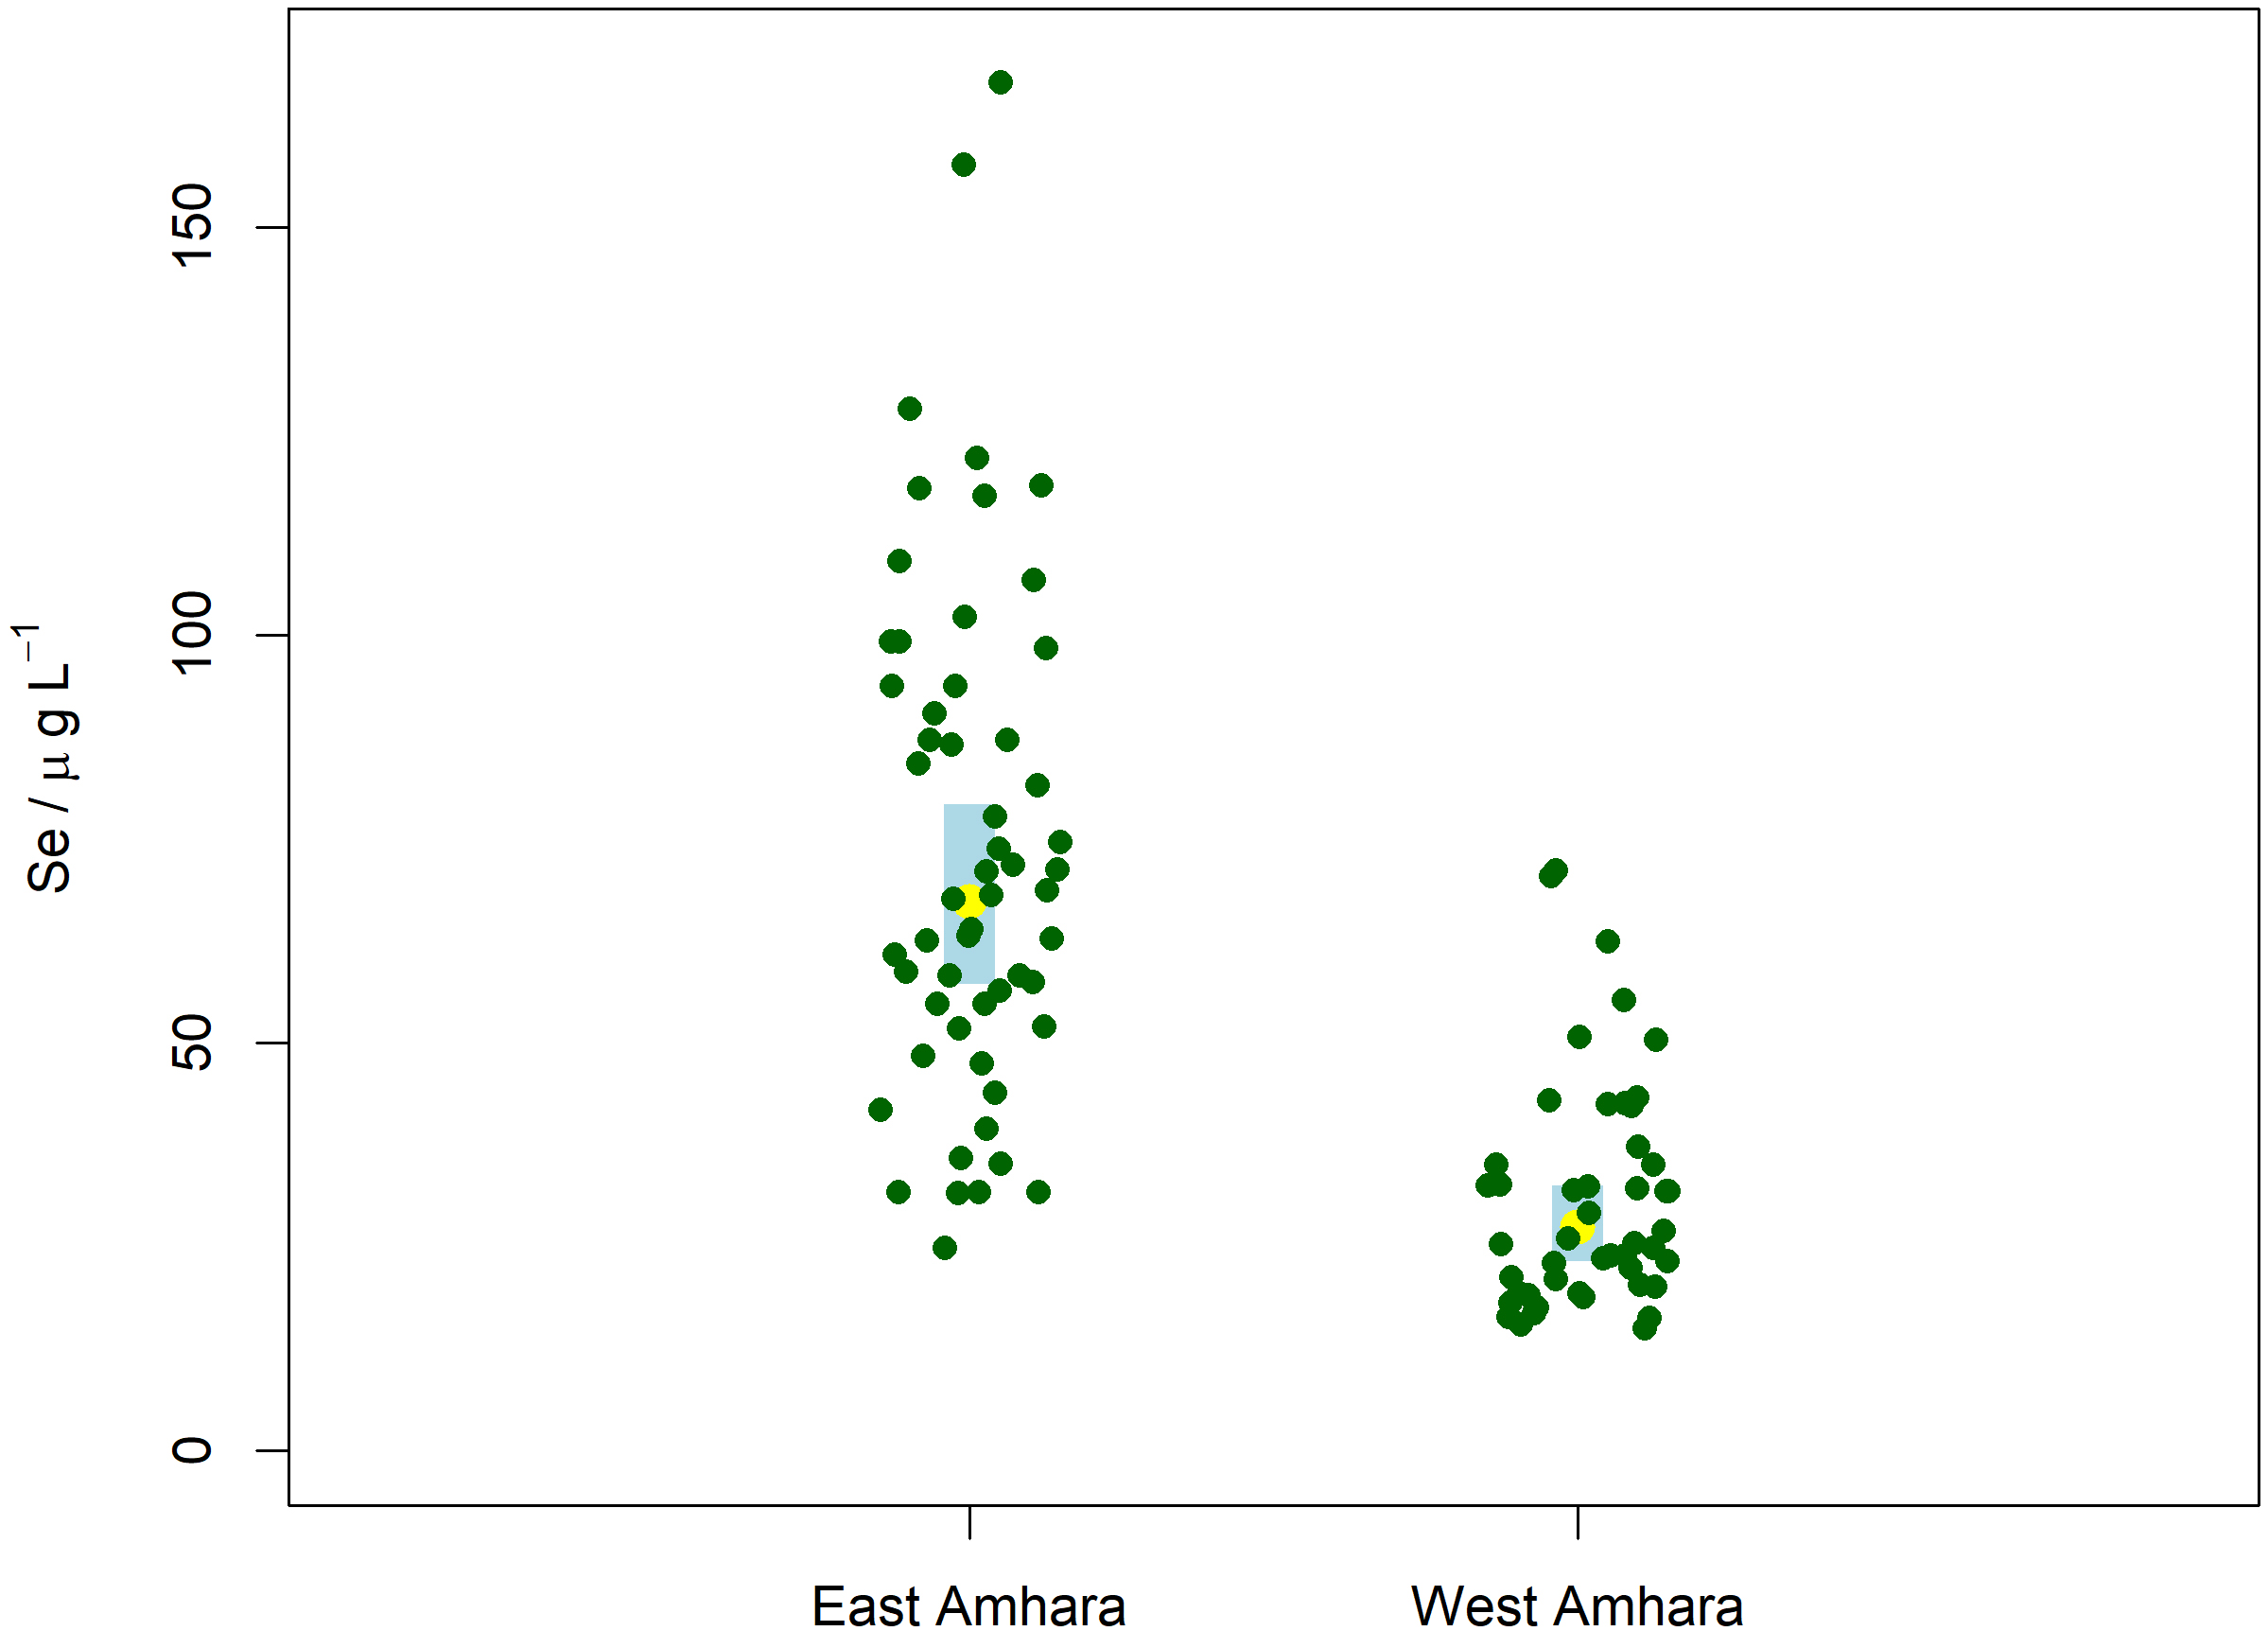 Fig. 2.
Comparison of serum Se concentration among cattle from East and West Amhara region, Ethiopia. The green discs represent the original serum Se data. The yellow discs are the back-transformed mean estimates for each group (median-unbiased) with the 95% confidence interval (blue band). Note that, within each region, a small lateral random “jitter” is added so that the individual data points can be visualized.
There was marked spatially-correlated variation in cow serum Se, but the spatial dependence is very short-range after the sample origin (East or West Amhara) is included in the model. Table 1 shows the log-likelihood ratio statistic which measures the effect of sub-regions, livestock type and livestock age on cattle serum Se concentration. There is no evidence for a difference between lactating and non-lactating cows, nor for any dependence on animal age. Only the area where the sample originated is associated with Se concentration in serum.
| Fixed effects | L | df | p-value | |
| (a). Cattle serum Se concentration | ||||
| Zones | 12.43 | 1 | 0.00042 | |
| Lactating or non-lactating cows | 0.45 | 1 | 0.461 | |
| Age of livestock in years | 0.44 | 1 | 0.506 | |
| (b). Feed Se concentration | ||||
| Zones | 12.10 | 1 | 0.0005 | |
| Feed type | 27.97 | 8 | 0.0002 | |
The Se concentration of feed samples (n = 81) was in the range of 0.05–269.3
| Feed type | n | minimum | maximum | median [Q1, Q3] |
| Barley straw | 11 | 0.9 | 47.7 | 13.4 [2.2, 32.6] |
| Wheat straw | 18 | 5.3 | 105.0 | 24.8 [11.9, 62.5] |
| Teff straw | 22 | 9.5 | 136.5 | 37.7 [25.9, 54.4] |
| Maize stover | 14 | 0.05 | 25.2 | 6.4 [2.2, 11.6] |
| 8 | 15.3 | 101.5 | 42.6 [22.2, 71.2] | |
| Sorghum stover | 2 | 215.9 | 269.3 | *242.6 |
| Finger millet straw | 2 | 12.1 | 23.4 | *17.8 |
| 4 | 41.1 | 68.4 | *53.0 | |
| *All such values are mean | ||||
In general, feed samples from East Amhara had greater Se concentration compared to the samples from West Amhara (Fig. 3), although the sample size is small there is evidence for such a difference (p = 0.0005, Table 1b). There is also evidence for differences among the feed types (p = 0.0002, Tabl 1b) even when the East-West difference is accounted for.
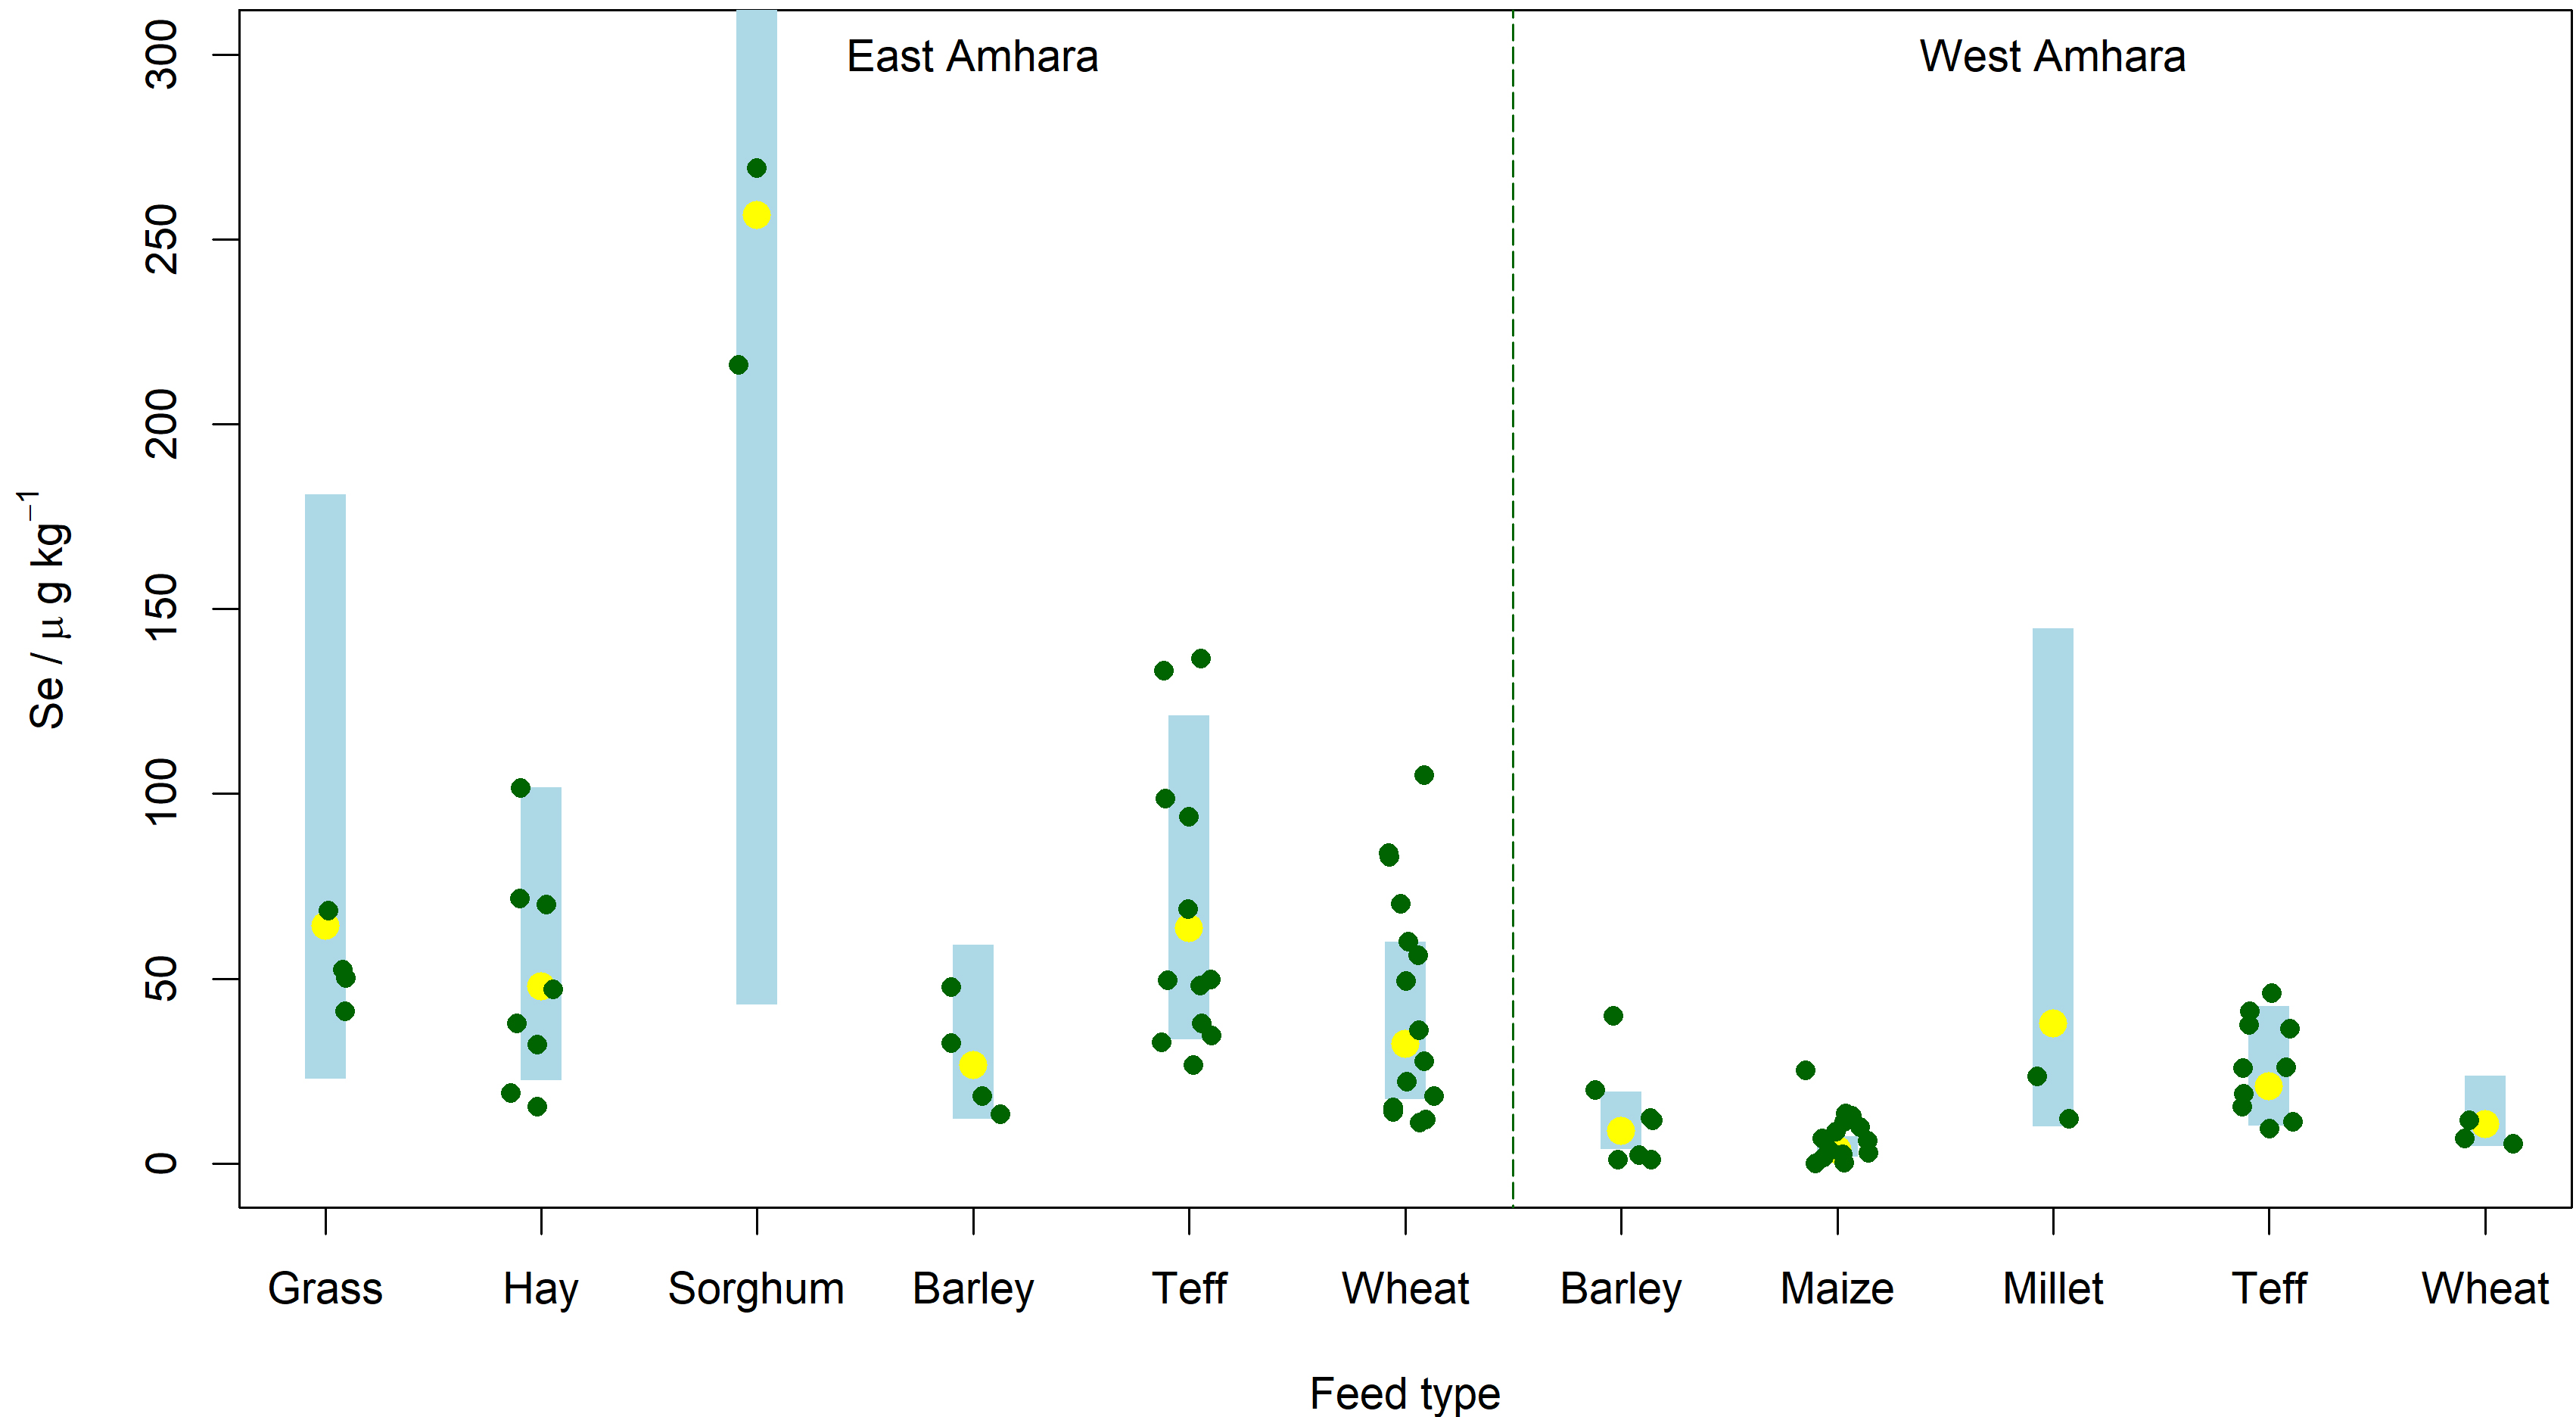 Fig. 3.
Selenium concentration of feed samples from East Amhara and West Amhara region, Ethiopia. The green discs are the original Se content of the feeds. The yellow discs are the back-transformed mean estimates for each group (median-unbiased) with the 95% confidence interval (blue band). Note that, within each category, a small lateral random ”jitter” is added so that the individual data points can be visualized.
Fig. 3 shows the dominant effect of the regional trend. It is also notable that the sorghum straw appears to have a larger Se concentration than other straws. Although there were only two samples these were both much larger than for other feeds. The contrast in Fig. 4 shows only weak evidence that barley straw has a smaller Se concentration than other straws (sorghum excluded).
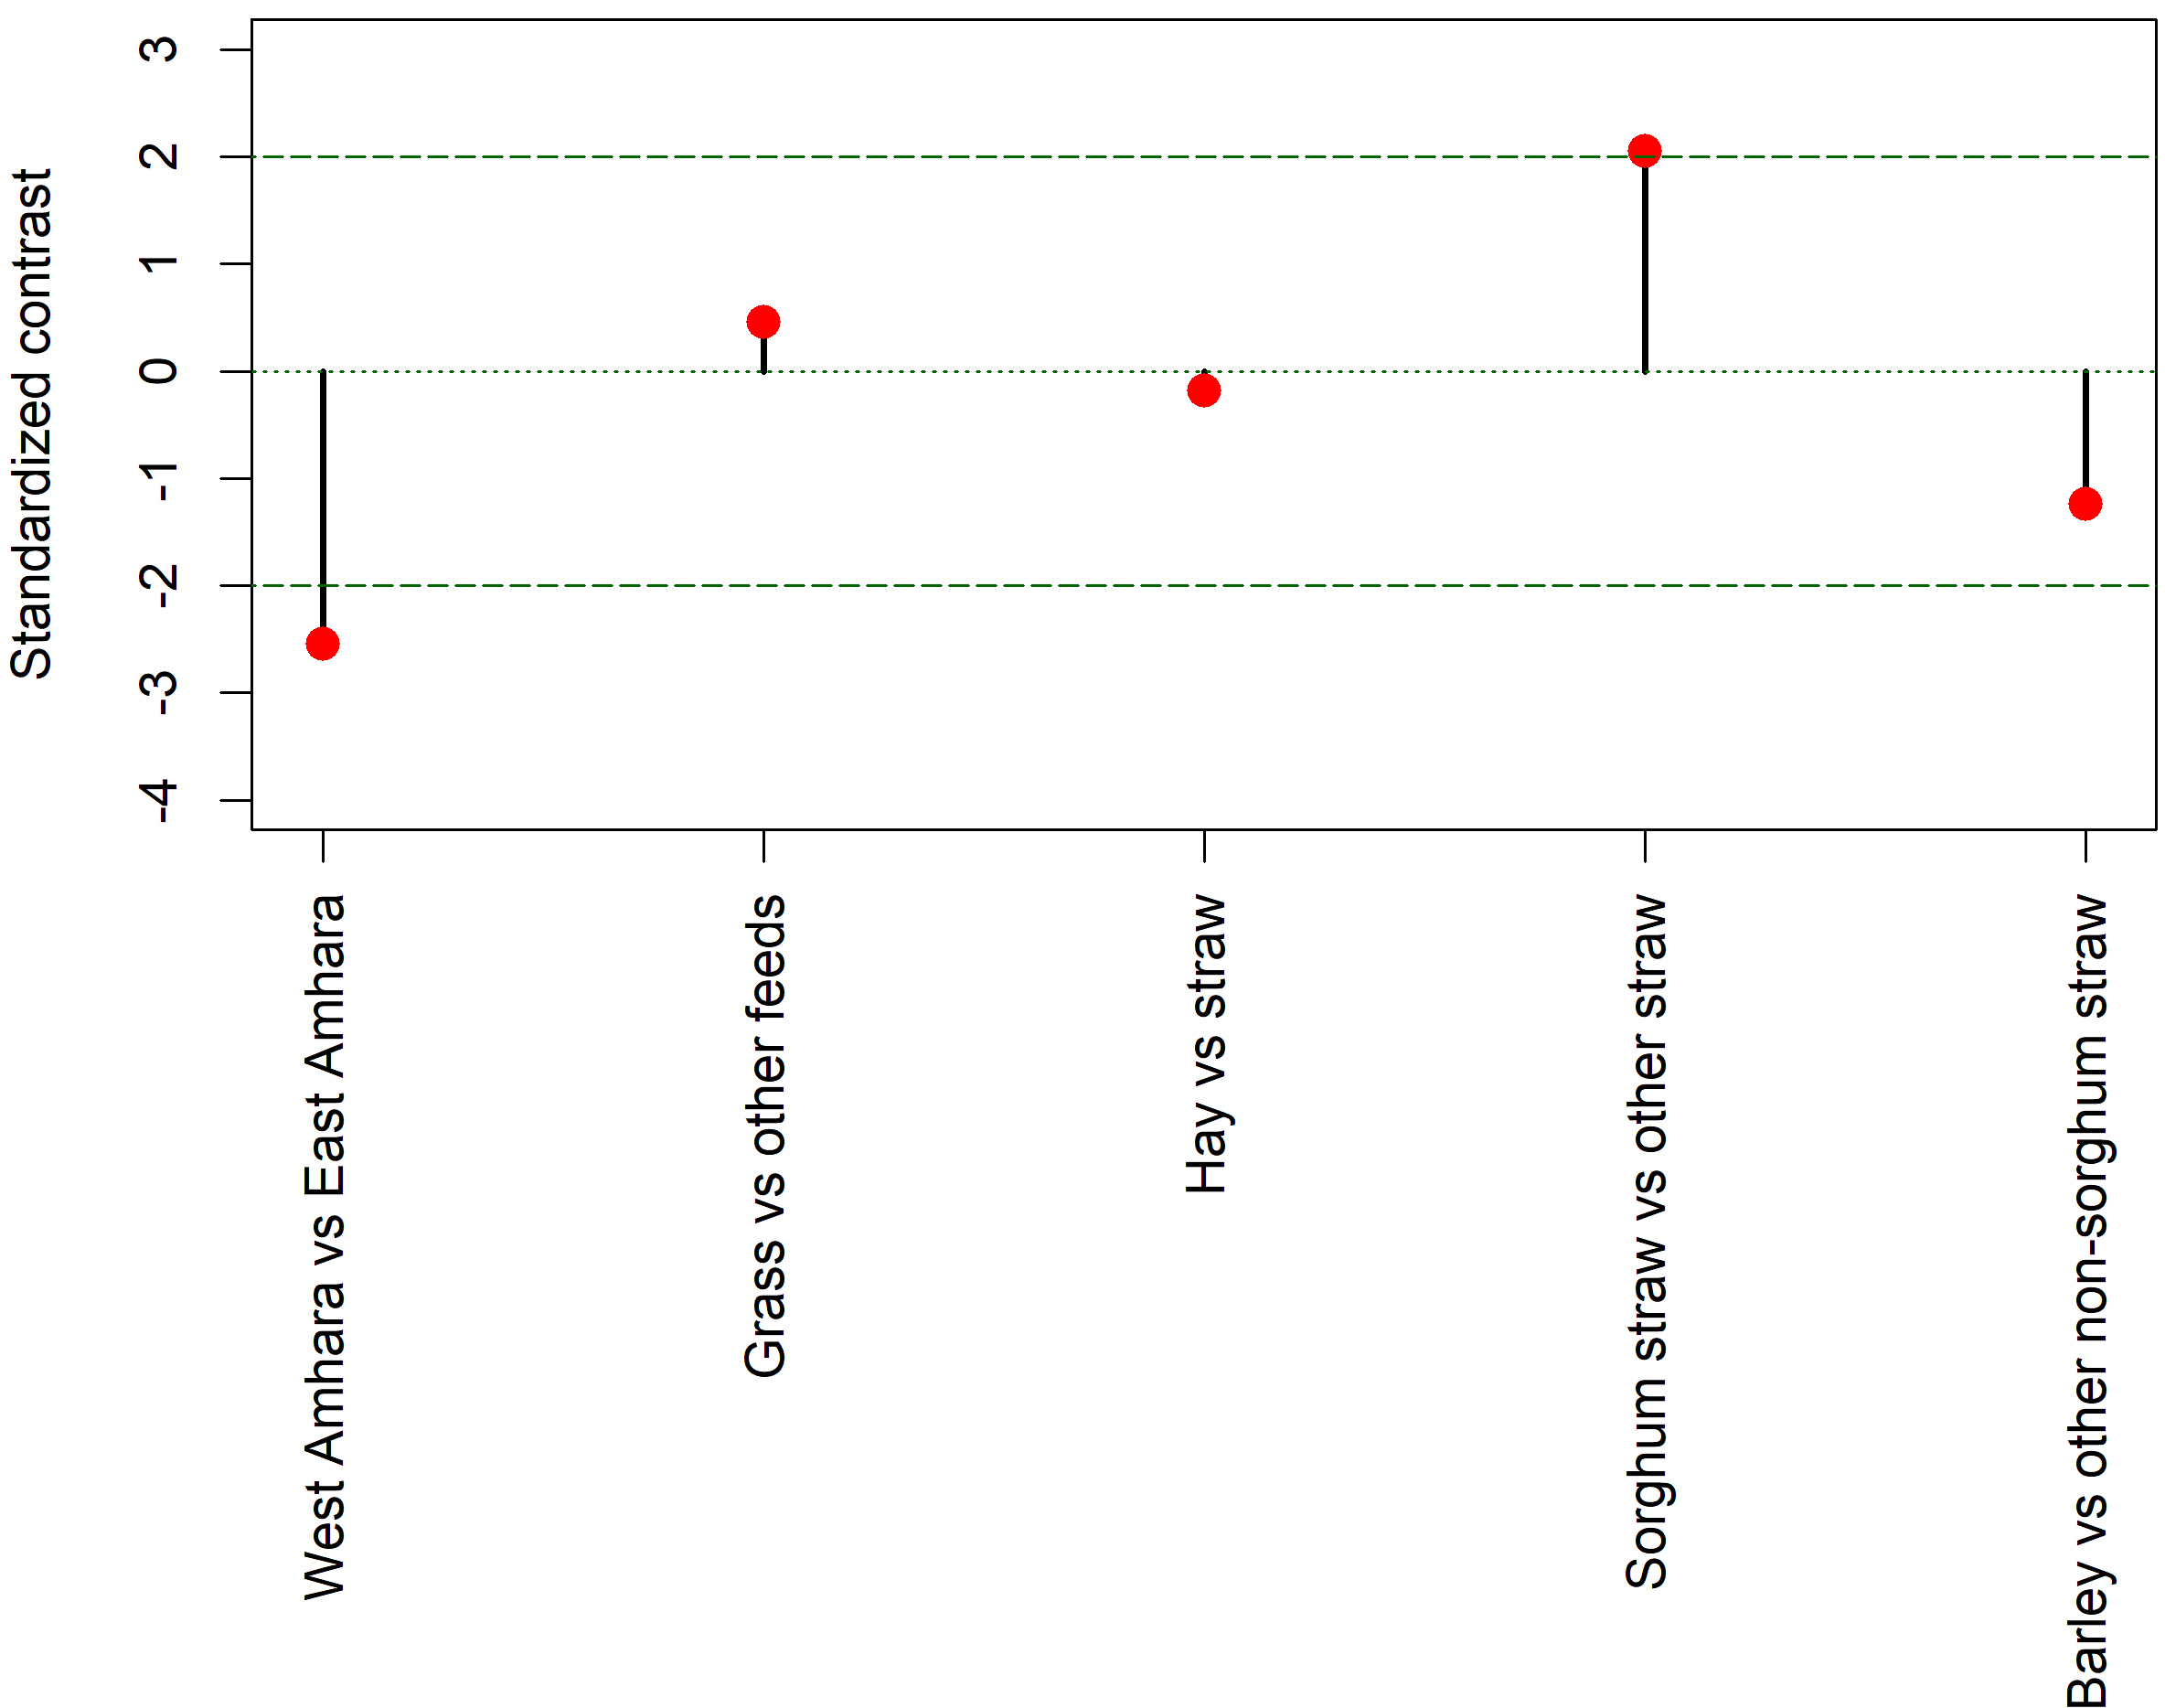 Fig. 4.
Comparison of Se concentration in feed samples from east Amhara and west Amhara region (the red dots are the standardized contrasts, i.e., the contrast divided by its standard error).
There is marked spatial variation in Se content of feeds, even after the regional (East-West) trend and feed differences were considered. The contrast between East and West Amhara feed Se concentration was consistent with the difference in serum Se concentration observed. This warrants regional surveys to map Se content of feeds and forage.
Results of log-likelihood ratio tests for the effects of sub-region and feed type on feed Se concentration shows that both geographical location (p = 0.0005) and type of feed (p = 0.0026) significantly influence feed Se concentration. Table 3 contains the log-likelihood ratio statistic for each comparison. The post-hoc comparisons suggest that teff straw is a richer Se source than barley straw and maize straw and (marginally) wheat straw. In addition, there is at least initial evidence that sorghum straw is the richest source of Se among feeds, although this is based on a very small sample.
| Comparison | L | df | p | Padj |
| Barley vs Maize | 1.35 | 1 | 0.2446 | 0.4893 |
| Barley vs Teff | 7.11 | 1 | 0.0077 | 0.0383 |
| Barley vs Wheat | 0.59 | 1 | 0.4425 | 0.4893 |
| Maize vs Teff | 12.98 | 1 | 0.0003 | 0.0019 |
| Maize vs Wheat | 3.41 | 1 | 0.0647 | 0.1940 |
| Teff vs Wheat | 5.75 | 1 | 0.0165 | 0.0658 |
The present study assessed Se concentrations in cattle serum and feed samples
from West and East Amhara region where contrasting human Se status, and crop
grain concentrations, had previously been established. The median serum Se
concentration was 41.4
Ethiopia is one of the countries in the world with the largest cattle population [14]. However, the contribution of the livestock sector to the national economy is below its potential. Research has identified several factors hindering the development of the livestock sector in the country, including low rates of reproduction, poor feeding and healthcare practices and facilities, poor breeds, and low capital investment related to the sector [21]. The present study shows high prevalence (79.8%) of Se deficiency in cattle from the Amhara region but with spatial variation such that significantly greater deficiency prevalence was observed in cattle from West Amhara than from East Amhara. This result may suggest that the deficiency could be affecting the performance of the livestock sector in the country. Selenium deficient cattle are at higher risk of reduced growth or weight gain affecting animal fattening and meat production. The deficiency is also associated with weakened immunity in cattle which further exacerbates morbidity and low productive efficiency [22]. Selenium deficiency is also a problem of animals in other countries. For example, in Poland, Se deficiency was found in 50% of cattle. The study also reported the presence of Se deficiency variation among cattle type that 40% of cows, 80% of calves, 100% of heifers and 90% of bulls were affected [23]. However, such analysis was not possible in our study due to the unbalanced nature of the samples. Similar to results of the present study, Se deficiency was prevalent in cattle from all regions, however, there was apparent regional variation. Unlike the present study where age of cattle was not a significant factor for serum Se concentration variation, in Poland, Se deficiency was observed more frequently in young animals [23]. An earlier study in the United States also reported that about 18% of cows had severe or marginal Se deficiency and the Se status varied by geographical region and those from Southeastern states had higher rates of Se deficiency compared to cattle from other regions [20]. Se deficiency is also an important challenge to the pastoral sector in New Zealand [24].
Consistent with the distribution trend of cattle serum Se concentration, feed samples from West Amhara had lower Se concentration than East Amhara samples. Previous studies in the region [10] and the country [11] reported the presence of spatial dependence of human Se status. In addition, similar trends of spatial variability of Se concentration were observed in grain samples attributable to environmental and soil factors including soil pH, soil organic matter, temperature, rainfall and topography [12, 13].
Previously between-species variation in grain Se concentration has been reported in Ethiopia, where sorghum, finger millet and teff (Eragrostis tef (Zucc.) Trotter) had typically higher Se concentration, while barley and maize grains had the lowest Se concentration [13]. Consistent with the grain data, in the present study there was between-species variation in crop straw Se concentration, with sorghum being the richest source of Se, and teff straw containing higher Se than barley, maize, and wheat straw. This suggests that environmental controls, via the grain crops which can be cultivated at a given location, and the management effects where these are then grown by the farmer, will influence their livestock dietary supply of this essential micronutrient. Yet, this is an invisible trait to the farmer, with no role confirmed for Se in plant health. It is also likely that inter-connected geographic and species controls influence other mineral nutrients in livestock diets in this region, and these also warrant further investigation for their effects on well-being and productivity of the animals.
Results of the present study and previous studies reveal the presence of a high rate of Se deficiency in humans, plant foods and cattle from wider areas of Ethiopia. This suggests the need to communicate this aspect of deficiency to identify solutions that will increase Se nutrition for improving animal wellbeing and productivity, and human health. Crop Se fertilization helps to alleviate Se deficiency in humans [25]. This strategy may also help to improve Se status of cattle feeding on crop stovers, and the Se concentration in livestock products including milk and meat. Large-scale future studies to investigate the association between location and cattle Se deficiency in Ethiopia are important to design targeted interventions. Studies estimating the economic cost of Se deficiency to the agricultural sector in general and the livestock sector in particular is key to seek the attention of policy planners and justify the importance of the subject among other competing priorities.
The strength of this study includes generation of data on feed and serum from collocated areas, random selection of farms from villages that give spatial balance over study areas, and sufficient number of samples to observe a clear difference in Se status. Consequently, the design and sampling approach for larger surveys can now proceed on an informed basis. However, this study is based on serum analysis which reflects only recent Se exposure. In addition, this study had small area coverage. Furthermore, feed samples in the present analysis were both small in number and included only dominant feed types.
This study reveals that Se deficiency in cattle is highly prevalent though spatially variable in the Amhara region. Feed and cattle serum samples from east Amhara had significantly higher Se concentrations compared to respective samples from west Amhara. In addition, feed types were significantly associated with feed Se concentration. Selenium deficiency may affect productive efficiency of the livestock sector in Ethiopia, which should be explored together with other micronutrients, allowing interventions to enhance nutritional status in cattle to be identified. The potential for geographic variation in the nutritional quality of animal products (meat and dairy) entering the human food chain should also be studied. Further studies with larger sample size covering a larger area are needed. In addition, studies to better understand the consequences of Se deficiency to cattle productivity and the livestock sector are required.
ABS, Access and Benefit Sharing; CRM, Certified Reference Material; GDP, Gross Domestic Product; GPS, Global Positioning System; ICPMS, Inductively Coupled Plasma Mass Spectrometry; ILRI, International Livestock Research Institute; LMM, Linear Mixed Model; NIST, National Institute of Standards and Technology; Se, Selenium.
Conceptualization—KH, DG, EJMJ, SA, SG (Solomon Gizaw), SG (Samuel Gameda), ELA, RML, DBK, MRB; Data collection and supervision—KH, DG, SG (Solomon Gizaw); Sample preparation and analysis- KH, EHB, LW; Statistical analysis—RML; Original draft preparation—KH and DG; writing—review and editing— KH, DG, EJMJ, SA, SG (Solomon Gizaw), SG (Samuel Gameda), ELA, EHB, LW, RML, DBK, MRB. All authors have read and agreed to the published version of the manuscript.
Ethical approval for the study was obtained from the International Livestock Research Institute (ILRI) Institutional Research Ethics Committee (Ref. no. ILRI-IREC2018-33). Blood cattle and feed samples were collected subjected to farmers consent. Serum samples were transferred from ILRI, Ethiopia, to the University of Nottingham, UK, for analysis under a material transfer agreement and in compliance with access and benefit sharing (ABS) requirements.
The authors would like to thank the Amhara agriculture bureau, data collectors, supervisors and participating farmers. Also Kenneth Davis for assisting in the sample preparation and laboratory analysis.
Funding for part of this study was provided by the International Livestock Research Institute (ILRI) through the CGIAR Research Program on Agriculture for Nutrition and Health and by the International Maize and Wheat Improvement Center (CIMMYT) from its GIZ project Soil Protection and Rehabilitation for Food Security. This work was also supported, in part, by the Bill & Melinda Gates Foundation [INV-009129]. Under the grant conditions of the Foundation, a Creative Commons Attribution 4.0 Generic License has already been assigned to the Author Accepted Manuscript version that might arise from this submission. The funder had no role in the design, execution, analyses or interpretation of the data.
The authors declare no conflict of interest.
References
Publisher’s Note: IMR Press stays neutral with regard to jurisdictional claims in published maps and institutional affiliations.