


 , Jun Tayama 2,3, Shin Fukudo 2
1 Department of Rehabilitation, Graduate School of Health Sciences, Saitama Prefectural University, Koshigaya, 343-8540 Saitama, Japan
2 Department of Behavioral Medicine, Tohoku University Graduate School of Medicine, Sendai, 980-8575 Miyagi, Japan
3 Faculty of Human Sciences, Waseda University, Mikajima, Tokorozawa City, 359-1192 Saitama, Japan
Academic Editor: Sébastien Kindt
Abstract
Background: Young adults with irritable bowel syndrome (IBS)
occasionally exhibit specific abdominal symptoms, including abdominal pain
associated with brain activity patterns. Decoded neural feedback (DecNef) is a
biofeedback exercise that allows symptomatic people to exercise self-control over
their brain activity patterns relative to those without symptoms. Thus, DecNef
can be used to self-control abdominal pain in patients with IBS. To establish a
DecNef practice for IBS, it is necessary to develop a classifier that can
distinguish the electroencephalography (EEG) patterns (EEG signatures) of IBS
between symptomatic and healthy people. Additionally, the accuracy of the
“classifier” must be evaluated. Methods: This study analyzed EEG data
obtained from symptomatic and asymptomatic young adults with IBS to develop a
support vector machine-based IBS classifier and verify its usefulness. EEG data
were recorded for 28 university students with IBS and 24 without IBS. EEG data
were frequency-analyzed by fast Fourier transform analysis, and IBS classifiers
were created by supervised learning using a support vector machine.
Results: The diagnostic accuracy of IBS symptoms was verified for the
whole brain and the frontal, parietal, and occipital regions. We estimated
Keywords
- irritable bowel syndrome
- electroencephalogram
- support vector machine
- supervised learning
- self-management
Irritable bowel syndrome (IBS) is a disorder associated with the dysfunction of the brain–gut interaction, characterized by chronic recurrent abdominal pain and altered bowel movements [1, 2, 3]. In addition, IBS patients frequently present with symptoms associated with anxiety, depression, and somatization [4]. These symptoms affect the quality of life (QOL) of IBS patients [5], and the severity of abdominal symptoms in IBS is a predictor of reduced QOL in relation to physical health [6]. The symptom severity can be evaluated according to the IBS subtype Rome IV criteria to understand the pathophysiological mechanisms accurately [7]. The prevalence of IBS is estimated to be 4.1% of the worldwide population, according to a large multinational study [8], and IBS is particularly common in young adult women with low body mass index in Japan [9, 10]. However, obesity and IBS are positively correlated, as observed in Western populations, resulting in regional differences in prevalence [11]. As a treatment strategy for IBS, maintaining the rhythm of life and improving lifestyle can help reduce mild IBS symptoms [12]. Lifestyle and dietary advice (low FODMAP: Fermentable Oligo-, Di-, Mono-saccharides, And Polyols) is offered as an option for IBS symptom relief, especially in the initial management [13]. However, frequent and prolonged abdominal pain often interferes with daily activities, like commuting to school or work, among patients with IBS, even in mild cases. Relieving abdominal pain poses a challenge in rehabilitation efforts to improve the patients’ quality of life, and guidelines for the treatment of IBS recommend pharmacotherapy for frequent diarrhea or constipation [14, 15]. For moderate-to-severe IBS, drugs that modulate central neurotransmission—such as those that raise visceral sensory thresholds—have certain advantages, especially antidepressants [16]. If a patient does not respond to these medications, psychosomatic treatments such as cognitive-behavioral therapy, hypnotherapy, and autogenic training have also been shown to be effective [17, 18]. Therefore, the development of a self-care strategy that raises the visceral perception threshold for IBS can be an important form of non-pharmacological rehabilitation for such patients.
Abdominal pain (the main symptom of IBS) is subjective because the signals from the abdomen undergo processing in the brain [19]. Event-related potentials in the right parietal lobe region of the brain are normalized by attention bias modification in IBS patients [20]. Moreover, brain research suggests that gastrointestinal hypersensitivity is a diagnostic marker of IBS [21]. When not performing a specific function, human brain functions form a distinctive default mode network (DMN) or resting state functional connectivity (RSFC) [22]. A study on the DMN used a method to identify the activity patterns and brain regions that can discriminate between diseased and healthy groups [23]. When using an analytical method based on machine learning, the brain activity of the disease group or participant is matched to the brain activity pattern (EEG signature) to predict the patient’s condition [24]. In a previous study, we validated the DMN of the brain–gut correlation by investigating functional brain imaging data collected during a gastrointestinal stretch stimulation [25]. The results showed weak functional connectivity between the dorsolateral and medial prefrontal cortices in the DMN of symptomatic patients with IBS, suggesting that they are sensitive to gastrointestinal perception. Among the brain regions that form the DMN, the posterior cingulate cortex is particularly involved in “preoccupation with one’s self” [26]. However, humans often experience thoughts unrelated to a given task, and this phenomenon is now being examined for its positive medical applications [27, 28]. In other words, it is hypothesized that IBS symptoms will decrease if the DMN in IBS patients can be induced to the same patterns as in people without abdominal pain.
Similar biofeedback techniques have been used for stress management, rehabilitation of motor paralysis, relaxation, and mental training in sports [29, 30, 31, 32]. Among the various biofeedback methods, the neurofeedback technique is used as an index for regulating brain activity in a method known as decoded neural feedback (DecNef). This is a method of training the brain network to discriminate the differences between the pathological state of brain activity at rest or during a task and to adjust the activity of relevant brain regions through self-control mechanisms [33]. In DecNef, biological information (such as EEG and brain images) is first presented to subjects in the form of easily recognizable representations such as sound, light, and images. Subsequently, the participant adjusts their biological responses based on this information. Establishing DecNef in practice requires a classifier that can discriminate the different biological signals between IBS patients and healthy subjects and a display device that provides feedback to the treatment participant regarding decoded brain information [34]. The IBS classifier is a tool used to predict the degree of abdominal pain in symptomatic patients and judge the effect of therapeutic intervention. Current classifiers use functional magnetic resonance imaging (fMRI) to obtain detailed functional brain images [35, 36]. However, it may be possible to develop a classifier that discriminates between symptomatic and asymptomatic patients with IBS by analyzing real-time changes in the frequency and amplitude of the electroencephalogram (EEG). This may help predict the degree of abdominal pain in symptomatic patients and evaluate the effect of therapeutic intervention. Moreover, if an EEG classifier is developed for IBS, DecNef methods may be developed for the self-regulation of abdominal pain in patients with IBS.
Brain research using machine learning is based on output data from the examination of brain activity, and researchers have estimated the presence or absence of a phenomenon using such brain activation data [37]. Using this method, IBS patients are classified not only on the basis of abdominal pain, but also on whether their specific brain activity corresponds to that of the disease group [38, 39]. Therefore, it is possible to diagnose diseases, track the course of treatment, and evaluate interventions using brain activity data. In machine learning algorithms, the brain activity associated with a characteristic phenomenon (for example, abdominal pain) is detected and examined (for example, using principal component analysis) to create a classifier that can discriminate between diseased and healthy groups. In IBS patients, we can evaluate the accuracy of discriminating DMN patterns characteristic of IBS by matching the brain activities of healthy people to a classifier. Because the DMN is closely associated with the recognition process of visceral perception, this function can create a new objective scale for evaluating abdominal pain and verifying the feasibility of DecNef. Therefore, the purpose of this study was to verify the usefulness of a classifier as a basis for the development of DecNef by analyzing EEG data obtained from symptomatic and asymptomatic patients with IBS.
In this study, we used a cross-sectional study design, created a classifier to discriminate EEG features between symptomatic and asymptomatic patients with IBS, and verified the rate of positive diagnoses of IBS in symptomatic patients using EEG data.
The eligibility criteria for study participants were as follows: (1) university
students aged
University students were recruited between March 2013 and September 2020 for the verification of EEG-based discrimination of IBS symptoms. For the recruitment of participants, an e-mail containing the outline of the experiment was prepared and sent to university students after approval by the Ethics Committee. The research procedure was explained to the participants who met the eligibility criteria, and all participants consented to participate in this study.
Participants who met the eligibility criteria during the study period were included. Prior to the study, verbal and written explanations were provided to the participants, and those who provided written consent were asked to participate in the experiment. Based on previous studies comparing EEG results in symptomatic and asymptomatic patients with IBS, we determined a sample size of 11 participants in each group. Based on estimated data loss, the group size was set to 30. To investigate whether the EEG data can discriminate the presence of IBS, 15 participants were randomly selected using a random number table and included in the first analysis (derivation study) according to their symptoms. After fitting the data to a machine learning algorithm, a second analysis (validation study) was conducted to investigate whether this classifier could discriminate the EEG data of IBS patients. The remaining participants were included in this validation study. The data obtained were analyzed by a statistician blinded to the presence or absence of IBS symptoms, in a single-blind study design.
This study was approved by the Review Boards of Saitama Prefectural University (#24075) and Nagasaki University (#13072632). The principal investigator met with the students who met the eligibility criteria, explained the purpose and method of the study, and obtained informed consent. The students were informed of their right to withdraw from the study at any time. At the time of enrollment, the students provided written consent for the collection and use of their key characteristics and basic data.
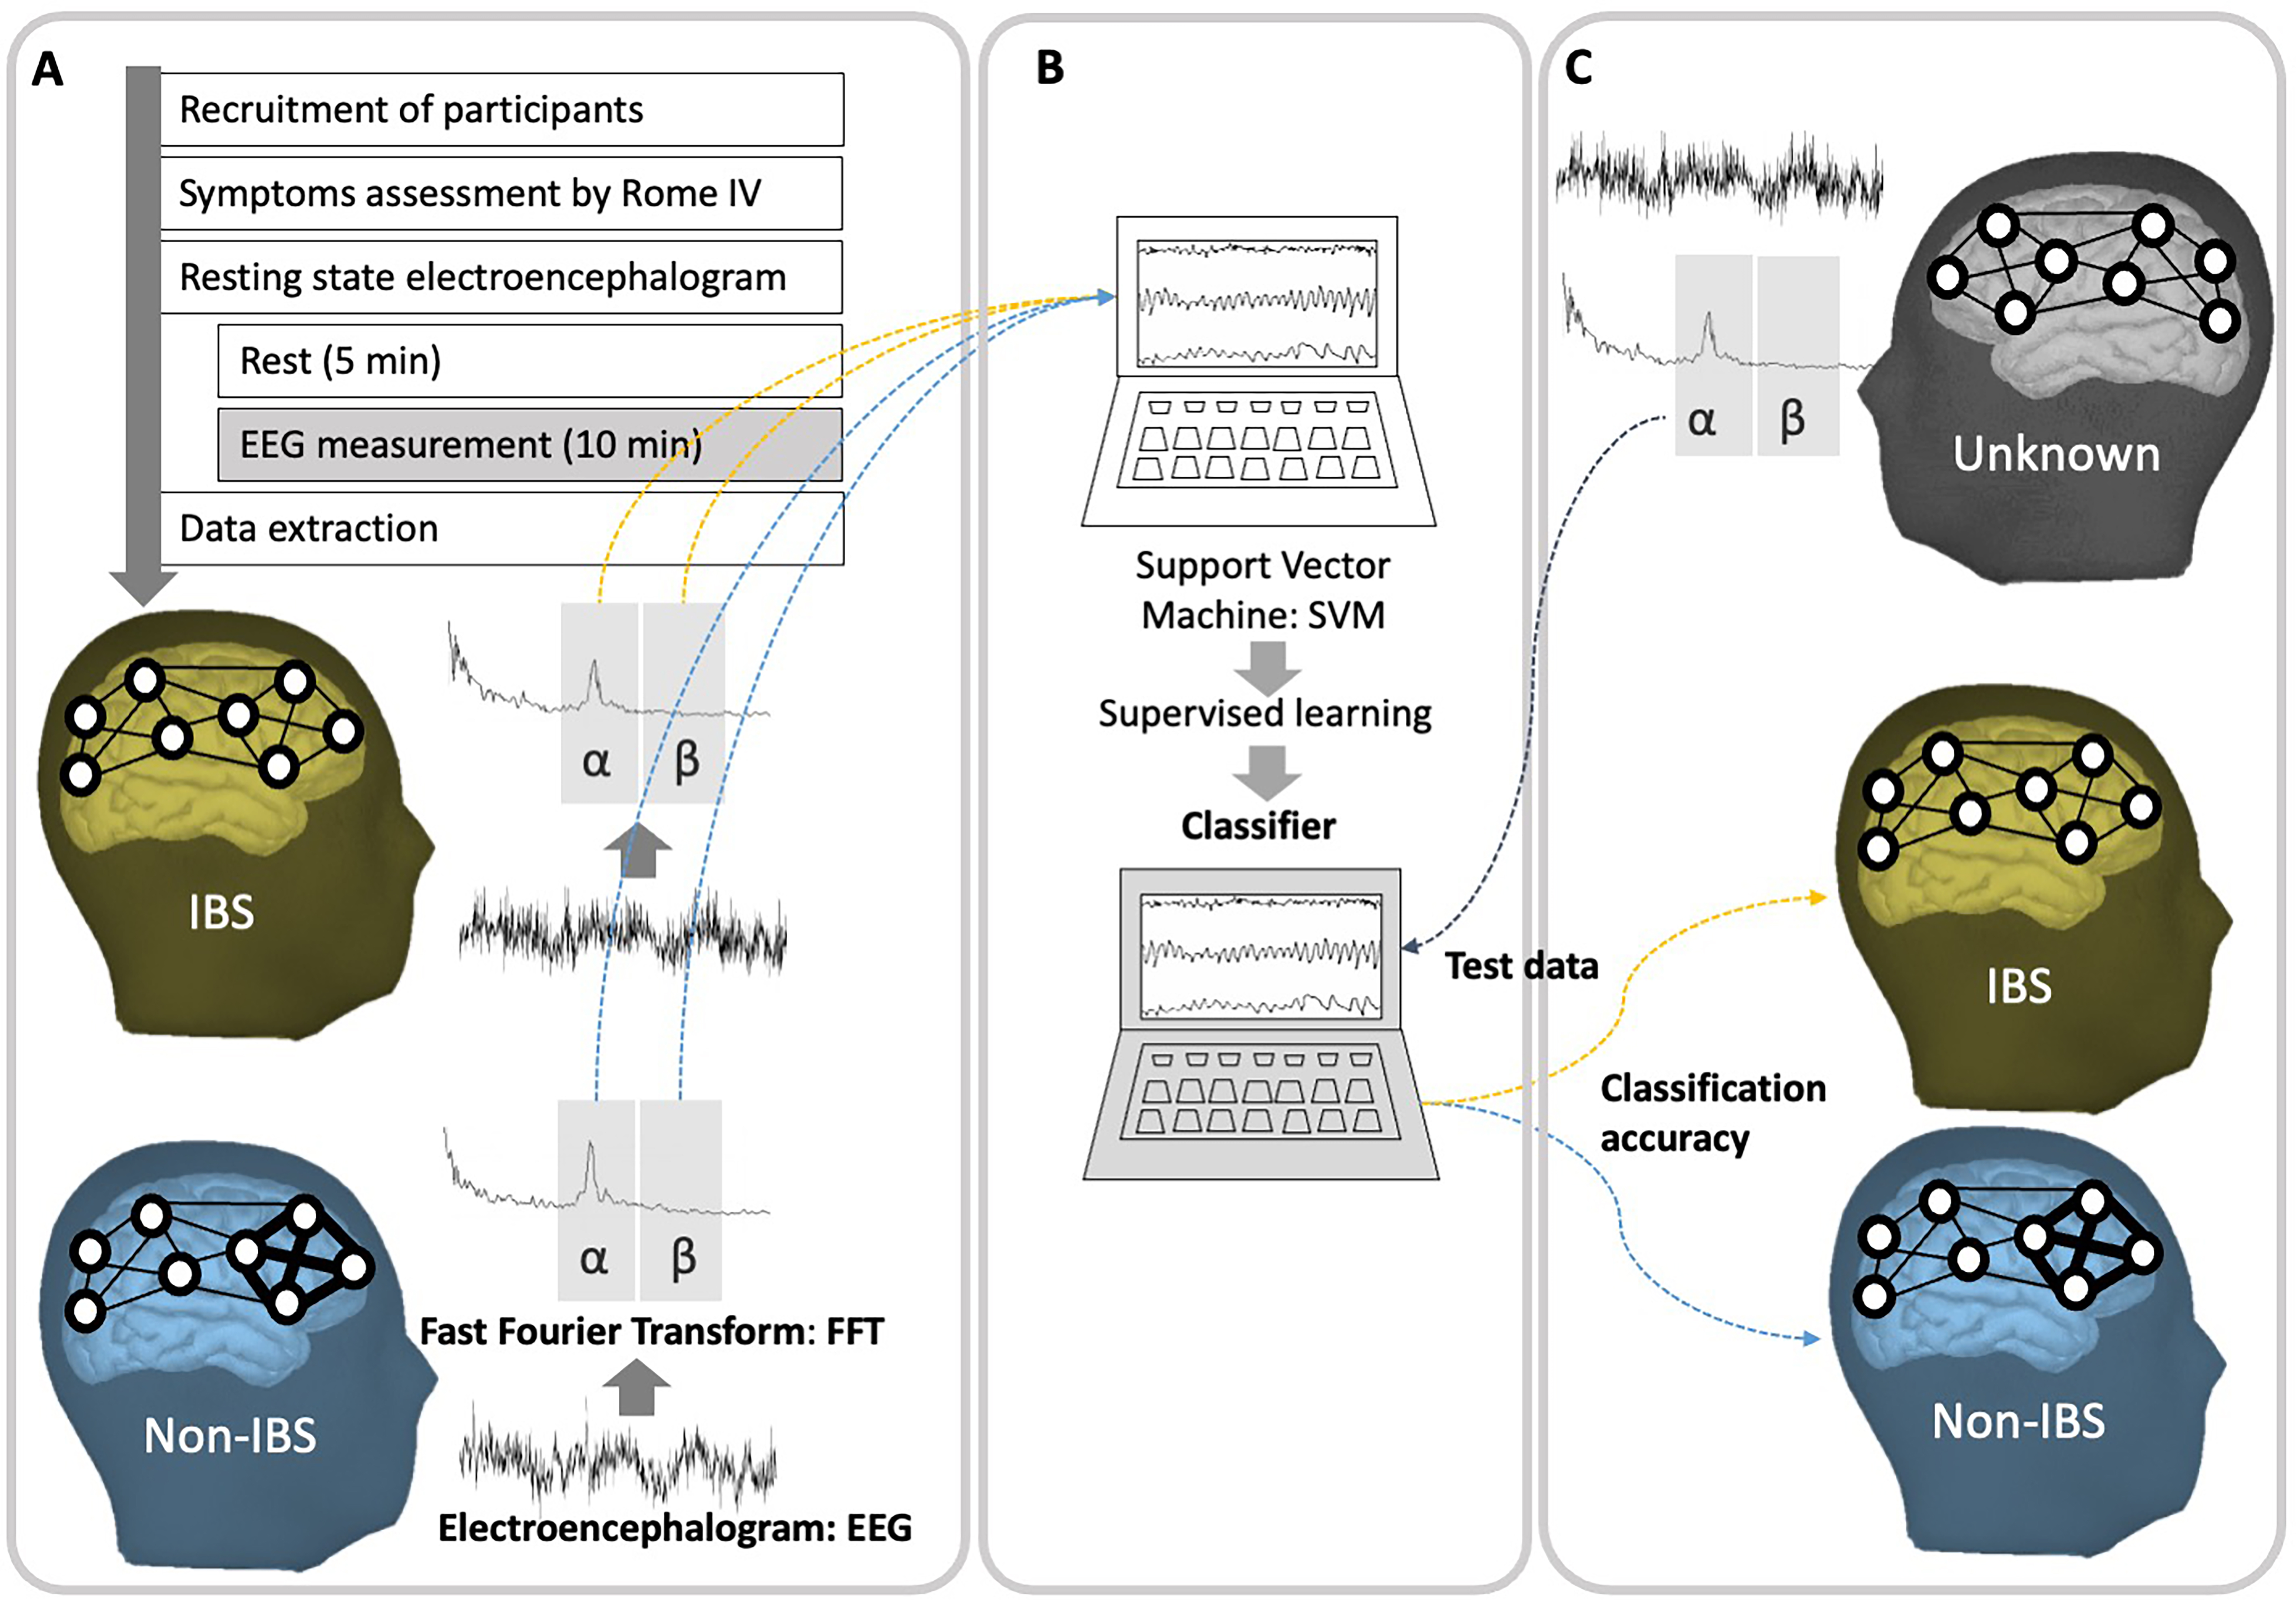
Among students who met the eligibility criteria, the presence or absence of IBS symptoms was determined using a questionnaire based on the Rome IV criteria [40]. Students with IBS symptoms were defined as the IBS group, and those without IBS symptoms were defined as the non-IBS group. In the experiment, we first administered a questionnaire to the participants regarding IBS symptoms. Next, the participants were placed in a supine position with their eyes closed for 5 min, and then underwent EEG measurements for 10 min (Fig. 1).
 Fig. 1.
Schematic representing the electroencephalogram (EEG) analysis
and tests for the predictive accuracy of the irritable bowel syndrome (IBS)
classifier. (A) A flowchart of the study protocol from the recruitment of
participants to EEG data analysis. Participants assessed for the presence of IBS
symptoms are subjected to EEG examination, and the target frequency bands
(
After recording the height, weight, and body mass index of consenting participants, we administered the EHI—a 10-item questionnaire in which the participants answered questions regarding their use of the left and right hands. A positive value indicated right-handedness, whereas a negative value indicated left-handedness. The Rome IV self-administered questionnaire was also administered, in which participants answered questions regarding the intensity and frequency of abdominal symptoms.
EEG was recorded using Ag/AgCl electrodes at 11 sites (F3, F4, C3, C4, P3, P4,
O1, O2, Cz, Fz, and Pz) in accordance with the international 10–20 method. A
reference electrode was placed on the right earlobe. During EEG acquisition, the
sampling time was 1 ms, and the impedance between the electrode and scalp was
adjusted to less than 50
EEG data were visually examined to confirm the absence of biological artifacts
and sudden EEG abnormalities, and then analyzed using the EMSE application (EMSE
Suite; Source Signal Imaging, San Diego, CA, USA) implemented on a computer. EEG
data were filtered in the frequency range of 0.5–30 Hz using the right earlobe
as a reference, and the data were analyzed using fast Fourier transform (FFT)
processing and time-frequency analysis. The time window for frequency analysis
was set to 10 s, and the overlap was set to 50%. The total power was obtained by
adding the powers 8.0 of 29.8 Hz. The total potency was expressed as a percentage
of the total power for each participant, and
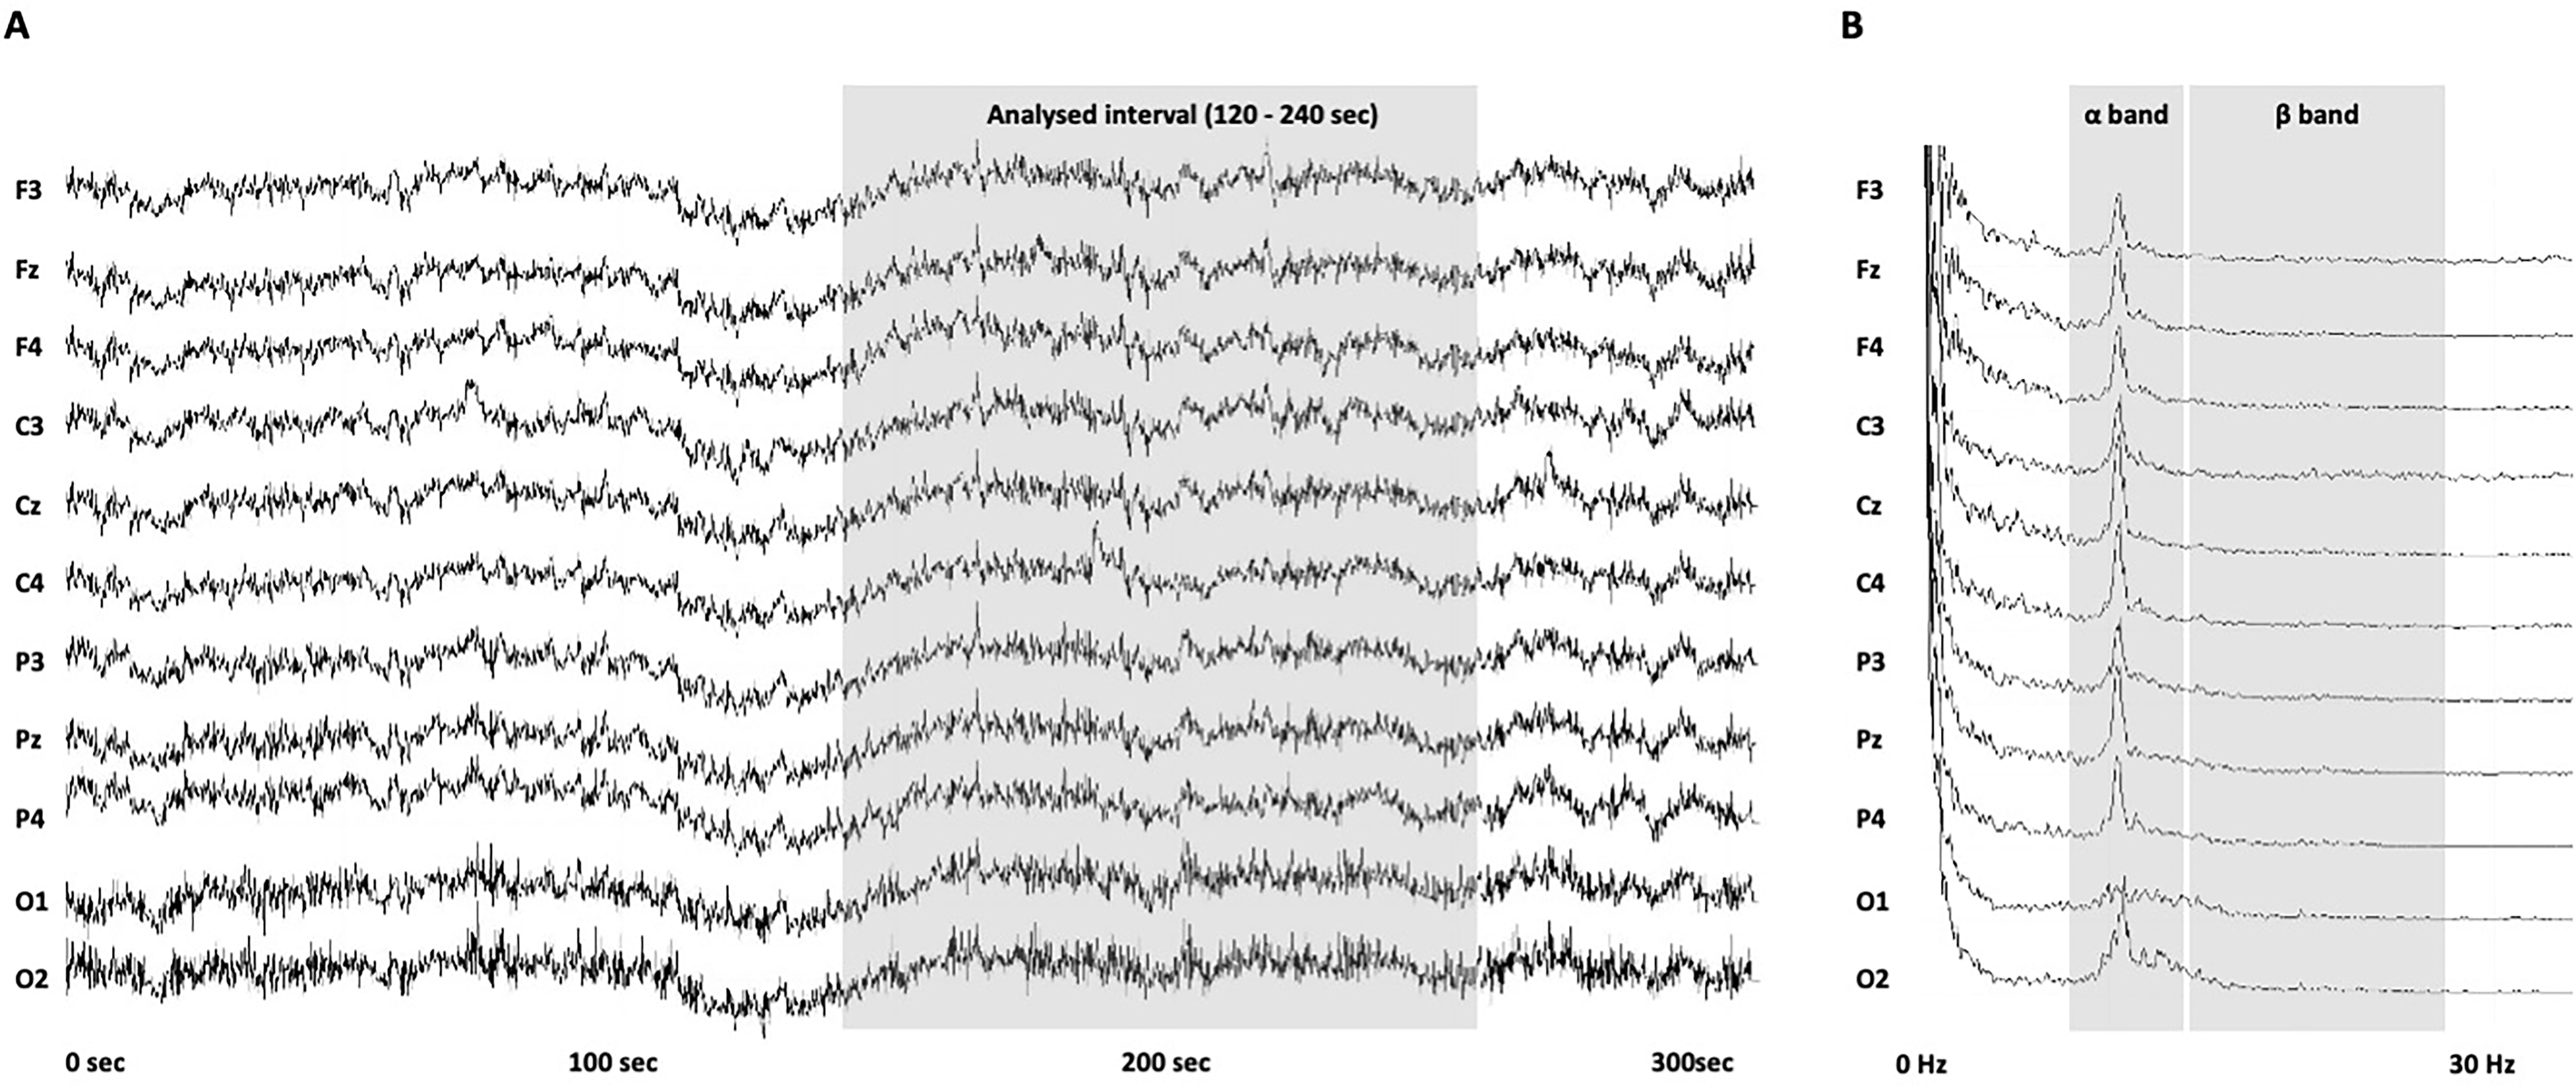
 Fig. 2.
Examples of electroencephalogram (EEG) patterns in patients with
irritable bowel syndrome (IBS). (A) Elapsed time (x-axis) and actual waveform of
each channel (y-axis) in the EEG measurements. Data were recorded for 10 minutes,
and those in the time window of 120–240 s (shown in gray shading) were analyzed.
(B) EEG waveforms of IBS patients processed using the power spectra. The
The EEG data of participants whose
Support vector machines (SVMs) are supervised machine-learning methods used for
classification and regression [42]. A linearly separable sample set is denoted as
The SVM algorithm finds an optimal separating hyperplane that can classify samples without errors and maximize the distance between any class and the separating hyperplane. To classify all the samples correctly, the following conditions must be satisfied:
The margin between the two classes being classified is
We can optimize the solution of the problem using Eqn. 2, as given by the saddle point of the Lagrangian function. The optimal discriminant function is as follows:
The extended optimal separating hyperplane is determined by replacing Eqn. 3
using the kernel function
The SVM is adaptable to cases where linear separation is possible or impossible. This has been extended to construct nonlinear discriminant functions using kernel tricks. In this study, we used the Gaussian kernel in Eqn. 5 as follows:
The data of the
The discriminative power of the classifier was evaluated using a bootstrapped dataset. Classification was quantified using a confusion matrix. According to Han et al. [43], a confusion matrix tool can be used to apply classifier analysis to recognize various classes. In this study, we examined whether the SVM classification model established in the training dataset could discriminate the EEG of the test datasets between participants with and without IBS. This validation procedure was repeated 10 times, and the accuracy rate was calculated as AR = (TP + TN)/N (AR, accuracy rate; TP, true positive; TN, true negative; N, sum of true positive, true negative, false positive, and false negative). The calculation method for the positivity rate is detailed in Table 1.
| IBS | Non-IBS | Equation | |
| IBS positive | True positive: a | False positive: b | Sensitivity |
| = a / (a + b) | |||
| IBS negative | False negative: c | True negative: d | Specificity |
| = d / (c + d) | |||
| Total IBS symptoms | Precision | Negative predictive value | Accuracy rate |
| = a / (a + c) | = d / (b + d) | = (a + d) / (a + b + c + d) | |
| IBS, irritable bowel syndrome.
True positive indicates a correctly labeled positive. True negative indicates a correctly labeled negative record. | |||
In the statistical analysis, the EEG data obtained from each group were tested for normality using the Shapiro-Wilk test. After confirming normality, the band-specific data for each channel amplified by the bootstrap method were tested for associations with IBS symptoms using a multivariate analysis of variance. Post-hoc analyses with unpaired t-tests were performed to compare each channel for each IBS symptom. The SVM classifier was used to calculate the rate of positive diagnoses, sensitivity, and specificity of the IBS symptoms. Demographic data were compared using the chi-square and Mann–Whitney U tests. All statistical tests were performed in R using R Studio (version 1.1.4; R Foundation, Boston, USA), with the significance level set at 5%.
A consent form for participating in the study was sent via email, and 60
students who met the eligibility criteria were enrolled in this study (mean age =
20
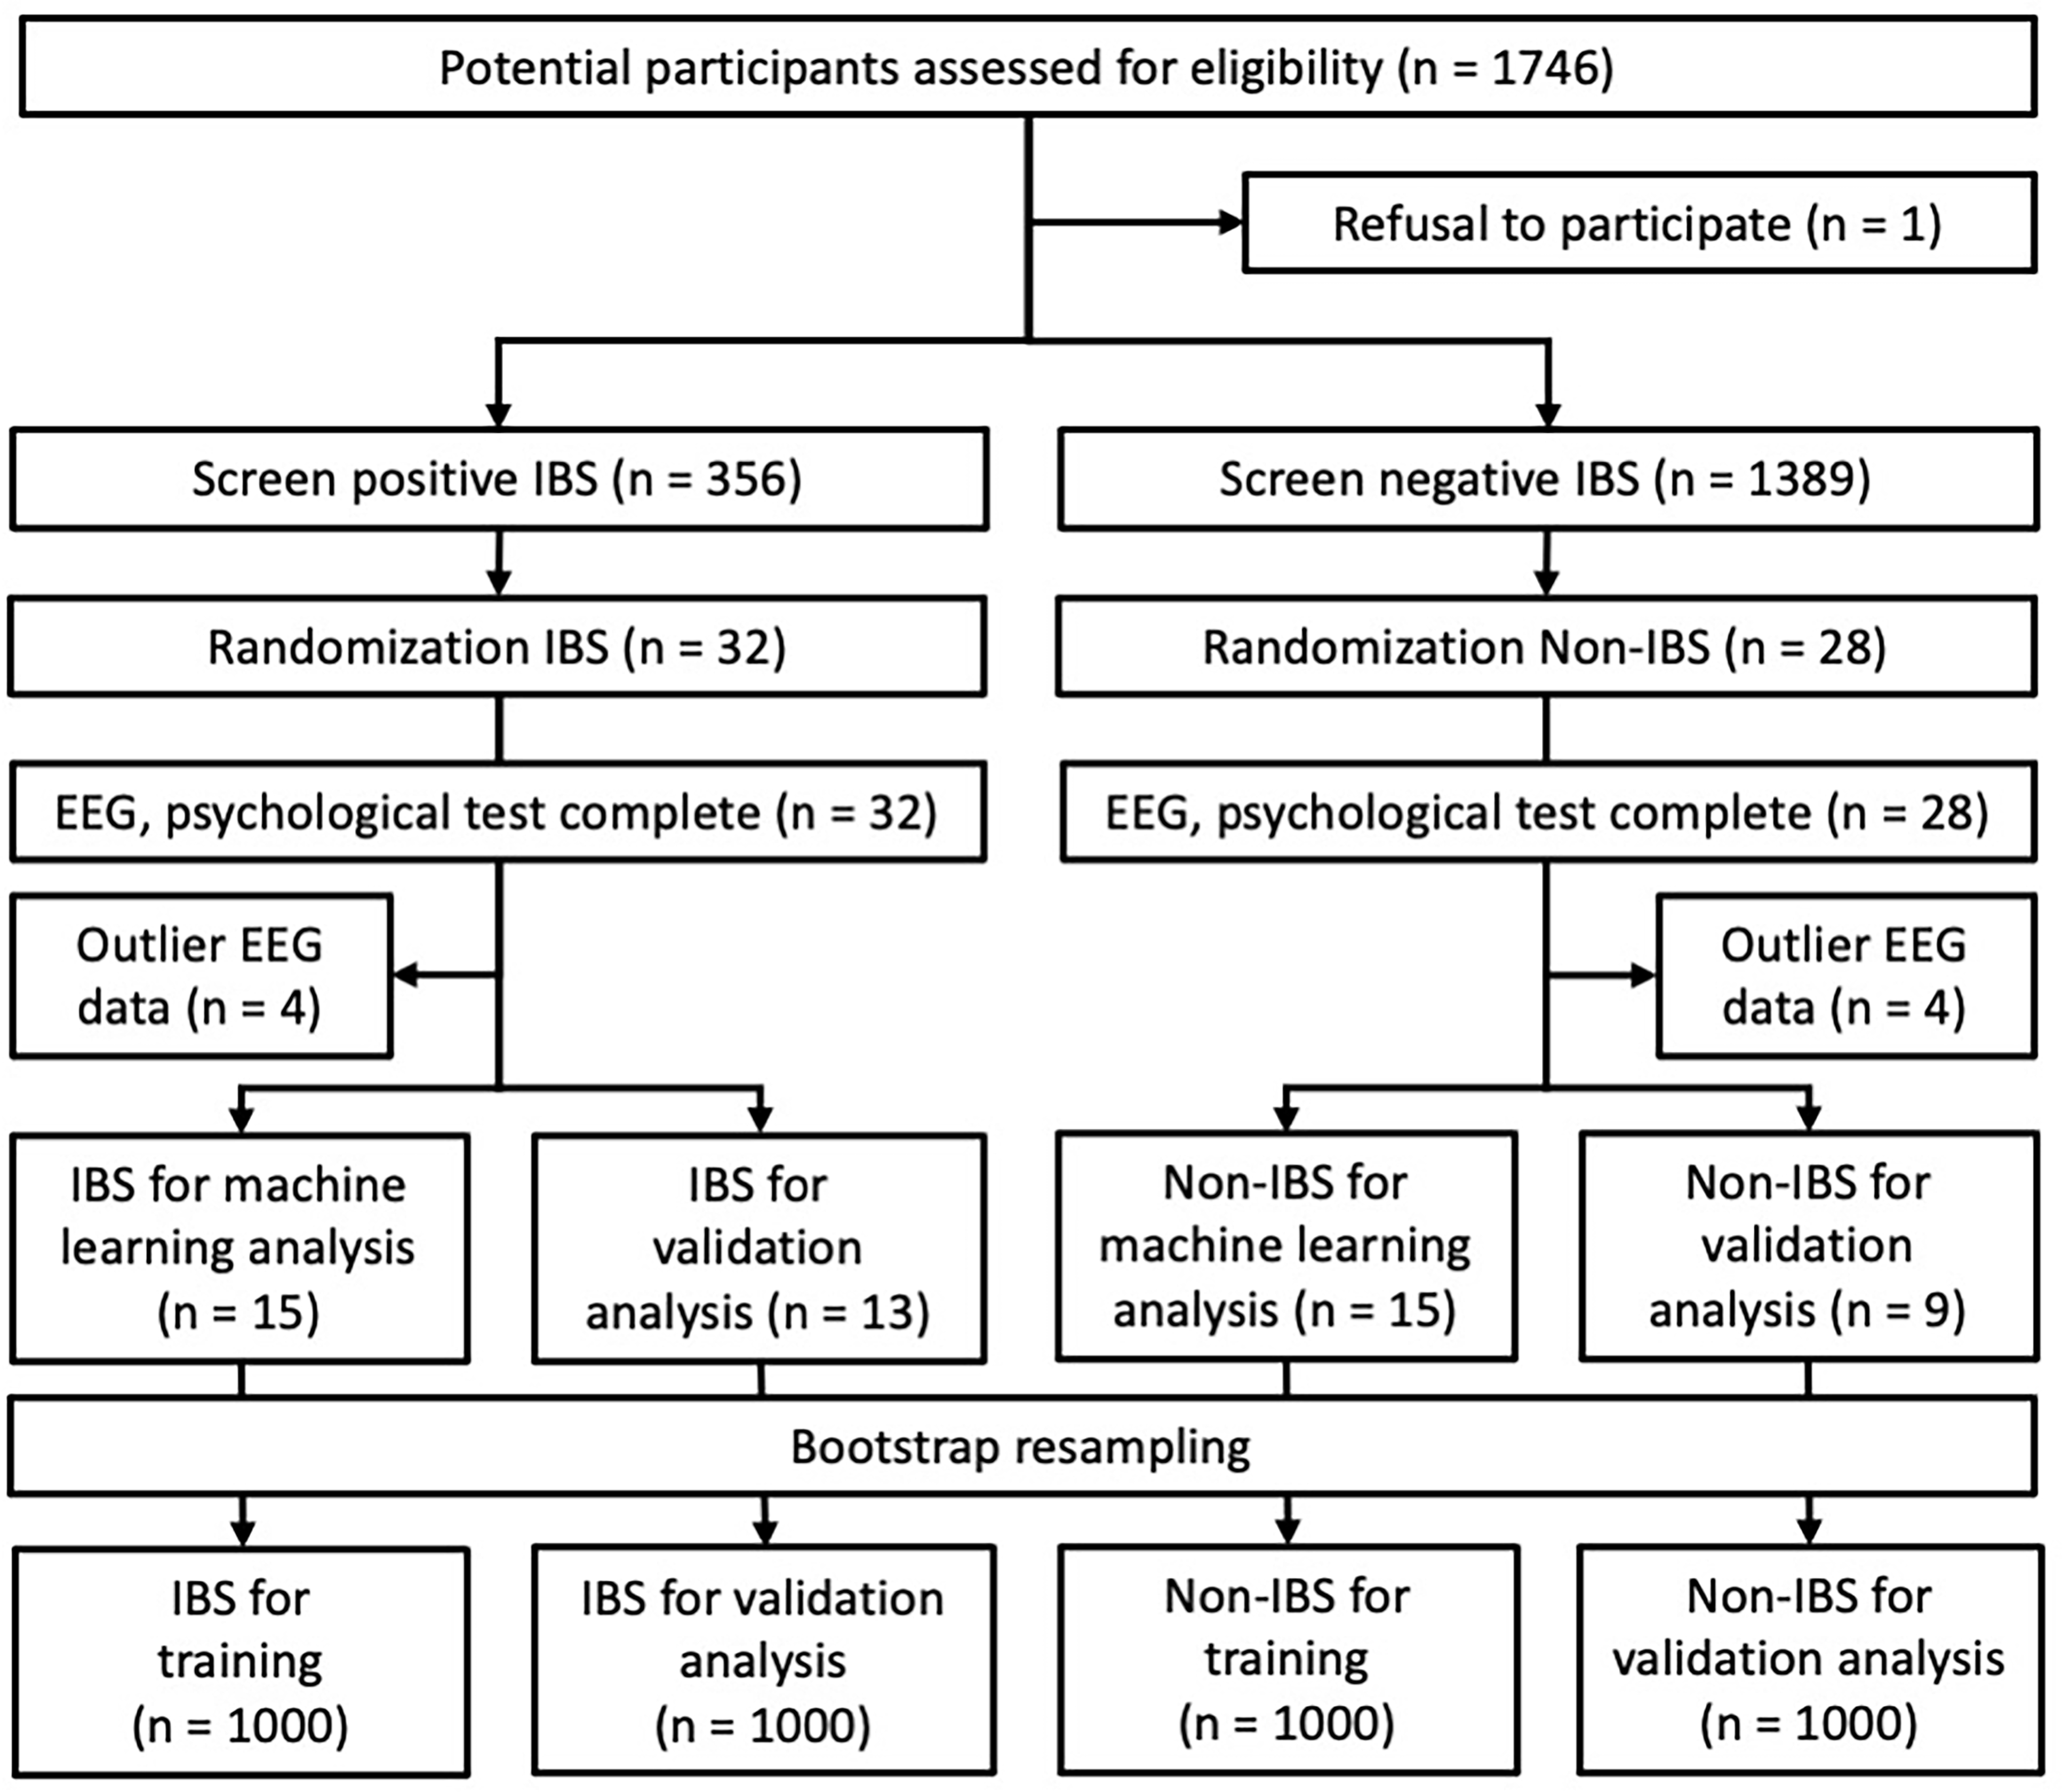 Fig. 3.
Selection process of the study population and study design. Among the participants screened for IBS symptoms, 60 students selected by random sampling were enrolled in this study. Then, EEG measurements and psychological tests were performed, and participants with outliers in EEG data were excluded. The participants finally included in the analysis were 28 in the IBS group (training: 15, validation: 13) and 24 in the non-IBS group (training: 15, validation: 9).
| Variables | IBS group (n = 28) | Non-IBS group (n = 24) | Statistics | |||
| Male | female | male | female | |||
| Participants (n) | 6 | 22 | 8 | 16 | n.s. | |
| Age (mean years) | 19 | 20 | 19 | 19 | n.s. | |
| IBS subtypes (n) | ||||||
| IBS-C | 2 | 7 | n/a | n/a | n.s. | |
| IBS-D | 0 | 6 | n/a | n/a | n.s. | |
| IBS-M | 2 | 5 | n/a | n/a | n.s. | |
| IBS-U | 2 | 4 | n/a | n/a | n.s. | |
| IBS quality of life | ||||||
| Dysphoria | 74.0 |
74.9 |
90.2 |
77.3 |
||
| Interference with activity | 75.6 |
76.0 |
91.5 |
77.9 |
||
| Body image | 87.5 |
79.6 |
94.5 |
78.5 |
||
| Health worry | 86.1 |
77.3 |
88.5 |
83.3 |
||
| Food avoidance | 80.6 |
67.8 |
88.5 |
70.3 |
||
| Social reaction | 84.4 |
88.6 |
97.7 |
90.2 |
||
| Sexual concerns | 89.6 |
91.5 |
100.0 |
96.1 |
||
| Relationships | 81.9 |
82.6 |
89.6 |
83.9 |
||
| For statistical analysis, we used the t-test corresponding to the IBS
quality of life after the normality test. | ||||||
The MANOVA results including
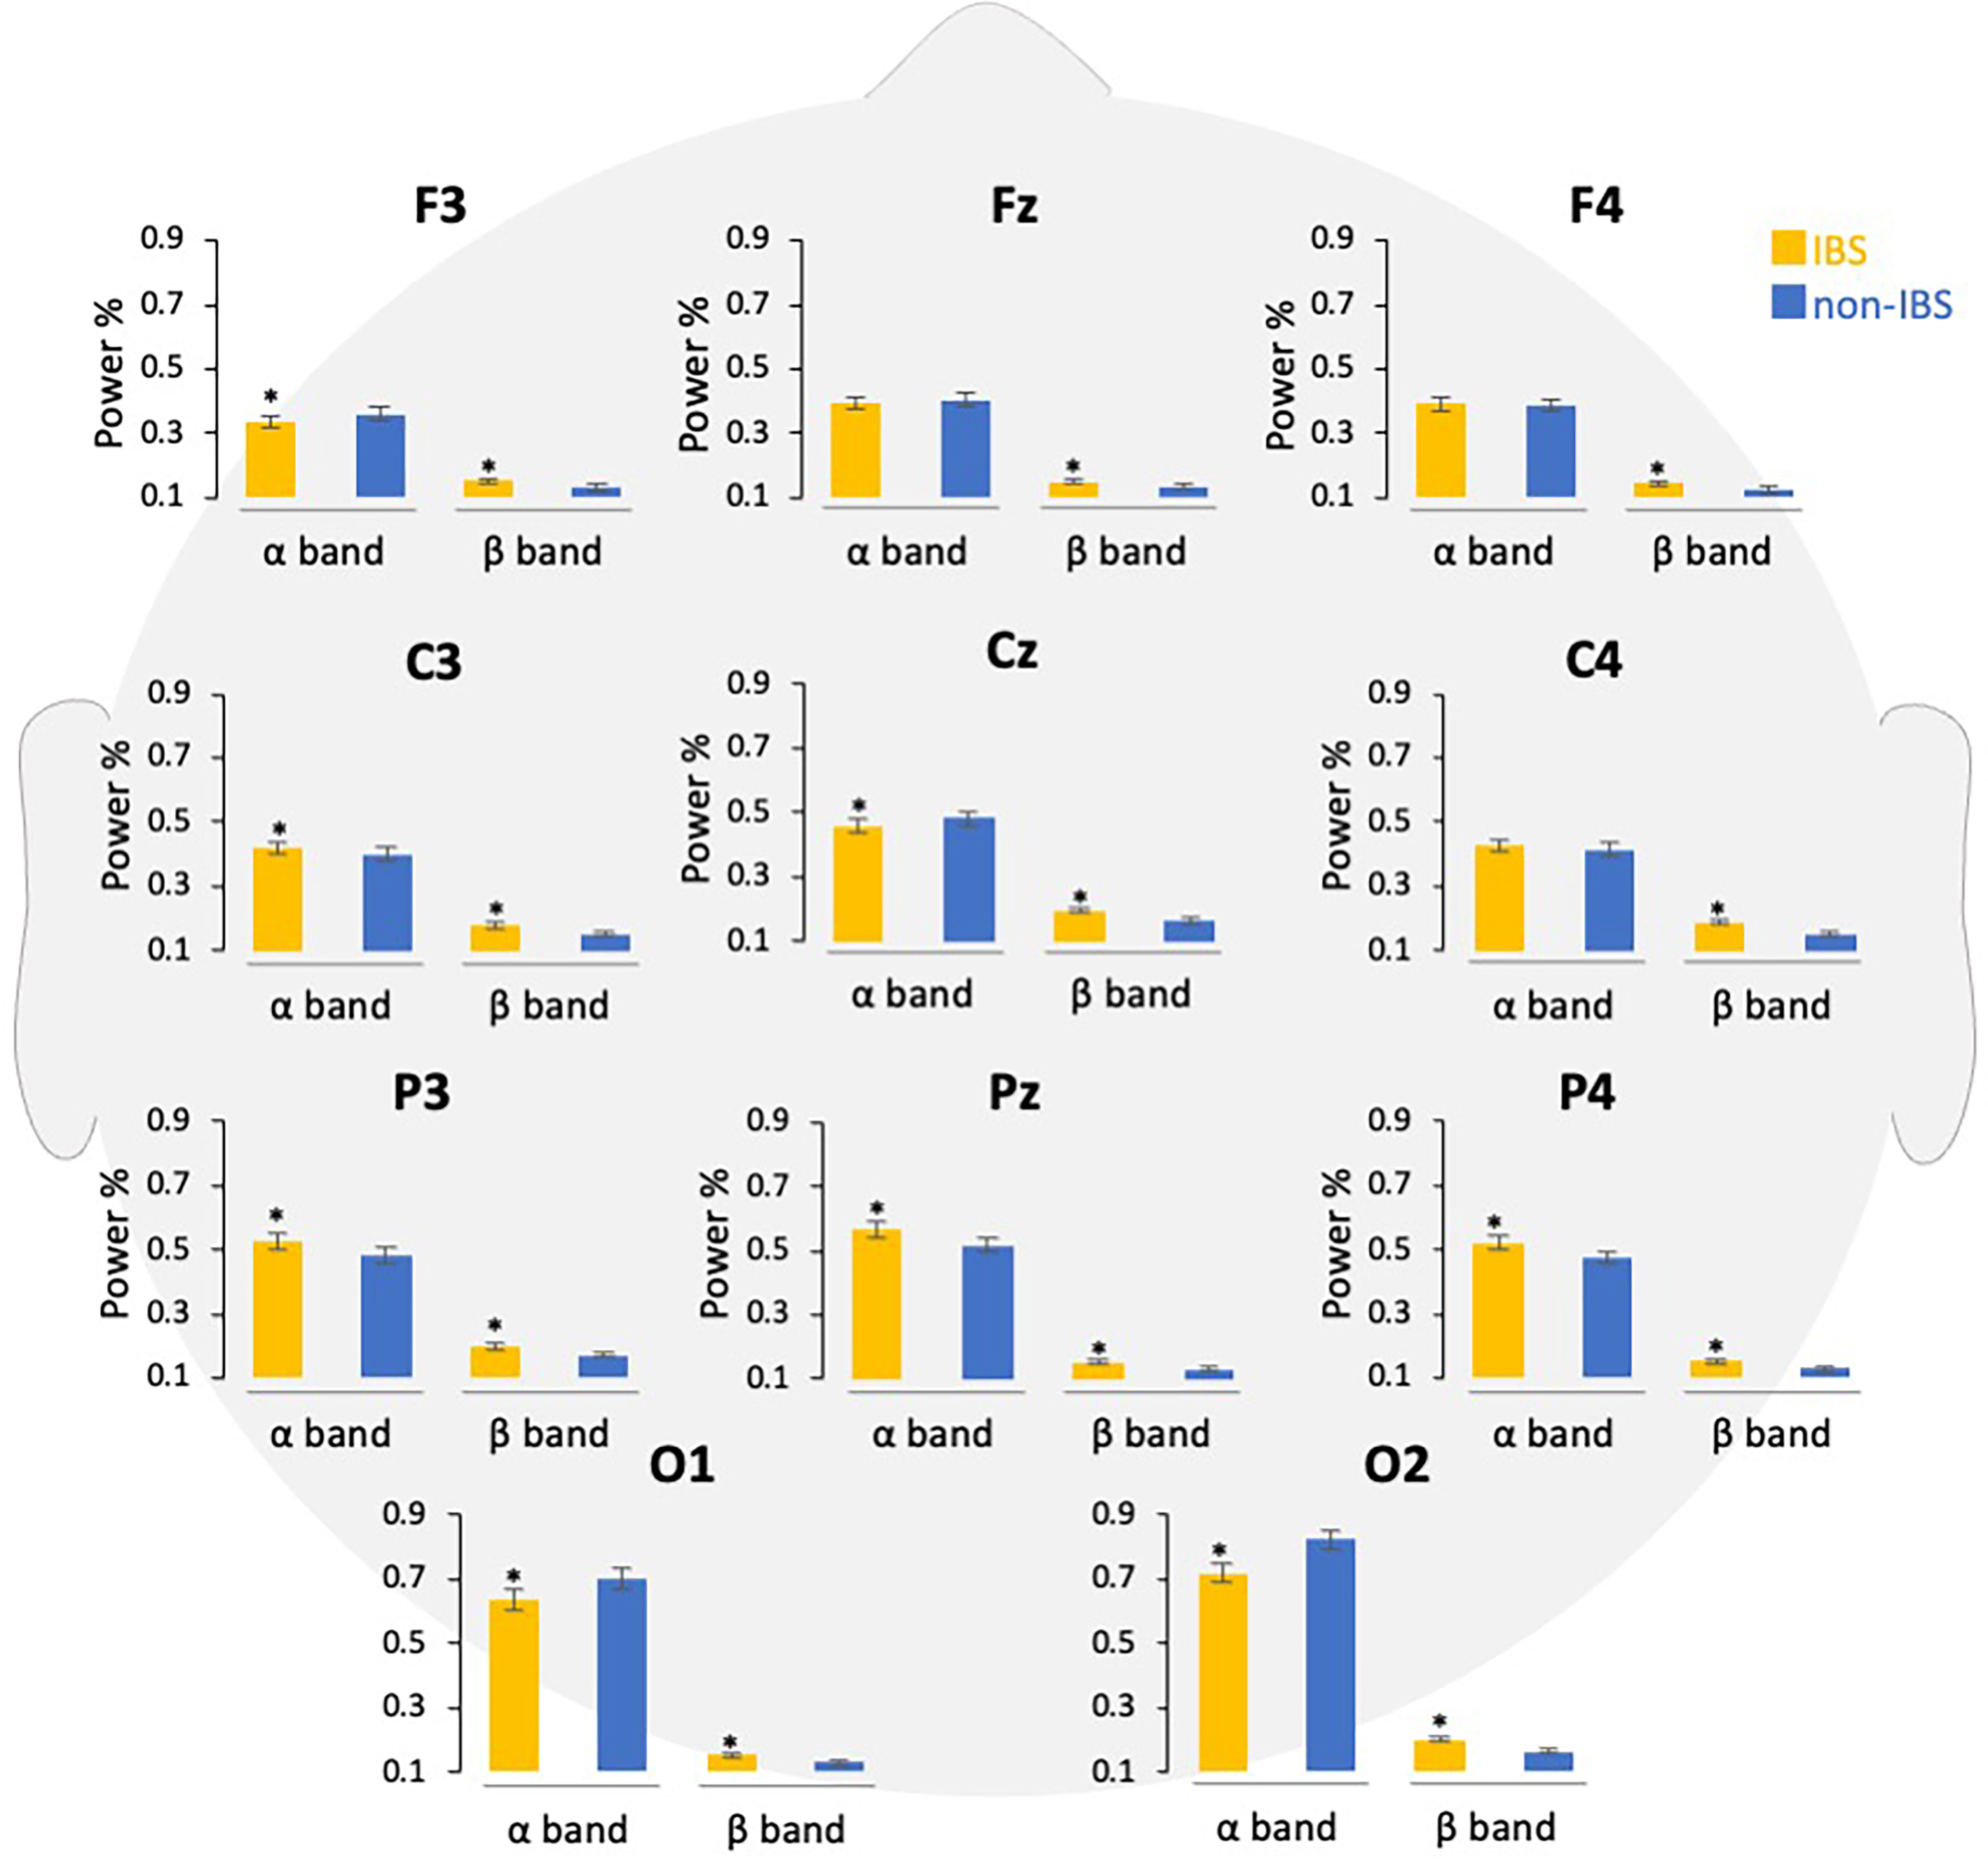 Fig. 4.
Comparison of power percentages of EEG bands in participants
with and without IBS symptoms. The EEG data are shown according to the frequency
band in each channel, and the power percentages are compared. Error bars indicate
the standard error of the mean. *p
The EEG data in the
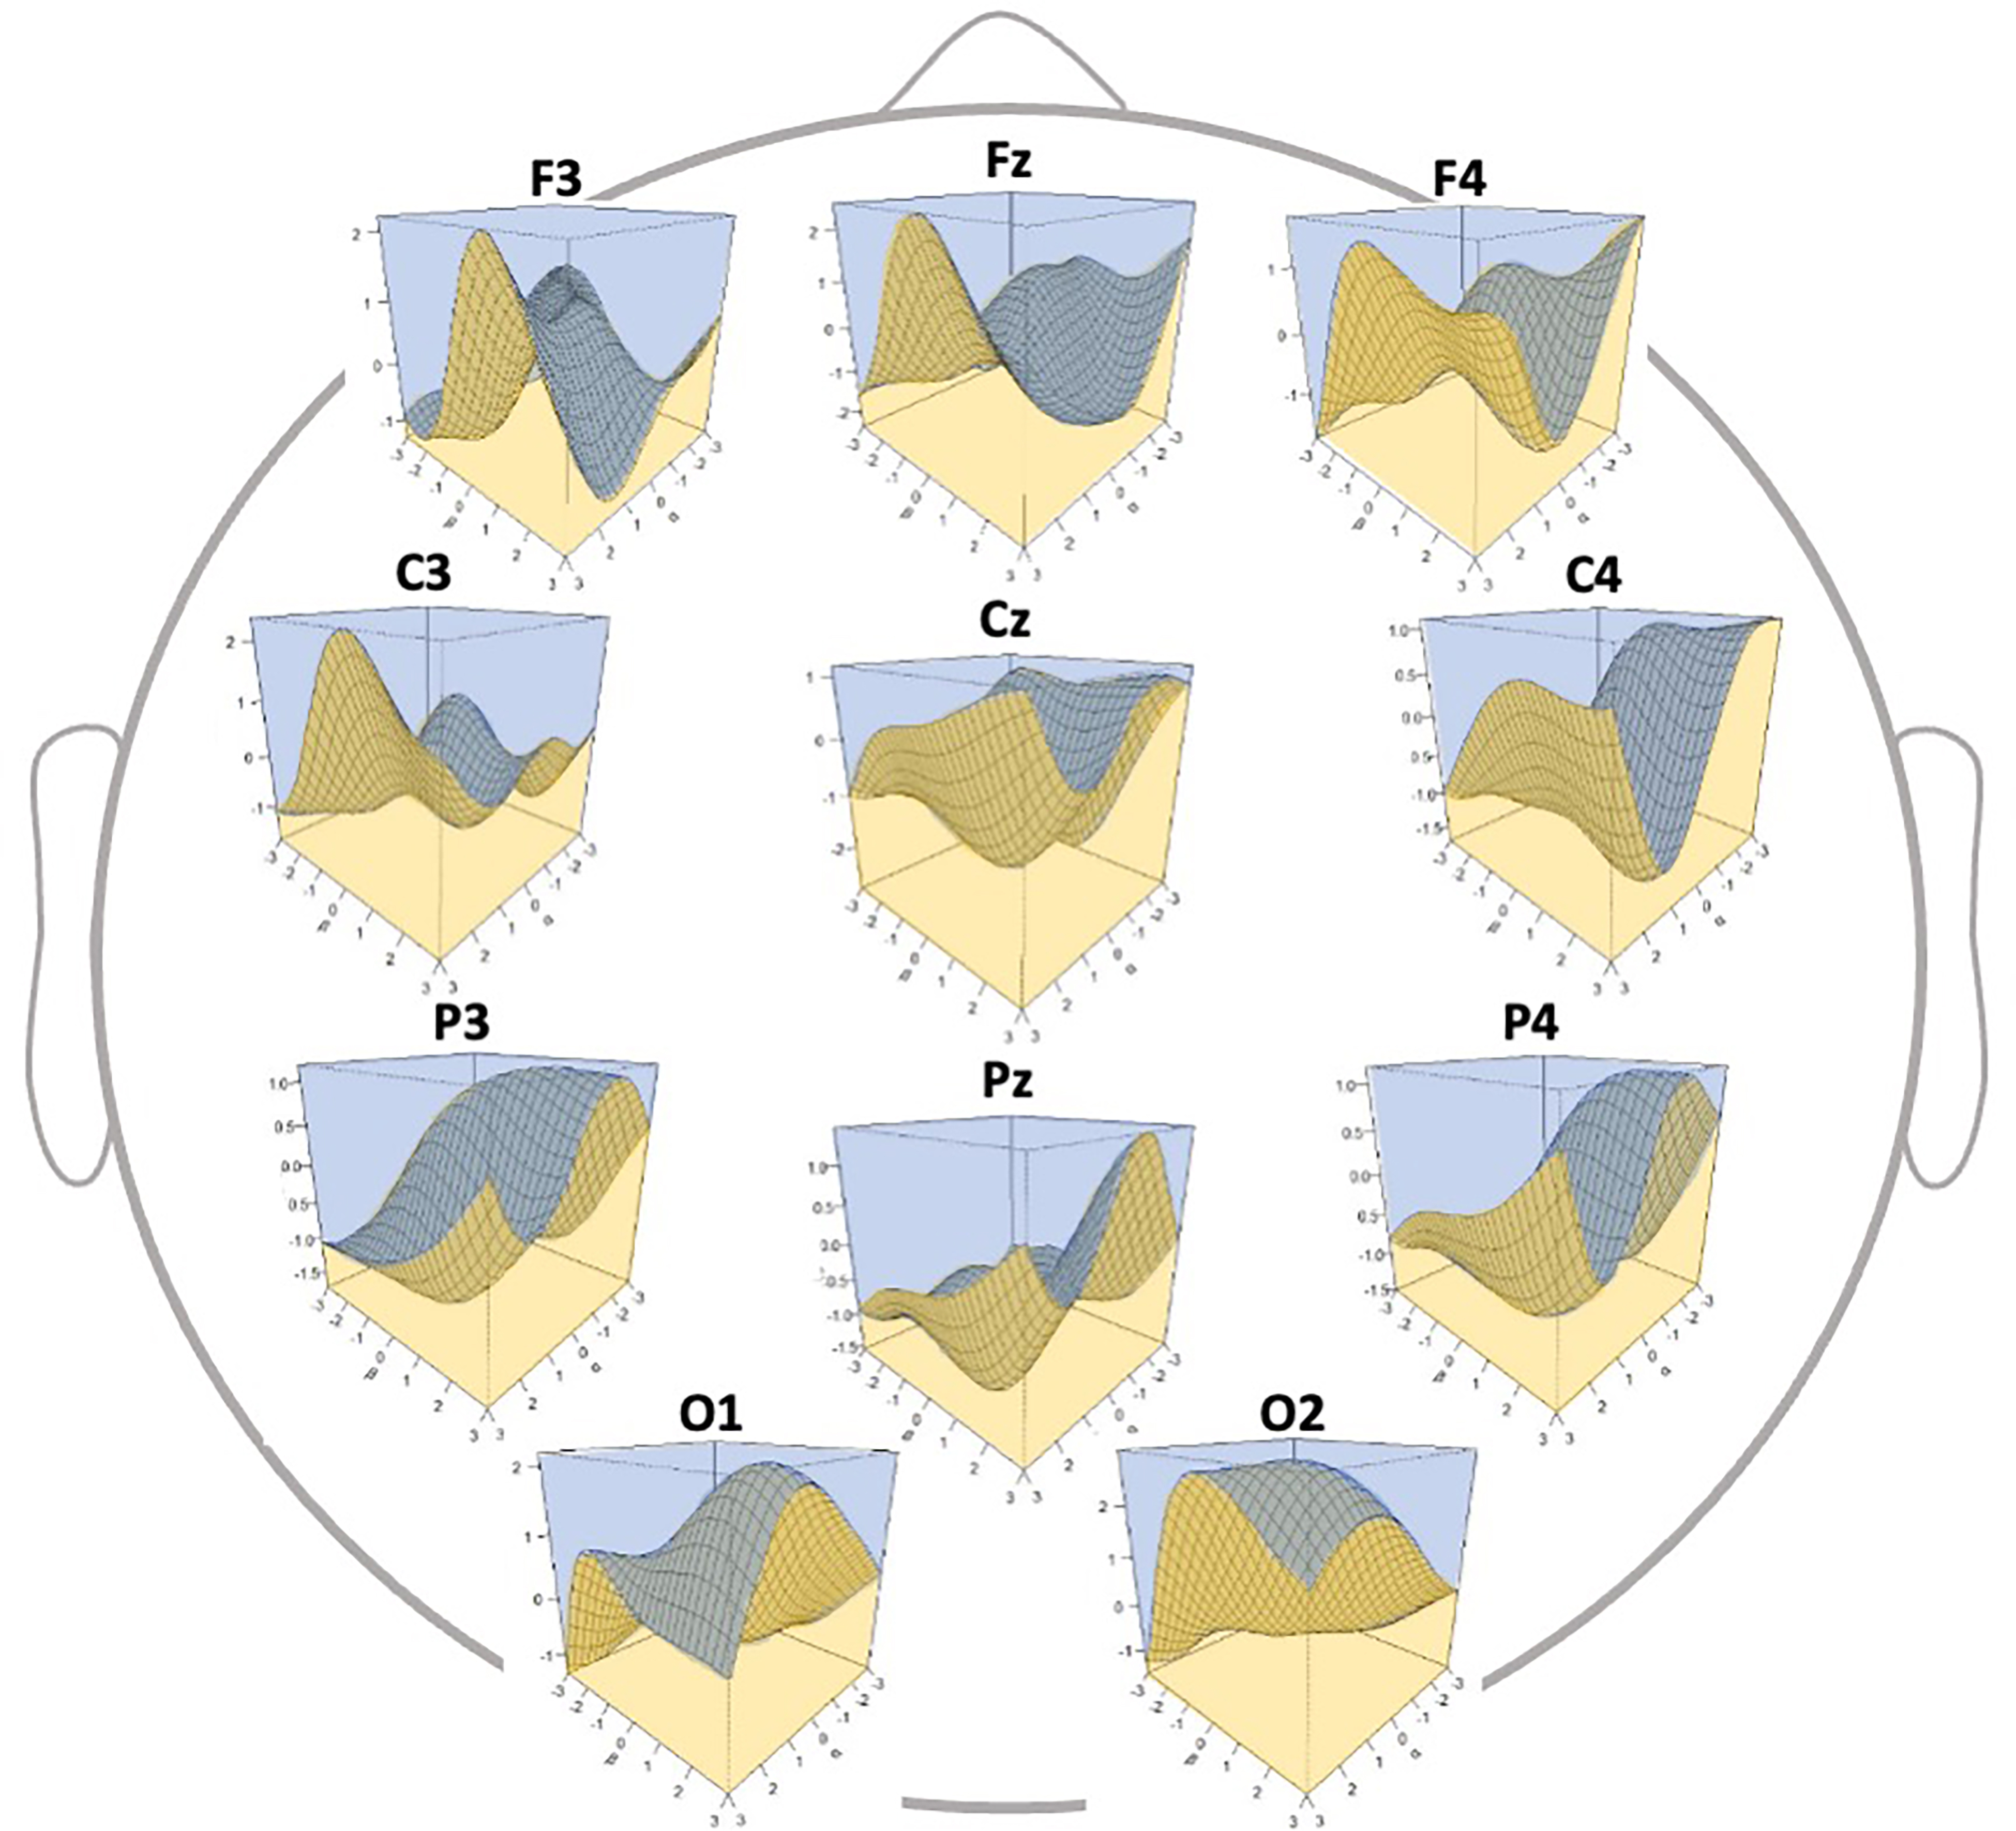 Fig. 5.
Three-dimensional discrimination map of electroencephalography
(EEG) data according to the generated classifier. The
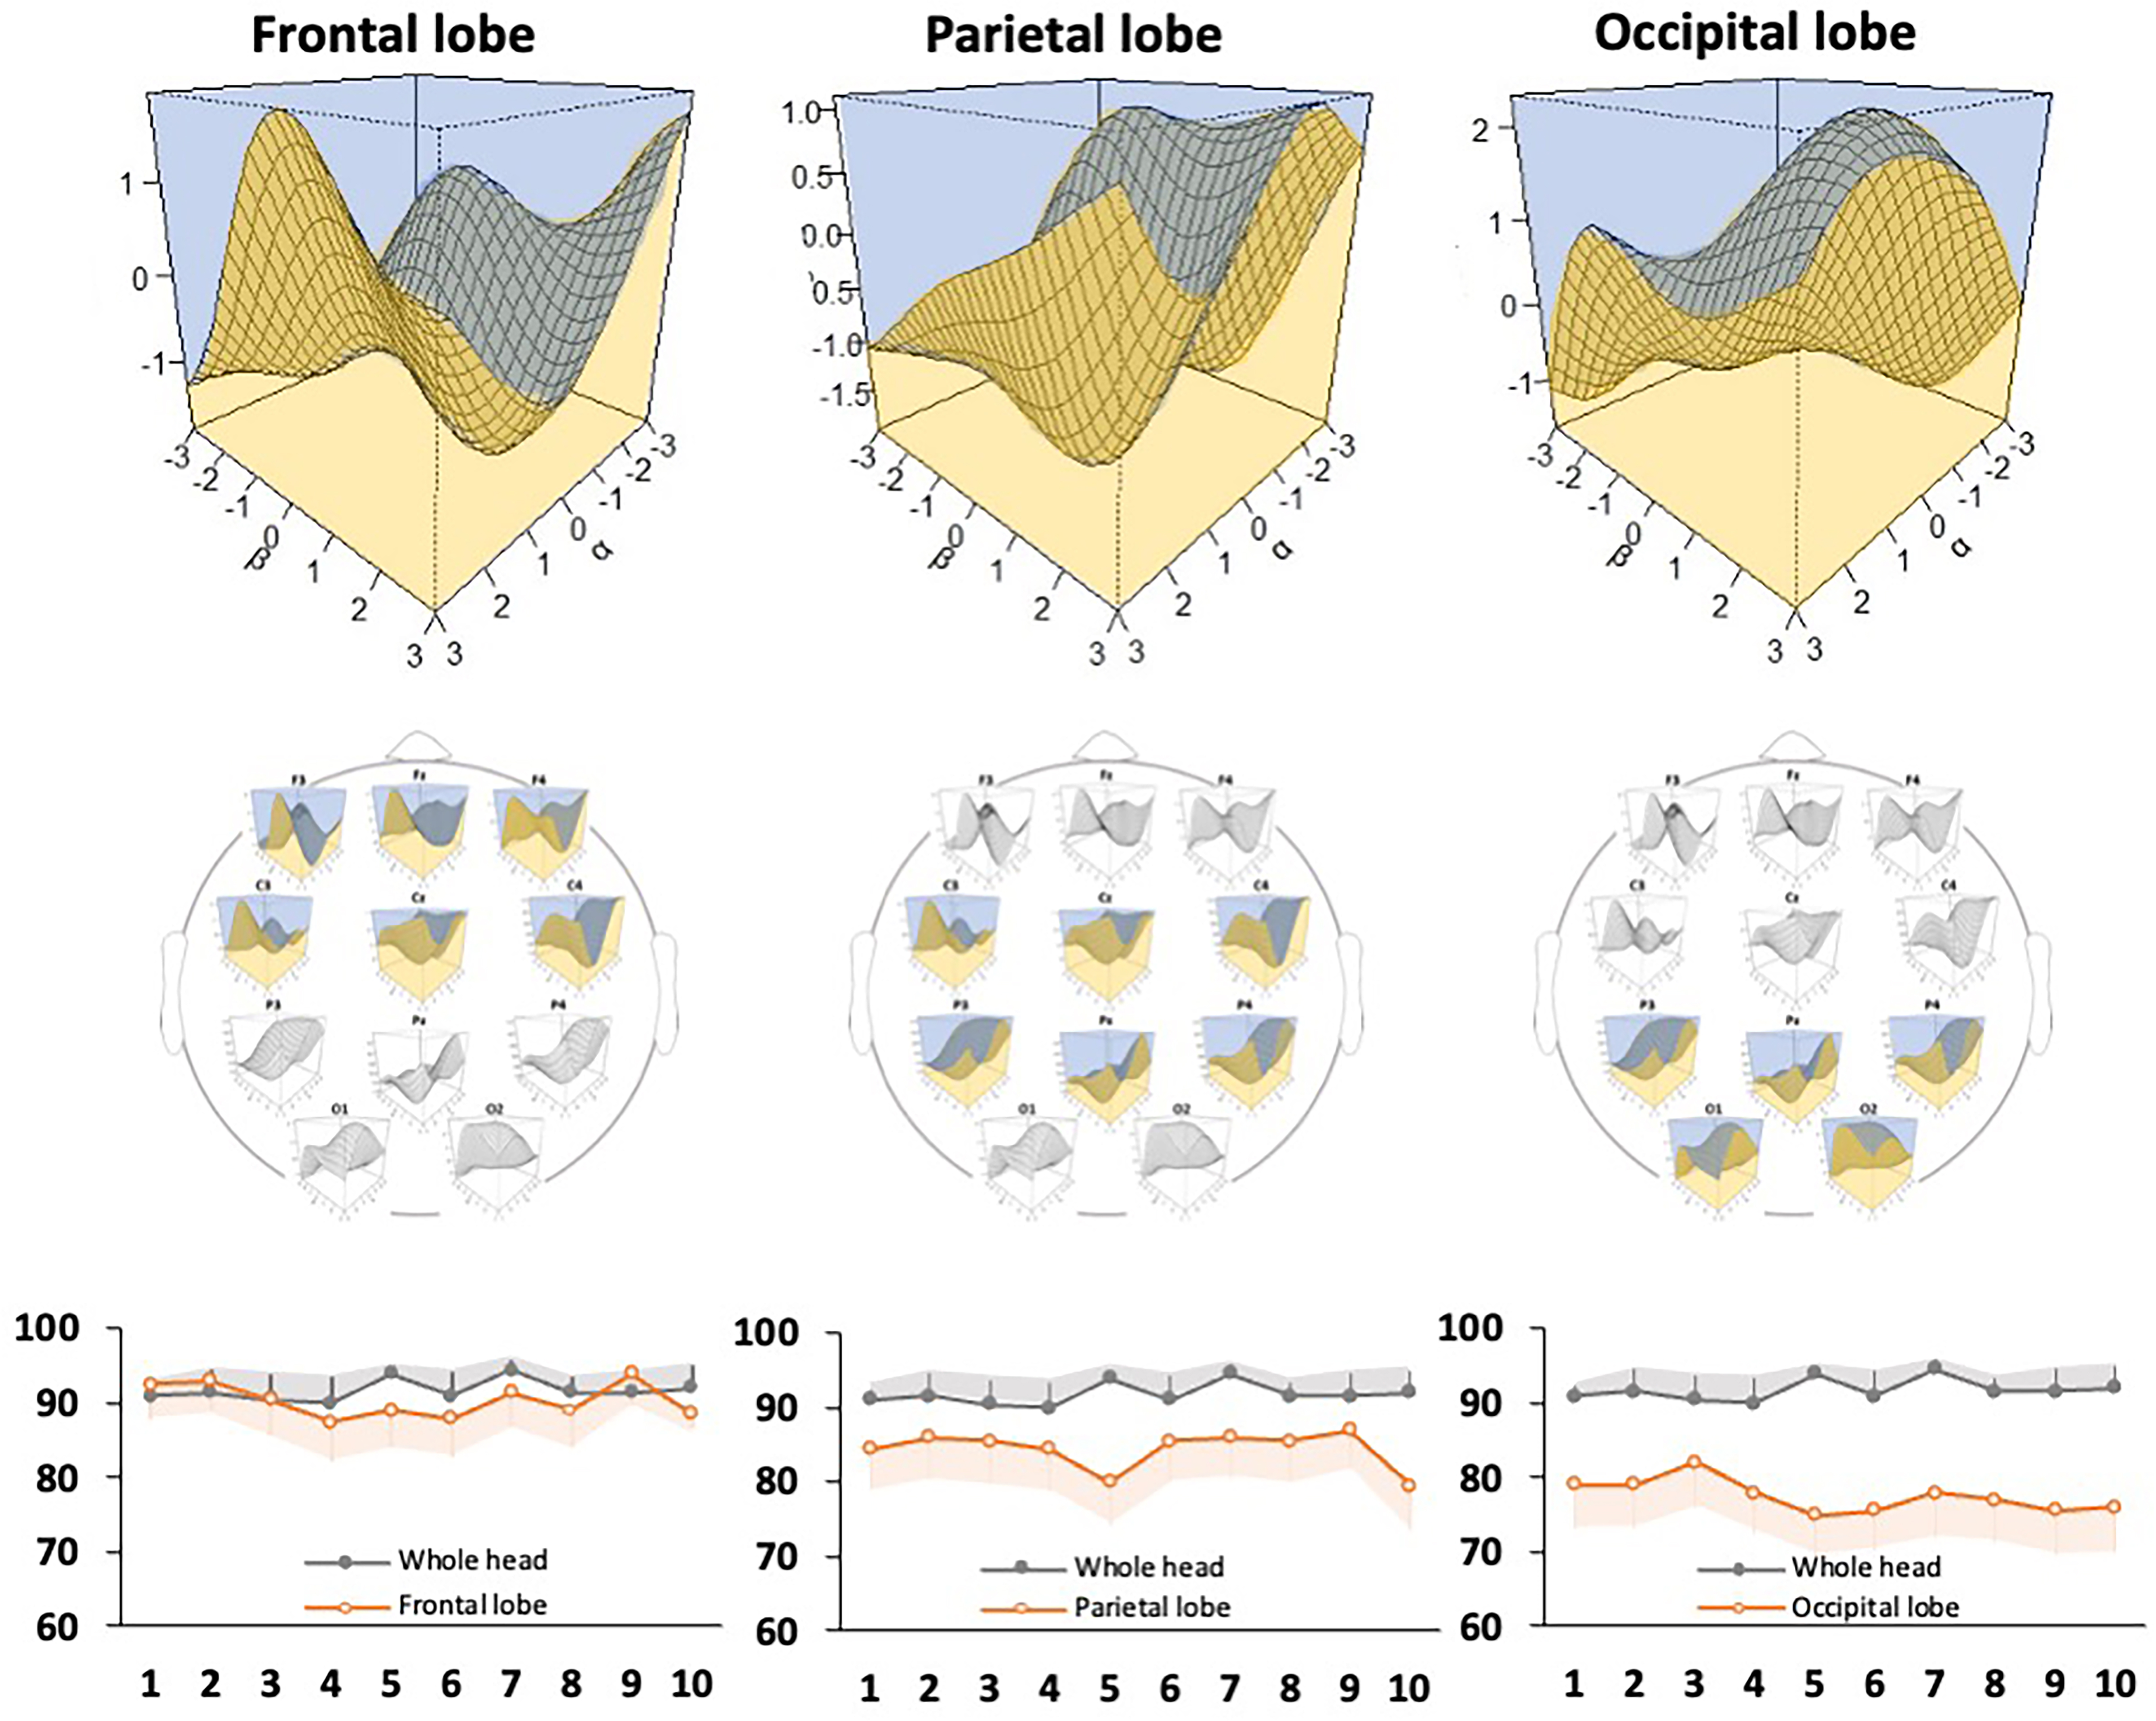
 Fig. 6.
Evaluation of the discriminative ability of the support vector machine classifier for each brain region. The model diagram shows the discrimination accuracy of the classifier in the electroencephalography channels in the frontal, parietal, and occipital regions. A 3D discrimination map for each brain region (top) and accuracy rates (bottom) are shown. The graphs show the number of discrimination trials (x-axis) and the accuracy rate (y-axis), and the accuracy rate of the whole brain is shown as a reference. Gray and orange error bars indicate the 95% confidence interval of each data point.
| Measure | Whole brain | Frontal region | Parietal region | Occipital region | ||||
| Mean | SD | Mean | SD | Mean | SD | Mean | SD | |
| Accuracy rate | 91.75 | 1.44 | 90.35 | 2.29 | 84.40 | 2.56 | 77.50 | 2.16 |
| Sensitivity | 90.99 | 3.40 | 89.94 | 3.22 | 81.79 | 3.85 | 66.34 | 2.94 |
| Specificity | 92.56 | 3.01 | 90.88 | 2.47 | 87.30 | 2.36 | 89.98 | 3.30 |
| Positive prediction | 92.23 | 3.17 | 90.84 | 2.91 | 86.87 | 3.01 | 88.17 | 3.60 |
| Negative prediction | 91.43 | 3.21 | 89.82 | 3.60 | 82.00 | 4.85 | 70.58 | 3.89 |
| SD, standard deviation. | ||||||||
In this study, we generated a classifier to determine the symptoms of IBS using
the discriminant frequencies of the
Studies have reported the characteristics of the DMN when it is not performing a particular function in humans [49]. In IBS, excessive attention to body sensations (body vigilance) is accompanied by gastrointestinal hypersensitivity [50]. However, analysis of the characteristic DMN in this context is still in progress. Characteristic DMNs are possible to discriminate based on the characteristics of EEG spectra associated with biological responses and emotional recognition [51]. Studies using positron emission tomography (PET) and magnetic resonance imaging (MRI) have reported that brain functions are different between asymptomatic and symptomatic patients with IBS who have gastrointestinal hypersensitivity as a result of stimulation of the colon [52]. Ezra et al. [53] reported that the insular cortex and periaqueductal gray (PAG) area—which are important for perception—are connected in patients with IBS who are prone to chronic repetitive abdominal pain. In addition, chronic pain has been shown to occur in the dorsolateral prefrontal cortex and PAG [54] area. In patients with IBS, brain function in response to chronic abdominal pain tends to show dysregulation in the frontal-parietal region. Gastrointestinal hypersensitivity (one of the symptoms of IBS) can be reproduced by the repetitive mechanical stretching of an indwelling balloon in the intestine [55]. Constant repetitive brain-gut disturbances often induce abdominal pain and visceral hypersensitivity in IBS patients. A comparison of intestinal and brain activity after food intake between IBS patients and healthy participants revealed that the amount of ascending colon gas increased equally, while the activity in the brain region associated with intestinal pain was different [56]. Because the abnormalities in the brain–gut correlation in IBS are usually reflected in an EEG, we speculate that the SVM classifier developed here is highly accurate.
Classifiers generated by machine learning using PET and MRI data have been used as DecNef for psychiatric disorders, and their effectiveness has been verified [57, 58]. However, the device used for data acquisition using these techniques is too large to be easily carried, and is difficult to access for people with IBS [59]. Several psychological interventions have shown therapeutic usefulness in IBS regarding the relationship between psychological abnormalities and gastrointestinal symptoms. Web-based dietary monitoring [60], mindfulness [61], and cognitive behavioral therapy [62] have improved patients’ QOL and reduced their psychological distress [63]. Thus, support tools that are easily accessible to patients are being more widely used. In the present study, we generated a classifier based on the strength of functional connectivity in the DMN, which is characteristic of symptomatic young adults with IBS. This will be the basis for implementing the classifier in practical DecNef. We expect that a new EEG-DecNef device will be developed that analyzes the EEGs of patients with IBS, approximates the DMN characteristic of IBS symptoms, and feeds back the results to the patients.
This study has several limitations. First, the participants were young, and we did not conduct a stratified analysis by age. However, EEG results are known to vary with age [64], and nervous connectivity in brain networks is known to decrease with age [65]. In addition, IBS symptoms differ between younger and older adults [9]. Thus, considering the unique brain functions associated with aging can allow more accurate assessment and diagnosis of brain–gut interactions. Sex differences in IBS symptoms with constipation and diarrhea have also been reported [66]. Moreover, there are sex differences in the brain structure and abdominal organs of humans. Therefore, it is advisable to create and verify a classifier using age group and sex as determinants. Second, the participants in this study had mild IBS symptoms, and we did not conduct an analysis stratified by disease severity. EEG has been used as a biomarker of depressive symptoms [67], and has been proposed as a predictive tool based on the constant changes caused by treatment with selective serotonin reuptake inhibitors [68]. These results indicate that the EEG results change with mental and physical burdens. EEG analysis according to the severity of IBS can extend the means of support in patients with IBS, such as by reducing disease severity from severe to moderate and from moderate to mild. Third, the number of participants in this study was insufficient to provide a generalization of the model. The gut–brain axis is affected by eating behavior and food intake [56]; thus, a prospective study is recommended to implement a classifier that discriminates IBS symptoms adjusting for food contents and eating behavior. Fourth, the participants were not evaluated with diagnostic procedures, such as laboratory examinations or colonoscopy. Therefore, some of the participants could have had an organic cause for their digestive symptoms. However, identification of individuals with IBS in this study was based on the reliable IBS detection previously described [8]. We believe that our inclusion of a checklist of organic diagnoses that might account for GI symptoms and exclusion of such cases from the IBS diagnosis compensated at least partially for this possible selection bias. Finally, the IBS sample in our study did not show any complex symptoms associated with IBS, which limits the generality of the results. In IBS patients with chronic recurrent abdominal pain, pain is generally determined using the following factors: diet [69], intestinal environment [70], psychological state [71], and physical activity [72]. We did not investigate these factors in the present study. To understand the DMN and its complex symptoms characteristic of IBS, a cohort-based study investigating its relationship with EEG is needed. The results of these investigations will help generate classifiers for each subtype of abdominal pain, which will form the basis for IBS diagnosis and intervention protocols.
In this study, we generated a support vector machine classifier for discriminating IBS symptoms using the EEG power spectra in young adults with mild IBS. We also confirmed the high discriminative ability and accuracy of this classifier. This method of discrimination can help improve our ability to identify young adults with IBS symptoms using EEG data, and may be used as an evaluation index for self-control training.
IBS, irritable bowel syndrome; QOL, quality of life; DMN, default mode network; RSFC, resting state functional connectivity; EEG, electroencephalography; DecNef, decoded neural feedback; fMRI, functional magnetic resonance imaging; EHI, Edinburgh Handedness Inventory; FFT, fast Fourier transform; SVM, support vector machine; AR, accuracy rate; TP, true positive; TN, true negative; N, sum of true positive, true negative, false positive, and false negative.
Conceptualization and design—TH, JT, and SF; acquisition of data—KK, JT and TH; analysis and interpretation of data—KK, JT and TH; drafting of the manuscript—KK; critical revision—TH, SF. All authors have read and agreed to the published version of the manuscript.
This study was approved by the Review Boards of Saitama Prefectural University (#24075) and Nagasaki University (#13072632). Written consent was obtained from all participants.
We would like to thank the students of Saitama Prefectural University and Nagasaki University for their cooperation in this study.
This research was funded by the Japan Society for the Promotion of Science through grants (projects 19K11368 and 18KK0275). The staff at Saitama Prefectural University and Nagasaki University supported this research through participant recruitment and material procurement.
All authors declare no conflicts of interest.