IMR Press / FBL / Volume 27 / Issue 6 / DOI: 10.31083/j.fbl2706172
Open Access Original Research
Mitochondrial DNA in Visceral Adipose Tissue in Severe Obesity: From Copy Number to D-Loop Methylation
Show Less
1 Unit of Molecular Biology and Nutrigenomics, School of Pharmacy, University of Camerino, 62032 Camerino, Italy
2 Department of Experimental and Clinical Medicine, Marche Polytechnic University, 60121 Ancona, Italy
3 School of Advanced Study, University of Camerino, 62032 Camerino, Italy
4 Department of General Surgery, Marche Polytechnic University-United Hospitals, 60121 Ancona, Italy
5 Center of Obesity, Marche Polytechnic University-United Hospitals, 60121 Ancona, Italy
*Correspondence: laura.bordoni@unicam.it (Laura Bordoni)
These authors contributed equally.
Academic Editor: Graham Pawelec
Front. Biosci. (Landmark Ed) 2022, 27(6), 172; https://doi.org/10.31083/j.fbl2706172
Submitted: 28 March 2022 | Revised: 13 May 2022 | Accepted: 16 May 2022 | Published: 31 May 2022
Copyright: © 2022 The Author(s). Published by IMR Press.
This is an open access article under the CC BY 4.0 license.
Abstract

Background: Peripheral alterations of mitochondrial DNA copy number (mtDNAcn) in obesity and associated co-morbidities have been previously shown. Furthermore, the possibility that methylation could occur in the mtDNA (in particular in the displacement loop, D-Loop) and regulate its functions has been raised. However, limited data about mtDNA methylation in adipose tissue are currently available. Since a strict crosstalk between the nucleus and mitochondria exists, especially in terms of the one-carbon cycle (that supports methylation reactions in the cell), we investigated methylation in selected areas of the mitochondrial and nuclear DNA and their expression in visceral adipose tissue (VAT) samples of patients with severe obesity. Methods: VAT biopsies were collected from surgery patients to isolate DNA and RNA. Gene expression and mtDNAcn were assessed through qPCR. DNA methylation in both nuclear and mitochondrial areas were determined through bisulfite pyrosequencing. Results: Methylation levels of the mtDNA were only marginally associated with the obesity degree (higher D-Loop methylation in severe obesity) and were not correlated with mtDNAcn. A significant correlation between D-Loop methylation and LINE-1 methylation was observed in VAT samples, and this was independent from the obesity degree. A progressive reduction of mtDNAcn and increase in NRF1 expression levels were measured in VAT in severe obesity. NRF1 expression was directly correlated with PPARG and MTHFR expression levels, while mtDNAcn was associated to TFAM expression. The correlation between mtDNAcn and TFAM expression was affected by the obesity status. Conclusions: This evidence supports the hypothesis that mtDNA alterations occur in obesity and a complex dynamic correlation between mitochondrial and nuclear DNA methylation exists, highlighting the need for further investigations.

Keywords
TFAM
DNA methylation
epigenetics
metabolic syndrome
diabetes
nutrigenomics
1. Introduction

Visceral adipose tissue (VAT) is a hormonally active component of total body fat, with unique biochemical features affecting both physiological and pathological processes in the human body. Abnormally high deposition of VAT is known as visceral obesity. This body composition phenotype is associated with several complex disorders, in particular metabolic syndrome, diabetes and cardiovascular disease [1, 2]. Given the complex multifactorial origin of this condition, a special interest is directed towards epigenetic mechanisms that might contribute to shift healthy to pathological VAT phenotypes in response to environmental triggers [3, 4, 5].

Among cellular organelles that play a major role in regulating the functionality of VAT there are mitochondria [6]. Mitochondria are involved in many key cellular processes such as apoptosis, calcium homeostasis, reactive oxygen species production, and most importantly, adenosine triphosphate (ATP) generation by oxidative phosphorylation (OXPHOS). Mitochondrial dysfunction results in detrimental effects on adipocyte differentiation, lipid metabolism, insulin sensitivity, oxidative capacity, and thermogenesis; indeed, it has been strongly correlated with metabolic diseases pathogenesis [6]. Mitochondria have their own genome, the mitochondrial DNA (mtDNA); in humans, it is a double-stranded, closed-circular molecule of 16569 base pairs, present in each cell in multiple copies, whose number (mtDNAcn) can vary according to the cell type and health status [7]. One strand of the mtDNA is referred to as the heavy strand, and the other strand is referred to as the light strand; each one has its own promoter, a light-strand promoter (LSP) and a heavy-strand promoter (HSP), regulating mitochondrial gene’s transcription [8]. mtDNA does not contain introns and encodes just 13 polypeptides which are subunits of the respiratory complexes involved in the OXPHOS. Interestingly, most of them are located into the heavy strand, except for the ND6 gene, which is located in the light strand [9, 10]. The promoters for transcription (LSP and HSP) and the origin of replication of the H strand (OH) are located in a specific area of the mtDNA, the displacement loop (D-loop) which is a noncoding control region [10], both involved in mtDNA transcription and replication [11, 12]. As a result, this region is the site of interaction for the nuclear-encoded transcription and replication factors that translocate to the mitochondrion to mediate mitochondrial genomic activities. Interestingly it has been recently shown that mtDNA can be methylated [13, 14, 15], especially in the D-loop area, and in a strand-specific manner [16, 17], thus potentially differentially affecting mtDNA functions [18]. Variation of mtDNA methylation have been reported in particular due to environmental exposures [15, 19, 20, 21, 22, 23, 24], including also diet, making this mark a potential intermediary agent acting at the interface between the environment and molecular pathways’ activation. Although promising, mtDNA methylation and its impact on replication and transcription are still a discussed topic [25].

Not only mitochondrial genes, but also several nuclear genes regulate mitochondrial functions as well as the epigenetic homeostasis [26]. Indeed, genes expressed in mitochondria work in concert with those expressed in the nucleus to regulate OXPHOS [27]. Nuclear-encoded genes that are important for adipose tissue metabolism and mitochondrial functions include mitochondrial transcription factor A (TFAM), that encodes for the protein primary driving the mtDNA packaging generating nucleoids [28, 29], peroxisome proliferator-activated receptor γ (PPARG) and PPARγ coactivator 1α (PGC1α), regulating adipogenesis, insulin sensitivity and mitochondrial biogenesis [30] and the nuclear respiratory factor 1 (NRF1), that regulates mitochondrial biogenesis and binds to promoters of genes involved in mtDNA transcription such as TFAM [31, 32]. In addition, mitochondria have a central role in the one carbon (1C) metabolism, that regulates bioavailability of methyl groups necessary for DNA methylation [33]. Indeed, mitochondrial respiratory chain dysfunction have been associated to alterations in 1C metabolism pathways [34]. Thus, other nuclear genes with relevant roles in this context are the methylenetetrahydrofolate reductase (MTHFR) and the phosphoglycerate dehydrogenase (PHGDH), regulating methyl groups coming from folate or serine, respectively, and whose methylation levels have been previously associated to obesity and its complications [35, 36].

Recent evidence associated the 1C metabolism to body composition and epigenetic features in obesity [24, 37]; moreover, a reduction of mtDNAcn in circulating blood has been detected as a common feature in both individuals with obesity [24] and patients with cardiovascular diseases [38].

Since epigenetics is tissue-specific [39], the aim of this study was to evaluate if these alterations, previously measured at systemic level, are also typical of dysfunctional VAT in severe obesity (BMI >40). To this purpose, this investigation focuses on mtDNAcn and D-loop methylation in VAT samples collected from extreme phenotypes (BMI ranging from 22 to 53), in association to other epigenetic marks and gene expression of mitochondrial and nuclear genes associated to obesity and DNA methylation pathways.

2. Materials and Methods
2.1 Samples and Data Collection

VAT biopsies from omental depot were obtained from 53 subjects with a wide BMI range, spanning from 22.8 to 53.5, undergoing bariatric and non-bariatric (i.e., cholecystectomy) surgery at the General Hospital Azienda Ospedaliera Universitaria (AOU Ospedali Riuniti; Ancona, Italy). Samples from VAT were collected, immediately snap frozen in liquid nitrogen, and stored at –80 °C. The study protocol was approved by the Ethics Committee of Ospedali Riuniti (Ancona, Italy). The information collected included anthropometric data (BMI) and medical history. Exclusion criteria were the presence of infectious or autoimmune diseases, cancer and neurodegenerative disorders.

2.2 DNA and RNA Extraction

DNA was isolated from adipose tissue using QIAamp Fast DNA Tissue Kit (Qiagen, Milano, Italy) according to the manufacturer’s instructions. The amount of input genomic DNA was quantified by Qubit dsDNA BR Assay Kit (Applied BioSystems, MA, USA). DNA was stored at –80 °C until use. Total RNA was isolated using the Norgen Biotek Kit (Thorold, ON, Canada), according to the manufacturer’s instructions. A first step with Trizol (ThermoFisher Scientific, MA, USA) and chloroform (Sigma-Aldrich, MO, USA) was performed to remove lipid content. RNA was stored at –80 °C until use. RNA amount was determined by spectrophotometric quantification with Nanodrop ONE (NanoDrop Technologies, Wilmington, DE, USA).

2.3 Gene Expression Assessment

Total RNA was reverse-transcribed using High-Capacity cDNA RT Kit with RNase Inhibitor (Applied BioSystems, MA, USA) in a total volume of 20 μL according to the manufacturer’s instructions. qRT-PCR was performed using TaqMan Gene Expression Assays and Master Mix TaqMan (Applied BioSystems, MA, USA). All probes (Supplementary Table 1A) were from Applied BioSystems. Reactions were carried out in a Step One Plus Real Time PCR system (Applied BioSystems, MA, USA) using 50 ng RNA in a final reaction volume of 10 μL. The thermal cycle protocol included: initial incubation at 95 °C for 10 min followed by 40 cycles of 95 °C for 15 s and 60 °C for 20 s. A control reaction without reverse transcriptase in the amplification mixture was performed for each sample to rule out genomic contamination. All samples were run in duplicate. Samples not containing the template were included as negative controls in all experiments. TATA box-binding protein (TBP) and β-actin were used as endogenous controls to normalize gene expression. Relative mRNA expression was determined by the ΔCt method (2-ΔCt).

2.4 Mitochondrial DNA Copy Number Assessment

As previously published [38, 40], relative mtDNAcn quantification was performed by real-time PCR (CFX96; Biorad, CA, USA) considering nDNA as a normalizer (mtLEU_fw; 5′-CACCCAAGAACAGGGTTTGT-3; mtLEU_rv; 5′-TGGCCATGGGTATGTTGTTA-3′; B2M_fw, 5′-TGCTGTCTCCATGTTTGATGTATCT-3′; B2M_rv, 5′-TCTCTGCTCCCCACCTCTAAGT-3′). Relative mtDNAcn was determined by the ΔCt method (2-ΔCt). The mitochondrial primers were previously validated for their specificity (unique amplification of mtDNA) and for the absence of co-amplified nuclear insertions of mitochondrial origin (NUMTs) [40]. All DNA samples were processed under the same conditions and with the same DNA extraction method since variations of the DNA extraction method might affect the evaluation of mtDNAcn [40]. An inter-run calibrator sample was used to adjust the results obtained from different amplification plates.

2.5 Bisulfite Pyrosequencing for Nuclear and Mitochondrial DNA Methylation Analysis

Bisulfite pyrosequencing was performed to evaluate DNA methylation levels in both nuclear and mitochondrial sequences. To avoid inaccurate bisulfite conversion due to the circular structure of the mtDNA, 600 ng of DNA were digested with BamHI (New England Biolabs, MA, USA). Digestion with BamHI was performed in order to linearize the mtDNA, thus reducing the risk of false positive methylation results [41]. Then, DNA was converted with sodium bisulfite using the EZ-96 DNA methylation Gold kit (Zymo Research, CA, USA) according to the manufacturer’s instructions. Primers used to amplify the areas of interest (both nuclear and mitochondrial) are shown in Supplementary Table 1B. Mitochondrial DNA methylation was assessed in two areas of the D-loop, one located in proximity of the mtDNA replication initiation site (Oh) in the heavy strand (heavy chain D-Loop region, HDLR), the other in proximity of the transcription initiation site in the light-strand promoter (light chain D-Loop region, LDLR), as previously described and validated by Vos et al. [16]. The D-loop region is highly relevant to mitochondrial gene transcription, and is one of the few regions on mtDNA that is not included in the nuclear DNA as a NUMTs [42]. For this reason, analysis of methylation in this area does not require previous isolation of mtDNA from nuclear DNA. Concerning nuclear genes, we studied promoters of MTHFR, PHGDH and PPARG, whose methylation has been previously associated to obesity [35, 36, 43, 44]. For MTHFR, a sequence in the 5-untranslated (UTR) region of the MTHFR gene spanning from +30 to +184 from the transcription start site was studied, whose methylation levels were previously found to be inversely correlated with the MTHFR gene expression levels [45, 46, 47] and whose methylation varied in whole blood in a cohort of obese subjects [24]. For PHGDH and PPARG, two areas encompassing specific CpGs (PHGDH cg14476101; PPARG cg01412654) included in the Infinium HumanMethylation450 BeadChip were investigated, supported to have a functional role and whose methylation has been previously associated to obesity and metabolic alterations [35, 44, 48, 49, 50, 51, 52]. In addition, global DNA methylation was measured in the long-interspersed nuclear element-1 (LINE-1), a repetitive DNA retrotransposon. Since LINE-1 constitutes a large portion of the human genome, the extent of LINE-1 methylation is regarded to be a surrogate marker of global DNA methylation. Moreover, since the mitochondrial genome lacks histone complexes and retrotransposons (such as LINE-1) this estimation of global DNA methylation refers exclusively to the nuclear and not to the mitochondrial DNA. LINE-1 methylation was determined interrogating the L1Hs sequences as described by Tabish et al. [53]. PCR amplification of the selected areas was performed using PyroMark PCR kits (Qiagen Inc., The Netherlands) according to the following protocol: 95° for 15 min; 94° for 30 s, 56° for 30 s, 72° for 30 s (×45 cycles); 72° for 10 min. Amplicons were checked for specificity by agarose gel electrophoresis and then pyrosequenced using the Pyromark Q24 (Qiagen Inc., The Netherlands). The degree of methylation was defined as a percentage of methylated cytosines over the sum of methylated and unmethylated cytosines.

2.6 Statistical Analysis

Statistical analysis was performed by using SPSS (IBM SPSS Statistics for Windows, Version 24.0, USA) and R version 3.5.3 (R Core Team, Austria). The Shapiro-Wilk test was used for the analysis of the normality of data distribution. Parameters with skewed distributions were appropriately log-transformed before parametric analyses. Pearson’s correlation was measured to test parametric correlations between continuous variables. Multiple linear regression was applied to test correlations between continuous variables adjusting the model for covariates (age, sex and diagnosis of diabetes). Principal Component Analysis (PCA) with Varimax rotation was used as a technique for dimension reduction in multivariate analysis. Samples with missing data were excluded from the analysis; no imputation was performed. A p value < 0.05 was considered significant through the study. Bonferroni correction was applied to correct p values in multiple comparisons. Due to the exploratory character of the work, nominal p values were also displayed. Technical replicates were not considered for the inference statistics (no inflation of units of analysis was performed).

3. Results
3.1 Descriptive Statistics

The analysed population was composed of 53 subjects (25% males; 75% female) with a mean age of 51 ± 12 y/o. Of 53 subjects, 12% were diagnosed with diabetes. The mean BMI of the recruited population was 41.32 ± 7.8, ranging from a minimal value of 22.8 to a maximum value of 53.4.

3.2 mtDNA Copy Number and Methylation in Obese Omental Adipose Tissue

The mtDNAcn was inversely correlated to BMI (Pearson’s correlation = –0.344; p = 0.011) (Fig. 1A). This association was even more significant after adjusting the analysis for confounding factors (age, sex and diagnosis of diabetes) (β = –0.329; p = 0.004), supporting the hypothesis that obesity is associated to a reduction of mtDNAcn in the omental adipose tissue.

Fig. 1.

Correlations between BMI and mitochondrial DNA copy number and methylation. Scatter plots showing unadjusted Pearson’s correlation between BMI and mtDNAcn (A), % of DNA methylation in the HDLR (B) or in the LDLR (C).

DNA methylation levels measured in the D-loop area of the mitochondrial DNA were different between HDLR and LDLR. In particular, methylation levels measured in the HDLR were low (mean% = 1.22 ± 0.38), with similar levels between the 3 CpGs analysed in the selected area (CpG1 = 1.40 ± 0.57; CpG2 = 1.14 ± 0.40; CpG3 = 1.14 ± 0.40). Higher levels were measured in the LDLR (mean% = 4.49 ± 2.12), with a major contribution of the first CpG among the 3 analysed (CpG1 = 7.56 ± 2.58; CpG2 = 2.83 ± 2.05; CpG3 = 3.07 ± 2.26). These results confirm that, in VAT, DNA methylation levels in the mtDNA can differ between these two areas of the mtDNA (p = 6.6 × 10⁻¹⁶) and are similar to levels previously detected in the whole blood [24] or in placenta [16]. BMI was not correlated to D-loop methylation in the HDLR (p = 0.982) (Fig. 1B) or in the LDLR (p = 0.156) (Fig. 1C). However, adjusting the analysis for age and sex, the association of BMI to LDLR methylation was significant (β = 0.255; p = 0.039). This association showed a p for trend adjusting also for diabetes (β = 0.236; p = 0.052). This might suggest a role of diabetes as a confounding factor, although no associations between diabetes and LDLR methylation were detected in this sample (β = 1.164; p = 0.101). However, this cohort is not suitable to investigate the impact of diabetes on D-loop methylation since this pathology was diagnosed only in a small subset of samples (12%). D-loop methylation levels were not associated to mtDNAcn, neither considering the HDLR (p = 0.522) nor the LDLR (p = 0.773). In a regression model including mtDNAcn and LDLR methylation (adjusted for age, sex and diagnosis of diabetes), both the parameters resulted to be independently associated with BMI, with an opposite direction of the association (mtDNAcn, β = –0.329, p = 0.004; LDLR, β = 0.250, p = 0.029). These data suggest that subjects with severe obesity are more likely to have low mtDNAcn and high LDLR methylation despite these two parameters were not directly correlated in this sample.

3.3 One-carbon Cycle and Mitochondrial Function Genes’ Expression in Obese Omental Tissue

A correlation matrix to explore the relationship between the expression pattern of genes involved in mitochondrial functions, mtDNAcn and obesity degree was computed in the whole population. A cluster of correlated expression levels including genes that regulate mitochondrial biogenesis (PGC1α and PPARG) and genes that regulate the 1C cycle (MTHFR and PHGDH), was shown in Fig. 2. NRF1 mRNA expression clustered with BMI, while TFAM expression with mtDNAcn. This is coherent with the tight relationship existing between mtDNAcn and TFAM [54], which is the protein around which the mitochondrial DNA is wrapped into nucleoids. Coefficients and p values for single correlations are available in Supplementary Table 2A. This exploratory analysis showed that BMI exhibited a positive correlation with PPARG (Spearman’s Rho = 0.395; p = 0.005) and NRF1 (Spearman’s Rho = 0.513; p = 1.9 × 10⁻⁴) expression. This association carries along the alteration of the expression of other genes (PGC1α, PHGDH and MTHFR), which characterize the expression pattern identified in subjects with severe obesity (Supplementary Table 2A).

Fig. 2.

Heatmap of expression of genes involved in mitochondrial and 1C metabolism. This heatmap shows correlations (Pearson’s correlations; no adjustments) between expression of mitochondrial genes, genes regulating the 1C cycle and BMI.

Given the presence of multiple co-correlations among these variables (Bartlett’s Test of Sphericity, p = 7.5 × 10⁻¹⁶), a PCA analysis was performed. Dimension reduction was applied to mtDNAcn, PPARG, NRF1, PGC1α, ND6, PHGDH and MTHFR expression levels. 3 PC were identified, cumulatively explaining 75.3% of the variance. The analysis of the loadings (Supplementary Table 3, Supplementary Fig. 1) showed that PGC1α, PHGDH, PPARG and MTHFR gave a major contribution to PC1, ND6 and TFAM to PC2 and NRF1 and mtDNAcn to PC3.

BMI was significantly correlated to PC3 (Spearman’s Rho = 0.524; p = 7.3 × 10⁻⁴) (Fig. 3A), nominally with PC2 (Spearman’s Rho = 0.327; p = 0.045) (Fig. 3B), while it was not correlated with PC1 (Spearman’s Rho = 0.145; p = 0.384). This highlights that alteration of TFAM and ND6 expression, but even more the mtDNAcn and NRF1 expression are the factors associated with severe obesity in these samples. Adjusting the analysis for age, sex and diabetes diagnosis, BMI exhibited a significant correlation with PC3 (β = 0.409; p = 0.003), but not with PC2 (β = 0.103; p = 0.489) or PC1 (β = 0.089; p = 0.533), supporting that mtDNAcn and NRF1 show the major changes according to the degree of obesity.

Fig. 3.

Correlation between BMI and PC describing mitochondrial and 1CC gene expression. Correlations between BMI and PC3 (A) and PC2 (B) resulting from the PCA.

Despite the genes involved in the 1C cycle (mostly represented by PC1) were not directly associated to BMI, MTHFR and PPARG expression levels were strongly correlated to NRF1 (Supplementary Table 2A). Moreover, adjusting for age, sex and diabetes, PC1 was positively correlated to the global levels of D-Loop methylation (HDLR + LDLR) (β = 0.375; p = 0.033), supporting the hypothesis of a potential functional role of methylation in the mtDNA. BMI was not a confounder of this association (p = 0.282).

PCA results suggest that individuals with high BMI had lower mtDNAcn (PC3), but higher TFAM expression (PC2) values. This was confirmed by a linear regression model including both these parameters, showing that TFAM expression (β = 0.309; p = 0.040) and mtDNAcn (β = –0.427; p = 0.005) were independently and inversely associated to BMI. This is unexpected since TFAM expression has been associated to an up-regulation of mtDNAcn in a previous study [55]. In our samples, a linear regression model adjusted for age, sex, diabetes diagnosis and BMI, showed that TFAM was nominally correlated with mtDNAcn (β = 0.354; p = 0.025) (Supplementary Table 2B), but BMI acted as a significant confounding factor in this association (β = –0.474; p = 0.009). This suggests a perturbation of the equilibrium between TFAM and mtDNA in severe obesity (Supplementary Fig. 2).

3.4 DNA Methylation of Nuclear Genes Promoters, Expression Levels and Associations with the mtDNAcn

Since methylation of MTHFR promoter has been previously associated to obesity [24], associations between methylation levels and MTHFR expression and obesity degree were tested in VAT samples. No significant correlations between methylation in the analysed area and MTHFR expression (r = –0.243; p = 0.111) or BMI (p = 0.384) were detected. No significant association with PPARG expression (r = –0.130; p = 0.400) or with BMI (β = 0.245; p = 0.176) were detected in this population, despite methylation levels of the same area of the PPARG promoter were previously associated with obesity [43, 44]. Similarly, the methylation status of an area of the PHGDH promoter previously associated to obesity [35, 36] was investigated in VAT, but we did not find any association with PHGDH expression levels (r = 0.136; p = 0.398) nor with BMI (β = 0.004; p = 0.983).

Finally, since ND6 is the unique mitochondrial gene located in the light strand of the mtDNA, the correlation between its expression level and LDLR methylation was tested. No significant correlations were measured (r = –0.069; p = 0.668) in these samples. Plots are shown in Supplementary Fig. 3.

Surprisingly, mtDNAcn was nominally negatively correlated with methylation levels of MTHFR and PHGDH nuclear genes (Fig. 4), despite it was not associated with their expression (Supplementary Table 2B). These correlations were independent from the BMI.

Fig. 4.

Correlation between mtDNAcn and methylation in nuclear genes involved in 1CC. MtDNAcn nominally correlates with methylation level at MTHFR (A) PHGDH (B) promoters.

3.5 LINE-1 Methylation

Given the potential alteration of the overall cellular methylation pattern in obesity, methylation levels at the LINE-1, a surrogate marker of global nuclear DNA methylation, were measured in the VAT samples. Adjusting the analysis for age and sex, no direct associations between LINE-1 methylation and BMI (
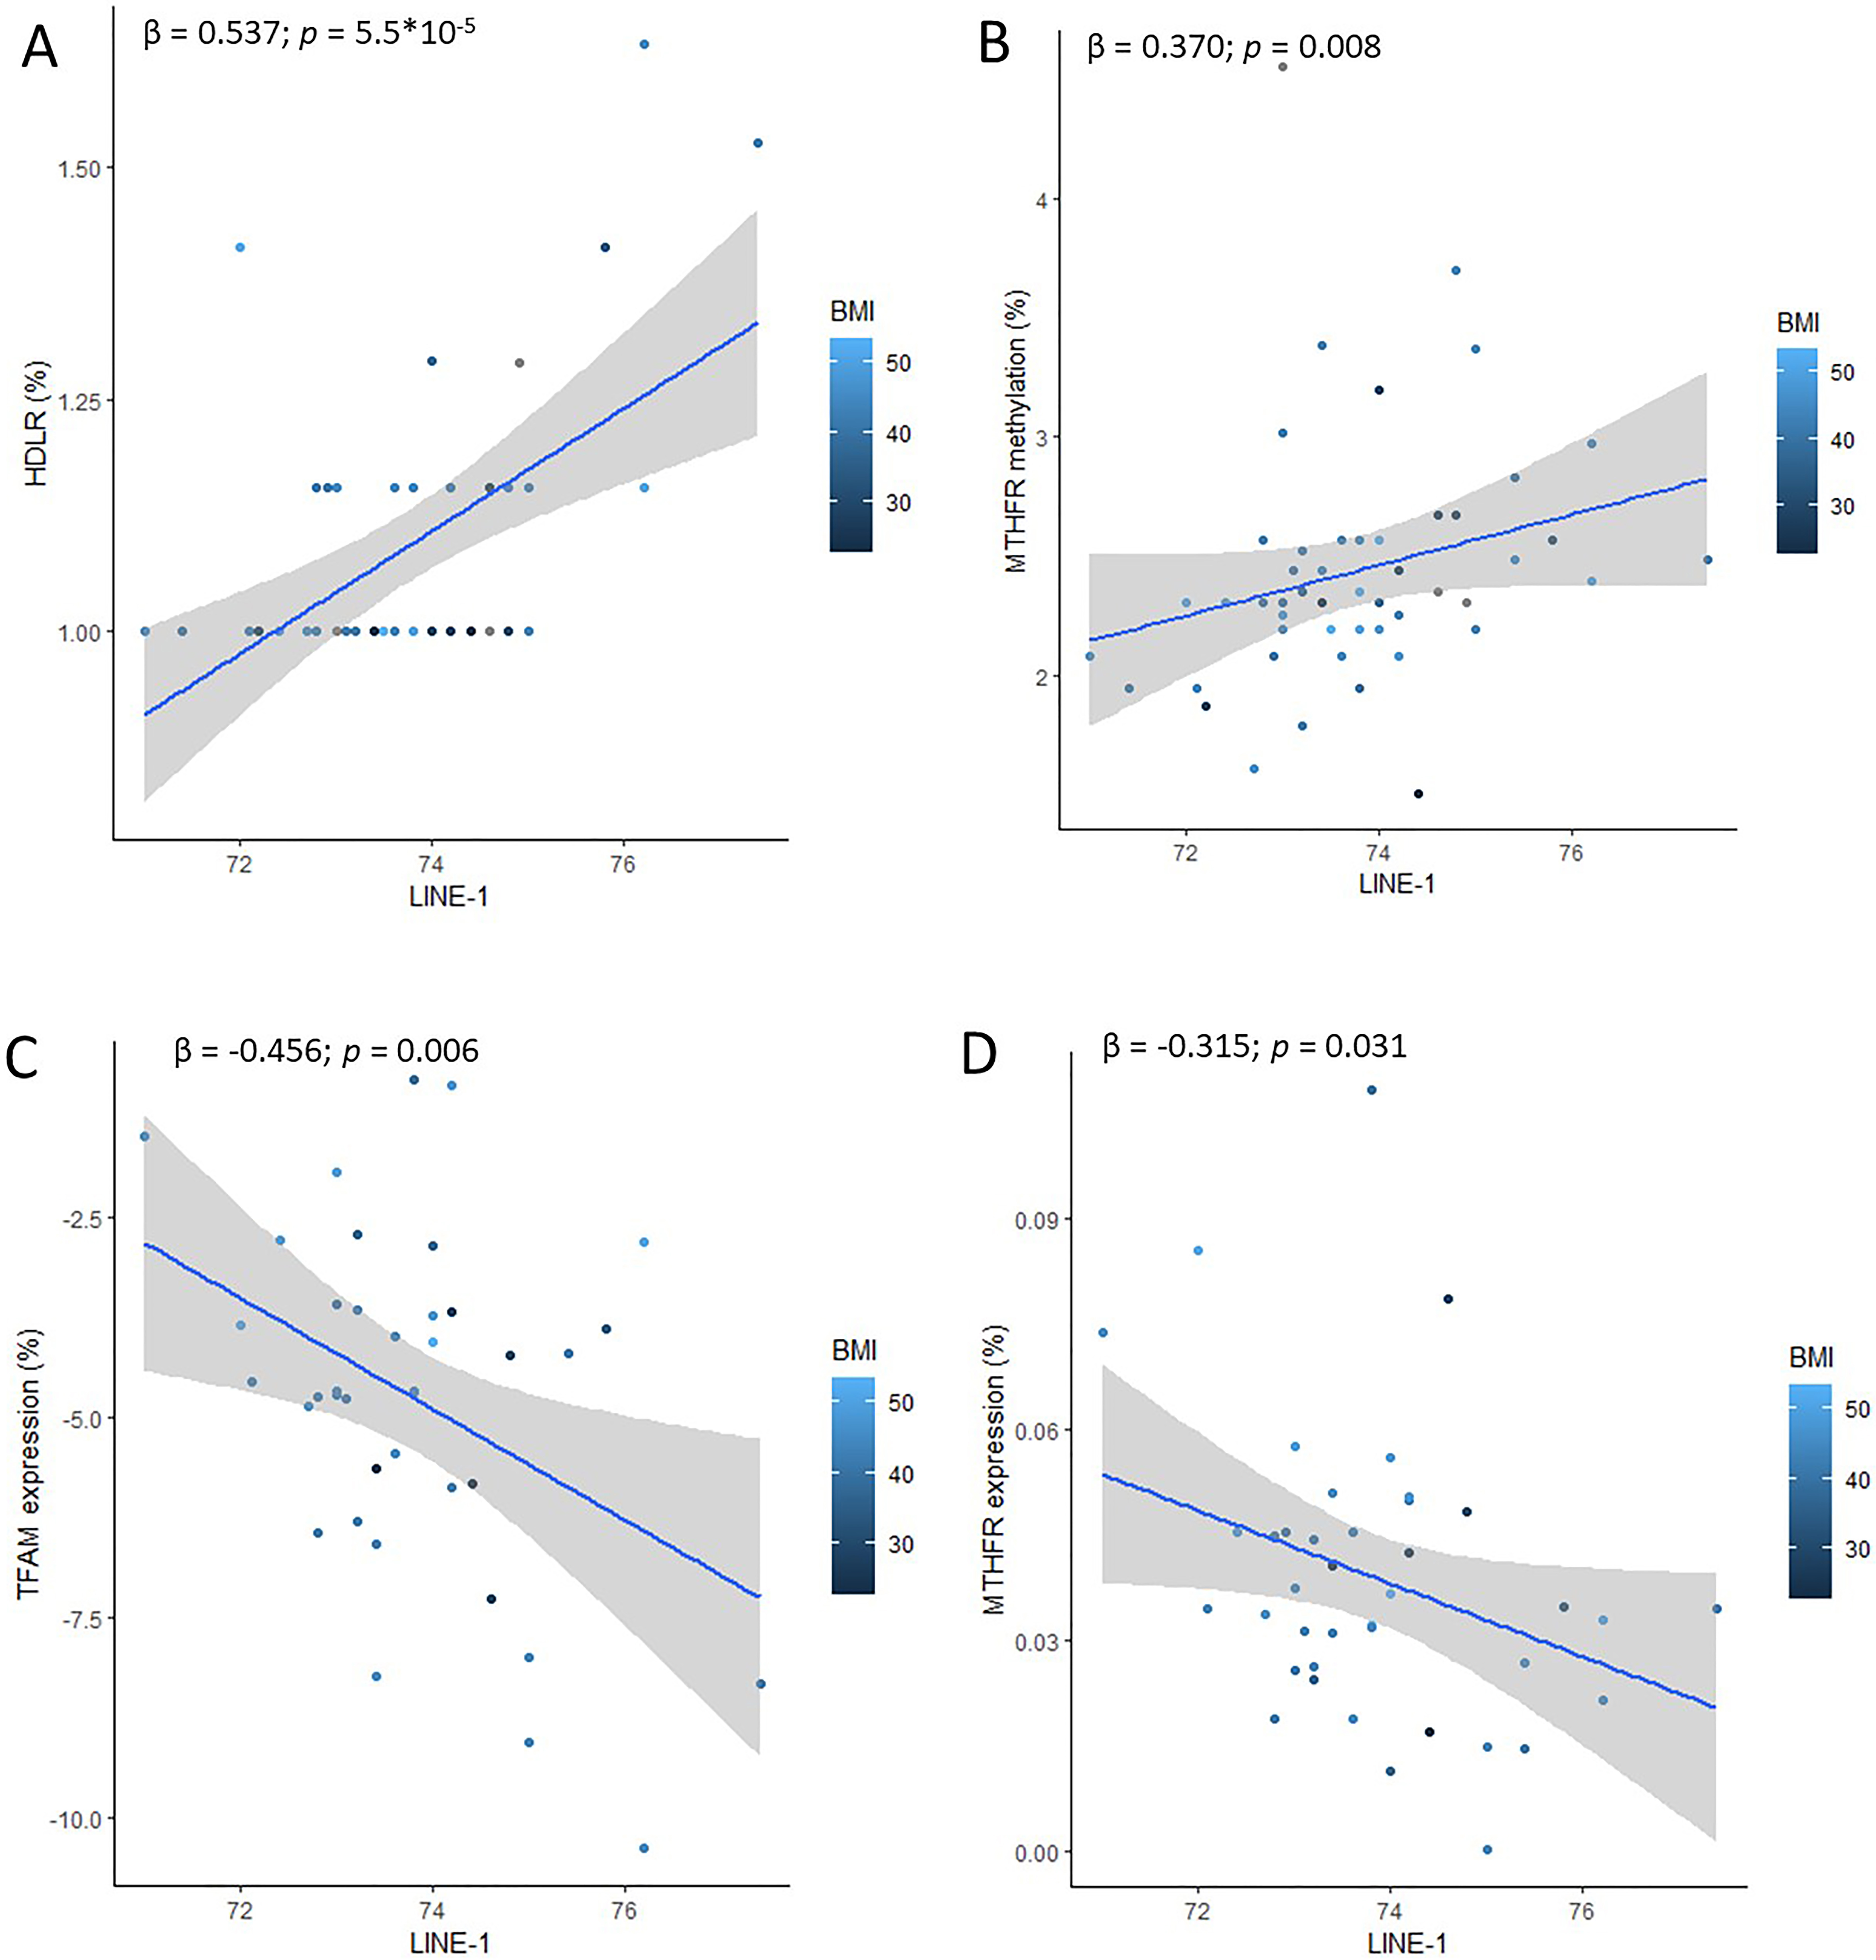
β = –0.58; p = 0.719) or with mtDNAcn (β = 0.015; p = 0.918) were detected. On the other hand, LINE-1 was significantly correlated with HDLR (Spearman’s rho = 0.389; p = 0.008) (Fig. 5A) and barely with LDLR (Spearman’s rho = 0.260; p = 0.068). Adjusting the analysis for age and sex, the association with LINE-1 was confirmed for HDLR (β = 0.537; p = 5.5 × 10⁻⁵), but not for LDLR (β = 0.112; p = 0.444). Moreover, LINE-1 methylation was associated to MTHFR methylation (β = 0.370; p = 0.008) (Fig. 5B), but not with methylation levels at other promoters analysed (Supplementary Table 4). LINE-1 methylation was not associated to mtDNAcn in this population (β = –0.016; p = 0.913; adjusted for age and sex). Concerning gene expression, LINE-1 methylation was significantly correlated with TFAM expression (β = –0.456; p = 0.006) (Fig. 5C) and nominally with MTHFR expression (β = –0.315; p = 0.031) (Fig. 5D). All these associations were independent from the BMI. No associations with other genes or PCs were detected (Supplementary Table 5).

Fig. 5.

Associations between global DNA methylation measured in LINE-1 and methylation in specific areas of the genome involved in the regulation of mitochondrial dynamics. Associations between LINE-1 methylation levels and HDLR methylation (A), MTHFR methylation (B), TFAM expression (C) and MTHFR expression (D). All the associations are independent from BMI.

4. Discussion

Peripheral changes in mtDNAcn have been associated with obesity complications such as cardiovascular disease and diabetes [38, 56, 57]. Moreover, lower mtDNAcn has also been associated with frailty and all-cause mortality [58]. Cells with reduced mtDNAcn show reduced expression of vital complex proteins, altered cellular morphology and lower respiratory enzyme activity [59].

Previous studies have shown that obesity is associated with mtDNAcn changes in peripheral blood [24, 60, 61]. However, contrasting evidence about the association between obesity and mtDNAcn measured in adipose tissue was reported. Lindinger and colleagues showed that omental adipose tissue in obese subjects had a decreased mtDNAcn, which was not correlated with basal metabolic rate and fat oxidation rate [62]. On the contrary, recent investigations did not find changes in mtDNAcn in omental adipose tissue of obese people with respect to controls, while the diagnosis of diabetes was associated to an increase of this parameter [63], suggesting that diabetes rather than obesity might have driven the previously reported association. Litvinova and collaborators have recently shown that mtDNAcn in various fat depots was higher in obese patients with type 2 diabetes than in obese patients without diabetes or in the control subjects and it was related to the levels of leptin and proinflammatory cytokines [64]. In our study, adjusting the analysis for age, sex and diagnoses of diabetes, we found that mtDNAcn in VAT decreased linearly with BMI. This result was coherent with data collected in subcutaneous adipose tissue (SAT) by Fischer et al. [65] and Heinonen et al. [66], that showed a decrease of mtDNAcn in isolated subcutaneous adipocytes of subjects with obesity. According to these findings, a down-regulation of mtDNA-encoded proteins has been measured in VAT of subjects with obesity and associated with aging progression [67]. Coherent findings from animal models showed that a high-fat diet was able to reduce adipose tissue mitochondrial proteins, triggering glucose intolerance in rats [68].

In addition, methylation of the mtDNA has been recently proposed as a potential regulator of mitochondrial functions, despite this is still a controversial topic [21, 25, 69]. Alterations of mtDNA methylation patterns have been measured in obesity analysing peripheral samples [22, 23, 70, 71, 72], but no previous studies investigated this parameter in the omental adipose tissue of people with severe obesity. In our population, methylation in the LDLR was mildly correlated with the BMI adjusting the analysis for sex, age and diagnosis of diabetes. This suggests that increased methylation levels in this area might be implicated in dysfunctional mitochondria, that are typical of people with obesity. However, despite significant, this association is driven by a few individuals with extreme phenotype (BMI >40). It remains to be demonstrated whether the methylation in this area of the mitochondrial DNA has a relevant role in less extreme phenotypes, such as overweight or mild obesity.

Interestingly, HDLR (but not LDLR) methylation was strongly correlated to LINE-1 methylation level (an estimator of global level of DNA methylation in the nucleus also associated to genome stability and to the adiposity status [73]), suggesting a correlation between mitochondrial and nuclear dynamics also from the epigenetic point of view. Indeed, previous studies highlighted a connection between mtDNA and epigenetic regulations in the nucleus [69, 74]. For example, cells harbouring distinct mitochondrial polymorphisms showed differences in nuclear DNA methylation [75, 76]. Recent evidence suggests that also nuclear DNA methylation might contribute to regulate mtDNA methylation. For example, some nuclear encoded proteins involved in mitochondrial function (e.g., PGC1a and NRF1) can up-regulate or down-regulate, respectively, the levels of intra-mitochondrial DNMT1 [77]. However, this is the first study reporting a correlation between methylation at mitochondrial DNA and nuclear LINE-1 sites (which do not encode for specific proteins working in the mitochondrion). It has been recently described that LINE-1 demethylation and consequential retrotransposons activation can be triggered by mitochondrial stress [78], thus representing an additional link between mitochondrial dysfunctions and the nuclear epigenome to investigate. Moreover, in our study LINE-1 methylation was also highly correlated with TFAM expression, which is involved in the regulation of mtDNA copy number, stability, replication and transcription [55, 79]. Remarkably, it has been recently shown that D-loop methylation has the potential to impact TFAM-DNA recognition [18], thus possibly regulating the TFAM-dependent activities in vitro. Since TFAM expression is also correlated to global methylation levels in the nuclear DNA (LINE-1), we can speculate that epigenetic regulations might operate both at mitochondrial (where TFAM operates) and nuclear level (where TFAM is encoded) to regulate the nucleoid functions. These findings suggest further investigations to corroborate this hypothesis. Remarkably, low mtDNAcn and high TFAM expression were independently associated with the obesity degree in the VAT samples analysed in this study. Interestingly, the correlation between mtDNAcn and TFAM was perturbed by obesity, suggesting a deregulation of the ratio between mtDNAcn and the proteins around which it is wrapped (TFAM) to assemble nucleoids. Despite it has been previously demonstrated that mtDNAcn regulation is directly dependent on the TFAM protein levels [55], recently it has emerged that also the ratio of TFAM-to-mtDNAcn is critical for regulating the normal mtDNA expression and is associated with nucleoid replication and transcription both in vitro [54] and in vivo [80]. In mice, a moderate increase in TFAM protein levels still resulted in a normal TFAM-to-mtDNA ratio and unaltered mtDNA expression. However, very high TFAM levels lead to deficient OXPHOS and early postnatal lethality [80]. The authors suggested that TFAM can act as a repressor of mtDNA expression, and this effect can be counterbalanced by tissue-specific expression of regulatory factors. Despite we could not quantify TFAM protein in our samples, results suggest that the direct correlation existing between TFAM expression and mtDNAcn is lost in subjects with severe obesity, which display high TFAM expression without increasing their mtDNAcn.

PCA analysis confirmed that TFAM and ND6 expression (PC2) were correlated to BMI. Also, lower mtDNAcn and higher NRF1 expression (PC1) were identified as markers of severe obesity in our VAT samples. Of note, NRF1 expression was correlated with genes regulating the one-carbon cycle (MTHFR, PHGDH), despite they were not directly associated to BMI. No direct correlations between gene expression and DNA methylation in their respective promoters were detected.

Independently from the BMI, LINE-1 methylation was also associated to methylation in the MTHFR promoter and negatively correlated with MTHFR expression. This is coherent with previous findings suggesting that demethylation of MTHFR promoter might be a strategy to promote MTHFR transcription only in case of suppression of methylation pathways, such as in case of folate deficiency [24]. However, these associations were independent on the obesity condition in this sample. High methylation at MTHFR and PHGDH promoters’ level were nominally correlated to mtDNAcn. According to our findings, recent evidence has shown that changes in mtDNAcn can affect nuclear DNA methylation at specific loci and results in differential expression of specific genes with an impact on human health and disease via altered cell signalling [81]. A bidirectional control of the nuclear and mitochondrial genomes through modulation of DNA methylation to control mtDNA copy number and gene expression has been demonstrated also in tumours [82]. Moreover, adipose tissue mitochondrial dysfunction in obesity has been associated to a specific DNA methylation signature in adipose-derived stem cells [83]. Our findings corroborate the hypothesis of the existence of a crosstalk between the nuclear and the mitochondrial genome [26], also in terms of epigenetic regulations, even though the direction of this association is still to be clarified.

A limit of this study is the low number of samples, especially VAT from healthy normal weight individuals, whose adipose tissue biopsies from surgery were difficult to obtain. However, analysing extreme phenotypes (i.e., VAT from people having a BMI from 22 to 53) should increase the possibility to identify pathways that are normally subtly altered in mild obesity. Secondly, VAT is mostly but not only composed by adipocytes. It also contains pre-adipocytes, fibroblasts, immune cells and vascular cells, which are collectively known as the stromal vascular fraction [84]. The number and phenotype of these cells vary depending on the adipose tissue depot and is also different between obese and lean individuals [85]. Thus, cellular heterogeneity might blur differences in molecular marks which are cell specific such as epigenetic and gene expression changes. Also, we cannot exclude that methylation in other areas of both the nuclear and the mitochondrial genome might play a relevant role in regulation of gene expression in the instances where we did not identify a direct correlation with this epigenetic mark.

In addition, even though we reduced the risk of potential failure of bisulfite conversion due to three-dimensional structures of the mtDNA by linearizing it before the conversion, some other limitations must be recognized when applying bisulfite pyrosequencing to the analysis of mitochondrial DNA: (1) the assessment of methylation with this technical approach was limited to CpG sites, (2) it was not possible to distinguish between methylation and hydroxymethylation, (3) methylation levels in the mtDNA are typically low and near to the limit of detection of the instrument and (4) preferential amplification of low-methylated sequences might occur (in case methylation exists also out of the CpG, as it has been suggested in mtDNA [86]), thus leading to an underestimation of the methylation levels. Despite these limitations, bisulfite pyrosequencing remains the gold standard for targeted analyses of DNA methylation because of its high scalability, specificity and robustness of the results which are given as a percentage of the overall amplicons. Further investigations through Nanopore sequencing technology are planned to provide the missing information.

Finally, the observational design of this study reduces the possibility of mechanistic speculations; in particular, it is not possible to demonstrate the causality of the associations measured between molecular marks and obesity. Also, no information about dietary habits of these individuals were available. Thus, it was not possible to adjust results for different dietary patters. Nevertheless, the impact of diet on mtDNA copy number and methylation has been investigated in another study from our group [87].

5. Conclusions

Evidence from this study suggests that mtDNA can be methylated, especially in the light-strand promoter area (LDLR). According to previous findings [16], despite the low levels of methylation detected in the initiation of mtDNA replication site in the heavy chain (HDLR) do not correlate with mtDNAcn, a possible biological relevance is suggested by their association to global nuclear DNA methylation levels. Since mitochondrial dynamics are correlated to DNA methylation pathways also through the regulation of mtDNAcn, further studies on this topic, including a specific focus on epigenetic regulation of the mitochondrial DNA are warranted. Moreover, additional investigations are required to clarify the role of mtDNAcn in adipocytes, especially in association to the TFAM protein, since conflicting findings exist on its involvement on inflammatory processes [88, 89], and also taking into account the possibility of an involvement of mitochondrial epigenetics in regulating its functions.

Data Availability Statement

The data that support the findings of this study are available in the methods and/or supplementary material of this article.

Abbreviations

ATP, Adenosine triphosphate; D-Loop, Displacement Loop; HDLR, Heavy chain D-Loop region; LDLR, Light chain promoter D-Loop Region; LINE-1, Long interspersed nuclear element-1; MtDNAcn, Mitochondrial DNA copy number; MTHFR, Methylenetetrahydrofolate reductase; NRF1, Nuclear respiratory factor 1; OXPHOS, Oxidative phosphorylation; PGC1α, PPARγ coactivator 1α; PHGDH, Phosphoglycerate dehydrogenase; PPARG, Peroxisome proliferator-activated receptor gamma; PPARG, Proliferator-activated receptor γ; TFAM, Mitochondrial transcription factor A; VAT, Visceral adipose tissue.

Author Contributions

LB Designed research, conducted epigenetic research, analysed data, performed statistical analysis, drafted and reviewed the manuscript. JP Designed research, collected samples, carried out gene expression analyses, review the manuscript. IP Carried out mtDNAcn assessment and epigenetic assays. EDM Collected samples and carried out gene expression analyses. GL, and MG—Resources. AG and RG Supervised the project, reviewed and edited the manuscript.

Ethics Approval and Consent to Participate

Not applicable.

Acknowledgment

We thank the School of Pharmacy of the University of Camerino for having co-founded the PyroMark Q24 Pyrosequencer (Qiagen, Germany).

Funding

This work was supported by grants from University of Camerino Institutional funds awarded to Rosita Gabbianelli (FPA300015) and by grants from Marche Polytechnic University awarded to Antonio Giordano.

Conflict of Interest

The authors declare no conflict of interest. LB, AG and RG are serving as Guest Editors of this journal. We declare that LB, AG and RG had no involvement in the peer review of this article and has no access to information regarding its peer review. Full responsibility for the editorial process for this article was delegated to GP.

References
[1]
Ritchie SA, Connell JMC. The link between abdominal obesity, metabolic syndrome and cardiovascular disease. Nutrition, Metabolism & Cardiovascular Diseases. 2007; 17: 319–326.
[2]
Fox CS, Massaro JM, Hoffmann U, Pou KM, Maurovich-Horvat P, Liu C, et al. Abdominal Visceral and Subcutaneous Adipose Tissue Compartments. Circulation. 2007; 116: 39–48.
[3]
Kasinska MA, Drzewoski J, Sliwinska A. Epigenetic modifications in adipose tissue – relation to obesity and diabetes. Archives of Medical Science. 2016; 6: 1293–1301.
[4]
Perugini J, Bordoni L, Venema W, Acciarini S, Cinti S, Gabbianelli R, et al. Zic1 mRNA is transiently upregulated in subcutaneous fat of acutely cold-exposed mice. Journal of Cellular Physiology. 2019; 234: 2031–2036.
[5]
Martínez JA, Milagro FI, Claycombe KJ, Schalinske KL. Epigenetics in Adipose Tissue, Obesity, Weight Loss, and Diabetes. Advances in Nutrition. 2014; 5: 71–81.
[6]
Lee JH, Park A, Oh KJ, Lee SC, Kim WK, Bae KH. The Role of Adipose Tissue Mitochondria: Regulation of Mitochondrial Function for the Treatment of Metabolic Diseases. International Journal of Molecular Sciences. 2019; 20: 4924.
[7]
Clay Montier LL, Deng JJ, Bai Y. Number matters: control of mammalian mitochondrial DNA copy number. Journal of Genetics and Genomics. 2009; 36: 125–131.
[8]
Montoya J, Christianson T, Levens D, Rabinowitz M, Attardi G. Identification of initiation sites for heavy-strand and light-strand transcription in human mitochondrial DNA. Proceedings of the National Academy of Sciences. 1982; 79: 7195–7199.
[9]
Taanman J. The mitochondrial genome: structure, transcription, translation and replication. Biochimica Et Biophysica Acta (BBA) - Bioenergetics. 1999; 1410: 103–123.
[10]
Clayton DA. Transcription and replication of mitochondrial DNA. Human Reproduction. 2000; 15: 11–17.
[11]
Falkenberg M. Mitochondrial DNA replication in mammalian cells: overview of the pathway. Essays in Biochemistry. 2018; 62: 287–296.
[12]
Anderson S, Bankier AT, Barrell BG, de Bruijn MHL, Coulson AR, Drouin J, et al. Sequence and organization of the human mitochondrial genome. Nature. 1981; 290: 457–465.
[13]
Coppedè F, Stoccoro A. Mitoepigenetics and Neurodegenerative Diseases. Frontiers in Endocrinology. 2019; 10: 86.
[14]
Rots MG. Regulation of mitochondrial gene expression the epigenetic enigma. Frontiers in Bioscience. 2017; 22: 1099–1113.
[15]
Lambertini L, Byun H. Mitochondrial Epigenetics and Environmental Exposure. Current Environmental Health Reports. 2016; 3: 214–224.
[16]
Vos S, Nawrot TS, Martens DS, Byun H, Janssen BG. Mitochondrial DNA methylation in placental tissue: a proof of concept study by means of prenatal environmental stressors. Epigenetics. 2021; 16: 121–131.
[17]
GAO J, WEN S, ZHOU H, FENG S. De-methylation of displacement loop of mitochondrial DNA is associated with increased mitochondrial copy number and nicotinamide adenine dinucleotide subunit 2 expression in colorectal cancer. Molecular Medicine Reports. 2015; 12: 7033–7038.
[18]
Dostal V, Churchill MEA. Cytosine methylation of mitochondrial DNA at CpG sequences impacts transcription factor a DNA binding and transcription. Biochimica Et Biophysica Acta (BBA) - Gene Regulatory Mechanisms. 2019; 1862: 598–607.
[19]
D’Aquila P, Bellizzi D, Passarino G. Mitochondria in health, aging and diseases: the epigenetic perspective. Biogerontology. 2015; 16: 569–585.
[20]
Taormina G, Russo A, Latteri MA, Mirisola MG. Mitochondrion at the Crossroad Between Nutrients and Epigenome. Frontiers in Endocrinology. 2019; 10: 673.
[21]
Ghosh S, Singh KK, Sengupta S, Scaria V. Mitoepigenetics: the different shades of grey. Mitochondrion. 2015; 25: 60–66.
[22]
Corsi S, Iodice S, Shannon O, Siervo M, Mathers J, Bollati V, et al. Mitochondrial DNA methylation is associated with Mediterranean diet adherence in a population of older adults with overweight and obesity. Proceedings of the Nutrition Society. 2020; 79: E95.
[23]
Bordoni L, Smerilli V, Nasuti C, Gabbianelli R. Mitochondrial DNA methylation and copy number predict body composition in a young female population. Journal of Translational Medicine. 2019; 17: 399.
[24]
Bordoni L, Petracci I, Mlodzik-Czyzewska M, Malinowska AM, Szwengiel A, Sadowski M, et al. Mitochondrial DNA and Epigenetics: Investigating Interactions with the one-Carbon Metabolism in Obesity. Oxidative Medicine and Cellular Longevity. 2022; 2022: 1–12.
[25]
van der Wijst MGP, Rots MG. Mitochondrial epigenetics: an overlooked layer of regulation? Trends in Genetics. 2015; 31: 353–356.
[26]
F. C. Lopes A. Mitochondrial metabolism and DNA methylation: a review of the interaction between two genomes. Clinical Epigenetics. 2020; 12: 182.
[27]
Cagin U, Enriquez JA. The complex crosstalk between mitochondria and the nucleus: what goes in between? The International Journal of Biochemistry & Cell Biology. 2015; 63: 10–15.
[28]
Kaufman BA, Durisic N, Mativetsky JM, Costantino S, Hancock MA, Grutter P, et al. The Mitochondrial Transcription Factor TFAM Coordinates the Assembly of Multiple DNA Molecules into Nucleoid-like Structures. Molecular Biology of the Cell. 2007; 18: 3225–3236.
[29]
Farge G, Falkenberg M. Organization of DNA in Mammalian Mitochondria. International Journal of Molecular Sciences. 2019; 20: 2770.
[30]
Deng T, Sieglaff DH, Zhang A, Lyon CJ, Ayers SD, Cvoro A, et al. A peroxisome proliferator-activated receptor gamma (PPARgamma)/PPARgamma coactivator 1beta autoregulatory loop in adipocyte mitochondrial function. Journal of Biological Chemistry. 2011; 286: 30723–30731.
[31]
Evans MJ, Scarpulla RC. NRF-1: a trans-activator of nuclear-encoded respiratory genes in animal cells. Genes & Development. 1990; 4: 1023–1034.
[32]
Virbasius JV, Scarpulla RC. Activation of the human mitochondrial transcriptionfactor a gene by nuclear respiratory factors: a potential regulatory linkbetween nuclear and mitochondrial gene expression in organellebiogenesis. Proceedings of the National Academy of Sciences. 1994; 91: 1309–1313.
[33]
Ducker GS, Rabinowitz JD. One-Carbon Metabolism in Health and Disease. Cell Metabolism. 2017; 25: 27–42.
[34]
Bao XR, Ong SE, Goldberger O, Peng J, Sharma R, Thompson DA, et al. Mitochondrial dysfunction remodels one-carbon metabolism in human cells. Elife. 2016; 5: e10575.
[35]
Aslibekyan S, Demerath EW, Mendelson M, Zhi D, Guan W, Liang L, et al. Epigenome-wide study identifies novel methylation loci associated with body mass index and waist circumference. Obesity. 2015; 23: 1493–1501.
[36]
dos Santos Nunes MK, Silva AS, de Queiroga Evangelista IW, Filho JM, Gomes CNAP, do Nascimento RAF, et al. Hypermethylation in the promoter of the MTHFR gene is associated with diabetic complications and biochemical indicators. Diabetology & Metabolic Syndrome. 2017; 9: 84.
[37]
Młodzik-Czyżewska MA, Szwengiel A, Malinowska AM, Chmurzynska A. Comparison of Associations between one-Carbon Metabolism, Lipid Metabolism, and Fatty Liver Markers in Normal-Weight and Overweight People Aged 20–40 Years. Annals of Nutrition and Metabolism. 2021; 77: 221–230.
[38]
Bordoni L, Petracci I, Pelikant-Malecka I, Radulska A, Piangerelli M, Samulak JJ, et al. Mitochondrial DNA copy number and trimethylamine levels in the blood: New insights on cardiovascular disease biomarkers. The FASEB Journal. 2021; 35: e21694.
[39]
Wu H, Sun YE. Epigenetic Regulation of Stem Cell Differentiation. Pediatric Research. 2006; 59: 21R–25R.
[40]
Fazzini F, Schöpf B, Blatzer M, Coassin S, Hicks AA, Kronenberg F, et al. Plasmid-normalized quantification of relative mitochondrial DNA copy number. Scientific Reports. 2018; 8: 15347.
[41]
Liu B, Du Q, Chen L, Fu G, Li S, Fu L, et al. CpG methylation patterns of human mitochondrial DNA. Scientific Reports. 2016; 6: 23421.
[42]
Tsuji J, Frith MC, Tomii K, Horton P. Mammalian NUMT insertion is non-random. Nucleic Acids Research. 2012; 40: 9073–9088.
[43]
Małodobra-Mazur M, Cierzniak A, Kaliszewski K, Dobosz T. PPARG Hypermethylation as the First Epigenetic Modification in Newly Onset Insulin Resistance in Human Adipocytes. Genes. 2021; 12: 889.
[44]
Volberg V, Yousefi P, Huen K, Harley K, Eskenazi B, Holland N. CpG Methylation across the adipogenic PPARγ gene and its relationship with birthweight and child BMI at 9 years. BMC Medical Genetics. 2017; 18: 7.
[45]
Vaissière T, Hung RJ, Zaridze D, Moukeria A, Cuenin C, Fasolo V, et al. Quantitative Analysis of DNA Methylation Profiles in Lung Cancer Identifies Aberrant DNA Methylation of Specific Genes and its Association with Gender and Cancer Risk Factors. Cancer Research. 2009; 69: 243–252.
[46]
Coppedè F, Stoccoro A, Tannorella P, Gallo R, Nicolì V, Migliore L. Association of Polymorphisms in Genes Involved in One-Carbon Metabolism with MTHFR Methylation Levels. International Journal of Molecular Sciences. 2019; 20: 3754.
[47]
Lopomo A, Ricciardi R, Maestri M, De Rosa A, Melfi F, Lucchi M, et al. Gene-Specific Methylation Analysis in Thymomas of Patients with Myasthenia Gravis. International Journal of Molecular Sciences. 2016; 17: 2121.
[48]
Truong V, Huang S, Dennis J, Lemire M, Zwingerman N, Aïssi D, et al. Blood triglyceride levels are associated with DNA methylation at the serine metabolism gene PHGDH. Scientific Reports. 2017; 7: 11207.
[49]
Kho M, Zhao W, Ratliff SM, Ammous F, Mosley TH, Shang L, et al. Epigenetic loci for blood pressure are associated with hypertensive target organ damage in older African Americans from the genetic epidemiology network of Arteriopathy (GENOA) study. BMC Medical Genomics. 2020; 13: 131.
[50]
Li X, Qi L. Epigenetics in Precision Nutrition. Journal of Personalized Medicine. 2022; 12: 533.
[51]
Wahl S, Drong A, Lehne B, Loh M, Scott WR, Kunze S, et al. Epigenome-wide association study of body mass index, and the adverse outcomes of adiposity. Nature. 2016; 541: 81.
[52]
Arner P, Sinha I, Thorell A, Rydén M, Dahlman-Wright K, Dahlman I. The epigenetic signature of subcutaneous fat cells is linked to altered expression of genes implicated in lipid metabolism in obese women. Clinical Epigenetics. 2015; 7: 93.
[53]
Tabish AM, Baccarelli AA, Godderis L, Barrow TM, Hoet P, Byun H. Assessment of Changes in Global DNA Methylation Levels by Pyrosequencing® of Repetitive Elements. Methods in Molecular Biology. 2015; 409: 201–207.
[54]
Brüser C, Keller-Findeisen J, Jakobs S. The TFAM-to-mtDNA ratio defines inner-cellular nucleoid populations with distinct activity levels. Cell Reports. 2021; 37: 110000.
[55]
Ekstrand MI, Falkenberg M, Rantanen A, Park CB, Gaspari M, Hultenby K, et al. Mitochondrial transcription factor A regulates mtDNA copy number in mammals. Human Molecular Genetics. 2004; 13: 935–944.
[56]
Ashar FN, Zhang Y, Longchamps RJ, Lane J, Moes A, Grove ML, et al. Association of Mitochondrial DNA Copy Number with Cardiovascular Disease. JAMA Cardiology. 2017; 2: 1247.
[57]
Constantin-Teodosiu D, Constantin D, Pelsers MM, Verdijk LB, van Loon L, Greenhaff PL. Mitochondrial DNA copy number associates with insulin sensitivity and aerobic capacity, and differs between sedentary, overweight middle-aged males with and without type 2 diabetes. International Journal of Obesity. 2020; 44: 929–936.
[58]
Ashar FN, Moes A, Moore AZ, Grove ML, Chaves PHM, Coresh J, et al. Association of mitochondrial DNA levels with frailty and all-cause mortality. Journal of Molecular Medicine. 2015; 93: 177–186.
[59]
Jeng J, Yeh T, Lee J, Lin S, Fong T, Hsieh R. Maintenance of mitochondrial DNA copy number and expression are essential for preservation of mitochondrial function and cell growth. Journal of Cellular Biochemistry. 2008; 103: 347–357.
[60]
Lee J, Lee D, Im J, Lee J. Mitochondrial DNA Copy Number in Peripheral Blood is Independently Associated with Visceral Fat Accumulation in Healthy Young Adults. International Journal of Endocrinology. 2014; 2014: 1–7.
[61]
Skuratovskaia D, Litvinova L, Vulf M, Zatolokin P, Popadin K, Mazunin I. From Normal to Obesity and Back: The Associations between Mitochondrial DNA Copy Number, Gender, and Body Mass Index. Cells. 2019; 8: 430.
[62]
Lindinger A, Peterli R, Peters T, Kern B, von Flüe M, Calame M, et al. Mitochondrial DNA Content in Human Omental Adipose Tissue. Obesity Surgery. 2010; 20: 84–92.
[63]
Skuratovskaia DA, Sofronova JK, Zatolokin PA, Popadin KY, Vasilenko MA, Litvinova LS, et al. Additional evidence of the link between mtDNA copy number and the body mass index. Mitochondrial DNA Part a. 2018; 29: 1240–1244.
[64]
Litvinova L, Zatolokin P, Vulf M, Mazunin I, Skuratovskaia D. The relationship between the mtDNA copy number in insulin-dependent tissues and markers of endothelial dysfunction and inflammation in obese patients. BMC Medical Genomics. 2019; 12: 41.
[65]
Fischer B, Schöttl T, Schempp C, Fromme T, Hauner H, Klingenspor M, et al. Inverse relationship between body mass index and mitochondrial oxidative phosphorylation capacity in human subcutaneous adipocytes. American Journal of Physiology-Endocrinology and Metabolism. 2015; 309: E380–E387.
[66]
Heinonen S, Buzkova J, Muniandy M, Kaksonen R, Ollikainen M, Ismail K, et al. Impaired Mitochondrial Biogenesis in Adipose Tissue in Acquired Obesity. Diabetes. 2015; 64: 3135–3145.
[67]
Gómez-Serrano M, Camafeita E, López JA, Rubio MA, Bretón I, García-Consuegra I, et al. Differential proteomic and oxidative profiles unveil dysfunctional protein import to adipocyte mitochondria in obesity-associated aging and diabetes. Redox Biology. 2017; 11: 415–428.
[68]
Sutherland LN, Capozzi LC, Turchinsky NJ, Bell RC, Wright DC. Time course of high-fat diet-induced reductions in adipose tissue mitochondrial proteins: potential mechanisms and the relationship to glucose intolerance. American Journal of Physiology-Endocrinology and Metabolism. 2008; 295: E1076–E1083.
[69]
Matilainen O, Quirós PM, Auwerx J. Mitochondria and Epigenetics – Crosstalk in Homeostasis and Stress. Trends in Cell Biology. 2017; 27: 453–463.
[70]
Zheng LD, Brooke J, Smith C, Almeida FA, Cheng Z. Mitochondrial epigenetic changes and progression from metabolically healthy obesity to metabolically unhealthy obesity: a cross-sectional study. The Lancet Diabetes & Endocrinology. 2016; 4: S16.
[71]
Zheng LD, Linarelli LE, Liu L, Wall SS, Greenawald MH, Seidel RW, et al. Insulin resistance is associated with epigenetic and genetic regulation of mitochondrial DNA in obese humans. Clinical Epigenetics. 2015; 7: 60.
[72]
Corsi S, Iodice S, Vigna L, Cayir A, Mathers JC, Bollati V, et al. Platelet mitochondrial DNA methylation predicts future cardiovascular outcome in adults with overweight and obesity. Clinical Epigenetics. 2020; 12: 29.
[73]
Marques-Rocha JL, Milagro FI, Mansego ML, Mourão DM, Martínez JA, Bressan J. LINE-1 methylation is positively associated with healthier lifestyle but inversely related to body fat mass in healthy young individuals. Epigenetics. 2016; 11: 49–60.
[74]
Wiese M, Bannister AJ. Two genomes, one cell: Mitochondrial-nuclear coordination via epigenetic pathways. Molecular Metabolism. 2020; 38: 100942.
[75]
De Paepe B. How mitochondrial DNA-driven changes to chromosomal DNA methylation add a layer of complexity to mitochondrial disease. Epigenomics. 2019; 11: 1749–1751.
[76]
Atilano SR, Malik D, Chwa M, Cáceres-Del-Carpio J, Nesburn AB, Boyer DS, et al. Mitochondrial DNA variants can mediate methylation status of inflammation, angiogenesis and signaling genes. Human Molecular Genetics. 2015; 24: 4491–4503.
[77]
Shock LS, Thakkar PV, Peterson EJ, Moran RG, Taylor SM. DNA methyltransferase 1, cytosine methylation, and cytosine hydroxymethylation in mammalian mitochondria. Proceedings of the National Academy of Sciences. 2011; 108: 3630–3635.
[78]
Baeken MW, Moosmann B, Hajieva P. Retrotransposon activation by distressed mitochondria in neurons. Biochemical and Biophysical Research Communications. 2020; 525: 570–575.
[79]
Kanki T, Ohgaki K, Gaspari M, Gustafsson CM, Fukuoh A, Sasaki N, et al. Architectural Role of Mitochondrial Transcription Factor a in Maintenance of Human Mitochondrial DNA. Molecular and Cellular Biology. 2004; 24: 9823–9834.
[80]
Bonekamp NA, Jiang M, Motori E, Garcia Villegas R, Koolmeister C, Atanassov I, et al. High levels of TFAM repress mammalian mitochondrial DNA transcription in vivo. Life Science Alliance. 2021; 4: e202101034.
[81]
Castellani CA, Longchamps RJ, Sumpter JA, Newcomb CE, Lane JA, Grove ML, et al. Mitochondrial DNA copy number can influence mortality and cardiovascular disease via methylation of nuclear DNA CpGs. Genome Medicine. 2020; 12: 84.
[82]
Sun X, St John JC. Modulation of mitochondrial DNA copy number in a model of glioblastoma induces changes to DNA methylation and gene expression of the nuclear genome in tumours. Epigenetics & Chromatin. 2018; 11: 53.
[83]
Ejarque M, Ceperuelo-Mallafré V, Serena C, Maymo-Masip E, Duran X, Díaz-Ramos A, et al. Adipose tissue mitochondrial dysfunction in human obesity is linked to a specific DNA methylation signature in adipose-derived stem cells. International Journal of Obesity. 2019; 43: 1256–1268.
[84]
Rosen E, Spiegelman B. What we Talk about when we Talk about Fat. Cell. 2014; 156: 20–44.
[85]
Ouchi N, Parker JL, Lugus JJ, Walsh K. Adipokines in inflammation and metabolic disease. Nature Reviews Immunology. 2011; 11: 85–97.
[86]
Patil V, Cuenin C, Chung F, Aguilera JR, Fernandez-Jimenez N, Romero-Garmendia I, et al. Human mitochondrial DNA is extensively methylated in a non-CpG context. Nucleic Acids Research. 2019; 47: 10072–10085.
[87]
Bordoni L, Malinowska AM, Petracci I, Szwengiel A, Gabbianelli R, Chmurzynska A. Diet, trimethylamine metabolism and mitochondrial DNA: an observational study. Molecular Nutrition & Food Research. 2022. (in press)
[88]
Riley JS, Tait SW. Mitochondrial DNA in inflammation and immunity. EMBO Reports. 2020; 21: e49799–e49799.
[89]
West AP, Shadel GS. Mitochondrial DNA in innate immune responses and inflammatory pathology. Nature Reviews Immunology. 2017; 17: 363–375.
Share
Back to top