


 , José De La Cruz-Agüero 1, Eugenia López-López 2, Pablo Del Monte-Luna 1, María Magdalena Díaz-Argüero 2, Arturo Chacón-Torres 3, Arely Ramírez-García 4, Omar Domínguez-Domínguez 5, Juan Pablo Ramírez-Herrejón 6
1 Centro Interdisciplinario de Ciencias Marinas, Instituto Politécnico Nacional, Av. Instituto Politécnico Nacional s/n Col. Playa Palo de Santa Rita, 23096 La Paz, B.C.S., México
2 Escuela Nacional de Ciencias Biológicas, Instituto Politécnico Nacional, Prol. de Carpio y Plan de Ayala s/n, Col. Sto. Tomás, 11340 México, D.F., México
3 Instituto de Investigaciones sobre los Recursos Naturales, Universidad Michoacana de San Nicolás de Hidalgo, Avenida San Juanito Itzicuaro s/n, Nueva Esperanza, 58330 Morelia, Michoacán, México
4 Programa Institucional de Doctorado en Ciencias Biológicas, Universidad Michoacana de San Nicolás de Hidalgo, Avenida Francisco J. Múgica S/N, 58030 Morelia, Michoacán, Mexico
5 Laboratorio de Biología Acuática, Universidad Michoacana de San Nicolás de Hidalgo, Avenida Francisco J. Múgica S/N, 58030 Morelia, Michoacán, Mexico
6 Conacyt-Universidad Autónoma de Querétaro, Facultad de Ciencias Naturales, Campus UAQ-Aeropuerto, Carretera a Chichimequillas s/n, Ejido Bolaños, 76140 Santiago de Querétaro, Querétaro, Mexico
Academic Editor: Graham Pawelec
Abstract
Background: Analyses of spatial and temporal patterns and interactions are important for determining the abiotic factors limiting populations and the impact from other species and different anthropogenic stressors that promote the extirpation of species. The fish Hubbsina turneri de Buen (1940) was studied as a model species in a historical context at varying locations. Originally distributed only in the Lerma-Chapala basin, the main lake complex in Mexico, this species has not been collected from Lake Cuitzeo (LC) and now is restricted to Lake Zacapu (LZ). At present, the Highland splitfin is classified as critically endangered. Methods: Historical information of LC and historical and current information from LZ were explored by applying cluster analysis and generalized additive mixed model (GAMM) to describe the biotic interactions among fish species and the relationship between density and environmental variables, respectively. The two lakes’ contrasting abiotic/biotic characteristics provided elements to describe some species distribution limits in chemical ion gradients. Extirpation calendar dates were estimated using an optimal linear estimation method. Finally, a bibliographic review was conducted on the causes that promoted the extirpation and restriction of H. turneri and the prognosis for its reestablishment and conservation. Results: Clusters showed the fishes relationship according to their distribution along the lakes. GAMM indicated that high H. turneri density is related to low hardness/fecal coliforms, medium depth/suspended solids, and high oxygen concentration. Estimated extirpation dates were between the years 2013 and 2018. The extirpation was linked to an abrupt drop in the LC volume, water quality degradation, increased biotic interactions within macrophytes habitats with native and introduced species, and fisheries bycatches. The current restricted range of H. turneri resulted from the draining of the larger lake, forcing the remaining populations to small spring-fed remnants. Recent samplings in LZ resulted in a low number of individuals. Conclusions: The integration of ecological interactions derived from statistical models, extirpation dates from nonparametric tests, and the exhaustive analysis of historical information can be applied to define the current situation of imperiled, ecologically relevant species, in different aquatic ecosystems. We are confident that this general framework is important for determining (1) the requirements and limitations of populations regarding abiotic variables, (2) biotic interactions (trophic and spatial) with native and introduced species, and (3) different anthropogenic stressors within and around the ecosystem. This knowledge will also allow understanding those aspects that contribute to the extirpation of populations and could help the restoration of the habitat and the reintroduction of extirpated species.
Keywords
- endangered species
- sub-tropical lakes
- GAMM
- OLEM
- degradation
- urban development
There are three main ideas regarding important aspects while studying endangered species conservation [1], the first being environmental characteristics that determine habitat use, habitat requirements, and distribution [2]. Some local and restricted-range species are important indicators of environmental quality that can be used to prevent biodiversity loss, establish conservation priorities, and promote restoration practices [3]. Although different studies have reviewed the bio-ecological characteristics of fishes (e.g., [4, 5]), an important constraint in Latin American research is the poor or incomplete historical scientific knowledge, particularly on imperiled species [6]. Previous studies have mainly included statistical models of species responses to environmental factors. Different studies have analyzed the patterns of multiple interacting factors affecting autoecological profiles with more flexible statistical models to create a comprehensive framework that relates these factors to species abundance [7, 8, 9].
The second topic is the determination of the extent to which different anthropogenic stressors can change the structure and function of freshwater ecosystems at different scales and promote the decrease of native populations and, in some extreme cases, local extinctions. Increasing demand for water by humans, significant depletion of water body volumes, pollution, habitat degradation, and the presence of introduced or invasive species, are closely correlated to population declines of endangered species [10, 11, 12]. For example, in Central Mexico, 25% of the sites with fish records had conditions that were no longer capable of sustaining life at the end of the 1980s [13]. In 2000, this figure increased to 40%, in 2012 to 53%, and in 2020 to 64% of the sites were classified as polluted or strongly polluted [14, 15]. As a consequence, 40% of the fish species in the country exhibited some degree of risk, and three of them are extinct [16]. Information from historical sources and past field research can potentially reveal evidence about the drivers, rates, and magnitudes of declines [17]. Understanding the course of events related to an extinction incident is critical to prevent such incidents from occurring in the future [18].
The third topic is the opportunity for the reestablishment, recovery, and conservation of wild populations of imperiled fish species. In different countries, the restoration and conservation of aquatic systems have been intensively discussed over the last three decades and ecological studies have been encouraged for reestablishing fish populations [19, 20, 21]; however, progress has been limited, primarily due to the high cost of restoration and the low economic importance of the target species [22]. Therefore, greater emphasis has been placed on the ecosystem services provided by water bodies and the biological and ecological characteristics of the species as study models in different research fields (i.e., viviparity, diversification, adaptation, toxicity bioindicators) [23, 24].
Different studies have used multivariate methods to explore fish assemblages, particularly hierarchical clustering [25]. Cluster analysis helps group species according to their redundant pattern’s similarity [26], which can be approximated to the ecological relationships [27]. Generally, information is aggregated temporally (e.g., year, season, month), spatially (e.g., location, depth), or even combining different types of capture gear [28, 29]. Habitat models have been used to analyze species correlated and clustered responses to environmental variables, applying nonparametric techniques such as Generalized additive mixed models (GAMMs), which incorporate random effects [30]. GAMMs have been implemented in different aquatic ecosystems to account for environmental fluctuating variables’ temporal and spatial impact on endangered fish distribution within protected areas [9]. The optimal linear estimation method is regularly used from the sighting or collections records to determine the potential dates of extinction of an organism’s population and colonies in a conservative way [31]. The importance of establishing a potential time interval is that it allows the historical-critical revision of the possible events, both natural and anthropogenic, that promoted changes in the ecosystem and the loss of the species. This knowledge also provides those key elements that must be addressed for the restoration of the species [32].
The goodeid Hubbsina turneri was selected as a model species for analysis because, according to the data as far collected, it was endemic to Lake Cuitzeo (LC) and Lake Zacapu (LZ), Mexico, which are ecosystems with contrasting habitat characteristics [33, 34]. This species currently has a restricted-range and is found only in LZ, which is the primary reason for the endangered status under the Mexican Official Norm (NOM-059-SEMARNAT-2010) and is listed as critically endangered by the IUCN [35]. The biological characteristics of this species have been studied at different time periods [33]; as a result, there is sufficient ecological information to analyze the species-habitat, species-species relationships, and estimate potential extirpation dates. Our goals were to (1) determine and contrast the species interactions and water quality variables that have influenced the populations of this species in both lakes by using nonparametric statistical analyses; (2) estimate possible extinction dates of the species in LC, using linear estimation methods, aiming at establishing and identifying potential threats that may have led to this extinction; and (3) review and discuss the historical process that led to the restriction of H. turneri to LZ and the constraints to its reintroduction to LC.
LC and LZ are located in Central Mexico, within the Lerma-Chapala basin (Fig. 1). According to a morphostructural geological analysis, both lakes were jointed
at the Pliocene-Pleistocene boundary by wide channels related to morphotectonic
structures and then separated during the Pleistocene-Holocene period [36]. LC,
the second largest natural lake in the country, is a shallow tropical system (375
km
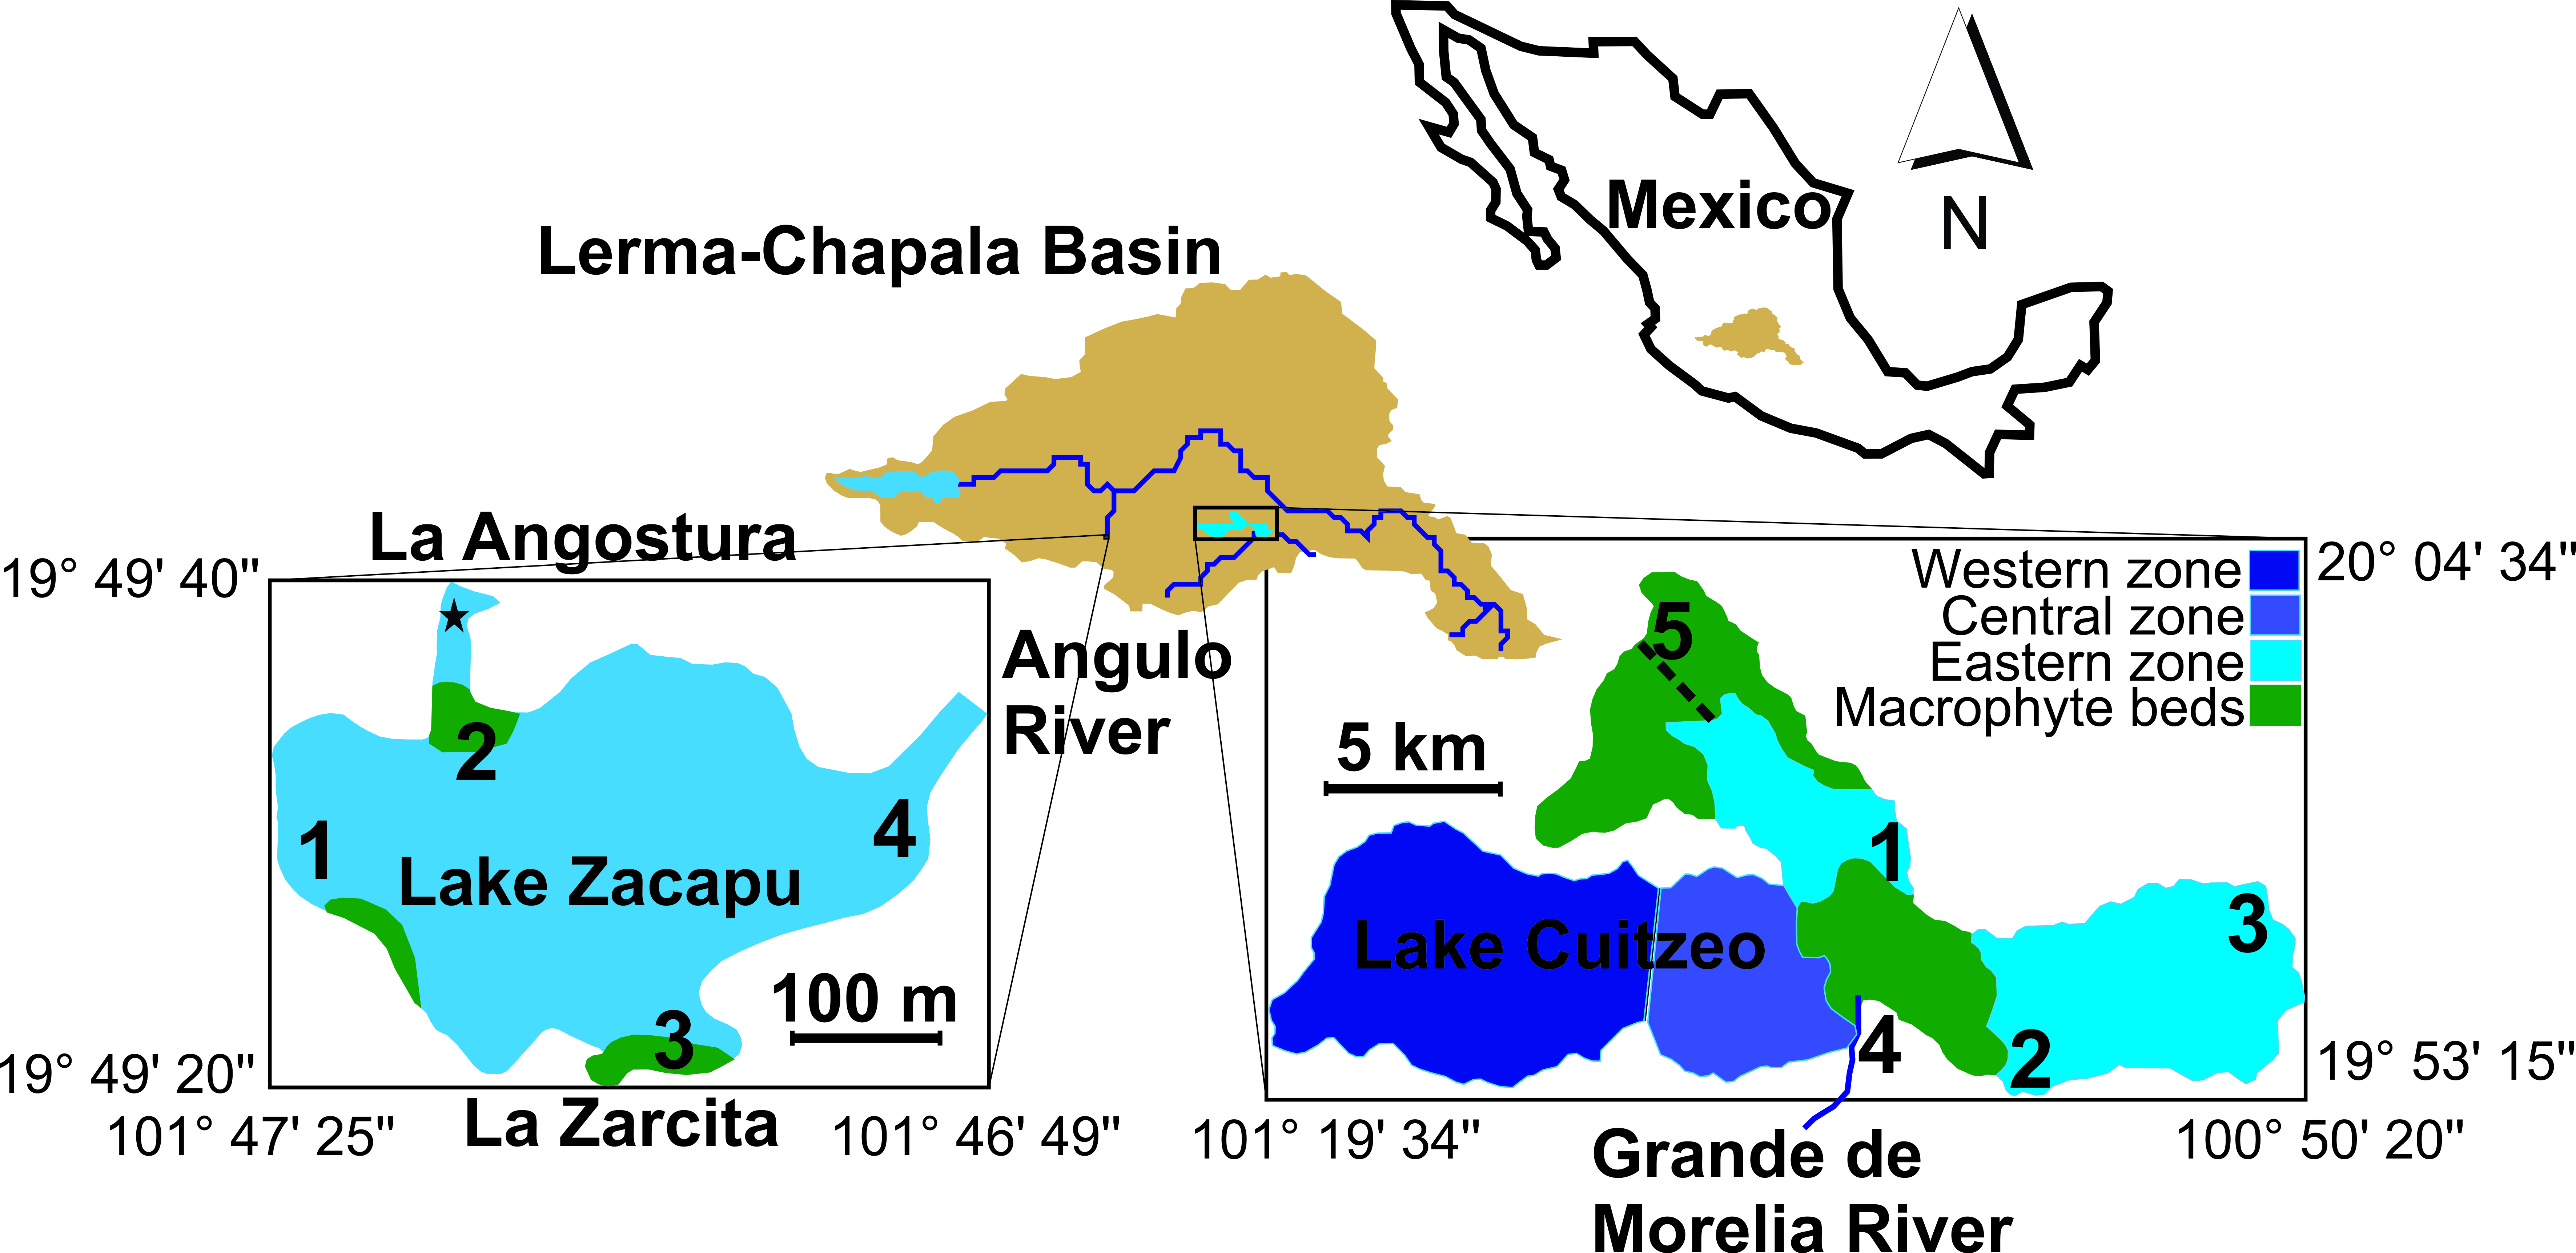 Fig. 1.
Location of Lake Cuitzeo and Lake Zacapu within the Lerma-Chapala Basin, indicating the sampling sites. Names describe the affluents for Lake Zacapu (La Angostura and La Zarcita) and for Lake Cuitzeo (Grande de Morelia River), as well as the effluent from Lake Zacapu (Angulo River). The star in Lake Zacapu represents some samplings in La Angostura springs. The dotted line in Lake Cuitzeo is the man-made effluent.
LZ is a small remnant (0.335 km
To relate species densities to environmental variables, a data set of H.
turneri in LC was used, including 448 individuals collected from five sites in
four months during 1979 (February, April, August, and November). This is the last
report of the species in the area after comprehensive ichthyological surveys
[13]. The environmental data available for this lake consisted of annual average
values at each site (Table 1). The data were collected at the surface during the
day simultaneously with the fishes’ catches. In LZ, 2,135 individuals were caught
and analyzed in four months of 1995 (January, May, July, and October). For this
lake, water quality information was also recorded simultaneously with fish
capture at the surface at four sites during the day and nighttime (Table 1). Also
for LZ, environmental data and fish samples were collected during 2019 and 2020
at the same sites and months during the day (274 individuals). The sites in both
lakes were selected in such a way to represent the different habitat
characteristics (water inflow from springs and rivers and the effluents, marshy
areas and zones with distinct submerged macrophytes species, and nearshore
influence from agricultural activities and urban development). Fishes were
collected in 1979 and 1995 using a 50 m long trawl net with a 4 m
| Water parameters | Lake Cuitzeo | Lake Zacapu | |||||||
| Site 1 | Site 2 | Site 3 | Site 4 | Site 5 | Site 1 | Site 2 | Site 3 | Site 4 | |
| Depth (m) | 0.51 | 0.48 | 0.6 | 1.82 | 1.67 | 3.32 | 2.37 | 2.15 | 2.95 |
| Temperature ( |
20.78 | 21 | 22.8 | 20.1 | 18 | 18.6 | 19.4 | 18.5 | 19 |
| 19.8 | 19.2 | 19.6 | 19.6 | ||||||
| Dissolved Oxygen (mg L |
4.55 | 6.6 | 4.51 | 3.85 | 4.27 | 14.1 | 14.2 | 13.3 | 13.7 |
| 14.3 | 15.4 | 13.5 | 16.2 | ||||||
| pH | 9.4 | 8.34 | 9.17 | 7.92 | 9 | 7.93 | 7.92 | 7.79 | 7.83 |
| 7.74 | 7.68 | 7.65 | 7.71 | ||||||
| Hardness (mg CaCO |
111.5 | 148.5 | 155.5 | 238 | 115 | 28 | 27 | 31.5 | 27 |
| Conductivity (mS cm |
1.11 | 0.6 | 1.12 | 0.56 | 1.83 | 0.091 | 0.08 | 0.09 | 0.078 |
| 0.147 | 0.146 | 0.146 | 0.145 | ||||||
| Salinity (g L) | 0.7 | 0.38 | 0.71 | 0.36 | 1.17 | - | - | - | - |
| Alkalinity (mg CaCO |
151 | 58 | 97 | 30 | 226.5 | - | - | - | - |
| Transparency (m) | 0.14 | 0.12 | 0.15 | 0.11 | 0.08 | - | - | - | - |
| Suspended Solids (mg L |
- | - | - | - | - | 6.25 | 8.25 | 5.25 | 8.75 |
| Turbidity (FTU) | - | - | - | - | - | 5.5 | 5.25 | 6.5 | 5.5 |
| Nitrite (mg L |
- | - | - | - | - | 0.004 | 0.005 | 0.011 | 0.004 |
| Nitrate (mg L |
- | - | - | - | - | 1.1 | 1.2 | 0.9 | 1.3 |
| 7.2 | 7.3 | 7.3 | 7.2 | ||||||
| Ammonia (mg L |
- | - | - | - | - | 0.13 | 0.11 | 0.1 | 0.1 |
| 0.08 | 0.08 | 0.14 | 0.08 | ||||||
| Total Phosphorus (mg L |
- | - | - | - | - | 0.196 | 0.123 | 0.215 | 0.378 |
| Clorophyll a (mg m |
- | - | - | - | - | 1.34 | 0.5 | 0.48 | 0.73 |
| Total Bacteria (MPN) | - | - | - | - | - | 19460 | 2788.25 | 19564.5 | 18352.5 |
| Coliform Bacteria (MPN) | - | - | - | - | - | 1211 | 676.5 | 24.4 | 13.65 |
The population density and frequency of H. turneri were analyzed and compared with the information of other fish species, aiming at describing the status of the species and identifying potential interactions, mainly with the introduced organisms in LC. We used Spearman’s correlation coefficients to measure the strength of the spatial association between species. In addition, we implemented a cluster analysis, with the sites as the grouping units, to recognize the species distribution affinities in multidimensional space. We applied the Bray-Curtis dissimilarity measure and Ward’s minimum variance method to link similar points [39]. The correlation coefficients and significant values were calculated with the ‘Hmisc’ package (v. 4.5-0) [40], and clusters were obtained with the ‘vegan’ package (v. 2.5-7) [41]. Both methods were performed in the R statistical language (v. 4.1.2, Vienna, Austria) [42].
The relationships between environmental aspects and H. turneri
abundance were explored with a generalized additive mixed model (GAMM) in 1995 in
LZ. Environmental variables were analyzed to search for outliers and screened for
collinearity via Cleveland dotplots and by applying Pearson’s correlation
coefficients (
A GAMM was applied, assuming a Poisson distribution because species counts include a low proportion of zeros (9.4%). Five covariates were used as smoothers (spline functions), assuming no strong relationships between covariates and response variables. We used random effects to model the correlation in space and time [43] because spatial and temporal autocorrelation was expected, since distance among sites is small (average 375.5 m) and samples were obtained every three months. We included a random intercept of Month (impose correlations between observations in the same sampling event) and Site (nested in Month) as the random intercept to allow for correlations between observations made in the same month (small scale spatial and temporal correlation). The final GAMM construction for H. turneri count data followed the equation:
Hubbsina
The model establishes that the counts of H. turneri at month
i, site j, and observation k follow a Poisson
distribution with mean
The optimal linear estimation method proposed by Solow and Roberts [45] was applied to estimate a calendar date interval when H. turneri might be considered extirpated or locally extinct from LC with 95% statistical confidence. Collection records from several scientific collections were used to implement the model, including records from the University of Michigan Museum of Zoology, National Museum of Natural History-Smithsonian Institution, Tulane University, and the Colección Nacional de Peces Dulceacuícolas Mexicanos de la Escuela Nacional de Ciencias Biológicas, IPN (Table 2, Ref. [13]). This approach is based on the shape parameter of the Weibull distribution for the interval between successive dates. The model is described as:
where T
where the lower (S
were confidence intervals were set at
| Locality | Year | N | Catalog Number | Collector |
| Cointzio Reservoir | 1940 | 1 | UMMZ-143299 | F de Buen |
| Cointzio Reservoir | 1945 | 11 | ENCB-IPN-1863 | V Villaseñor |
| Cointzio Reservoir | 1985 | - | ENCB-IPN-8169 | E Díaz & J Barragán |
| Cointzio Reservoir | 1993 | - | ENCB-IPN-6331 | E Soto |
| Irrigation canal near Alvaro Obregón | 1963 | 1 | UMMZ-30829 | CD Barbour & S Contreras-B. |
| Irrigation canal near Alvaro Obregón | 1969 | 33 | UMMZ-192403 | CD Barbour & RJ Douglass |
| Irrigation canal near Alvaro Obregón | 1993 | - | Soto-Galera et al. [13], 1998 | |
| La Mintzita spring | 1963 | 2 | ENCB-IPN-1865 | M. Rosas & R. Galicia |
| La Mintzita spring | 1968 | 1 | UMMZ-189036 | RR Miller & HL Huddle |
| La Mintzita spring | 1997 | - | UMMZ-245055 | Webb & J Lyons |
| La Mintzita spring | 2004 | - | TU-202145 | Bart, Lyons & Clements |
| Lake Cuitzeo | 1957 | 3 | ENCB-IPN-5584 | I. Mendoza |
| Lake Cuitzeo | 1968 | 9 | UMMZ-189040 | RR Miller & HL Huddle |
| Lake Cuitzeo | 1991 | - | IBUNAM-10204 | |
| Lake Cuitzeo | 2000 | - | ENCB-IPN-7980 | G Rangel & E Díaz |
| Lake Cuitzeo | 2013 | - | Personal communication |
Hubbsina turneri had the sixth-highest abundance and cohabited with 12 species of fishes in LC, and the dominant species were the native atherinopsid (Chirostoma jordani) and goodeids (Goodea atripinnis, Xenotoca variata, and Zoogoneticus quitzeoensis). Three introduced species were reported, two cyprinids (Cyprinus carpio and Carassius auratus) and one cichlid (Oreochromis niloticus). The spatial distribution of Hubbsina turneri showed smaller values at sites related to the affluent and effluent (10 and 12 individuals at sites 4 and 5, respectively) and higher values at sites within the lake (64, 212, and 150 individuals at sites 1, 2 and 3, respectively). The sites with higher abundances were related to the presence of submerged macrophytes (Potamogeton filiformis and Potamogeton pectinatus). Temporally, more than 50% of the organisms (289 individuals) were captured in April, and only 3.6% (16 individuals) were captured in February.
In the fish community in LZ during 1995, H. turneri cohabited with 13 species, and the dominant species were the native cyprinid (Notropis grandis), goodeids (G. atripinnis and Skiffia lermae), and atherinopsid (Chirostoma humboldtianum). Hubbsina turneri had the fifth-highest abundance. As in LC, H. turneri exhibited smaller abundance values in the main affluent (214 at site 2), but with higher values in the more stagnant site and the effluent (876 and 748 individuals at sites 1 and 4, respectively). The occurrence of H. turneri was also related to the presence of submerged macrophytes (P. pectinatus and Ceratophylum demersum). Temporally, 35.7% of the organisms (763 individuals) were captured in October and only 17% (362 individuals) were captured in January. During 2019 and 2020, from the trawl net information, the dominant fish changed and C. humboldtianum and the goodeid X. variata had the higher values. Hubbsina turneri only occurred in 4% of the samplings and occupied the eighth position of the nine species collected. The few places where the species was captured were the same where it was dominant in 1995. With the electrofishing and the minnow traps, we captured more individuals of H. turneri (218), and at more sites, than with the trawl net (56).
In LC, H. turneri was highly correlated with Alloophorus
robustus (r
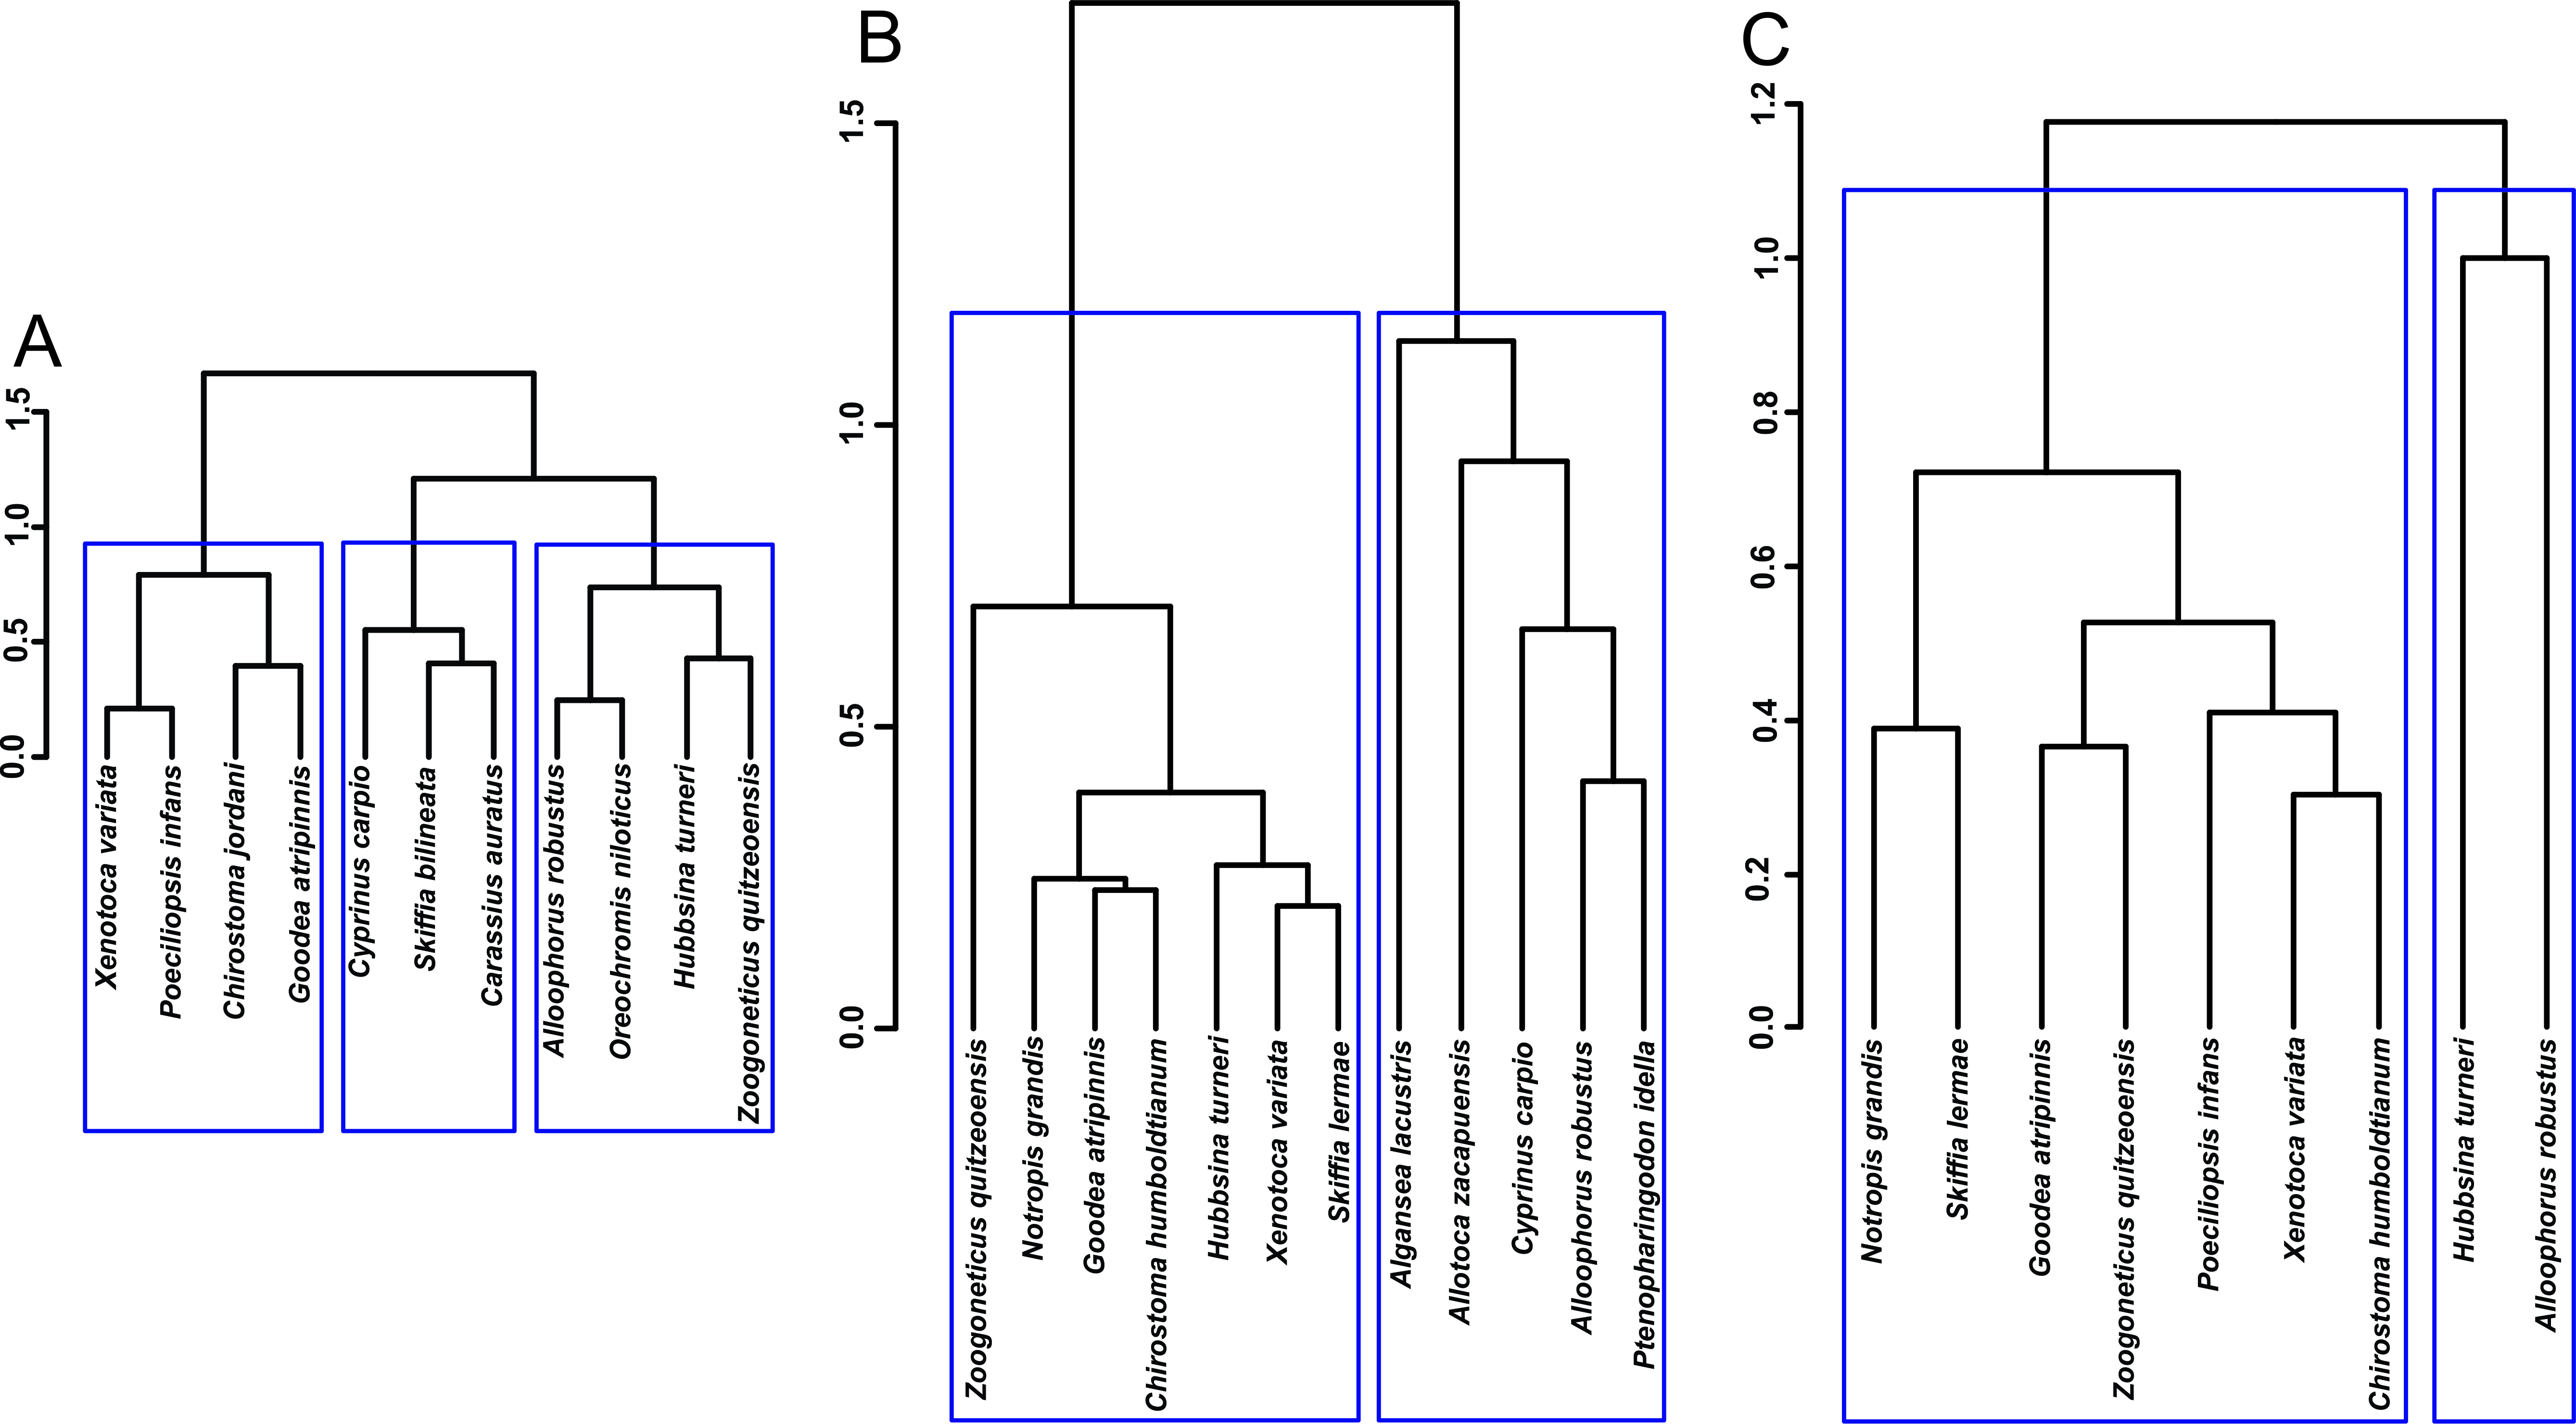 Fig. 2.
Hierarchical cluster analysis of the fishes’ density in the different lakes analized. (A) Lake Cuitzeo. (B) Lake Zacapu in 1995. (C) Lake Zacapu in 2019–2020. The assignation of species to significant clusters is shown with blue rectangles.
Both lakes showed contrasting environmental characteristics. On the one hand, LC
was shallow and saline with higher temperatures and higher values of different
chemical parameters (conductivity, hardness, salinity, alkalinity, and pH) than
LZ. On the other, LZ reached deeper areas, with very high dissolved oxygen (DO)
values and low turbidity, conductivity, and hardness (Table 1). The correlation
analysis revealed a close relationship between H. turneri with depth
(r
When we checked the overdispersion value in the GAMM, the result was
sufficiently close to 1 (1.14), meaning that the model had low overdispersion and
an adjusted R-squared of 0.54. The GAMM outputs, and the H. turneri
distribution according to the general water quality parameters in both lakes,
indicated the characteristics of the sites where it would be more likely to find
higher densities of the species (Table 3). Shallow to medium depth (up to 3–4
m); high oxygen concentrations, where LZ had oversaturation and the species was
found in medium values (from 13 mg L
| Variable | edf/lc | p |
| Total phosphorus |
3.6 | 0.0014** |
| fDissolved oxygen |
4.9 | |
| fDepth |
5.9 | |
| fNH |
1.0 | |
| fSuspended solids |
7.9 | |
| flogTotal coliforms |
3.3 |
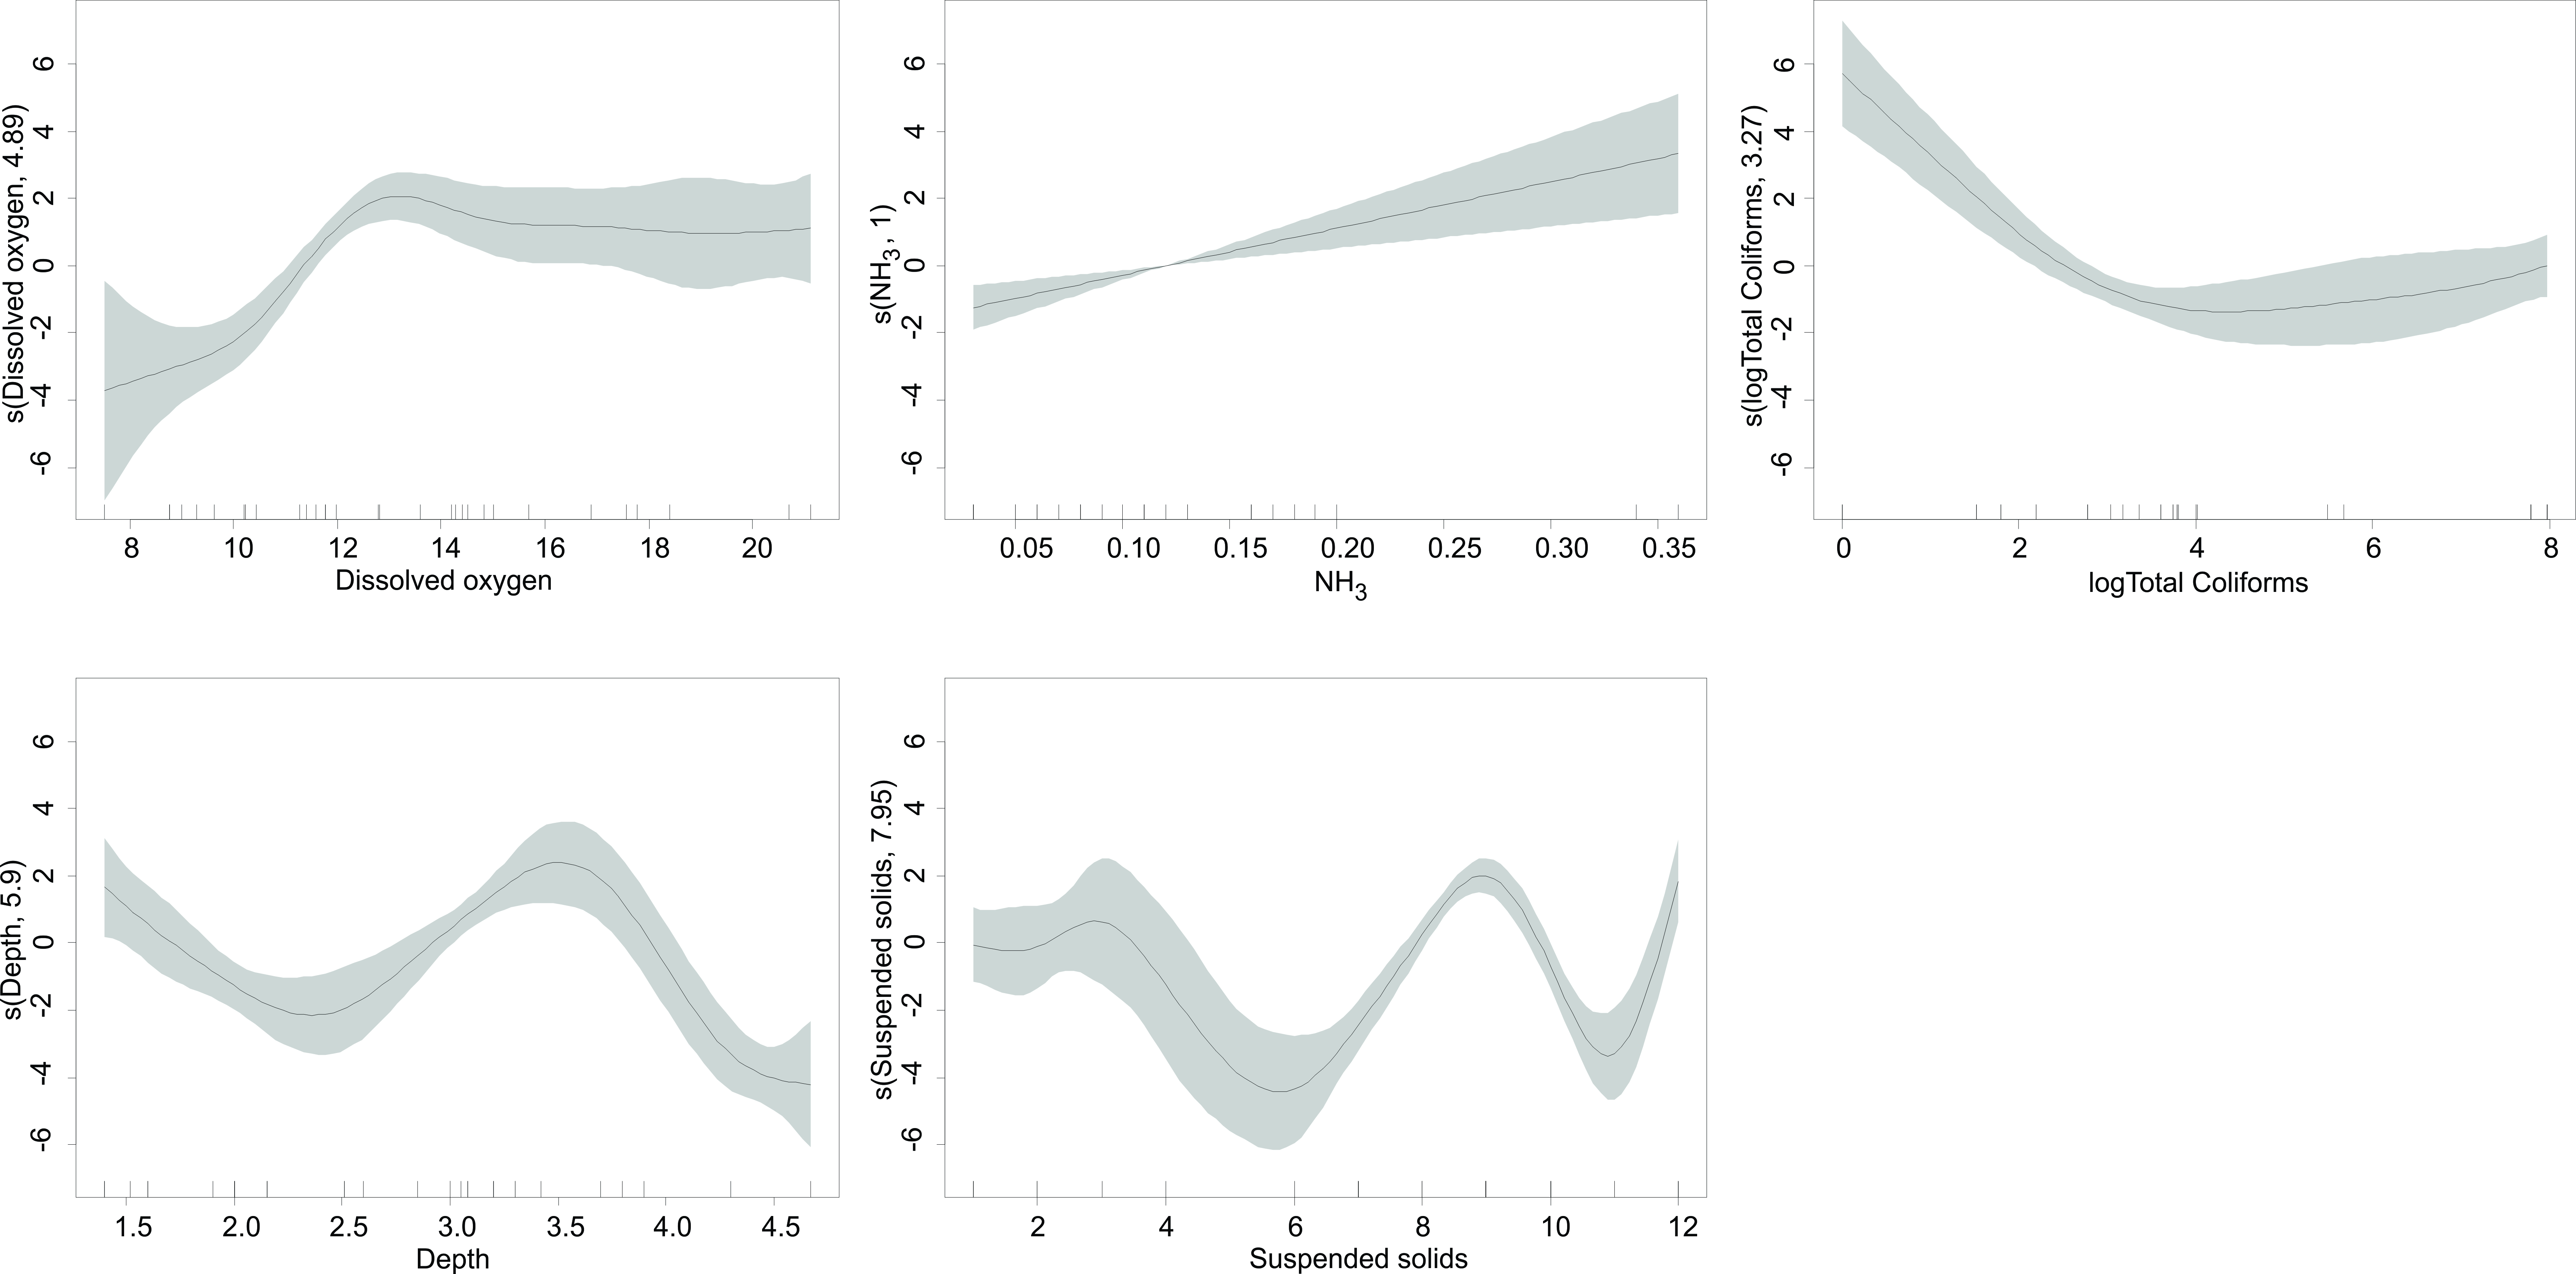 Fig. 3.
GAMM model for H. turneri abundance and the predictor variables in Lake Zacapu.
The optimal linear estimation analysis indicated that the time interval within which H. turneri may be regarded as extirpated from LC is between the years 2013 and 2018; in other words, the species may have already been extirpated. After this time, in statistical terms, the species may be considered locally extinct.
By accounting for the structural characteristics of the fish fauna in Lake Cuitzeo (LC) and Lake Zacapu (LZ), we found that Hubbsina turneri was placed in a similar position in both communities decades ago. This result is important because both places have similar species composition values compared with other aquatic ecosystems in the region (e.g., Simpson’s similarity index = 0.8) [27]. Additionally, this denotes that the species may have been in the optimal ecological and environmental conditions during the collection period in LC. However, nowadays the species had a reduced population in a restricted area. The association of H. turneri with other fishes reflected the different biological interactions: (1) the relation with Zoogoneticus quitzeoensis results from the consumption of similar prey (e.g., Horn’s trophic niche overlap index = 0.87 in LZ) [33]; (2) a prey-predator interaction with Alloophorus robustus; (3) and the association with the introduced Oreochromis niloticus may be more related to the habitat structure.
The analysis was restricted by the information available in both lakes, as only water quality was recorded and some variables were absent in LC, such as nutrient levels and bacteria counts. However, the main parameters of the limnological characteristics of each lake were recorded (LC as a hyposaline lake and LZ as an oligohaline lake). The combined contrasting characteristics between lakes allowed for the identification of some potential optimal ranges of variables. Consequently, the ionic composition of the water, depth, and dissolved oxygen were the most important limiting factors for the distribution of H. turneri. The typical habitat of the species, which must be considered for conservation purposes, was related to shallow sites with transparent littoral areas, abundant aquatic vegetation, low-alkalinity, medium-hard water, basic pH, and medium to high-oxygen levels. These aspects are associated with the absence of Hubbsina turneri in the more saline and alkaline west zone of LC.
The survival rate of a species is a historical indicator of the differential anthropogenic impacts on communities among aquatic systems. In goodeids, this value is 0.57 for LC and 0.94 for LZ [46]. A decline in the number of fish species in LC was described between 1970 and 1980 [13]. Of the 15 native species originally documented, only 4 occurred in the 1990s [13]. The fishery showed an important production in the lake at the beginning of the 1990s, followed by a drop in the second half of the decade related to a severe drought, which was then followed by a continuous decline in the 2000s (3250 t in 1994, 730 t in 1999, and 300 t in 2006). It is unclear what aspects contributed specifically to the disappearance of the species in the lake. Although the probable main causes are noted, we assume that the severity of the effects depends on the magnitude, frequency, duration, and combined impacts of the causes [47], which created circumstances that did not allow the population to recover, some of them are:
First, habitat reduction negatively affects population size and viability [48, 49]. There were significant surface fluctuations in LC due to hydrometeorological
variation. The last report of the species in the lake coincided with highly dry
conditions (1980–2000) [50]. Two-thirds of the lake remained dry in 1988, and
the maximum depth was one meter [51]. Volume drop also relates to water use
because the state capital city is located within the lake basin. The population
almost doubled between the 1970 to 1980 decades [52], and the water demand
increased likewise (18
Second, eutrophication is one of the most threatening effects in lakes because a
drastic increase in nutrient concentration affects water quality and promotes
changes in biodiversity and biogeochemical processes [11, 13]. The distribution
area of H. turneri in LC (eastern zone) presented the highest
Chlorophyll-a and nitrate concentrations associated with inputs from the Grande
de Morelia River [59]. This river crosses the capital state city, where the
treatment plant wasn’t constructed until 2007 [59]. In addition, the river flows
and is channeled in the Morelia-Queréndaro irrigation district, which has a
surface area of 200 km
Third, biological interactions with native as well as exotic species at
different niche aspects, which impose direct impacts like competitive exclusion,
niche displacement, predation, and indirect impacts, such as habitat alteration
and the spread of emerging diseases, can be particularly severe in imperiled
populations [62, 63]. Volume drop could reduce survival rates of vulnerable fish
in lake zones due to limiting similarity processes like competition for food [64, 65]. Hubbsina turneri and Z. quitzeoensis are both species that
inhabit similar habitats and consume analogous prey (chironomids).
However, Z. quitzeoensis was more abundant (1.03 org m
Fourth, fisheries could contribute to the disappearance of populations and species in some distribution areas. The continuous decline of several species, including those captured as bycatch, is an indirect effect of using non-selective fishing gear, which is an aspect that is discussed in different environments [70, 71]. In LC, seine nets have been used to capture the more valuable and locally appreciated silverside Chirostoma jordani. Because of the mesh size of these nets, it is common to capture other juveniles and adults of native and introduced species.
Official records described a 150 km
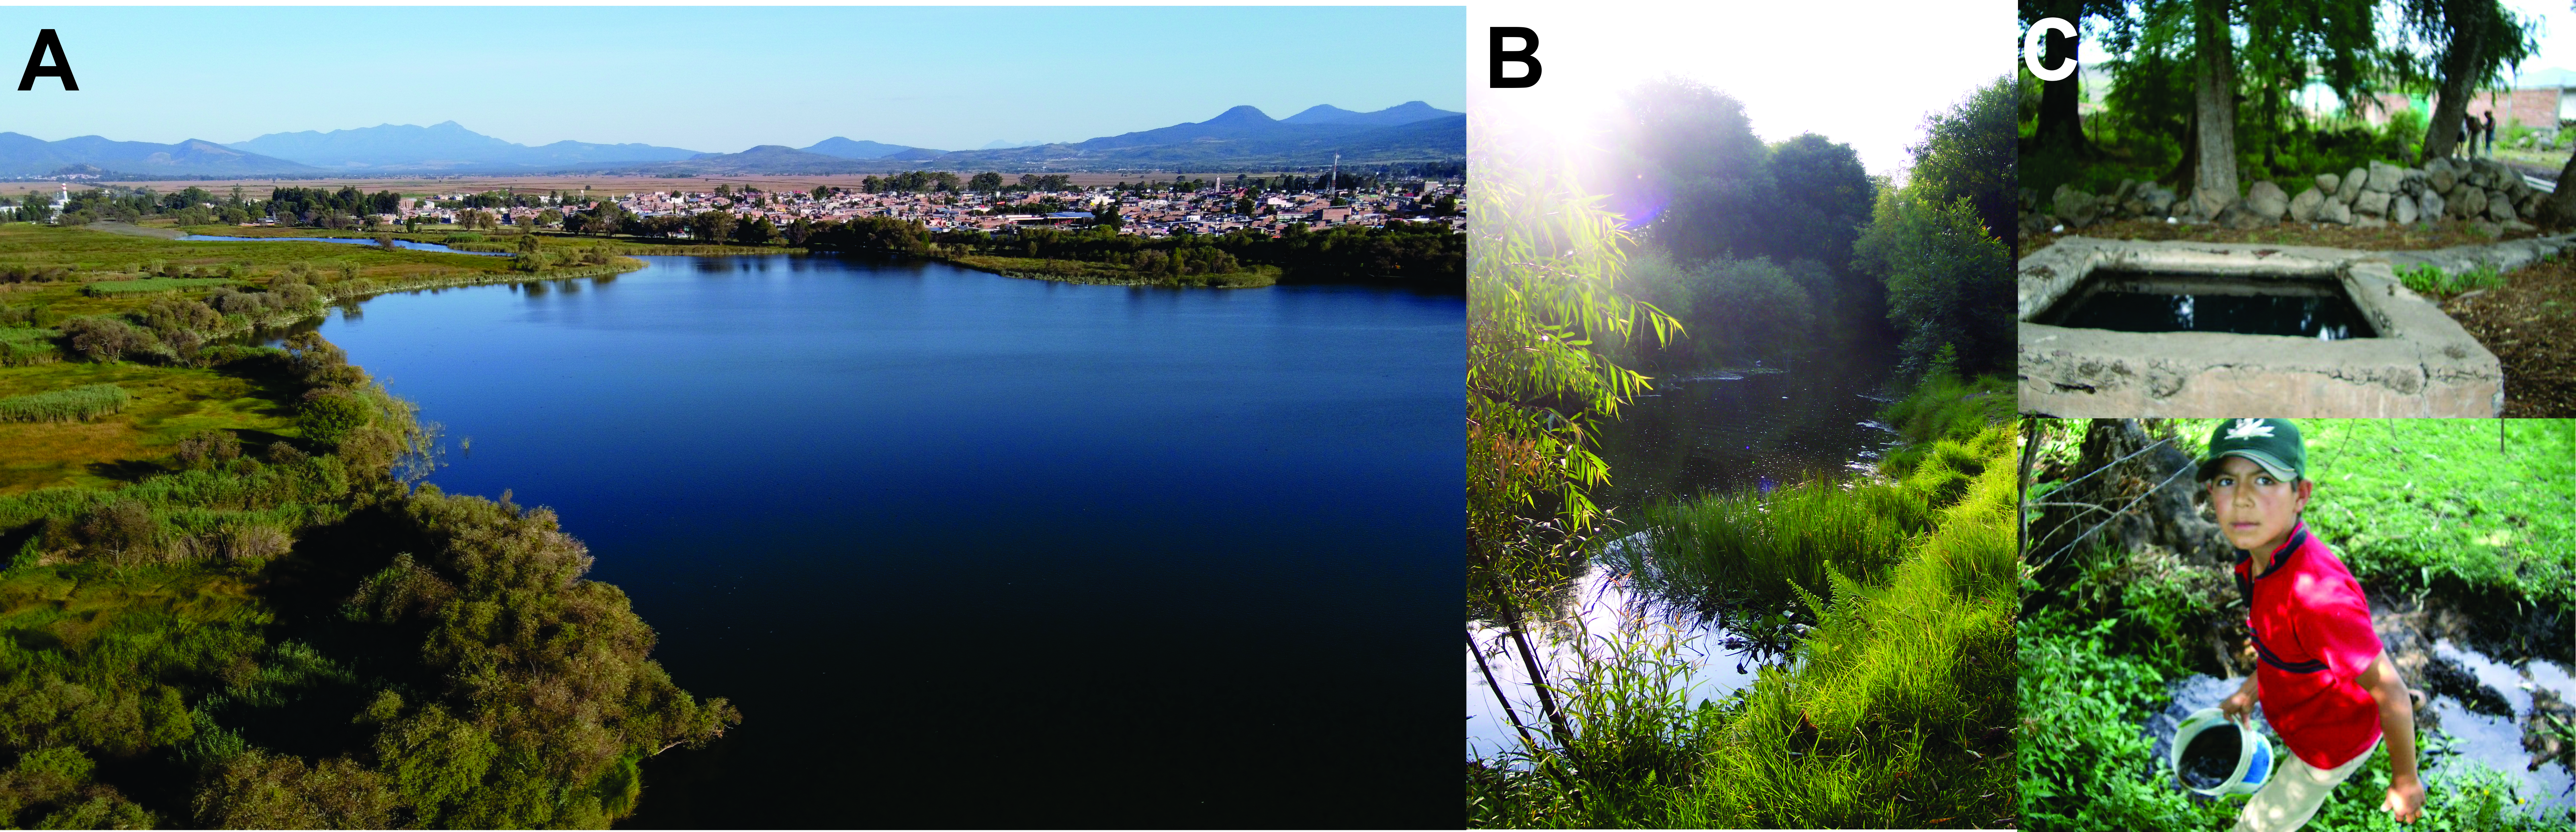 Fig. 4.
The three localities where Hubbsina turneri was most recently collected. (A) Lake Zacapu. (B) Naranja de Tapia channel. (C) Jesús María spring and creek. The boy captured H. turneri with the bucket in 2006.
A synthetic fiber factory was installed in 1948 on the shore of the LZ effluent
[75]. This factory accelerated the urban growth, and the population of the area
doubled between 1940 and 1950 (from 6 169 to 14 346 inhabitants). In 1995 the
population grew 3.5 times more (48 307 inhabitants) and the last population
census in 2020 reported 55 287 inhabitants. This growth exponentially increased
the demand for basic services as well as the production of wastewater [75]. The
city of Zacapu had a complete wastewater network and treatment plant with a
treatment capacity of 120 L s
The current distribution of H. turneri is of special concern because fishes with restricted distributions are generally more prone to extinction than widely distributed species [81, 82]. To devise conservation and restoration measures for this species, it is important to understand the status of the lakes the species has been inhabiting. Lake Cuitzeo (as part of an extensive region) and LZ (by itself) are recognized as priority hydrological regions by the National Commission for the Knowledge and Use of Biodiversity [83]. Specifically, LZ was declared as a natural protected area in 2003 [84] and is a Ramsar-listed wetland (No. 1465, designation date 05-06-2005) [85].
The central issue regarding the reintroduction of H. turneri in LC is that the system requires a major intervention, including habitat restoration at multiple spatial scales [86]. Several plans have been elaborated by the government [84, 87] and research institutions [50, 88], and they have already answered some critical questions, including those related to the disturbances associated with land use, the amount of natural land cover in the basin, the impact and treatment of residual solids, and the implementation of wetlands to reduce nutrient inputs [1, 89]. Unfortunately, the misperception of the lake as a decaying, senescent, and hypereutrophic water body has overshadowed the understanding of the multiple ecosystem services it provides, which has reduced the support for restoration efforts [46].
Lake Zacapu is important to protect because it provides many ecosystem services, including urban, industrial, recreational, and agricultural water use services to the town and wetlands of Zacapu. The lake has an artisanal fishery where ten local families harvest silverside (Chirostoma humboldtianum) and common carp (Cyprinus carpio) and extract clams (Anodonta grandis grandis) and crustaceans (Cambarellus montezumae) [33]. In addition, LZ is an important habitat for endemic fishes (Notropis grandis and Allotoca zacapuensis) and amphibian species (Ambystoma andersoni) [90]. This lake represents a groundwater-dependent ecosystem that is influenced by the chemical, ecological and hydrological characteristics of infiltration and water transport, and it is threatened by different land-use activities, pollution, and climate change [91]. In this context, higher elevation areas and adjacent recharge areas must be protected, particularly at the level of landscape units related to volcanic processes with pine-oak forests [92].
We suggest the implementation of three actions to preserve the LZ ecosystem: (1) protect spring zones and regulate the water extraction for the conservation of aquatic biodiversity, (2) restoration of the littoral areas, and (3) adapt decision-making initiatives of the lake use and urban development to long-term objectives to preserve the ecosystem structure and function [5, 93]. Exotic species may represent a threat to native species, and non-native fish control measures must be implemented to reduce the already established populations (i.e., reducing restocking and increasing harvesting). New introductions must be avoided, and a well-implemented educational campaign is critical to prevent the release of organisms by aquarists into the lake [1]. Hubbsina turneri and goodeid fishes lack substantial economic fishery value, but the family has drawn attention from conservationists worldwide (i.e., Goodeid Working Group). Several populations are kept in captivity as a source of species data and as a gene bank by hobbyists, universities, public aquaria, and zoos. The data on this species include a detailed protocol on population treatment for restoration and reintroduction projects [94].
We identify a set of ecological, environmental, and conservation aspects that are particularly suited to the study of threatened species, such as the fish community structure, physical and chemical variables models, and local extinction. For instance, the contrasting characteristics of the lakes allowed for the identification of critical biological and habitat aspects for species conservation and restoration. However, the selection of predictor variables for modeling species habitats was limited to the information available in both lakes. Unfortunately, long-term monitoring is lacking, and complete ecological studies in the same ecosystem are scarce and infrequent. Consequently, it is important to promote long-term monitoring programs on species with a critical conservation status, and including the communities. The analysis also provided some clues to understanding why the species is now statistically extinct at LC. The lack of individuals was found to be related to habitat degradation as a consequence of the combination of several natural and anthropogenic effects. This study contributes information relevant to habitat restoration and species translocation; both aspects are important because different species of Goodeidae and other native fishes have been negatively and irreversibly impacted in several regions of Mexico and other countries where there is persistent increasing pressure on the hydrological resources [5, 41]. An ecological analysis interpreted from a historical viewpoint of environmental damage and effects can help managers or landowners learn from past events to avoid those same practices from occurring in the future to prevent biodiversity loss. Additionally, this approach highlights the need for redefining the scale of the analyses, offers useful methods to evaluate the magnitude and geography of extinction debt of freshwater fishes, understand the synergistic effects of multiple stressors in freshwater ecosystems, and propose recommendations to avoid or reduce the impacts of harmful development projects [18].
LC, Lake Cuitzeo; LZ, Lake Zacapu; GAMM, Generalized Additive Mixed Model; OLEM, Optimal Linear Estimation Method; TP, Total phosphorus; DO, Dissolved Oxygen; IUCN, International Union for Conservation of Nature; GWG, Goodeid Working Group.
RME, JDLCA, ELL, MMDA, ACT, ARG and ODD designed the research study. RME, MMDA, ACT, and ARG performed the research. JDLCA, PDML, ODD, and JPRH provided help and advice on the sampling methodology and sample processing. RME, MMDA, ACT, PDML, ARG, and JPRH analyzed the data. RME, JDLCA, ELL wrote the manuscript. JDLCA, ELL, PDML, and ODD provided financial support. All authors contributed to editorial changes in the manuscript. All authors read and approved the final manuscript.
Not applicable.
R.M.E. and M.M.D.A. were supported by Consejo Nacional de Ciencia y Tecnología (CONACyT) and Programa Institucional de Formación de Investigadores (PIFI). A.R.G. receive a CONACYT fellowship grant for PhD studies. R.M.E., J.D.L.C.A., E.L.L., P.D.M.L. are supported by the Comisión de Operación y Fomento de Actividades Académicas (COFAA) and Estímulo al Desempeño Académico (EDI). Thanks to the Unión de Pescadores of Zacapu Lake, the government of Zacapu, and Centro Regional de Investigación Pesquera, CRIAP Pátzcuaro and the members of the Laboratorio de Biología Acuática of the Universidad Michoacana de San Nicolás de Hidalgo (UMSNH).
This research was funded by CONACyT grant number CB A1S19598 and SIP-Instituto Politécnico Nacional grant number 20211495. In addition, funding was provided by Chester Zoo, The Rufford Foundation Small Grants, the Goodeid Working Group, the American Livebearer Association, and CIC-UMSNH.
The authors declare no conflict of interest.