


 , Christian R. Gomez 2,5,11,*,‡
1 Department of Preventive Medicine, John D. Bower School of Population Health, University of Mississippi Medical Center, Jackson, MS 39216, USA
2 Center for Clinical and Translational Science (CCTS), University of Mississippi School of Pharmacy (UMSOP) & University of Mississippi Medical Center, Jackson, MS 39216, USA
3 Cancer Center and Research Institute, University of Mississippi Medical Center, Jackson, MS 39216, USA
4 Department of Pathology, University of Alabama at Birmingham, Birmingham, AL 35294, USA
5 Department of Pathology, University of Mississippi Medical Center, Jackson, MS 39216, USA
6 CAPES Foundation, Ministry of Education of Brazil, Esplanada dos Ministerios, 70000 Brasilia, Brazil
7 Department of Transplant/Hepatobiliary Surgery, University of Mississippi Medical Center, Jackson, MS 39216, USA
8 O’Neal Comprehensive Cancer Center University of Alabama at Birmingham, Birmingham, AL 35294, USA
9 Division of Hematology, Oncology and Transplantation, Medical School, University of Minnesota, Minneapolis, MN 55455, USA
10 Masonic Cancer Center, University of Minnesota, Minneapolis, MN 55455, USA
11 Department of Radiation Oncology, University of Mississippi Medical Center, Jackson, MS 39216, USA
† These authors contributed equally.
Abstract
Background: The major histocompatibility complex class I polypeptide-related sequence A (MICA) is one of the ligands of the natural killer group 2D (NKG2D) activating receptor. MICA stimulates NKG2D, which further triggers activation of natural killer cells and leads to killing of infected target cells. To subvert the biological function of NKG2D, tumor cells utilize an escape strategy by shedding overexpressed MICA. In this study, we determined the levels of MICA in colorectal cancers (CRCs). Additionally, we established correlations between MICA expression and clinical characteristics. Publicly available data and bioinformatics tools were used for validation purposes. Methods: We determined the MICA RNA expression levels and assessed their correlation with clinicopathological parameters in CRC using the UALCAN web-portal. We performed immunohistochemical analysis on tissue microarrays having 192 samples, acquired from 96 CRC patients, to validate the expression of MICA in CRC and adjacent uninvolved tissue and investigated its prognostic significance by Kaplan-Meier and proportional hazards methods. Results: Bioinformatics and immunohistochemical analyses showed that MICA expression was significantly upregulated in CRCs as compared to uninvolved tissue, and the overexpression of MICA was independent of pathologic stage, histotype, nodal metastasis status, p53-status, as well as patient’s race, age and gender. Moreover, PROGgeneV2 survival analysis of two cohorts showed a poor prognosis for CRC patients exhibiting high MICA expression. Conclusions: Overall, our findings for CRC patients demonstrate generally high expression of MICA, and suggest that a poor prognosis relates to high MICA expression. These results can be further explored due to their potential to provide clues to the contribution of the tumor microenvironment to the progression of CRC.
Keywords
- MICA
- IHC
- Colorectal cancer
- Expression
- Prognostic marker
As a leading cause of cancer-related deaths in Americans, cancer of colon and rectum (CRC) remains in third position for new estimated cases and mortality according to American Cancer Society in 2020 [1]. Current diagnosis of CRC is based on tumor-node-metastasis (TNM) stage, which lacks the interpretation of epigenetic background and genetic variants. Therefore, identification of new biologic markers is a promising approach to improve detection of aggressive phenotypes and provide better guidelines for clinicians towards CRC treatment.
MHC class I polypeptide-related sequence A (MICA) is a cell surface protein overexpressed under stress conditions [2]. Upon interaction with natural killer group 2D (NKG2D) receptors, MICA promotes activation of natural killer (NK) cells, IFN-gamma secretion, and degranulation of perforin and granzymes, leading to apoptosis of cells expressing high levels of MICA [3, 4]. MICA functions as a component of the immunosurveillance system to combat infections by foreign pathogens and conditions that lead to cellular stress, including cancer [5]. MICA has a soluble form (sMICA), which is highly expressed in aggressive forms of cancer and reduces the cytotoxic activity of NK cells [6]. Therefore, MICA has been proposed as a relevant player of the tumor microenvironment (TME) [7], worth to be explored as a factor of tumorigenesis.
Aberrant expression of MICA has been described in different types of cancers, including those of the prostate, lung, stomach, and cholangiocarcinoma [8]. Despite the level of information, the role of MICA expression in tumorigenesis is not clear. In carcinoma of the prostate [9], gastric cancer [10], and non-small cell lung cancer [11], higher expression of MICA relates to a better prognosis. On the other hand, higher expression in patients with pancreatic cancer [12], breast cancer [13], hepatocellular carcinoma [14], and non-small cell lung cancer [15] predicts for poor outcomes. In relation to CRC, elevated expression of MICA has been found in tumor tissue as compared to normal specimens [16]. However, improved disease-specific survival is reported for patients with high expression of MICA [17, 18].
Since data suggest that MICA is a molecule of the TME with an emergent role as a marker of aggressive disease, further investigations are needed to establish its prognostic value in CRC. Herein, we determined the levels of MICA (RNA and protein) in CRCs. Additionally, we established correlations between MICA expression and clinical characteristics. Publicly available gene expression data and bioinformatics tools were used for validation purposes. Our findings agree with published literature for higher expression of MICA in CRCs, however, contrary to prior reports for CRC [17, 18], they point to a poor prognosis for patients whose CRCs exhibit high MICA expression. In sum, our findings suggest that additional work is needed to establish the role of MICA expression as a discriminator of aggressive CRC.
The UALCAN platform (ualcan.path.uab.edu) was used to assess MICA mRNA levels in normal (uninvolved) colon and CRC tissues [19]. This resource for gene expression analysis uses data from The Cancer Genome Atlas (TCGA). mRNA data are expressed as transcripts per million and are representative of standard deviations from the median across samples for the given cancer type. PROGgeneV2, a prognostic database [20], was used to perform Kaplan-Meier and proportional hazards survival analyses for CRC patients associated with mRNA levels of MICA (GSE41258 and GSE29621 independent publicly available data sets).
The study population was derived from the University of Mississippi Medical Center (UMMC), Jackson, MS, USA. Specimens collected (2006–2016) following surgery were de-identified and later provided a unique study identification. Clinical and pathological characteristics of study subjects are provided in Table 1.
| Characteristic | Finding | |
| Age, years, mean (range) | 59.2 (23–87) | |
| Sex, Number (%) | ||
| Male | 50 (52.1%) | |
| Female | 46 (47.9%) | |
| Race/ethnicity, number (%) | ||
| African Americans | 56 (58.3%) | |
| Non-Hispanic Whites | 40 (41.7%) | |
| Site, Number | ||
| Colon | 62 (64.6%) | |
| Rectum | 34 (35.4%) | |
| TNM stage, number (%) | ||
| I | 11 (11.4%) | |
| II | 30 (31.3%) | |
| III | 35 (36.5%) | |
| IV | 20 (20.8%) | |
| Histological grade, number (%) | ||
| Well-differentiated | 6 (6.3%) | |
| Moderately differentiated | 78 (81.3%) | |
| Poorly differentiated | 7 (7.3%) | |
| Unknown | 5 (5.1%) | |
| Lymph node metastasis, number (%) | ||
| Negative | 36 (37.5%) | |
| Positive | 50 (52.1%) | |
| Unknown | 10 (10.4%) | |
| Surgical margins, number (%) | ||
| Negative | 74 (77.1%) | |
| Positive | 18 (18.8%) | |
| Unknown | 4 (4.1%) | |
| Follow-up time (years), median (range) | 4.6 (0.1–10.3) | |
The data include sex, race, TNM stage, histological grade, evidence of LNM, surgical margins, survival times, and status. Tumor and normal colonic tissues, adjacent to tumor, were obtained immediately after operation. We included 96 cases, assessed by a board-certified pathologist (VS). Staging was performed according to the guidelines of the American Joint Committee on Cancer. Following surgery, clinical follow-up data were obtained, with a median follow-up of 5.4 years (range 0.1–10.3 years) for the 96 patients. This study (under Institutional Review Protocol number 2012-0205) was performed according to standards set by the Declaration of Helsinki.
Tumor stage-matched tissues were used to create tissue microarrays (TMA). For
each patient, representative formalin-fixed paraffin-embedded (FFPE) tissue
blocks included a normal block and a tumor block. A total of 192 samples for the
TMA construction were included in the final composite block. Based on the
verified histological features, FFPE blocks of primary tumors were selected by
the pathologist. From the primary FFPE blocks, cylindrical cores of 2-mm diameter
were transferred to paraffin blocks using a Beecher MTA1 Manual Tissue Arrayer
(Beecher Instruments, Sun Prairie, WI, USA). For immunohistochemical (IHC)
staining and analysis, the resulting TMA composite blocks were sectioned at
5-
As described before [9, 21], IHC was performed according to manufacturer’s
instructions provided in Vector Labs’s VECTASTAIN Elite Avidin-Biotin Complex
Staining Kit (Cat# PK-6101 Vector Laboratories Inc., Burlingame, CA,
USA). Following antigen retrieval with citrate buffer (pH 6.0) for 20 min, and
incubation with 3% hydrogen peroxide, the FFPE TMA sections were deparaffinized
and rehydrated during 10 min. To block unspecific binding, the slides were
treated with Protein Block Serum-Free (Cat# X0909, Dako, Santa Clara, CA, USA)
for 12 min followed by incubation with 10% normal serum for 1 h at room
temperature. Next, the TMA slides were incubated with rabbit anti-human primary
polyclonal antibody against MICA in 1:25 dilution (Cat# PA5-35346, Thermo
Scientific, Waltham, MA, USA) overnight at 4
The SPSS software package, version 13.0 (SPSS Inc., Chicago, IL, USA),
SAS 9.4 (SAS Inc., Cary, NC, USA), and GraphPad Prism (GraphPad Software, La
Jolla, CA, USA) were used to analyze the data. The difference in MICA gene
expression between uninvolved tissue and tumor tissue or for any other pairwise
comparison obtained using bioinformatics analysis was evaluated by Student’s
t-test. One-way ANOVA and Dunnett’s multiple comparisons were utilized
when three or more groups were compared. Pairwise comparisons were always
relative to normal tissue. For IHC data, differences were compared by
Mann-Whitney U test for non-matched data or Wilcoxon signed rank test for
matched-pairs. Two-sided p-values were determined via Chi-square or
Fisher’s exact tests for categorical variables. Overall survival was analyzed by
the Kaplan-Meier method and proportional hazards methods with use of the log-rank
test and hazard risks (HR) and 95% confidence intervals (95% CI) to compare
overall survival. For all analyses, the level of significance was set at
p
Bioinformatics analyses of RNA expression of MICA in CRC tissues:
Inspection of uninvolved tissues (N = 41) vs. primary CRC (N =
286) (Fig. 1A) in the TCGA database, available through UALCAN, revealed a 30%
increase of expression of MICA mRNA in CRCs relative to normal epithelia
(p = 1.794E-07). Furthermore, we found elevated expression of
MICA in CRCs of patients for both sexes (males N = 156 and
females N = 127, p
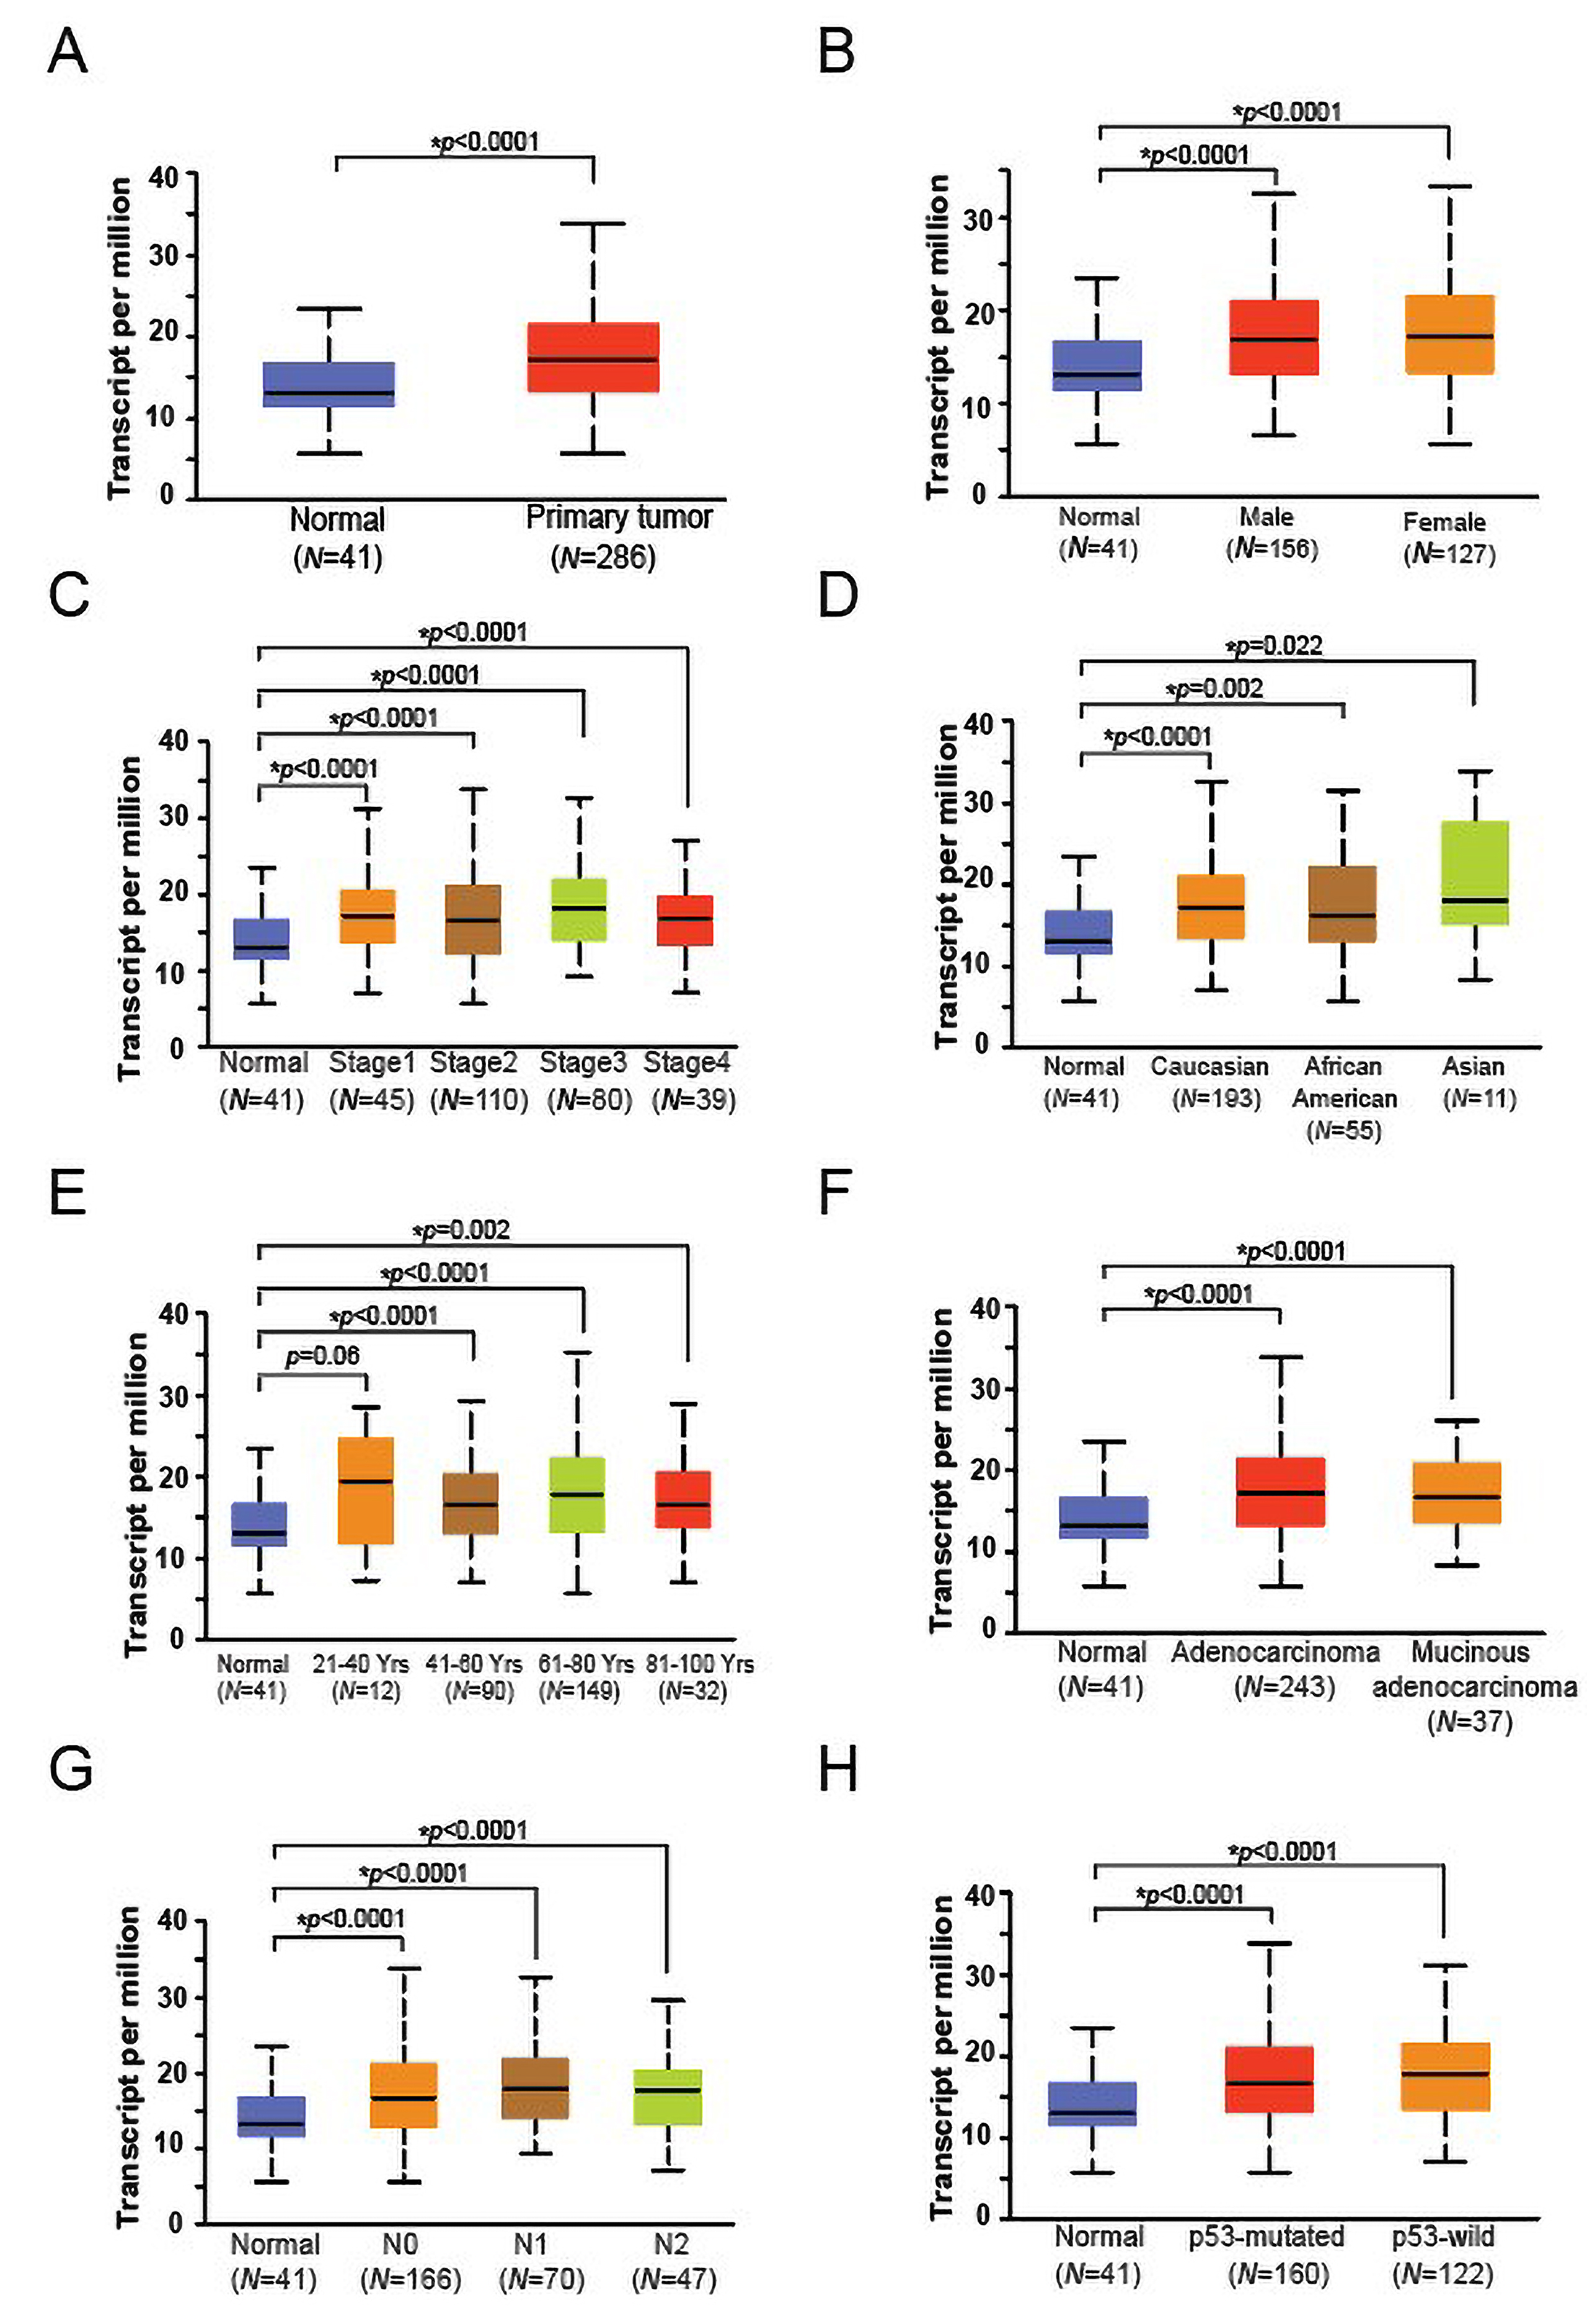 Fig. 1.
MICA RNA expression in CRC tissues. (A) Box plots showing relative expression of MICA mRNA in uninvolved tissues and CRC (Student’s t-test). The mRNA expression levels were normalized as transcripts per million reads. (B) MICA expression in CRCs on the basis of patient sex, (C) various stages of CRC, (D) race, (E) age, (F) tumor histologic types, (G) nodal metastatic status, and (H) p53 mutation status (B–H, one-way ANOVA with Dunnett’s multiple comparisons test). Pairwise comparisons relative to normal tissue. CRC, colorectal cancer; MICA, MHC class I polypeptide-related sequence A; TCGA, The Cancer Gene Atlas.
Using the prognostic database PROGgeneV2, we retrieved data and performed survival analyses on the datasets GSE41258 and GSE29621, using the median value as threshold. The dataset GSE41258 consisted of 390 expression arrays, including primary colon adenocarcinomas, adenomas, metastasis, and corresponding normal mucosae, from patients who presented at Memorial Sloan-Kettering Cancer Center from 1992 and 2004. Only 182 expression arrays, from primary adenocarcinomas, were used for survival analysis. The dataset GSE29621 consisted of 65 mRNA samples extracted from primary tumors of colon cancer patients for microarray analysis.
In both datasets, there was a significantly poorer prognosis for patients with high MICA mRNA levels relative to those with low MICA mRNA (log rank, p = 0.014, HR: 2.15, 95% CI: 1.17–3.94 for GSE41258 and log rank, p = 0.003, HR: 9.87, 95% CI: 2.18–44.69 for GS29621) (Fig. 2A,B).
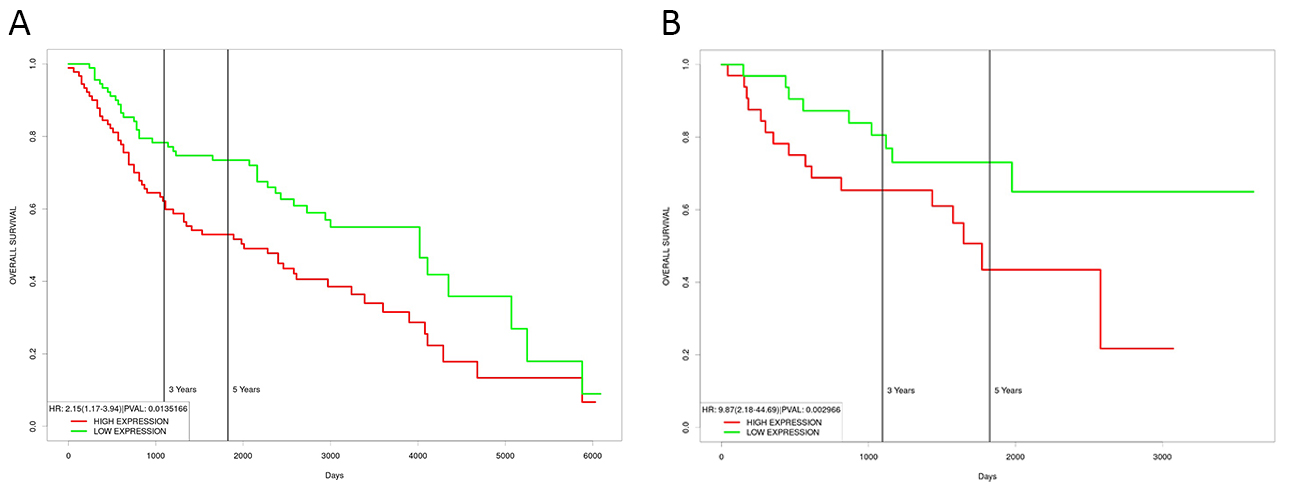 Fig. 2.
Survival analysis for patients with CRC according to the expression of MICA mRNA. Plots generated using the prognostic database PROGgeneV2 to analyze the datasets GSE41258 (A) and GSE29621 (B), using the mean value as threshold. In both datasets, a poor prognosis was evident for patients with higher expression of MICA mRNA (log rank, p = 0.014, HR: 2.15, 95% CI: 1.17–3.94 for GSE41258 and log rank, p = 0.003, HR: 9.87, 95% CI: 2.18–44.69 for GSE29621).
Of 384 cores, 74 were unsuitable and excluded from analysis due to loss of
tissue or lack of viable cells within the core. Higher MICA expression was
observed as globular/nuclear or cytoplasmic in cells from normal tissues
(Fig. 3A). Nuclear staining was observed in 11.6% (8 of 69)
positively stained uninvolved cores. Cytoplasmic immunostaining was observed in
40.6% (28 of 69) normal cores. In both the basal and luminal portions of colonic
crypts, staining was evident mainly in the cytoplasm of epithelial cells and the
peripheral cytoplasm of Goblet cells, with negative reactivity for mucous glands.
In CRCs, MICA staining was predominantly cytoplasmic, as noted in 84.9% (73 of
86) of the positively stained cores (Fig. 3A). Globular staining was present in
32.6% (28 of 86) of positively stained specimens (Table 2). High expression was
also observed in mucinous tumors (Fig. 3B) as well as in moderately (Fig. 4A) and
poorly differentiated adenocarcinomas (Fig. 4B). Analysis of nuclear
immunostaining revealed a 3.5-fold higher combined intensity score for CRCs (1.4
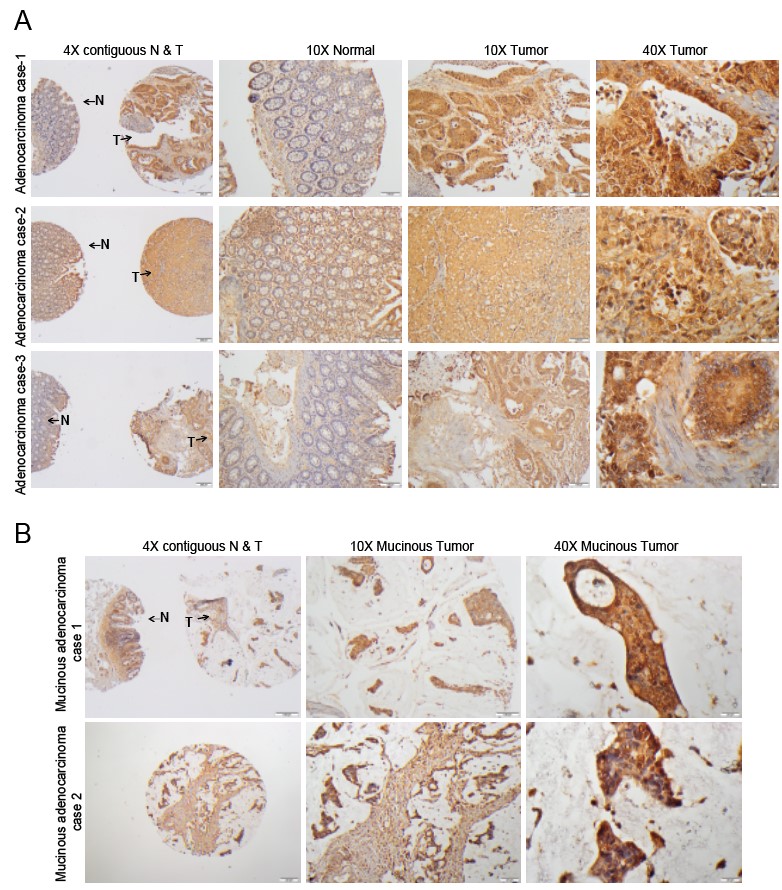 Fig. 3.
IHC staining of MICA in contiguous normal-tumor tissue
and mucinous adenocarcinomas. (A) Representative microphotographs from three
different adenocarcinoma cases to show MICA staining in TMA tissues using IHC
analysis. The 4X images (left panel) have contiguous normal (denoted by N) and
tumor components (denoted by T) from adjacent sections of same patient while 10X
images are of normal (middle panel) and tumor (right panel) sections obtained
from the TMAs. MICA glandular expression was nuclear and cytoplasmic in both
normal and tumor tissues. Scale bar; 4X—100
| Tissue/Localization | Frequency | MICA average combining stage score |
| Normal/Cytoplasmic | 28/69 | 1.4 |
| (40.6%) | ||
| Tumor/Cytoplasmic | 73/86 | 3.4 |
| (84.9%) | ||
| Normal/Nuclear | 8/69 | 0.4 |
| (11.6%) | ||
| Tumor/Nuclear | 27/86 | 1.4 |
| (31.4%) | ||
| *p | ||
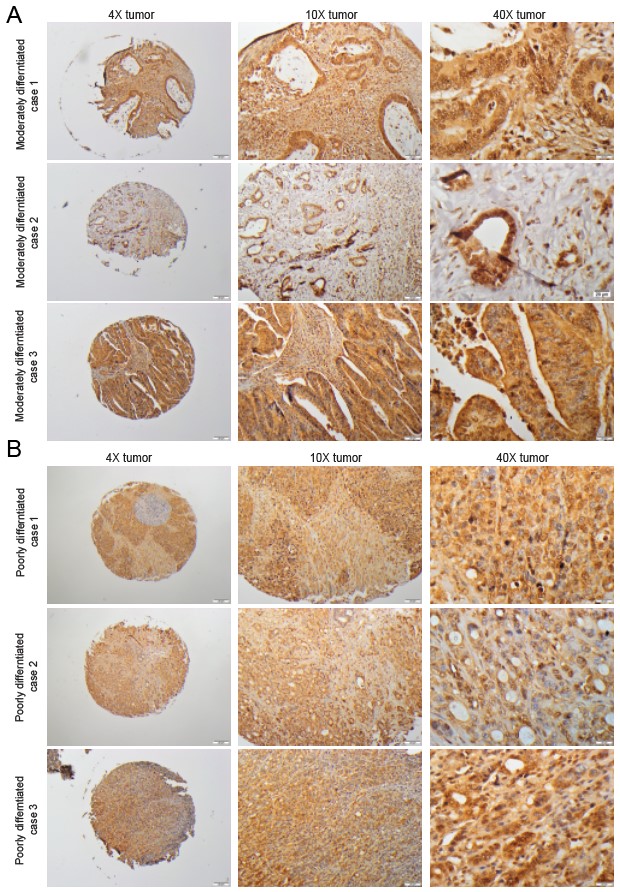 Fig. 4.
IHC staining of MICA in moderately and poorly differentiated CRC tissues. Representative microphotographs from different adenocarcinoma cases to show MICA staining in CRC tissues based on (A) moderate and (B) poor differentiation.
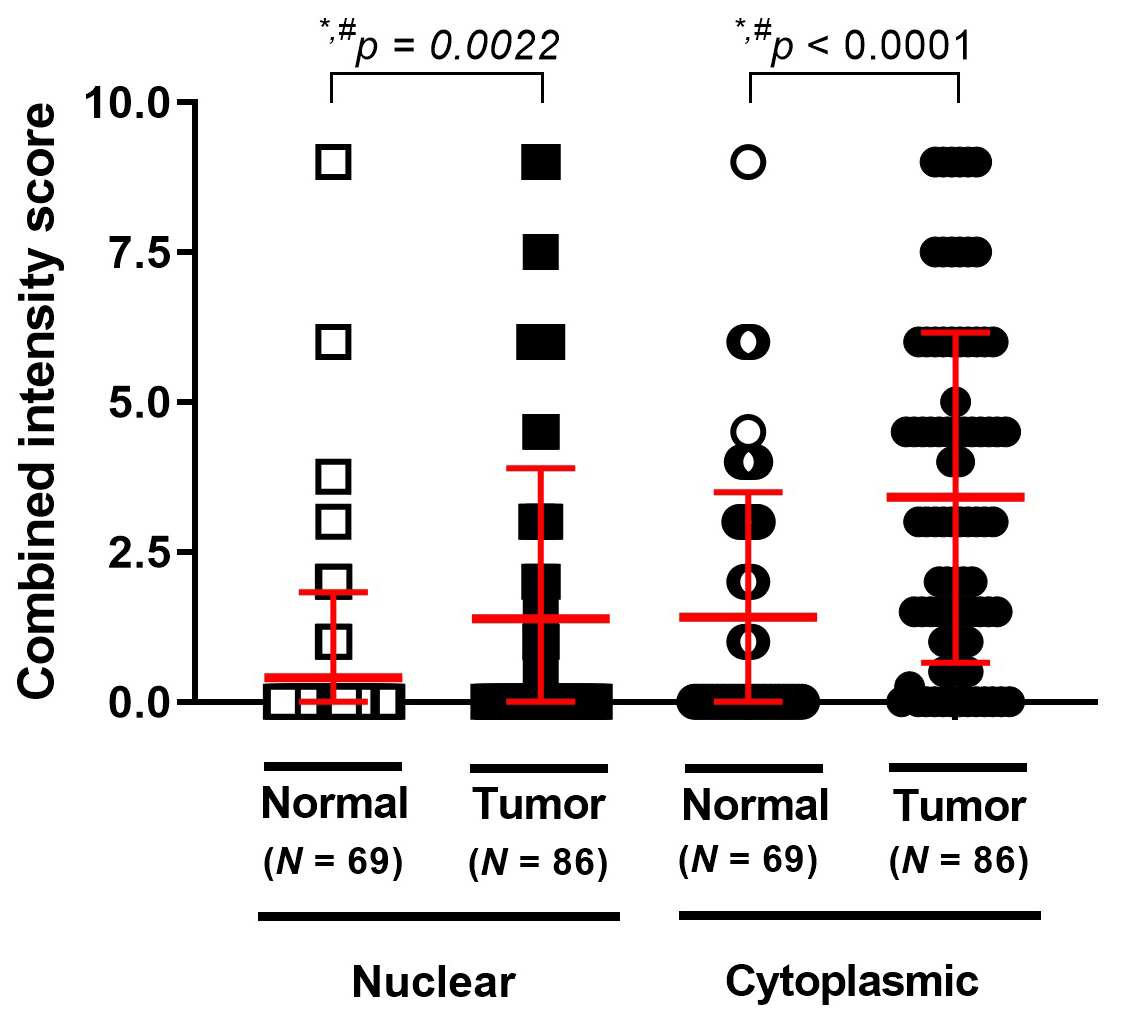 Fig. 5.
Comparison of MICA nuclear and cytoplasmic staining in CRC
tissues. Stronger MICA immunoreaction was observed in tumor glandular cells
relative to normal tissue, represented in the scatter plot. Mann-Whitney U test
for non-matched data. *p
In order to assess the association between MICA expression and CRC clinical
features, UMMC patients were divided into low and high MICA tumor expression
based on the optimal cutoff point calculated based on the median (3.4) of
cytoplasmic staining. Correlations between the two groups and clinical features
were calculated using Fisher’s exact test (Table 3). There was no significant
association of MICA expression with patients’ sex (p = 0.277),
race/ethnicity (p = 0.665), age (p = 0.821), tumor site
(p
| MICA low | MICA high | p value | |||||||
| Sex | |||||||||
| Female | 16 | 27 | 0.277 | ||||||
| Male | 22 | 21 | |||||||
| Race | |||||||||
| African American | 24 | 28 | 0.665 | ||||||
| Caucasian American | 14 | 20 | |||||||
| Age | |||||||||
| 13 | 18 | 0.821 | |||||||
| 25 | 30 | ||||||||
| Site | |||||||||
| Colon | 27 | 33 | |||||||
| Rectum | 11 | 15 | |||||||
| Surgical margins | |||||||||
| Negative | 31 | 36 | 0.404 | ||||||
| Positive | 5 | 10 | |||||||
| Lymph node metastasis | |||||||||
| Negative | 14 | 16 | |||||||
| Positive | 22 | 25 | |||||||
| T stage | |||||||||
| 1–2 | 11 | 4 | 0.020* | ||||||
| 3–4 | 27 | 44 | |||||||
| N stage | |||||||||
| 0 | 13 | 17 | |||||||
| 1–2 | 24 | 29 | |||||||
| Clinical stage | |||||||||
| I–II | 12 | 17 | 0.817 | ||||||
| III–IV | 25 | 29 | |||||||
| *p | |||||||||
CRC mortality rates are elevated worldwide. Even though the five-year survival of CRC patients has improved due to early detection, close to 25% of patients still are diagnosed with stage 4 disease. As the relative 5-year survival rate of patients with metastatic CRC (mCRC) remains poor [22], there is an urgent, unmet need to develop more effective treatments for patients suffering from this disease. PD1 inhibitors have been a successful immunotherapy approach for a specific subgroup of mCRC, those that are mismatch-repair-deficient and microsatellite instability-high [23]. Ongoing research is focused on looking for treatments for other subgroups of mCRC. Emerging approaches include targeting of the TME, which might complement immune checkpoint inhibition. To this end, in the current study, we evaluated MICA as a potential TME marker for aggressive disease. Analysis of CRC in the UALCAN database suggested that MICA expression was closely associated with individual cancer stages. In addition, MICA expression in the UMMC CRC cohort, assessed by IHC, was increased in CRCs and was associated to features of aggressive disease.
Expressed in various malignancies, MICA is considered a component of tumor immunosurveillance by interacting with the receptor NKG2D, activating NK cells, and co-stimulating subtypes of T-cells [24, 25, 26]. Our results showed increased expression of MICA in CRC compared to uninvolved tissue. Higher MICA expression was significantly associated to increased tumor stage (T3 and T4), suggesting the potential of MICA as a marker for aggressive CRC.
A mechanistic rationale for the high levels of MICA in cancers may relate to its role in cell homeostasis [27]. High rates of cell proliferation, as observed in tumors during inflammatory processes, lead to MICA overexpression [3, 6]. This upregulation can be interpreted as a means to restore cellular homeostasis. As tumors secrete sMICA, binding of sMICA to the NKG2D receptor triggers downregulation of NKG2D, inactivation of NK/T cells [28, 29], and tumor immunoescape. Additional considerations to the tumor immune evasion mechanism mediated by MICA include those inherent to its highly polymorphic nature as a contributor of differential susceptibility for proteolytic shedding by metalloproteases in the TME [30]. These may be reasons for overexpression of MICA in CRCs as observed in the current study. On the contrary, results [9, 10] demonstrating poor outcomes for patients with low expression of MICA may be due to the presence of MICA alleles that have a tendency to shed or release as extracellular vesicles.
In the literature, there is disagreement about the association between MICA expression and the prognosis for cancer patients. High tumor levels of MICA were previously associated with a good prognosis for prostate cancer and cervical cancer [31]. However, elevated MICA was reported as an indicator of poor prognosis for pancreatic cancer [12] and breast cancer [13]. Survival analysis performed for our cohort suggests, in CRCs, a possible association of poor prognosis to higher expression of MICA, supported by the PROGgeneV2 survival analysis in two distinct cohorts. In disagreement with our findings, two independent studies indicated better prognosis for patients with expression of MICA in CRC [17, 18]. Because this controversy has been also found for other tumors such as non-small cell lung cancer [15, 32], and gastric cancer [10, 33], the matter of expression of MICA and its association with outcome remains an issue of active debate.
In various tumors, MICA sheds from the cell surface into the circulation as sMICA. Binding of sMICA to the NKG2D receptor, without activation or co-stimulation of the effector cells, promotes tumor escape. Unfortunately, we did not have access to plasma to assess circulating levels of sMICA or NKG2D levels in NK cells. Access to these data would help us interpret our results on scope of the described tumor immunoevasion strategy mediated by MICA. In aggressive pancreatic carcinoma, there is an inverse correlation between expression levels of sMICA and NKG2D [12]. Moreover, findings of a recent study concluded that high levels of MICA in serum are associated with a poor prognosis for hepatocellular carcinoma (HCC) [34]. Findings from this study also suggested that MICA blocks the NKG2D signaling pathway by mediating tumor immune escape in HCC [34]. In CRC, this pathway would protect tumor cells from NK cell-mediated cytotoxicity. Further studies are needed to evaluate expression of NKG2D in CRC, its functional association with MICA, and the mechanistic basis of the interaction between these two molecules. Benefits include development of innovative TME-based immunotherapy strategies.
MICA expression has been previously reported in various cellular localizations, such as cell membrane, intracellular space, exosome surface, and soluble form in plasma or supernatant [35]. As discussed before, cell-surface MICA is important for NKG2D interaction and NK cell activation, and sMICA has been reported to impair this mechanism. In a similar manner, exosomes with surface MICA decrease NK cell cytotoxic activity in prostate cancer cell lines [35]. Intracellular localization of MICA has been previously reported, but its biological function has not been fully elucidated. For example, intracellular retention and low surface expression of MICA, presented by melanoma cell lines, contributed to protect tumor cells from cytotoxicity mediated by NK cells [36]. Perinuclear expression of MICA has been reported in mucosal samples of coeliac disease patients; however, nuclear expression has not been addressed [37]. Our study is the first to report nuclear expression of MICA in CRCs. Further investigation is necessary to identify possible DNA binding sites and to address other biological functions of nuclear MICA. Another limitation of the present study is not analyzing the sMICA. Tumor-associated MICA is not the only protein form involved in CRC. Since defined cellular functions are reported for sMICA, future analyses of sMICA will allow elucidation of its role in growth and progression of CRC.
For CRC patients, immune checkpoint blockade therapy has achieved limited success. To improve the outcome for patients with aggressive forms of the disease, current research is focusing on combined treatment with immunotherapy, including chemoimmunotherapy, immunotherapy with radiation therapy, and other strategies. A potential option is stimulation of NK cells and cytotoxic T cells through lowering of MICA expression and neutralization of sMICA. Additional research is needed to clarify the divergent information related to the expression of MICA in CRC as well as its prognostic value and mechanistic involvement in disease aggressiveness.
Our study provides evidence for up-regulation of MICA in CRC and suggests a poor prognosis for CRC patients exhibiting high MICA expression. We believe that the relevance of our findings is high due to similar patterns of high MICA expression identified in large, publicly available omics databases, and the potential of MICA as an actionable molecule of the TME.
IE, SA, MS, VS, WSO, and SAD contributed to the conceptualization of the research concept, performing the experiments, formal analyses, and writing the original draft. AP, SV, UM, and CRG contributed to the conceptualization of the research, study design, supervision, reviewing and editing the original draft, and funding acquisition.
The study was approved by the UMMC Institutional Review Board. This study was a retrospective protocol that was exempt from participant consent. The study was approved by the University of Mississippi Medical Center (UMMC) Institutional Review Board under protocol # 2012-0205.
We thank Elizabeth Tarsi, Tara Craft, Eldrin Bhanat, Jaswinder Kaur, and Joy King for establishing and maintaining the databases. We thank Amit Reddy at the University of Mississippi Medical Center for technical assistance and Donald Hill at the University of Alabama at Birmingham for editing the manuscript.
This study was supported by the Office of Research and Sponsored Programs, University of Mississippi Medical Center (IE and CRG); Coordination for the Improvement of the Higher Education Personnel (CAPES) Foundation, Scholarship #13603-13-2 (MJS), and the Impact Funds from the School of Medicine and the Department of Pathology, University of Alabama at Birmingham (UM).
The authors declare no conflict of interest.
Not applicable.
Datasets utilized for bioinformatics analysis are publicly available (GSE41258: https://www.ncbi.nlm.nih.gov/geo/query/acc.cgi?acc=GSE41258; GSE29621: https://www.ncbi.nlm.nih.gov/geo/query/acc.cgi?acc=GSE29621). Due to regulatory aspects related to protection of privacy of human subjects, we are unable to access the clinical raw data of the individual patients from these publicly available data sets. Histopathology data or our cohort are available from the corresponding author on reasonable request.
Dr. Gomez contributed to this article as an employee of the University of Mississippi Medical Center. The views expressed are his own and do not necessarily represent the views of the National Institutes of Health or the US Government.
Supplementary material associated with this article can be found, in the online version, at https://www.fbscience.com/Landmark/articles/10.52586/4986.
CRC, Colorectal cancer; DFS, Disease free survival; FFPE, Formalin-fixed paraffin-embedded; GI, Gastrointestinal; IHC, Immunohistochemistry; LNM, Lymph node metastasis; MICA, MHC class I polypeptide-related sequence A; TMA, Tissue microarray; TNM, Tumor-Node-Metastasis; UMMC, University of Mississippi Medical Center.