
Delineation of the bladder under a dynamic contrast enhanced (DCE)-MRI protocol requires robust segmentation. However, this method is subject to errors due to variations in the content of fluid within the bladder, as well as presence of air and similarity of signal intensity in adjacent organs. Introduction of the contrast media into the bladder also causes signal errors due to alterations in the shape of the bladder. To circumvent such errors, and to improve the accuracy, we adapted a machine learning paradigm that utilizes the global bladder shape. The ML system first uses the combination of low level image processing tools such as filtering, and mathematical morphology as preprocessing step. We use neural network for training the network using extracted features and application of trained model on test slices to compute the delineated bladder shapes. This ML-based integrated system has an accuracy of 90.73% and time reduction of 65.2% in over manual delineation and can be used in clinical settings for IC/BPS patient care. Finally, we apply Jaccard Similarity Measure which we report to have a mean score of 0.933 (95% Confidence Interval 0.923, 0.944)
Image segmentation of pelvic organ structures is particularly challenging due to many factors, including similarities in image signal contrast between different organs, signal alteration from off-resonance and motion variations propagated by extraperitoneal or parametrial fat, and the presence of fluid and air in the cavities of the pelvis (1). Our work concerns a unique segmentation problem that involves segmentation of all images in a dynamic time series (temporal information) of images under contrast injection (2). The clinical procedure includes the insertion of a catheter and infusion of a contrast agent via this catheter that causes the bladder to gradually distend, which must be tracked (2). The application of interest for this project concerns the development of a clinical protocol for imaging interstitial cystitis/bladder pain syndrome (IC/BPS) (3). This protocol includes evaluation of the permeability of the bladder wall (2). We have applied machine learning (ML) within our image segmentation methodology to improve the performance against the manual segmentation. This work aims to reduce the amount of time that radiologists and technologists spend on manual segmentation. We hypothesize that we can improve the efficiency and accuracy of image segmentation for expanding bladders (and perhaps other organs) through a novel integration of ML.
As we are interested in visualizing the soft tissues of the organs and the surrounding areas, and ultrasound and MRI are more suited for this application in IC/BPS evaluation, we focused on a review of the literature with imaging modalities that are better at visualizing the soft-tissue organ walls. Magnetic resonance imaging (MRI) may be the most suitable, but ultrasound (US) is also a viable non-ionizing modality (4). Both MRI and US processing tools have advanced quickly. Image segmentation techniques are currently classified into layer-based and block-based segmentation methods (5, 6). The layer-based techniques use different object detectors to define shape mask depending upon depth and appearance of the image. Block-based segmentation is based on various features found in the image. The block-based techniques are further classified into region- and edge-based techniques. The region-based techniques are based on discontinuities in the image, while the edge-based techniques are based on similarities of image features. A brief description of these two techniques is provided later. Many current texts provide a variety of image segmentation algorithms and tools based on these techniques (5-7) These algorithms are not applied typically as singular instances, however, but are stepwise performed. The current methods are more likely to incorporate the combination of techniques into a segmentation pipeline in a series of steps to derive a final segmentation.
In 2010, Ma et al. (8) produced a review of image segmentation that focused more specifically on organs in the pelvis. While this review was not comprehensive of all techniques, Ma et al. organized the algorithms into three broad categories for image segmentation within the pelvis. The classifications were 1) those based on clustering techniques; 2) those based on thresholds of distinctive image features, such as image intensity (followed by region growing methods) and/or image gradients, and; 3) those based on parametric deformable models.
Clustering-based image segmentation methods have been particularly appealing, especially in inter-modality combination with MRI (9). For inter-modality image segmentation, Bedzek provided a review of clustering techniques that described how T1-, T2-, and PD-weighted MR images can be organized to create a feature basis for clustering techniques. The Bedzek work exclusively involved studies of the brain. There appear to be few examples that apply clustering techniques outside of the brain. However, in 2011, Tamilselvi applied k-means clustering to image segment the renal calculi (10).
Image segmentation methods based on image features have an important role, due to their common application across many organ systems. The main advantage of these techniques is that they capture statistics differently for different tissue types, are convenient to design, and are algorithmically faster to implement. The primary goal of image segmentation built on image features is to differentiate image portions based on a discontinuity or a similarity among the features in the image. Importantly, an image region can be defined by similarity of neighboring image values, or it can be described by defining the boundaries of the region. Thus, two popular strategies adapted for such feature segmentation are region-based and edge-based. In the pelvic image segmentation literature, Rundo (2016) describes a multiple seed region-growing method based on neighboring signal intensities that were used for image segmentation of uterine fibroids. Edge-based image feature segmentation methods using Sobel filtering were applied by Padmapriya to delineate the boundaries of the bladder (11). Sobel filtering is a classic form of edge detection (5). However, Canny filtering applies additional optimization terms and is considered more modern (12).
While Ma referenced a third class of image segmentation as originating from deformable model methods, these methods can be classified more broadly under partial differential equation (PDE)-based image processing methods (13, 14, 15). In deformable modeling, control points are selected and contours are evolved to define the boundaries of a region (14). The curves are evolved through calculations that include PDE terms. Geometric properties, such as spatial derivatives, and/or curvature are incorporated as a mathematics functional that applies a calculus of variations formalism (16-18), These geometric properties are particularly suitable for the adjustment to edge structures and aid in the regularity of the curves/surfaces within the evolving contour structure (14, 19) or pair of contours with constraints (19,20) In previous work with cervical cancer, we applied iterative deformable models for the image segmentation of tumors that had spread to the uterus (18). More recently, Duan et al. developed a coupled level-set segmentation, a PDE-based method, which was applied to the bladder wall for non-contrast T1-weighted images in six subjects (21). The coupled-level set was then further refined by Han of the same research group, who continued to augment the bladder segmentation methodology by applying Adaptive Markov Random Fields (22).
Building on previous experience, we have sought to extend an image segmentation methodology to incorporate ML. Our techniques are particularly suited to the evaluation of IC/BPS (2). As a matter of clinical assessment, the bladder urothelium is normally impermeable to urinary wastes, and a disruption of the permeability barrier allows leakage that can result in inflammation. Imaging acquisition during the intravesical administration of gadolinium diethylenetriaminepentacetate (GD-DTPA) has been shown to identify changes to bladder urothelium in IC/BPS patients vs. controls (2). As this research is being translated to clinical practice, one of the first goals of our work is to select features that lend themselves to an efficient and generalizable process by which ML can be used to discriminate features based on data-driven classification (23, 24, 25)
The focus of this work is the proposition of a novel technique that propagates and modifies an initial control point boundary selection throughout the DCE-MRI perfusion series. To accomplish our protocol, we aimed to provide a segmentation of the rim of the organs in the presence of many complex confounders, and manage accuracy across numerous images. Combined with the more complex aspects of concurrent T1-contrast uptake, the distention of the wall and artifacts introduced from the catheter itself in the field of view make this a challenging problem with the unique potential to be aided by ML techniques. The urinary bladder distends and stretches to accommodate wall changes and adjust to many other peripheral organ surfaces and edges (Figure 1A). While a single manual segmentation was not a significant work/time load for our clinical team (radiologists and technologist), the inefficiencies introduced by multiple cases and the time required to perform multiple time series segmentations would be problematic. To address these challenges, we created a semi-automated assistive tool, and implemented it through a combination of supervised ML techniques based on edge detection and morphological filtering that included terms that reflect deformable, model-based correction features.
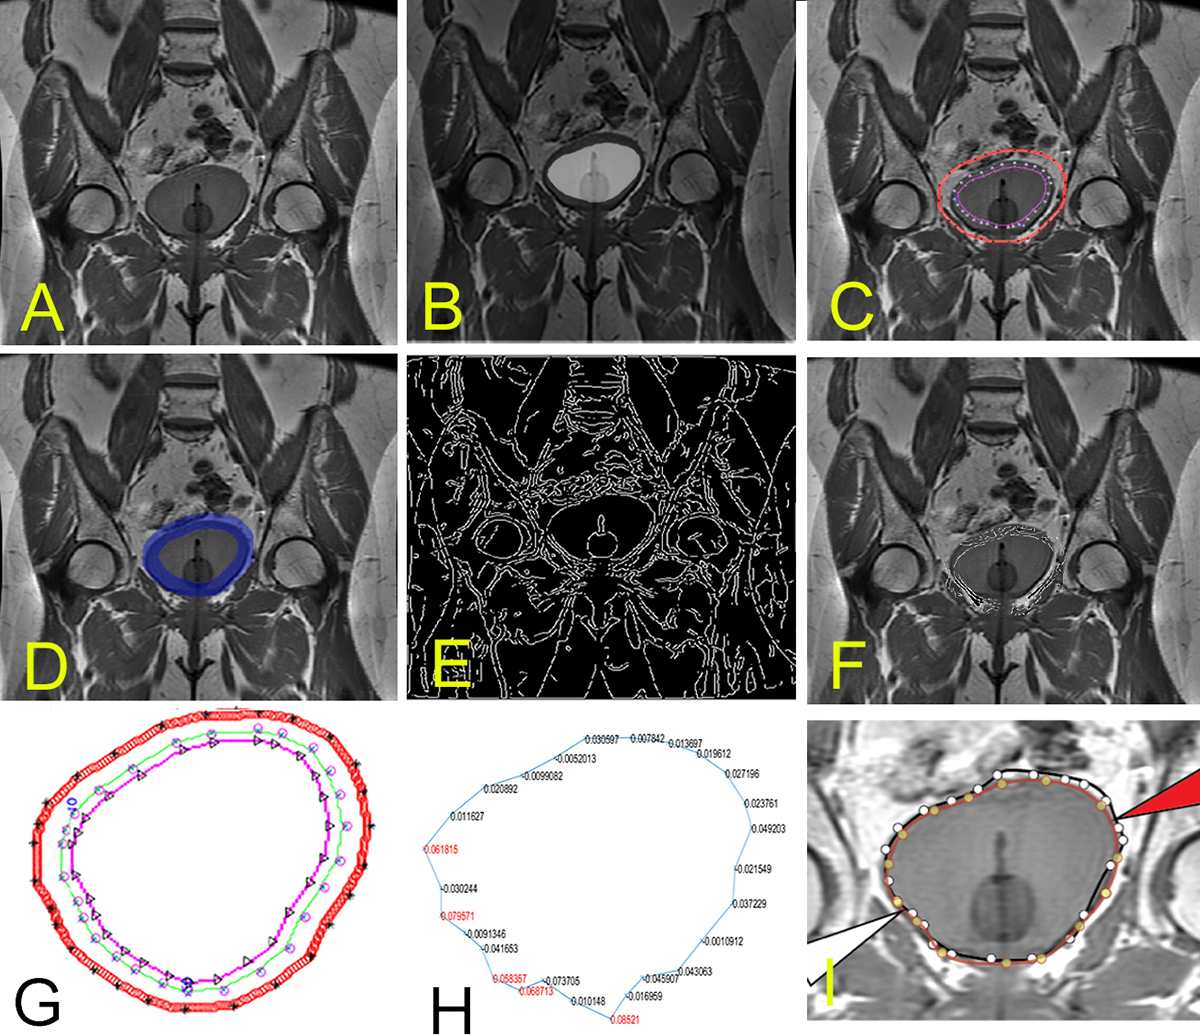 Figure 1
A. The initial bladder position is shown before significant contrast uptake. B. Segmentation image from the first time point that will be propagated for to this slice. C. The control points after region growing. D. Mask for the same slice with the E. Canny edges mapped across the entire image. F. Masked Canny edge identifying the edge of interest when the search space is restricted to masked morphological filter operations (dilation and erosion) to restrict the search space for edges, as described further in the latter part of the text. G. shows the bounding region with control points. Orthonormal search is performed between inner to outer edge. H. shows an example of Menger Curvature values used in the machine learning algorithm for inclusion/exclusion of jagged points. I. shows final results.
Nine subjects were evaluated in a HIPAA-compliant and IRB-approved study at the University of Oklahoma Health Sciences Center. Imaging was performed using a T1-weighted spin echo images acquired in the coronal direction with a TE/TR of 10/700 ms, 320x160 matrix, FOV=36 cm, and ST=4 mm on a 3T MRI wide-bore system. Image sets were obtained over 30 min at 8 different time points. Figures 1A through Figure 1H show the challenge of bladder shape alteration across different time series points in a fixed slice position. Figure 1 illustrates an example work-through for a single patient. A summary of our methodological steps follows: 1) generate a rapid initial segmentation of the pre-contrast images; 2) mark key control points for each slice on a single time series; 3) apply Canny Edge Filter that was morphologically dilated/eroded to bound the area of search; 4) find edge values along vectors that are estimated normal and that pass through each control points, as described further in this document, and; 5) integrate ML with selected image features of Menger curvature and derivatives of second-order curves to automate the segmentation of the subsequent time points.
One of the first steps in our image-processing pipeline is the application of morphological filtering. The initial contour was derived from control points that are positioned in an array. Initial control points were placed manually by the user (technician and/or radiologist) to mark the boundary of the first bladder series, and were marked sequentially from first to last control point in a clockwise fashion. Careful placement of the initial points on one of the dynamic series sets was useful, particularly in overcoming the multiple possible confounders (1) associated with imaging organs in the pelvis at time point 1 (Figure 1B). Catheter insertion provided an additional challenge, as the catheter points should not be contained within the search boundary. The control points create a polygonal region of interest (ROI) that is converted into a binary spatial map. This binary map represents whether points in the image are inside or outside of the region (setting them to 1 if inside and 0 if outside). These maps can then be morphologically filtered to mark in which part of the image the search should occur in subsequent steps of the image processing pipeline.
This morphological filtering is a nonlinear-shaped image processing technique that involves a structuring element that operates over the binary spatial map. Some basic definitions that operate on a structuring element B are included as a review for the reader here. Bz is the set of points in which translation of B by the z units is considered and given by the following formula:

Another notion concerns the symmetric set of B, which is given by:

To create the bounds of search, using morphological filtering the structuring element B is positioned at every location in the image, and is then compared with the corresponding neighborhood of pixels. While there are several morphological operations, whether the element is fully contained within the neighborhood is a concern, while other morphological filtering operations test whether the element simply intersects the neighborhood. The erosion of A by B is given by the following relationship, in which the translation of B is fully contained within the binary image A:

For the application of morphological erosion, we selected a 5x5 disk-structuring element that was performed to produce an interior boundary ROI. For example, the dilation morphological operation with a structuring element is a technique that adds layers of pixels to the outer boundaries of regions in the present study. The dilation is obtained by:

In the present study, the dilation morphological operation was applied using a 9x9 disk-structuring element to thicken the outer boundary of search. On a separate set, the erosion operation has the opposite effect of dilation, as it reduces the shape by removing layers of pixels from both the inner and outer boundaries of regions.
Note that in our case, the erosion operation was applied with a 5x5 disk-structuring element. This element was smaller than the dilation because: 1) it is less likely that the bladder will shrink as contrast is being added, and 2) the catheter should not be included in the interior boundary for search. Subtracting morphologically the binary image of the erosion map from the binary image of the dilation mask provides the boundaries for search. In Figure 1C, the outer examples are provided for the outer boundary and inner boundary search. The difference between the dilated and erosion sets would be the regions of search. iHere the resultant set (shown in the shaded region in Figure 1B), R is the set operation of the dilated set, D with the removed eroded set, E as per operation.
 (the shaded region in Figure 1B)
After morphological filtering is applied and used to bound the area of search (Figure 1D), Canny filter edge points can be constrained by the binary mask R. For each control point, a direction search is applied along an approximation of the normal direction of the surface (Figure 1F). This was calculated at each control point by taking the two neighboring control points considered to be circularly adjacent and calculating an approximate normal that passes through the center control point (Figure 1G). The searches are performed along this normal for that control point at the start and end of the morphological boundary. Note, to find these boundary edge points, we applied a line optimization technique that is used in multidimensional optimization methods.
We calculated the bounding points by using a golden ratio bracketing search (24). This is performed by geometrically expanding the search along the direction vector until a subsequent bounding region is outside of the region of interest. For bracketing, once a point is located outside of the region, a third point is found using the golden ratio. Then, comparisons are performed between the smaller interval of three points in which one point is in the set and the other is out of the set (24). These bracketing proceeds until the movement ratio converges to a single pixel step, thus marking the boundary. Along the normal vector for that particular boundary and from the interior edge (along the erosion edge) to the exterior edge is calculated and retained into an array noting the locations of Canny Edge points. The number of edge points that lie along the vector and the locations are stored within an enumerated data structure for use by the ML algorithm.
To encapsulate the shape features of curves into the ML model, we incorporated several features. The main features are based on Menger Curvature (MC) and the Dot Product Angle (DPA), which incorporate three adjacent contour points to generate metrics that describe the shape that would reflect the internal energy of the curve when there is more local bending and/or jaggedness. A pictorial of these metrics is shown in Figure 2. The general formula for the curvature is a way to evaluate curvature when given three points in a plane, and was named after the late mathematician Karl Menger (26). The curvature evaluation (at point x0) is given by the following formula:

 Figure 2
Illustration of two additional ML features used to improve the segmentation: Menger Curvature and second-order dot-product, which produces an estimate of the second-order change in the angle discretely.
A second feature metric is used to calculate the central angle (at x0) through the dot product of the two adjacent vectors (x0,x-1) and (x0,x+1). Note that the resultant angle is normalized between -90 and 90 degrees.

To create two additional metrics, we added numerical differentials and applied these operations to neighboring point values. For example, we selected the maximum first-order difference of the curvature (MDC) between local Menger curvature (eq. 5) at the current point (at x0) with the curvature of its neighbors. This results in the third feature:

For the fourth feature, we applied the second-order numerical differential estimate of the angle (SOA) as another feature measure that was derived using the angle estimation as calculated in eq. 6 above:

These numerical derivatives are a simplified, data-driven way to reflect the shape properties of the contours used to segment the surface. Such features were incorporated in the ML algorithm to reflect the shape and curve parameters and reflect the internal energy of the surface, such as the bends in the curve.
M is used to evaluate the best index of edge values that lie along the normal direction between the eroded and dilated regions at each control point. Incorporated features that capture shape characteristics include local Menger curvature (MDC) and changes in angle values (SOA). ML was applied using the machine learning toolbox with Matlab (Natick, MA) with a neural network design. ML parameters included the use of 70%, 15%, and 15% of the points that corresponded to percentages used for training, validation, and test sets, respectively. Such conventional parameters for percentages are used frequently for machine learning algorithms, but we also tried several other closely related percentages without significant changes to the results. For example, to verify that ten hidden nodes were sufficient, we doubled the number of hidden layer elements to twenty nodes, and observed little change in accuracy.
Finally, we use the Jaccard index, which is used to compare the similarity of data sets to provide a similar area of overlap between expert and algorithm-determined structures. The index is defined as the size of the intersection divided by the size of the union of the sample sets:
 (9)
(9)
Where,

The Jaccard coefficient measures similarity between expert delineated (set A) and ML-algorithm (set B) created boundaries with the maximum possible value of J=1.00 for an exact match.
The accuracy of our method was determined by comparing positions and closest edges between the technologist-/radiologist-specified edge points. All intermediate steps are shown for the remaining eight patients are shown in Figure 3 through Figure 10. The results from the machine learning produced 6400 control points to be evaluated (in a subset across all dynamic series and patient sets in our evaluation). As previously stated, there are complex challenges associated with segmenting organs in the abdomen and pelvis (Figure 1B). With the application of ML, accuracies for the training set=90.0% validation set= 91.6%, and test set=90.73% were improved. This corresponded to cross-validation error of the training set=2.93, validation set=8.22, and testing set=8.254, in which lower numbers are considered better. The ML procedure took 52 epochs to achieve convergence, which occurred in ~28 seconds across all our data points.
 Figure 3
Illustration of the second patient with intermediate steps (the first patient was shown in Figure 1).
 Figure 4
Illustration of the third patient with intermediate steps.
 Figure 5
Illustration of the fourth patient with intermediate steps.
 Figure 6
Illustration of the fifth patient with intermediate steps.
 Figure 7
Illustration of the sixth patient with intermediate steps.
 Figure 8
Illustration of the seventh patient with intermediate steps.
 Figure 9
Illustration of the ninth patient with intermediate steps.
 Figure 10
Illustration of the tenth patient with intermediate steps.
In Figure 11, we illustrate the results of the Receiver Operating Curves (ROC) for both the training and validation sets. Note that as the ROC curves shift upwards, these shapes for our ROC curves appear to indicate adequate performance across classes. The training, validation, test and overall confusion matrix are shown in Figure 12. Figure 13 illustrates all ROI data for all patients on a single figure. Figure 14 illustrates zoomed images of the ground truth and ML segmented ROIs for these patients. The red arrow is the computer-generated result, while the white arrow is the expert-generated result.Additionally, we were interested in whether the technique achieved an overall 65.2% time reduction over manual segmentation alone, as the technologist/radiologist may do some fine-tuning. However, when using the ML method, 80.0% of slices had moderate to substantially strong placement along the boundary (high levels of agreement with the radiologist delineation were in the top 37.4% of this group, without large corrections). To validate the results, we applied the Jaccard Similarity Measure, which we report to have a mean score of 0.933 (95% Confidence Interval 0.923, 0.944) with the highest possible value for complete agreement of 1.00 for that measure as shown as a distribution in Figure 15.
 Figure 11
Training and validation ROC.
 Figure 12
Confusion matrices for the results comparing automated segmentation to the points selected by the expert.
 Figure 13
Results for all 9 patients. The red arrow is the computer-generated result, while the white arrow is the expert-generated result.
 Figure 14
Zoomed-in regions of segmentation for all 9 patients.
 Figure 15
Illustration of the results of a similarity comparison between computed segmentation with the expert delineated results. Note, a mean of 0.933 was found on Jaccard similarity and is displayed in box-and-whiskers format and range/quantile distribution across all patients.
For the evaluation of organ permeability, we were particularly interested in examining parenchymal functional changes. This required detailed segmentation to assess the bladder rim. We have demonstrated that our proposed image segmentation method was a fundamental component to attempt to overcome the complexity due to location and inter-abdominal motion, and to manage the numerous time series images needed to advance our image segmentation tool that permits more of the data features to drive and adapt the algorithm. The challenges of dealing with abdominal organs that change size with the introduction of diluted contrast agents by catheter can be formidable. As the procedure to evaluate IC/BPS is relatively new, specialized image segmentation tools are required; we have provided a prototype to perform this analysis. Simplification of the algorithm into more natural features may be beneficial, as more data are acquired.
Image segmentation of the bladder is complex and can rely on many facets and processing steps. In each step, specifically tuned pipelines for each segmentation evaluation exist. Feng et al. (27) demonstrated a comparison of several forms of image segmentation methods, including a feature-based and PDE level set built into a vendor system for radiation therapy. However, these segmentation methods are application-specific and vendors have not yet integrated ML techniques into their algorithms, which could possibly adapt with datasets and changes in environment or improvements to acquisition technology. With the specific interest to incorporate more unsupervised learning applications of deep learning to the bladder, there has been some success with computed tomography (CT) (28). CT may offer the benefits of more image regularity and speed of acquisition. However, in our case, CT is particularly undesirable due to ionizing radiation dose and low-to-poor contrast of the wall boundary that is the functional target of our evaluation (29, 30). Due to its ability to image soft tissues and evaluate permeability of the bladder (2, 31), MRI has been our choice for the target evaluation of IC/BPS and would have its own tuned strategies for evaluation that we have sought to evaluate in this work.
ML is a particularly suitable technique for evaluating this problem, since dynamic images from multiple time series can be used to inform each segmentation step when similar adjacent data could be used (for training). Similarly, control points from one part of the time series can inform the neighboring time points using ML techniques. Despite the complex segmentation problems in the pelvis, the radiologist team was pleased with our advancement in the image segmentation. We were able to manually segment one series within the time series from what appeared to be an untenable number of images, and adjust boundaries to a more manageable number by a factor that lowered segmentation time to 34.8% of the total. A high level of agreement of 0.933 was achieved on the Jaccard similarity measure. The data for this project is for monitoring functional characteristics of a dynamically changing bladder wall and is a unique data set but has a limitation in the size of the data. However, we illustrate that the potential to improve the speed and objectivity of the evaluation. Finally, the method applies an AI technique that in the future can both be semi-automated as well as to adapt from potentially newly acquired data.
In summary, we have applied an integrated pipeline using ML, morphological filtering and edge detection, and now provide a new opportunity for the evaluation of the bladder rim to assess permeability. We sought a method that requires selecting a modest number of control points on the pre-contrasted images, from which we employed ML-based segmentation to compensate for the swelling size of the bladder at the rest of the time points. As shown, this newly integrated ML method has been helpful for organ wall assessment. This work illustrates that ML can be integrated into particularly challenging problems to create efficiencies that may make future applications, such as clinical applications for IC/BPS, easier to implement. One of the goals was to improve the time needed to analyze these images. We demonstrated an overall reduction in time (by 65.2%) with our pipeline. Thus, the algorithm we applied achieved a level of efficiency for instances in which we have introduced contrast agent into the bladder and seek to image segment the bladder organ over serial time courses.
Funding for this work was obtained from National Institutes of Health (NIH), National Institute of Diabetes and Digestive and Kidney Diseases (NIDDK) grant no. P20DK097799 (REH). We thank Dr. Robert Hurst and Dr. Rheal Towner for bringing the ICBPS clinical problem to our attention. We thank Phillip Rhoton and Saurabh Kumar Srivastava for their organizational and technical assistance.
DCE
Dynamic Contrast Enhanced
Magnetic Resonance Imaging
Interstitial Cystitis
Bladder Pain Syndrome
Machine Learning
Ultrasound
Gadolinium diethylenetriaminepentacetate
Region of Interest
Menger Curvature
Dot Product Angle
Maximum first order difference of the curvature
Second Order numerical differential estimate of the angle