


Frontiers in Bioscience-Landmark (FBL) is published by IMR Press from Volume 26 Issue 5 (2021). Previous articles were published by another publisher on a subscription basis, and they are hosted by IMR Press on imrpress.com as a courtesy and upon agreement with Frontiers in Bioscience.

1 Professor M Viswanathan Diabetes Research Center, Royapuram, Tamil Nadu, India
2 Department of ECE, Visvesvaraya National Institute of Technology, Nagpur, India
3 Department of ECE working with College of Engineering Karunagapally, India
4 Annu's Hospitals for Skin and Diabetes, Andhra Pradesh, India
5 Department of Cardiology, Indraprastha APOLLO Hospitals, New Delhi, India
6 Department of Radiology, University of Cagliari, Italy
7 Department of Neurology, University Medical Centre Maribor, Slovenia
8 Department of Radiology and Ultrasound, University Hospital for Infectious Diseases Croatia
9 Cardiology Clinic, Onassis Cardiac Surgery Center, Athens, Greece
10 Department of Neurology, University Medical Centre Maribor, Maribor, Slovenia
11 Heart and Vascular Institute, Adventist Health St. Helena, St Helena, CA, USA
12 Minimally Invasive Urology Institute, Brown University, Providence, Rhode Island, USA
13 Men’s Health Center, Miriam Hospital Providence, Rhode Island, USA
14 Rheumatology Unit, National Kapodistrian University of Athens, Greece
15 Department of Cardiovascular Prevention and Research Unit Clinic and Laboratory of Pathophysiology, National and Kapodistrian Univ. of Athens, Greece
16 R and D Academic Affairs, Dudley Group NHS Foundation Trust, Dudley, United kingdom
17 Shree Polyclinic & Lab, Bangalore, India
18 Preventive Health Check, Fortis Hospital, Bannerghatta Road, Bengaluru, India
19 MD, Department of endocrinology, Ridge Hospital, Accra, Ghana
20 Head of Cardiology, Greater Accra Regional Hospital, Ridge, Accra, Ghana
21 Department of Radiological Sciences, University of Oklahoma Health Sciences Center, Oklahoma City, USA
22 Semmelweis University, Budapest, Hungary
23 Vascular Screening and Diagnostic Centre and University of Nicosia Medical School, Cyprus
24 Cardiovascular Medicine, University of Virginia, Charlottesville, VA, USA
25 Brigham and Women’s Hospital Heart and Vascular Center, Harvard Medical School, Boston, USA
26 Stroke Monitoring and Diagnostic Division, AtheroPoint™, Roseville, CA, USA
Abstract
Diabetes and atherosclerosis are the predominant causes of stroke and cardiovascular disease (CVD) both in low- and high-income countries. This is due to the lack of appropriate medical care or high medical costs. Low-cost 10-year preventive screening can be used for deciding an effective therapy to reduce the effects of atherosclerosis in diabetes patients. American College of Cardiology (ACC)/American Heart Association (AHA) recommended the use of 10-year risk calculators, before advising therapy. Conventional risk calculators are suboptimal in certain groups of patients because their stratification depends on (a) current blood biomarkers and (b) clinical phenotypes, such as age, hypertension, ethnicity, and sex. The focus of this review is on risk assessment using innovative composite risk scores that use conventional blood biomarkers combined with vascular image-based phenotypes. AtheroEdge™ tool is beneficial for low-moderate to high-moderate and low-risk to high-risk patients for the current and 10-year risk assessment that outperforms conventional risk calculators. The preventive screening tool that combines the image-based phenotypes with conventional risk factors can improve the 10-year cardiovascular/stroke risk assessment.
Keywords
- Diabetes
- Atherosclerosis
- ACC guideline
- AHA guideline
- Conventional Risk Calculator
- 10-year risk assessment
- Stroke
- Cardiovascular
- And Image Phenotypes
Cardiovascular disease (CVD) and stroke are the leading cause of death around the world (1). Annually, around 17.9 million people experience mortality due to heart attack and stroke events (1). Atherosclerosis is one of the major culprits for the occurrence of such CVD/stroke events (2-4). Looking at the various risk factors of CVD, diabetes mellitus (DM) is considered to be one of the leading biomarkers, which is responsible for the acceleration of atherosclerosis process (5,6). Thus, the scope of this current review is partially limited to the patients suffering from DM. At present, around 425 million people are suffering from DM (7). In 2017, DM was responsible for the deaths of ~4 million people around the world causing an economic burden of $737 billion (7). This mortality rate is similar in both low- and middle-income countries (7). The effectiveness of management of CVD is highly dependent on the availability of medical care and resources. CVD/stroke events are known to be accelerated by DM. Globally; one out of two people remain undiagnosed with the condition of DM (8). Such undiagnosed patients with DM are at high risk of developing atherosclerosis driven CVD/stroke events. Thus, there is a demand to refine and develop the non-invasive preventive screening tools that will be affordable to the patients with diabetes and/or diabetes accelerated, atherosclerotic diseased population. Such screening tools should also have the potential to predict the long-term risk of the cardiovascular health of the population.
In order to develop the screening tools for patients with diabetes, it is important to investigate the link between DM and the atherosclerosis-driven CVD. Atherosclerosis is an inflammatory disease (2,9). In general, atherosclerosis begins with damage to the endothelial cells (2-4,9). It should be noted that the two primary complications of DM called insulin resistance and hyperglycemia (6,10) exaggerate this endothelial damage. Impaired endothelium then leads to the several stages of atherosclerosis, such as deposition of low-density cholesterol, within subendothelial cells, initiation of the inflammatory process, activation of monocytes, the formation of macrophages, development of foam cells, atheroma formation, and plaque-rupture (2,4). The growth in DM-driven atherosclerosis further leads to catastrophic events, such as stroke and coronary artery disease (CAD) (10,11). In order to predict the risk of CVD/stroke in patients suffering from diabetes, it is important to capture this growth in this DM-driven atherosclerosis process.
Primarily, there two screening methods to capture the risk of DM-driven atherosclerosis: (i) using conventional blood biomarkers (12-15) and (ii) using the imaging modalities. Conventional blood biomarkers along with patients’ demographics, when used in a statistically derived risk prediction models or calculators, (16-22) are typically used in screening for CVD/stroke risk framework. Risk prediction models/calculators (scaled between 0% and 100%) are not only used for risk-stratification of diabetes patients (12-15) but also used by multiple guidelines (19,23,24) for the preventions on CVD/stroke events by recommending suitable treatment. Recent guidelines by the American College of Cardiology (ACC) and American Heart Association (AHA) have recommended that the patients with DM should be classified into a high or low-risk category to receive either the high or moderate-intensity of statin for atherosclerosis prevention (19).
Although conventional blood biomarker-based screening methods are used and recommended by multiple guidelines (19,23,24), there are some reservations associated with these methods. For example, the morphological variations in the atherosclerotic plaque components are not well-captured by these blood biomarkers (12,15). This is one of the reasons for the underestimation or overestimation of CVD risk by all such blood biomarker-based risk prediction models in patients with diabetes (25-28). To tackle this issue, different imaging modalities, such as computed tomography (29), magnetic resonance imaging (30), optical coherence tomography (31), photon emission tomography (PET), and ultrasound (15) are currently being used that have the potential to capture and visualize the morphological variations in the atherosclerotic plaque (15,31,32). Furthermore, such image-based risk factors (or phenotypes), when combined with the conventional blood biomarkers, have truly improved the performance of the CVD/stroke risk prediction in patients with DM (12-14). The screening of CVD in patients with DM can be possible by using various invasive and non-invasive imaging modalities (15,29-31). For example, the FACTOR-64 study, by Muhlestein et al. (33), used coronary computed tomography for routine screening of CAD in patients with DM.
An important point to note here is that, although multiple studies have shown a higher risk of CVD/stroke in patients with diabetes compared to non-diabetic patients (10,34), very few of them have provided the different screening methods that can be used to predict the CVD/stroke in patients suffering from DM. The primary objective of this review is to investigate all such screening methods that can be used to provide the long-term risk assessment in patients suffering from DM. This review also investigates the potential of non-invasive screening using carotid ultrasound (a well-established surrogate marker for coronary artery disease) imaging modality that can provide accurate measures of atherosclerosis in patients with diabetes. Finally, this review emphasizes the use of integrated screening tools that combines the effect of both conventional blood biomarkers and the ultrasound based image phenotypes.
The layout of this paper is as follows. The search strategy adapted for this paper for the selection of the references is presented in Section 2. The biology of diabetes, atherosclerosis, and its association with diabetes and atherosclerosis is discussed in Section 3. The conventional screening tools for CVD risk assessment are discussed in Section 4, followed by the carotid ultrasound-based screening tools in Section 5. The integrated screening tools for the CVD risk assessment in patients suffering from DM is presented in Section 6. The summary and the critical discussions are presented in Section 7, followed by the conclusions.
A systemic search of the literature was conducted using PubMed, ScienceDirect, and Google scholar to summarize previous research studies. This study was limited to the articles published within the last 12 years in peer-reviewed journals. The focus of this review is on the preventive screening methods in patients with diabetes. Figure 1 shows a bar chart of the overall trend of publications in diabetes, atherosclerosis, image-based phenotypes, and preventive screening in the past four decades. The horizontal axis shows the year of publication, while the vertical axis shows the number of articles corresponding to those years. A total of 184 relevant references were chosen from the articles studied for this review. The search Key Words used were “mortality rates in cardiovascular/stroke disease,” “financial burden of diabetes cardiovascular disease stroke,” “cardiovascular disease,” “cardiovascular stroke diabetic statistics,” “ACC/AHA guidelines,” “biology of diabetes,” “diabetes and atherosclerosis,” “carotid intima-media thickness,” “10-year cardiovascular risk assessment,” “risk calculators,” “conventional risk factors,” “symptomatic and asymptomatic plaque,” “image-based phenotypes,” “FRS, ASCVD SCORE, WHO, RRS, PROCAM, UKPDS,” “IMT, IMTV and cardiovascular stroke risk,” “TPA and risk,” “clinical trials diabetes,” “case reports diabetes screening,” and “preventive screening in diabetes.” The members in our team collectively reviewed the articles and finalized the list of references.
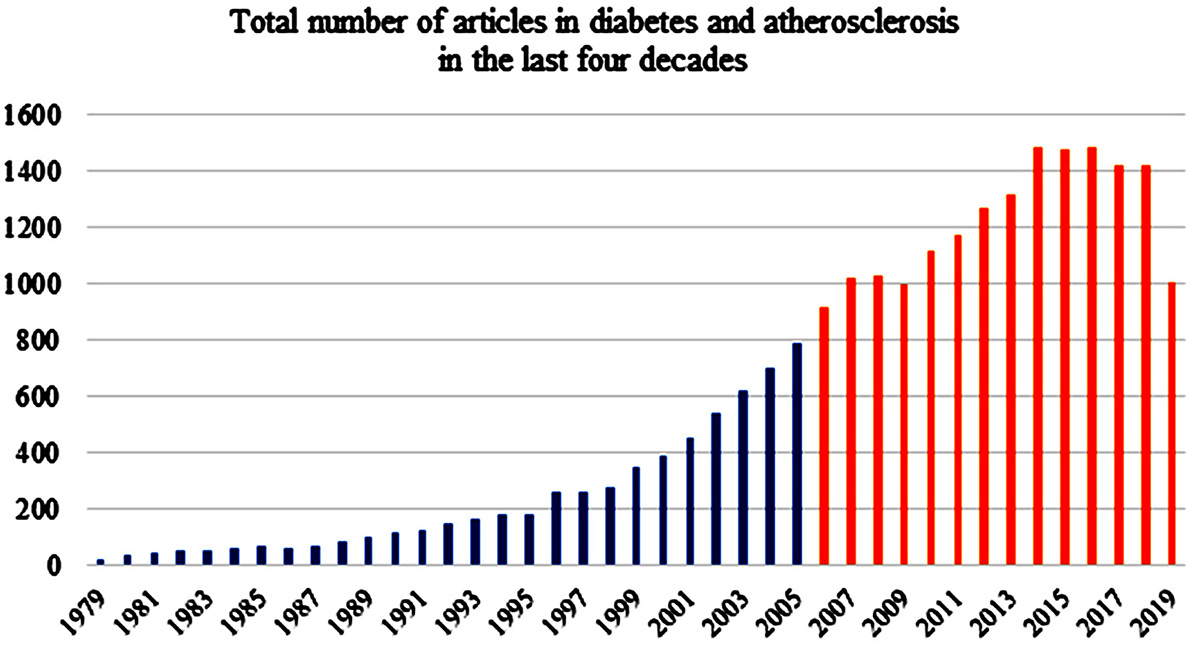 Figure 1
The overall trend of publications on diabetes, atherosclerosis, image-based phenotypes and preventive screening in the past four decades.
Atherosclerosis is an inflammatory disease which involves several stages of plaque buildup within the arterial walls (2-4,35). The initiation of atherosclerosis is linked with the dysfunction of endothelial cells covering the walls of the blood vessels. This leads to the deposition of LDL cholesterols, within the subendothelial layers. Endothelial dysfunction and the deposition of LDL cholesterol result in the initiation of inflammatory process. This inflammatory action causes the monocytes to migrate from the lumen to the subendothelial region. Once entered into the subendothelial region, the monocytes get transformed into macrophages and absorb the lipids to become a foam cell (36,37). The accumulation of more macrophages and foam cells further forms a necrotic core that contains the lipids, foam cells, fatty streaks, and the calcified nodules (2-4,35,37). The formation of this complex plaque allows the smooth muscle cells to migrate from media layer and form a protective cover on the necrotic core to prevent its further encroachment towards the lumen (38). This whole process, when accelerated, may cause blockage in the arteries or occasionally ruptures, leading to catastrophe in the form of CVD and stroke (38). Formation of atherosclerosis is illustrated in Figure 2 (a). Since the focus of the paper is on image-based screening strategies and risk assessment, only a brief description of atherosclerosis formation is presented here and more details can be seen in the studies published by Libby et al. and Lusis et al. (3,4,38).
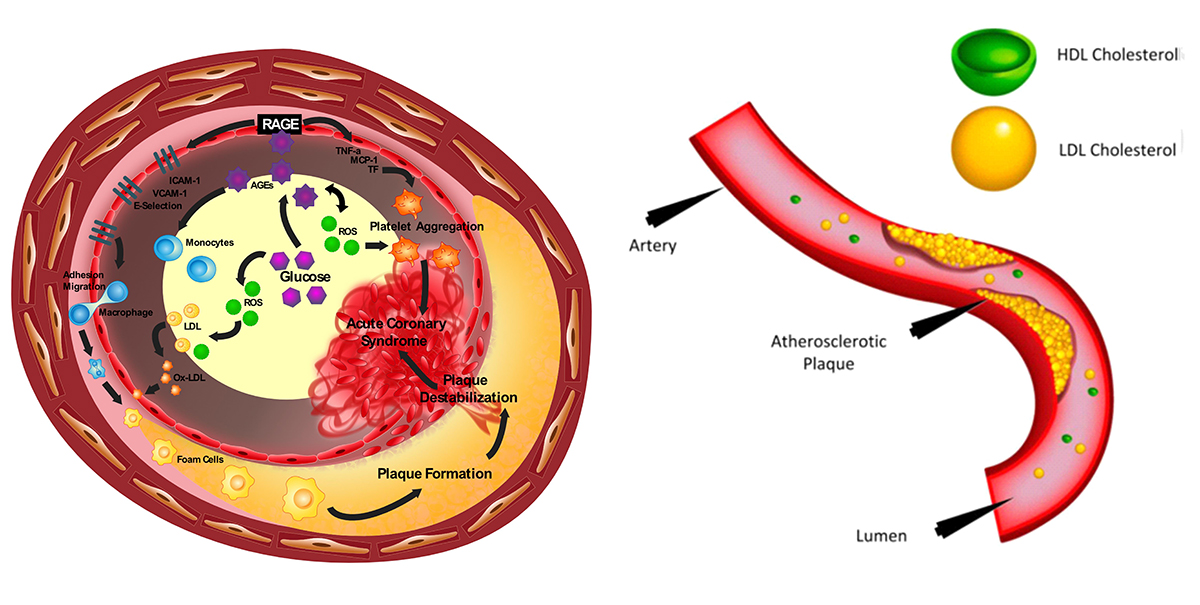 Figure 2
Initiation and progression of atherosclerosis in patients with diabetes mellitus. Left Figure: Diabetes accelerated atherosclerosis and Right Figure: The formation of atherosclerosis in the vessel wall (Used with permission from Cuadrado-Godia et al. (2018) (41).
Diabetes is a disease when the pancreas does not produce enough insulin or there is poor management of the insulin (39). Insulin is an essential hormone that can lower blood glucose (40). Primarily there are three categories of diabetes: (a) type 1, (b) type 2, and (c) gestational diabetes (39,40). Type 1 is characterized by poor insulin production. It is caused by an auto immune destruction of insulin producing beta cells of islets of Langerhans in the pancreases. Type 2 DM is a result of both impaired insulin secretion and resistance to its action (insulin resistance) (39,40). Gestational diabetes is a temporary disease and occurs during pregnancy (39). Women diagnosed with diabetes by standard diagnostic criteria in first trimester should be classified as having preexisting pre-gestational diabetes (40). Gestational DM is diabetes that is first diagnosed in 2nd and 3rd trimester of pregnancy (40). The improper management or deficiency of insulin leads to the presence of uncontrollable glucose or sugar in the blood (or hyperglycemia). High blood sugar affects the permeability of the vessel walls that carries the blood (41). The endothelium cells in the vessel wall absorb the glucose and more reactive oxygen species (ROS) are produced (41). The process of diabetes formation is shown in Figure 2 (b). Note that since the focus of the paper is on image-based screening strategies and risk assessment, the review on the pathophysiology of diabetes and of atherosclerosis has been described in detail elsewhere (6,42).
With an increased level of ROS due to hyperglycemia, there is an increase in platelet aggregation and macrophage formation, further leading to atherosclerosis (41,43). Studies have shown that atherosclerosis was more advanced in diabetes patients than non-diabetes patients, irrespective of their age (44). Further, study groups have observed the correlation of Hb1Ac (a diagnostic marker of diabetes), with subclinical atherosclerosis in Chinese (β=0.018, p=0.03) (45) and older Koreans (β=0.020, p=0.045) using multivariate linear regression analysis (46). Recently, another group (45,47,48) showed those high values of HbA1c, associated with a vulnerable plaque in the carotid artery. The association of diabetes and atherosclerosis has been an important factor in the treatment for glucose control using pharmaceutical drugs by reducing the progression of CVD (49). Additionally, Sun et al. (47) has proposed that the “determination of HbA1c and characterization of carotid atherosclerotic plaque by MR vessel wall imaging, might be useful to better select proper treatment options”. These studies suggest that monitoring diabetes systems can aid in stemming progression and vulnerability in atherosclerotic patients. Furthermore, the diabetes patients could be monitored for morphological changes in the arteries, all these factors that could lead to stroke/myocardial infarction. Thus, imaging of diabetes patient plaque burden to characterize it would be important for CV risk assessment.
Screening of CVD risk in patients suffering from DM can be possible using conventional tools that are generally comprised of patients’ physiological parameters and blood biomarkers. Such conventional screening tools can provide a long-term estimate of CVD risk of patients. In this review, conventional screening tools are also interchangeably referred to as conventional risk calculators. At present, there are more than 100 conventional cardiovascular risk calculators available (50). The primary aim of cardiovascular risk calculators is to identify the patients who are at elevated risk of atherosclerotic CVD. Once the risk profile of patients is known to the physician, further CVD management treatment can be initiated: (i) to reduce the risk and its complications and (ii) to improve the quality of life and the life expectancy (51). The various conventional screening tools for the assessment of CVD are: the Framingham Risk Score (16), Atherosclerotic Cardiovascular Disease (ASCVD) (19), Systematic Coronary Risk Evaluation (SCORE) risk chart (22), QRISK3 (52), the United Kingdom Prospective Diabetes Studies: UKPDS56 (17) and UKPDS60 (18), Reynolds Risk Score (RRS) (20,53), NIPPON risk chart (21), World Health Organization (WHO) risk chart (54), and Prospective Cardiovascular Münster (PROCAM) (55). All of these screening tools are built using statistical regression-based models that consider patients’ demographics and the blood biomarkers as input covariates. However, the risk factors associated with each risk calculator is different. A summary of the main risk calculators, their descriptions, and associated risk factors are presented in Table 1.
| CV Risk Calculator | Description | Associated Risk Factors |
|---|---|---|
| ASCVD (19) | ACC/AHA | Ethnicity, age, sex, SBP, DBP, TC, HDL, LDL, DM, smoking |
| QRISK3 (52) | Cardiovascular disease risk algorithm. Based on QRISK3 algorithms | Ethnicity, age, sex, BMI, smoking, DM, SBP, BP med, TC/HDL, FH, CKD, AAM, Migraine, RA, SLE, SMI, ED, steroids, AF |
| NIPPON (21) | Based on the NIPPON DATA80 | Age, sex, BMI, smoking, SBP, TC, GT |
| RRS (20) | Reynolds Risk Score | Age, smoking, DM, HDL, TC, FH, hsCRP |
| UKPDS60 (18) | The United Kingdom Prospective Diabetes Study | Age, sex, smoking, TC/HDL, AF, Carotid phenotype |
| FRS (16) | Framingham Risk Score | Age, sex, smoking, DM, SBP, DBP, BP med, LDL, HDL, TC |
| SCORE (22) | Systematic Coronary Risk Evaluation | Age, sex, smoking, TC |
| UKPDS56 (17) | UK Prospective Diabetes Study | Ethnicity, age, sex, smoking, DM, AF |
| PROCAM (55) | Prospective Cardiovascular Münster | Age, smoking, DM, SBP, TG, CKD |
| WHO (54) | World Health Organization | Age, sex, smoking, DM, SBP, HDL, TC |
| AECRS1.010yr (13) | AtheroEdgeTM Composite Risk Score | Ethnicity, age, sex, smoking, DM, SBP, HDL, TC, Artery type, Carotid phenotype |
The conventional screening tools are easy to use and help in the assessment of cardiovascular risk in individuals (56). The risk estimates provided by all such well-established risk calculators are dependent of ethnicity. Each of the conventional cardiovascular risk calculators was designed for a specific ethnic group. This may be the reason for the moderate performance of such risk calculators, when tested on completely different ethnicities (27,50,57). Some recent studies have also reported an underestimation or overestimation of CVD risk, when such risk calculators were tested on diverse ethnic groups (27,50,57,58). A recent study by Read et al. (59), compared the performance of five different types of conventional screening tools, against QRISK2 (60), using the Scottish population, suffering from type 2 DM. Authors reported that none of the risk calculators have provided an accurate estimation of CVD risk in patients, which were newly diagnosed type 2 DM. Herath et al. (61) evaluated the performance of two risk calculators: UKPDS and WHO’s risk chart, in people from Asian ethnicities. Authors reported a significant discrepancy in the CVD risk assessment results, provided by these conventional screening tools. Garg et al. (62) compared the different risk calculators in Asian Indians, and found that FRS classified high-risk cardiovascular patients better than other risk calculators. The authors estimated that QRISK2 was the most efficient in determining statin eligibility in Asian Indians. Bansal et al. (63) analyzed and showed that FRS and JBS calculators were more suitable for Asian Indians, unlike ASCVD and WHO.
In a follow-up study, it was confirmed that lifestyle change reduced CVD risk score in the FRS calculator, but not in ASCVD calculator (64). Recently, the Machine Learning (ML)-based risk assessment system, with a SVM classifier developed by Kakadiaris et al., performed better than the ASCVD risk calculator, using the MESA cohort (65). This can be seen in Figure 3, showing the comparison of AUC using ML-based (0.94) versus ASCVD (0.72) risk calculators. However, the ASCVD calculator performed better than FRS in identifying the vascular changes in a comparative study on blacks versus Whites in the United States (66).
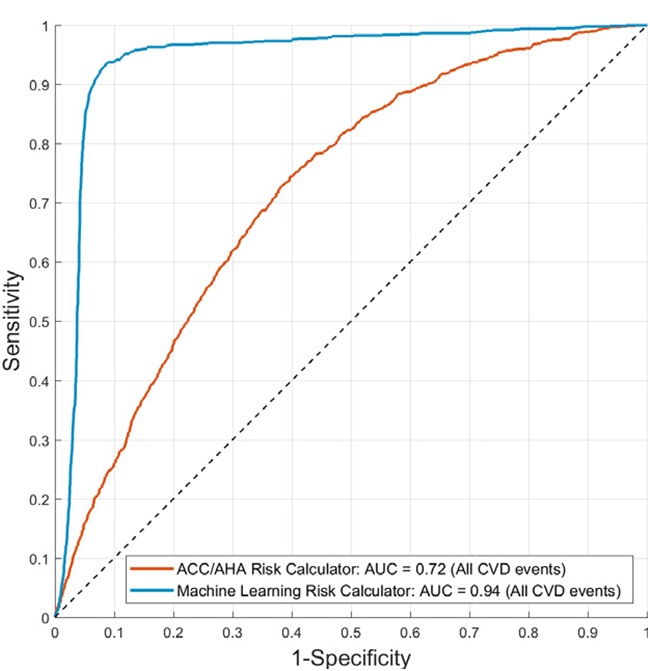 Figure 3
Risk Stratification of patients using ASCVD calculator (red curve) and machine learning-based algorithm (blue curve) (Used with permission from Kakadiaris et al. (65)).
Another reason for varying performance of all such conventional screening tools may reside into the types of covariates used for the modeling of these risk calculators. All the conventional screening tools used conventional cardiovascular risk factors, which do not reflect the morphological variations in the atherosclerotic plaque components in the blood vessels (12,13,15,31,67,68). The use of imaging modality can capture the morphological variations in the atherosclerotic plaque components, and can provide clear visualization of the blood vessels in patients. Thus, it is of utmost importance to also look for the image-based screening tools that can help in the more accurate CVD risk assessment of patients.
Advancements in both invasive and non-invasive imaging modalities have shown the potential to accurately capture the morphological variations in the atherosclerotic plaque components (29,31,32). Screening of the carotid atherosclerosis using ultrasound is cost-effective and reliable (15). Compared to other non-invasive counterparts, Carotid Ultrasound (CUS) can provide a clear visualization of the atherosclerotic plaque, even in low-resolution images at an affordable cost (15). This was the primary reason for restricting the scope of our review to the carotid ultrasonography. It should be noted that the carotid arteries are the dominant pathways of oxygenated blood to the brain. Blockage in these arteries due to atherosclerotic plaque may lead to severe catastrophic events; such as stroke. Patients suffering from DM showed higher progression of carotid atherosclerosis, and an elevated risk of CVD/stroke events, when compared to non-diabetic patients (5). The severity of carotid atherosclerotic plaque can be investigated using the two well-known image-based screening tools: (i) carotid intima-media thickness and (ii) the carotid plaque burden (15). These two phenotypes are generally considered as the surrogate markers of the CAD that is prevalently found in patients suffering from DM. Furthermore, image-based phenotypes are closely associated with CVD/stroke events (69-81). The cIMT and the carotid plaque area are associated with a 10-15% increase in the risk of myocardial infarction (82,83). Nambi et al. (84) reported an improvement in the risk prediction of coronary heart disease, when the cIMT and carotid plaque were used as screening metrics. Stein et al. (77) recommended the use of cIMT for the screening of CHD (85). Polak et al. reported an improvement of 7.6% (P<0.0001) in the screening of CVD risk in patients using the cIMT of internal carotid artery. Lee et al. (86) presented a study that reported an association between type 2 DM and the ischemic stroke events. Furthermore, in a case where primary endpoints such as cardiovascular or cerebrovascular events are costly and require the longitudinal follow-up, cIMT can be used as an event-equivalence gold standard (87-89).
Looking at the broader usage of the CUSIP, ACC/AHA guidelines published in 2010, recommended the use of cIMT for CVD risk assessment (56). Furthermore, European Society of Hypertension (90) and National Cholesterol Education Program-Adults Treatment Panel (NCEP-ATP) III (91) also recommended the use of cIMT for the CVD/stroke screening. However, in 2012, Ruijter et al. (79) presented a study that did not recommend the use of cIMT for CVD/stroke risk screening. Another study presented by the same authors also made the similar recommendations which did not support the use of cIMT for routine screening of CVD in DM patients (80). These studies ignited the debate on the use of carotid ultrasound image phenotypes for the CVD/stroke risk assessment. This further resulted in modifying the ACC/AHA guidelines, which did not agree with their earlier statement (56). As a result, they did not recommend the use of cIMT for the routine CVD risk screening (19). The primary issue with the studies presented by Ruijter et al. (79,80) was the measurement of cIMT within the 10 mm plaque free-region of the common carotid artery. Further, the authors did not measure the plaque in the carotid bulb and the internal carotid artery (92). In general, atherosclerotic plaques are uncommon in CCA segment and are more aggressive in the carotid bifurcation i.e., at origins of the internal and external carotid arteries. This may be one of the reasons why a little improvement was observed in CVD risk when cIMT was added along with FRS (79,80).
Although, both cIMT and CP are commonly considered for the preventive screening of the carotid atherosclerosis, their accurate link with CVD is dependent on how the measurement method was conducted. At present, the measurement of these CUS image-based phenotypes (CUSIP) can be followed using three types of methods: (i) manual, (ii) semi-automated, and (iii) automated measurement.
Manual measurement of cIMT involves the delineation of lumen-intima (LI) and media-adventitia (MA) boundaries (interfaces), by the physician, using a limited number of manually placed sample points. Although manual measurements are universally available and inexpensive, they are prone to the inter- and intra-operator variability and may not generate the reproducible results at different time instants for the same patients (80,87).
Semi-automated measurement techniques involve the use of edge delineation software packages that define the limit of cIMT in a pre-specified carotid segment selected by the operator (87,93). Such software packages facilitate the cIMT measurement at different carotid segments, with sufficiently large number of measurement points (80,87,93,94).
Recently, automated measurements have also been used to measure the cIMT and carotid plaque area (95-100). Such techniques automatically delineate the LI and MA borders. There is no need to manually place the region-of-interest. The tracing of carotid plaque is also possible using such automated packages throughout the length of ultrasound scan (95-100). The number of points (or vertices) are interpolated into a set of fixed number, equi-distanced points (typically normalized to 100), and B-spline fitted to smooth the boundaries. These interfaces (or boundaries) are then used to compute the bidirectional distance between the two boundaries (95-100) using polyline distance algorithm that provides the mean cIMT value and is considered as the final cIMT value for the carotid artery segment (87,93).
Current manual and semi-automated techniques restrict the cIMT measurement within a 10 mm plaque free region of the common carotid artery (69-81). However, it should be noted that the morphological variations in the LI and MA interfaces can extend outside the 10 mm region of the common carotid artery. Thus, there is a possibility to miss the elevation of the atherosclerotic plaque near the bulb region that may not capture from the plaque, in the CUS image, by the semi-automated software. In such cases the measurement of LI and MA throughout the length of ultrasound scan, so-called a full-length measurement, may prove to be beneficial (95-100). A recent group by Suri et al. has proposed several such full-length automated measurements of CUSIP (41,95-102). Furthermore, in order to assess the 10-year risk of patients, the similar group has also proposed the automated measurement of 10-year CUSIP that combines the effect of conventional risk factors and the baseline automated CUSIP (13,67). This integrated approach has been discussed in detailed in next section of this review.
In a study of 496 patients, Ikeda et al. (103,104) reported a significant association between cIMT and ABI and showed the usefulness of this association in predicting the CAD. Further, the authors also evaluated the correlation between automated full-length cIMT and the SYNTAX score. They finally concluded that both automated CUSIP such as CIMTave and cIMTV were significantly correlated with the SYNTAX score. Figure 4 (a) shows the significant correlation between SYNTAX score and average cIMT (r=0.225, P=0.00001) and Figure 4 (b) indicates the significant correlation between SYNTAX score and cIMTV (r=0.230, P=0.00001). Authors also reported the strong association between automated full-length phenotypes and ABI. Ikeda et al. (105) used computerized methods for bulb edge detection and estimated IMT in the 10 mm segment near the bulb. A similar team had developed a fully automated system for IMT detection and achieved a precision of 92.67% (105). The same team has observed an improvement in the correlation of auto-IMT and SYNTAX score when compared with the sonographer IMT (Sono-IMT) (r=0.4675 vs. 0.323, p<0.0001) (Figure 5) (104). AtheroEdgeTM offers an automated tool for assessment of image-based phenotypes (IMTV, IMTavg, IMTmax, IMTmin and mTPA) that can be used for risk assessment (106). Table 2 shows the studies that validated the automated CUSIP for screening of the CVD risk.
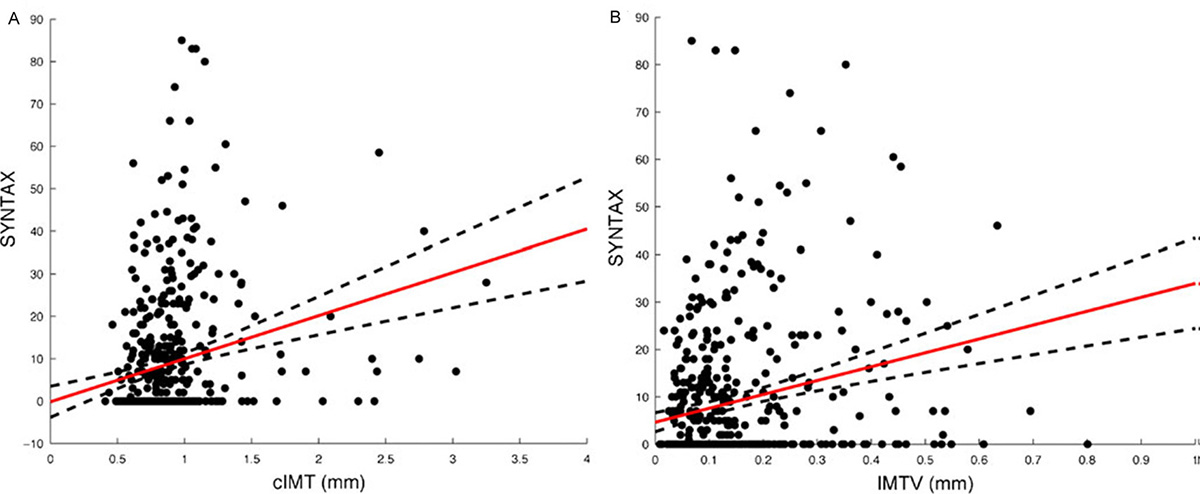 Figure 4
A. Correlation of cIMT with SYNTAX score (r=0.225, P=0.00001); B. Correlation of IMTV with SYNTAX score (r=0.230, P=0.00001) (Used with permission from Ikeda et al. (106)).
 Figure 5
A. Correlation of Auto-IMT with SYNTAX score. B. Correlation of Sono-IMT with SYNTAX score. (Used with Permission from Ikeda et al.(104)).
| Cohort size (ethnicity)/ |
Mean Age | Image Phenotypes | Study variables | Study Outcome | Reference |
|---|---|---|---|---|---|
| N=202 |
69 | IMTavg IMTmax |
Ranking based on SI, LR, OR, AUC, clustering, kappa-coefficients | Developed AECRS1.010yr and compared with CCVRFs | 12 |
| N=204 |
69 | cIMT, TPA, |
CC, RS | gTPA fast method and carotid risk biomarker | 41 |
| N=204 |
69 | IMTavg10yr |
Mean CC | Carotid image-based phenotypes used with CCRF for risk prediction | 67 |
| N=500 |
69 | IMTV, cIMT | ABI, |
IMTV correlated with ABI while IMT did not. IMTV is associated with CAD | 106 |
| N=142 |
59 | IMTV, cIMT | CC, |
IMTV(Reader) 11% higher in symptomatic. |
171 |
| N=40 | 68 | IMTV | ROC | IMTV is associated with CV (P=0.018) | 102 |
| N=88 |
72.8 |
cIMT, TPV |
PCC | cIMT and TPV is associated with age (p<0.001) and FRS (p<0.05). Only TPV is associated with diabetes (p<0.01) and plaque ulcerations (p<0.01) | 172 |
| N=5640 | 58±10 years | cIMT | Multivariable Cox proportional hazards model | ICA-IMT better compared to CCA-IMT in CV risk assessment | 77 |
| N=3580 | 65 | cIMT | C-statistic | cIMT improved the net reclassification in women. It was 8.2% (p<0.03) for hard CHD and 8.0% (p<0.06) for stroke. | 111 |
| N=1356 |
<70 (n=744) |
mTPA, |
Multiple linear regression models | plaque presence (55%) is associated with mean TPA (20·3 ± 20·8 mm2) and GSM (90 ± 29). | 157 |
Independent use of either conventional cardiovascular risk factors or the carotid ultrasound image-based phenotypes does not provide the accurate CVD risk assessment of patients. In order to provide the accurate and complete risk assessment of patients suffering from DM, it is important to combine the effect of both of conventional cardiovascular risk factors and image-based phenotypes. Very recent studies of Japanese diabetic cohorts (13,15,67,68,107) have shown a higher predictive power of integrated risk factors when compared against independent conventional cardiovascular risk factor or the image-based phenotypes. It should be noted that, both the cIMT and CP exhibits an annual variation due to the change in conventional cardiovascular risk factors (12-15,67,68). Khanna et al. (67) developed a non-linear 10-year CUSIP prediction model that incorporates the effect of conventional cardiovascular risk factors on the annual progression rates of cIMT and CP. Furthermore, Khanna et al. (13) had developed a low-cost preventive screening tool called AtheroEdge™ composite Risk Score (AECRS1.0) that provides the 10-year integrated CVD risk of patients (13). This proposed 10-year integrated screening tool when compared against the conventional screening tools reported the higher predictive power of CVD risk in patients suffering from DM (12, 13). Figure 6 shows the receiver operating plot for the comparison of AECRS1.0 against 10 conventional screening tools. It should be noted that integrated model AECRS1.0 reported an AUC of 0.927 (P<0.001) which was highest amongst all the risk calculators used for CVD risk assessment.
 Figure 6
Comparison of ROC of various cardiovascular risk calculators. AECRS1.010yr shows the highest AUC (Used with permission from Khanna et al. (12)).
Figure 7 shows the screening of atherosclerotic patients suffering from DM using AECRS1.0 risk calculator. AECRS1.0 used the CUSIP consisting of five phenotypes: IMTavg, IMTmax, IMTmin, IMTV and TPA for risk stratification. AECRS1.010yr used the CUSIP such as IMTave10yr, IMTmax10yr, IMTmin10yr, IMTV10yr and TPA10yr corresponding to 10-year CVD risk prediction. Here, the suffix “10yr” indicates the 10-year prediction of the CUSIP. Figure 7 shows a sample of three patients classified based on the composite risk score (blood biomarker and image-based phenotypes), using the AECRS1.0. It was observed that the low-risk patient (Row 1) had smaller IMTavg (0.65 mm) and high-risk patient (Row 3) have comparatively higher IMTavg (1.55 mm). Our study hypothesizes that high-risk and moderate-risk patients can benefit from preventive screening before clinical manifestations.
 Figure 7
Risk stratification based on AECRScurrent and AECRS10yr. Row 1: Patient 798 (low risk): (A) Original Image (B) Image processed using AtheroEdge・2.0; CUS: IMTavg=0.65 mm, IMTmax=0.71 mm, IMTmin=0.57 mm, IMTV=0.04 mm, TPA=11.95 mm2, AECRS1.0curr=14%; IMTave10yr=0.74 mm, IMTmax10yr=0.80 mm, IMTmin10yr=0.66 mm, IMTV10yr=0.06 mm, TPA10yr=13.11 mm2, and AECRS1.010yr=17%; HbA1C=5.9%. Refer Appendix B for more samples.Row 2: Patient 1726L (low-moderate risk): (A) Original Image (B) Image processed using AtheroEdge・2.0; CUS: IMTave=1.15 mm, IMTmax=2.23 mm, IMTmin=0.48 mm, IMTV=0.62 mm, TPA=39.02 mm2, AECRS1.0curr=50%; CUS10year: IMTave10yr=1.29 mm, IMTmax10yr=2.37 mm, IMTmin10yr=0.62 mm, IMTV10yr=0.76 mm, TPA10yr=40.7 mm2, and AECRS1.010yr=57%; HbA1C=8.3%. Row 3: Patient 11L (low-of-high risk): (A) Original image (B) Image processed using AtheroEdge・2.0; CUS: IMTavg=1.55 mm, IMTmax=2.39 mm, IMTmin=1.08 mm, IMTV=0.38 mm, TPA=51.69 mm2, AECRS1.0curr=65%; CUS10year: IMTave10yr=1.69 mm, IMTmax10yr=2.53 mm, IMTmin10yr=1.22 mm, IMTV10yr=0.41 mm, TPA10yr=54.23 mm2, and AECRS1.010yr=69%; HbA1C=7.9%. (Courtesy AtheroPoint, Roseville, USA)
Patients with DM exhibit the elevated risk profile at baseline. Thus, if such patients are left untreated, they may suffer from severe events such stroke or myocardial infarction. The primary aim of this review was to investigate the various screening tools for assessing the CVD risk of patients suffering from DM. Furthermore, this review shadows the role of innovative tools and techniques for preventive screening (Figure 8). Not only are they radiation-free, ergonomic, but equally low in cost among all the medical imaging modalities. Diabetes accelerates the atherosclerosis process. Using the screening tools that are dependent only on the blood biomarkers is not very accurate for CVD risk assessment of patients with diabetes. Thus, in this study, we also discussed the predictive ability of the screening tools that combined the effect of both conventional risk factors and the carotid ultrasound image-based phenotypes. Because the morphology of the plaque is taken into account, it provides a more accurate and powerful analysis towards a better risk assessment. In summary, novelties presented by this review are: (i) link between diabetes mellitus and atherosclerosis, (ii) role of various conventional screening tools in the CVD risk assessment, (iii) importance of image-based screening tools, (iii) role of integrated screening tools formed by combining the effect of both the conventional and image-based risk factors, (iv) comparative study of integrated risk calculators against conventional calculators, (v) understanding the role of automated phenotype measurements by avoiding inter- and intra- operator variability, and (vi) role of introducing the full-length concept of the phenotype measurement which combines the plaque burden with carotid intima-media thickness. From the rigorous literature search, if the patients are screened using non-invasive methods, complications due to DM can be minimized, the mortality rate can be reduced, and quality of life can be improved. It can be shown that 23.8 years in life and $42, 316.4 could be saved annually as a result of screening and follow-up. (Calculations are given in Section 8.3) This can be easily be achieved by a modest cost spent on screening for atherosclerosis on diabetes patients, though future prospective studies would be needed to prove this point.
 Figure 8
The graphical representation of the proposed review which shows the role of integrated screening approach for cardiovascular risk assessment of patients suffering with diabetes mellitus.
A recent clinical trial has used the two image-based screening tools such as coronary computed tomography angiography, and MRI for detection of unrecognized myocardial scar in subclinical coronary atherosclerosis and this indicated severe stenosis in patients suffering from type 2 DM (108). Out of the 348 subjects enrolled, 322 were classified as patients without occult myocardial scar and patients with at least one occult myocardial scar using MRI. The mean (SD) age of the study population was 60.18 years (6.48). This is summarized in Table 3. This clinical trial shows that at least 61 (20.4%) patients had significant stenosis with 6 (2.0%) having 100% occlusion in patients without an occult myocardial scar. In patients with at least one occult myocardial scar, 12 (52.2%) patients had significant stenosis and 1 (4.3%) had 100% occlusion.
| Degree of stenosis | Patients without occult myocardial scar | Patients with at least one occult myocardial scar |
|---|---|---|
| No stenosis: 0% | 80 (26%) | 2 (8.7%) |
| Non-significant stenosis: 1-50% | 152 (50.8%) | 8 (34.8%) |
| Significant stenosis >50% and ≤99% | 61 (20.4%) | 12 (52.2%) |
| Occlusion: 100% | 6 (2.0%) | 1 (4.3%) |
Lacroix et al. (109) argued that due to the prevalence of atherosclerosis in diabetes, there was a high chance of >60% stenosis, especially in men with CKD or those having an ABI<0.85. Thus, screening and 10-year risk assessment would help both in the prevention of CVDs and for better disease management. It was observed during a follow-up study by Kao et al. (110), that the association with atherosclerosis was more pronounced (0.80 vs 0.64 mm, p <0.01) in patients who had CVE. Another study by Elias-smale et al. (111) analyzed that the addition of cIMT information to the FRS improved the reclassification of risk. Screening in this study helped in better risk classification. Further Polak et al. (77) discussed that ICA-IMT improved the risk stratification in the Framingham Offspring Study. These further assert that screening information along with traditional risk scores would help in better identifying intermediate and high-risk patients. Table 4 summarizes the clinical trials studied in this review.
| SN | Study Type | IMTavg | Cohort Size (Ethnicity) | Diabetes/ CVD/ CAD | Risk Class | Reference |
|---|---|---|---|---|---|---|
| 1 | cIMT-CVD | > 0.8 |
Total: 392 |
17- diabetic |
HR:65 |
110 |
| 2 | cIMT- FRS | > 1.26 | Total: 3580 |
CHD/Stroke | HR: 530 |
111 |
| 3 | cIMT-CVD | cIMT manual |
Total: 5640 |
2007-hypertension |
HR: |
77 |
Thus, the use of preventive screening in assessing atherosclerosis was emphasized as this could save both life and money at a modest cost for screening. Draman et al. (112) reported the case of a 62-year old man with diabetes who came for an annual clinical review. Screening for regular risk factors did not reveal stenosis and CAD. The patient’s ECG (113) revealed ST-elevation myocardial infarction (STEMI) and coronary angiogram showed stenosis and coronary artery disease. Treatment at the right time saved his life but the patient subsequently passed away in one-year. Reason of death was not specified but the presence of severe stenosis cannot be ruled out. Two more similar case reports are summarized in Table 5. Diabetes patients have a higher chance of stenosis development and this may lead to MI, stroke, other cardiac events and sometimes sudden death (114). Duration of diabetes also increases the chance of cardiovascular events (115). Screening and risk assessment are crucial especially in the presence of diabetes and traditional risk factors.
| Demographics | Further Complications | Medical status | Outcome | Reference |
|---|---|---|---|---|
| 62-year, man, |
nephropathy, retinopathy, neuropathy | Poor heart rate in AFT, diffuse CAD, 100% stenosis of the left anterior descending artery | Died 1-year after discharge | 112 |
| 67-year, women, hypertension | Stage-4 CKD, atrial fibrillation, hyperkalemia | Large thrombus in proximal left circumflex artery revealed by cardiac catheterization | Discharged home when serum potassium and renal function normalized | 173 |
| 71-year, women, smoker, hypertension, hyperlipidemia | End-stage renal disease (ESRD), peripheral artery disease (PAD) | 99% stenosis of the mid-left anterior |
The patient died of catheter-associated sepsis after 2 months | 174 |
The assessment of CVD risk is vital in identifying the intensity of risk prevention. Ultrasound screening is essential in assessing the plaque burden. The morphology, geometry, and stability of plaques are significant in cardiovascular risk assessment (115). The geometry assessments involve measurement of image-based lumen diameter (LD) (116-118), IMT (96,119-122) and inter-adventitial diameter (IAD) (116-118,123). Saba et al. observed that the IAD was strongly associated with plaque score (a measure of plaque burden) than LD (123). Recently, it was analyzed that cloud-based (AtheroCloudTM) automated LD measurement was accurate and had better inter- as well as intra- operator reproducibility (124). Figure 6 (a) shows the ROC and area under the curve (AUC) of both AtheroCloudTM and sonographer (manual) IMT markings. The AUC of the cloud-based system was higher compared to the sonographer markings (0.99 vs 0.81) and had better accuracy when compared with the ground truth (sonographer readings) (124). This has been represented by the ROC curve shown in Figure 9 (175).
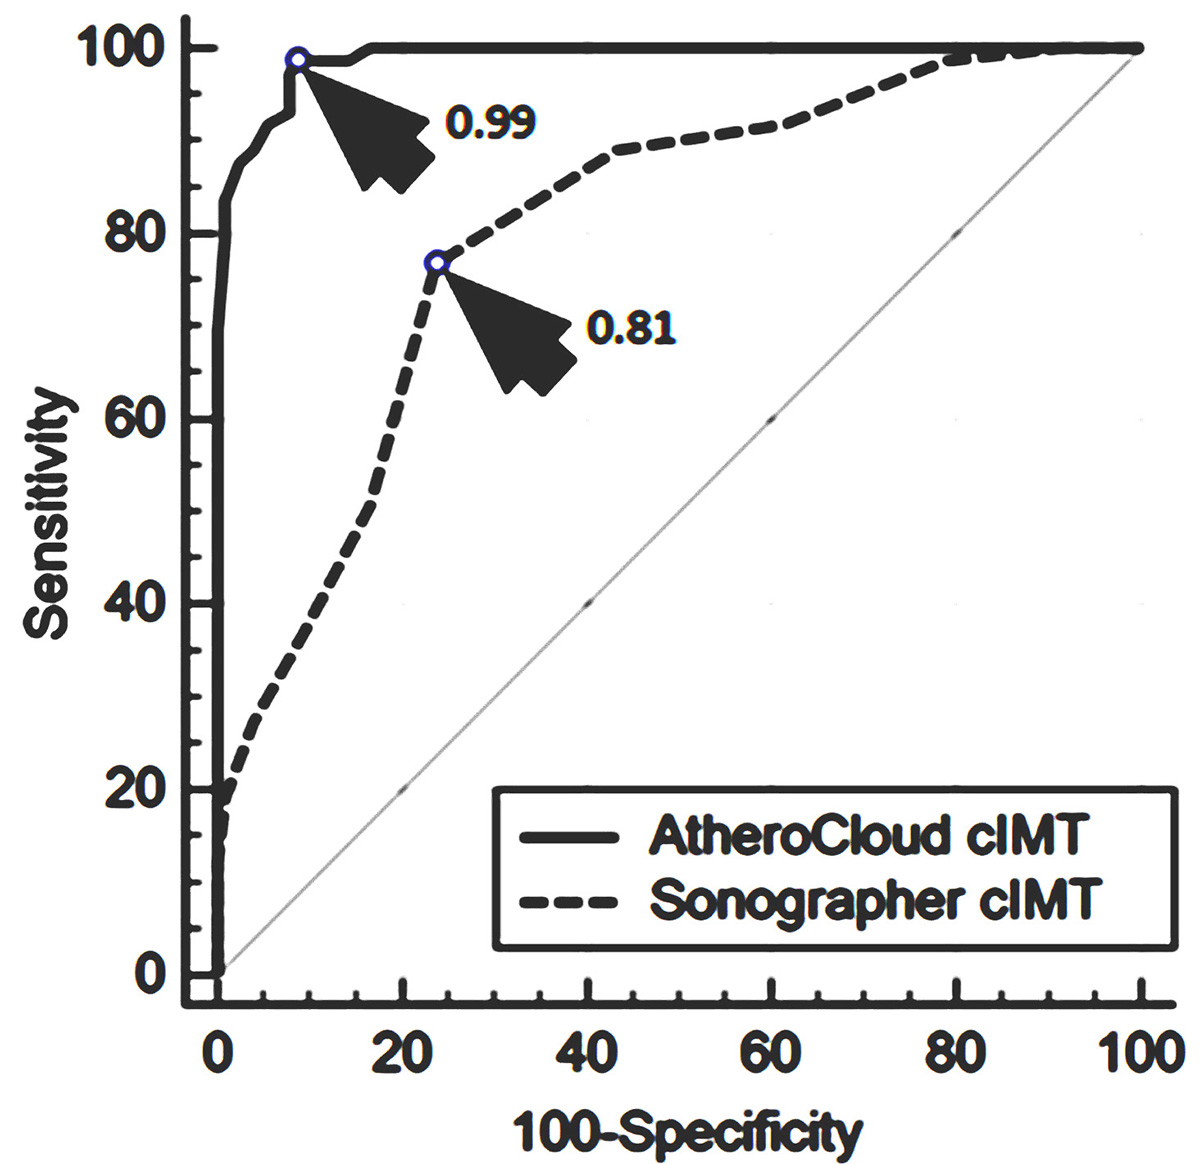 Figure 9
ROC and AUC for AtheroCloudTM and sonographer IMT markings. (Used with permission from Saba et al. (175)).
Other than blood biomarkers, image-based phenotypes, plaque echolucency, the severity of stenosis, and texture-based features are frequently used for cardiovascular risk stratification. The association of cIMT with cardiovascular risk was noted earlier and it was observed that an increase of 0.1 mm in cIMT was associated with a 25% increase in cardiovascular risk (125). Further, changes in the plaque composition lead to the formation of plaque that is vulnerable ad prone to rupture (126,127). The plaque echolucency also changes as a result of the change in composition. Moreover, it is noted that cardiovascular risk is higher in subjects with increased plaque echolucency (128).
Research studies have confirmed that diabetes patients have more echogenic and calcified plaques compared to non-diabetes subjects (129). Another study group illustrated those patients with hypoechoic plaque and stenosis >50% have a higher chance of stroke (130). Further, Pedro et al. (131) used plaque echo-morphological features such as plaque ulceration, echolucency and echo-heterogeneity obtained from B-mode ultrasound along with stenosis severity for assessing neurological risk. The study observed 77% accuracy in predicting symptomatic plaques (131). Araki et al. used plaque morphology evaluated by machine learning algorithms for risk stratification and the team achieved a classification accuracy of 98.43% (132-135).
Plaque characterization is vital in risk stratification and prediction of CVE (136). Plaque characterization involves classification of symptomatic and asymptomatic plaque. Texture-based features are frequently used for such classifications (137-139). A research study observed that the heterogeneous plaques were symptomatic when compared with homogeneous plaques. They analyzed that the heterogeneous plaques were linked to lipids and intra-plaque hemorrhages (115). Furthermore, several manual and semi-automated algorithms are available for plaque characterization (117,140,141). Suri et al. (142) developed AtheromaticTM system, similar to Symptosis™ (143), a computer-aided diagnosis system, for highly accurate plaque characterization and the team observed 83.7% accurate results (144-146). It used DWT, radon transform and higher-order spectra along with the textural features. Authors observed an accuracy improvement to 90.66% when the degree of stenosis was also used for the classification (147). The similar group further used texture-based features and traces transform and obtained an accuracy of 93.1% (147). Further learning-based methods (a class of AtheroEdgeTM system) have shown success in plaque characterization and achieved better performance compared to conventional methods (148,149). Recently, another study demonstrated an 18% improvement in risk stratification using integrated machine learning (ML) approach over the conventional ML method. The integrated ML approach used 34 image-based phenotypes and 13 conventional risk factors for the risk stratification (68).
In 2017, the global healthcare expenditure on the patients suffering from diabetes was $850 billion (8). In India, an average expense-per-year for a patient suffering from DM is $119.4 (7), which is ~10% of the average per capita income (176). There are 72 million (7,29,46,400) people affected by diabetes in India and ~1 million people (9,97,803) died in 2017 due to DM (7). Around 51% (4,22,10,300) (7) patients with diabetes are undiagnosed and hence does not get proper treatment. Only ~30 million (total 72 million – undiagnosed 42 million) undergo treatment for DM (7). The average annual per capita income in India is ~$1778 (176) and an annual burden of diabetes ambulatory care per person is $207.25(177). Thus, a total annual burden for 72 million people affected by diabetes is $15,118.66 (~$207.25 x 72 million). The complications due to CVD add further cost burden. The overall indirect cost per person in diabetes is $182.22 (178) and thus, a total indirect cost for all the patients with diabetes in India is 13.1 billion ($182.22 x 72 million). Mean age of onset of diabetes is 45.4 (±10.9) (179) and ~50% diabetics die at age <60 years (7). This is far less than life expectancy in India (180). The economics of diabetes is summarized in Table 6. The cost involved in diabetes treatment from various studies is shown Table 7. Recenlty, Kang et al. (181) presented a study that showed the total life-years lost due to DM and other CVD complications. The total life-years lost by the Asian population are: (i) 6.10 years due to diabetes alone, (ii) 16.68 years due to diabetes and stroke, (iii) 21.10 years due to diabetes and myocardial infarction (MI), and (iv) 23.80 years due to diabetes, stroke and MI. If the patients are screened using non-invasive methods, complications due to DM can be minimized, mortality rate can be reduced, and quality of life can be improved. If 23.8 years in life are saved as a result of screening and follow-up, then $42, 316.4 ($1778 x 23.8) can be saved for the family and the total saving for 72 million diabetes patients will be ~$3046 billion ($42, 316.4 x 72 million). This might be easily achieved by a modest cost spent on screening for atherosclerosis. Screening using non-invasive methods such as CUS imaging can be used to prevent any undiagnosed casualties such as silent CVD or stroke events which are common in patients with diabetes. Kotabagi et al. (182) reported five cases of MI related post-mortem study in which survival time after the appearance of first symptom was just 2 hours to 5.5 hours. In another study, 219 patients out of 728 in the study group died in the first five year of the onset of symptoms and 81.9% of deaths were due to ischemic heart disease (183). Screening for atherosclerosis and allied complications followed by appropriate therapies and lifestyle changes may improve the quality of life. Mostly, the rural health is affected due to unavailability of expert medical care and the heavy financial burden caused by the complications. Improvement through awareness programs and expert consultations in rural areas through telemedicine can reduce the financial burden (184). Furthermore, at a modest cost of screening for atherosclerosis, improvement in quality of life and better management of complications can be achieved (185). However, all these screening paradigms need to be tested and proved in prospective randomized trials prior to widespread implementation.
| SN | Particulars | Estimates |
|---|---|---|
| 1. | Average expenses per DM patient per year (7) | $119.4 |
| 2. | No. of people in India who have DM in 2017 (7) | 72 million |
| 3. | No. of people died due to DM in India in 2017 (7) | ~1 million |
| 4. | No. of patients who undergo treatment for DM in India each year | ~30 million |
| 5. | No. of people who do not take treatment for DM (undiagnosed) (7) | ~42 million |
| 6. | Cost of diabetes ambulatory care per person annually (177) | $207.25 |
| 7. | Total annual burden for 72 million diabetics | $15 billion |
| 8. | Overall indirect cost per capita annually (178) | $182.22 |
| 9. | Total annual indirect cost for 72 million | $13.1 billion |
| 10. | Average annual per capita income (176) | $1778 |
| 11. | Mean age of onset of diabetes (years) (179) | 45.4 (±10.9) |
| 12. | Average life expectancy in India (180) | 67 years |
| 13. | The proportion of death due to DM in people with age <60 years (180) | 50.7% |
| 14. | Total years lost due to diabetes, stroke and MI (181) | 23.8 |
| 15. | Total money saved by a person by extending life as a result of screening | $42, 316.4 |
| 16. | Total savings for 72 million by extending life as a result of screening | $3046 billion |
| Study Outcome | Reference |
|---|---|
| Average cost for diabetic complications, |
186 |
| The total cost of care Rs. 14, 508 per person annually | 177 |
| The annual direct cost of routine care is |
187 |
| $310 was spent annually on diabetes care | 188 |
| Monthly direct expenditure is Rs. 687.5 per patient and indirect expenditure is Rs. 348.75 per patient | 189 |
Diabetes and atherosclerosis have serious complications. Studies have analyzed that diabetes has several manifestations such as oral (150), musculoskeletal (151), rheumatological (152-154) and cutaneous (169). Furthermore, nephropathy in diabetes was a manifestation of insulin resistance and genetic factors (155). Studies inferred that heart failure was another manifestation of diabetes (156). It was observed that the integrated 10-year risk computed using AECRS1.010yr and HbA1c are associated with the prevalence of cardiovascular risk. Various studies have indicated that the higher values of IMT (125), TPA (41,157) and HbA1c are linked with high-risk in CVD/stroke or CAD. Furthermore, plaque echolucency was associated with cardiovascular risk (128), and >50% stenosis (130) was associated with stroke risk. Researchers observe that HbA1c levels >6-8% (diabetic) and >5-6% (non-diabetic) are at a higher risk. We strongly believe that preventive screening would benefit intermediate and high-risk patients. Furthermore, it was observed that interventions to reduce the deviation of biomarkers and HbA1c would benefit high-risk patients. Certain medications for treating diabetes were observed to be effective in treatment of coronary atherosclerosis (49). Glucose lowering therapies using sodium-glucose linked transporter (SGLT-1) inhibitors have shown to lower CVD risk in diabetics (158). New medications such as empagliflozin and liraglutide reduce mortality in patients with diabetes and CVD (159,160). Additionally, it is observed that SGLT2 inhibitors such as empagliflozin and canagliflozin reduce hospitalization due to heart failure (161,162). Further, early interventions using lipid-lowering drugs such as statins and proprotein convertase subtilisin kexin type 9 (PCSK9) have been shown to reduce cardiovascular risk in secondary prevention and show promise for primary prevention as well (163,164). Treatments other than pharmacological drugs involve lifestyle changes and exercise (165). Increased physical activity, plant-based diet, completes quitting of tobacco and proper glycemic control results in an improved disease management. Risk factor management involves nutrition therapy, obesity management, blood glucose control, lipid control and blood pressure (BP) control. Pharmaceutical treatment involves aspirin therapy, glucose control medicines, BP and lipid-lowering medicines (166). Lifestyle remains a core means of reducing CV risk. Studies have observed that subjects who do regular exercise have good glycemic control (167). Further, HbA1c levels are controlled in subjects who do aerobic exercise (167). Moreover, the rapid decrease in sugar levels in subjects who do exercises was reported by García-García et al.(168). Fenkci et al. observed a decrease in insulin resistance in subjects doing aerobic exercise (169). Another study observed that yoga reduced the CVD risk, and this study was validated using the FRS and 10-year CVD risk score (170).
Atherosclerotic plaque deposition was more pronounced due to diabetes. Degree of vessel stenosis is not the only measure in risk assessment. Plaque morphology, plaque-type, its composition, location, TPA and TPV adds to the ‘vulnerability of plaque’. Imaging modalities added to traditional risk factors increase the scope of better risk assessment and better disease management. Thus, screening might prove to be essential in patients with diabetes to help physicians decide on proper interventions. The image-based phenotypes and 10-year integrated risk calculators yield more accurate risk predictions compared with conventional risk calculators and require further study in overall morbidity and mortality reduction.
Dr. Jasjit Suri is affiliated to AtheroPoint™, focused in the area of stroke and cardiovascular imaging. Dr. Deepak L. Bhatt discloses the following relationships - Advisory Board: Cardax, Cereno Scientific, Elsevier Practice Update Cardiology, Medscape Cardiology, PhaseBio, Regado Biosciences; Board of Directors: Boston VA Research Institute, Society of Cardiovascular Patient Care, TobeSoft; Chair: American Heart Association Quality Oversight Committee; Data Monitoring Committees: Baim Institute for Clinical Research (formerly Harvard Clinical Research Institute, for the PORTICO trial, funded by St. Jude Medical, now Abbott), Cleveland Clinic (including for the ExCEED trial, funded by Edwards), Duke Clinical Research Institute, Mayo Clinic, Mount Sinai School of Medicine (for the ENVISAGE trial, funded by Daiichi Sankyo), Population Health Research Institute; Honoraria: American College of Cardiology (Senior Associate Editor, Clinical Trials and News, ACC.org; Vice-Chair, ACC Accreditation Committee), Baim Institute for Clinical Research (formerly Harvard Clinical Research Institute; RE-DUAL PCI clinical trial steering committee funded by Boehringer Ingelheim; AEGIS-II executive committee funded by CSL Behring), Belvoir Publications (Editor in Chief, Harvard Heart Letter), Duke Clinical Research Institute (clinical trial steering committees), HMP Global (Editor in Chief, Journal of Invasive Cardiology), Journal of the American College of Cardiology (Guest Editor; Associate Editor), Medtelligence/ReachMD (CME steering committees), Population Health Research Institute (for the COMPASS operations committee, publications committee, steering committee, and USA national co-leader, funded by Bayer), Slack Publications (Chief Medical Editor, Cardiology Today’s Intervention), Society of Cardiovascular Patient Care (Secretary/Treasurer), WebMD (CME steering committees); Other: Clinical Cardiology (Deputy Editor), NCDR-ACTION Registry Steering Committee (Chair), VA CART Research and Publications Committee (Chair); Research Funding: Abbott, Amarin, Amgen, AstraZeneca, Bayer, Boehringer Ingelheim, Bristol-Myers Squibb, Chiesi, CSL Behring, Eisai, Ethicon, Ferring Pharmaceuticals, Forest Laboratories, Idorsia, Ironwood, Ischemix, Lilly, Medtronic, PhaseBio, Pfizer, Regeneron, Roche, Sanofi Aventis, Synaptic, The Medicines Company; Royalties: Elsevier (Editor, Cardiovascular Intervention: A Companion to Braunwald’s Heart Disease); Site Co-Investigator: Biotronik, Boston Scientific, St. Jude Medical (now Abbott), Svelte; Trustee: American College of Cardiology; Unfunded Research: FlowCo, Fractyl, Merck, Novo Nordisk, PLx Pharma, Takeda.
ABI
Ankle-Brachial Index
American College of Cardiology
American Diabetes Association
Advanced Glycation End Products
American Heart Association
Area Under Curve
Body Mass Index
Blood Pressure
Coronary Artery Disease
Cardiac Computed Tomography Angiography
Chronic Kidney Disease
Cardiovascular Disease
Conventional Cardiovascular Risk Factor
Discrete Wavelet Transform
Endothelial Nitric Oxide Synthase
Extracellular Signal-Regulated Kinase 5
Inter-Adventitial Diameter
Internal Carotid Artery
International Diabetes Federation
Myocardial Infarction
Pulse Wave Velocity
Smooth Muscle Cell
ST-Elevation Myocardial Infarction
Small Ubiquitin-Like Modifier
Type-2 Diabetes Mellitus
World Health Organization
Silent Myocardial Infraction
Cardiovascular events
Atherosclerotic Cardiovascular Disease
AtheroEdgeTM Composite Risk Score 1.0
Framingham Risk Score
Based on the NIPPON DATA80
Prospective Cardiovascular Münster
Reynolds Risk Score
Systematic Coronary Risk Evaluation
United Kingdom Prospective Diabetes Study
World Health Organization
Intima-Media Thickness
Carotid IMT
IMT Variability
Average IMT
Minimum IMT
Maximum IMT
Lumen Diameter
Total Plaque Area
Morphological-TPA
Geometrical-TPA