
- Academic Editor
Background: While both cystatin C and left ventricular
ejection fraction (LVEF) revealed established prognostic efficacy in coronary
artery disease (CAD), the relationship between cystatin C/left ventricular
ejection fraction ratio (CLR) and adverse clinical outcomes among patients with
CAD following percutaneous coronary intervention (PCI) remains obscure, to date.
Therefore, we sought to assess the predictive efficacy of CLR among CAD patients
who underwent PCI in current study. Methods: A total of 14,733
participants, including 8622 patients with acute coronary syndrome (ACS) and 6111
patients with stable coronary artery disease (SCAD), were enrolled from a
prospective cohort of 15,250 CAD patients who underwent PCI and were admitted to the First Affiliated Hospital of Xinjiang Medical University from
2016 to 2021. The primary outcome of this study was mortality, including
all-cause mortality (ACM) and cardiac mortality (CM). The secondary outcomes were
major adverse cardiovascular events (MACEs), major adverse cardiac and
cerebrovascular events (MACCEs) and nonfatal myocardial infarction (NFMI). For
CLR, the optimal cut-off value was determined by utilizing receiver operating
characteristic curve analysis (ROC). Subsequently, patients were assigned into
two groups: a high-CLR group (CLR
Coronary artery disease (CAD) is the leading cause of death and morbidity related to cardiovascular diseases worldwide [1]. In China, the incidence of CAD is increasing annually [2]. Although several predictors of CAD-related death have been reported [3, 4, 5, 6], more powerful predictors need to be developed.
Cystatin C (Cys-C) is produced by all nucleated cells regardless of age, sex, muscle mass or diet, making it one of the best indicators of renal function [7, 8]. Nevertheless, the characteristics of Cys-C as an inhibitor of cysteine proteases make it relevant to atherosclerosis and cardiovascular disease [9, 10]. It was reported recently that Cys-C increased the incidences and worse outcomes of acute coronary syndrome (ACS) [11], cardiac insufficiency [12] and acute kidney injury (AKI) [13]. Several studies have also indicated that Cyc-C contributes to cardiovascular risk and inflammation [14, 15]. Among patients with CAD, Cyc-C serves as an important biomarker of long-term mortality from all causes and cardiovascular disease [16].
It is well known that left ventricular ejection fraction (LVEF) is widely recognized as a measure of heart function. Patients with cardiovascular disease and heart failure with lower LVEF values have a higher mortality rate [17]. Patients with reduced LVEF and heart failure were significantly more likely to die and suffer myocardial infarction at 3 years than those with heart failure and mild to moderate LVEF [18].
In recent studies, either Cys-C or LVEF has been independently linked to cardiovascular disease (CVD) and mortality [9, 10]. In spite of this, there is no consensus on the usefulness of Cys-C/LVEF ratio (CLR) for predicting adverse outcomes in CAD patients. Since Cys-C and the LVEF enhances coronary artery disease progression and can evaluate coronary artery lesions’ severity [14, 15, 17], there is a reasonable possibility of predicting the performance of CLR in CAD patients. Hence, a prospective cohort study, which is consisted of 15,250 CAD patients who underwent PCI and long-term follow-ups were conducted, was designed to explore the relevance between CLR and adverse outcomes.
Patients enrolled in current study were all receiving Personalized Antiplatelet
Therapy based on the Genotype of CYP2C19 (PRACTICE) for CAD, a study conducted in
the First Affiliated Hospital of Xinjiang Medical University based on patients
with unabridged case records and follow-up registries from 2016 to 2021. A
clinical trial registration number has been assigned to the design (identifier:
NCT05174143) at http://Clinicaltrials.gov. Our study population included only
PRACTICE participants with inclusion criteria: (1) detailed clinical histories;
(2) explicit diagnosis of CAD, including non-ST-segment elevation acute coronary
syndrome (ACS), ST-segment elevation myocardial infarction (STEMI) and stable
angina, with stenosis
Initially, 15,250 CAD patients were evaluated to determine the relevance between CLR and PCI outcomes, in which 517 were excluded on account of the absence of echocardiography or Cys-C data. Ultimately, 14,733 were enrolled, including 8622 patients with ACS and 6111 patients with stable coronary artery disease (SCAD). The detailed inclusion and exclusion criteria were illustrated in Fig. 1 by a flowchart. Ethics Committee approval was granted for the study protocol from First Affiliated Hospital of Xinjiang Medical University, and informed consent was waived.
 Fig. 1.
Overview of the inclusion process. Abbreviations: CAD, coronary artery disease; ACM, all-cause mortality; CM, cardiac mortality; MACE, major adverse cardiovascular event; MACCE, major adverse cardiovascular and cerebrovascular event; NFMI, nonfatal myocardial infarction; Cys-C, cystatin C; CLR, cystatin C/left ventricular ejection fraction ratio.
Patients who underwent PCI at our center were regularly followed up after discharge for 1, 3, and 6 months, and then for 1, 3, and 5 years, and the median follow-up time was 24 (1–60) months in this study. Following up with patients was done by either outpatient interviews or telephone calls as required. All events were reviewed and checked by a group of experienced clinical physicians comprehensively during the follow-up period. To ensure that we obtained high-quality data, we trained the investigators before the start of the study. In order to ensure consistency, all questionnaires were completed blindly, and telephone follow-ups were conducted as per a uniform set of rules. An evaluation of medication adherence and adverse events was conducted at all clinical follow-ups. A primary outcome of this study was mortality including all-cause mortality (ACM) and cardiac mortality (CM), while strokes, nonfatal myocardial infarction, and bleeding events were considered as secondary outcomes. The major adverse cardiac events (MACEs) were defined as cardiac death and nonfatal myocardial infarction (NFMI), and major adverse cardiac cerebrovascular events (MACCEs) were defined as a combination of cardiac death, NFMI, and stroke.
Data on PCI procedures, demographics, clinical characteristics, cardiovascular
risk factors, echocardiography, laboratory testing, and short-/long-term outcomes
were all collected and recorded. Factors associated with cardiovascular disease
include smoking, alcohol consumption, diabetes, and hypertension. The diagnostic
criteria of diabetes mellitus consisted of a history of diabetes and regular
intake of antidiabetic drugs, or a fasting plasma glucose of
SPSS 22.0.1 for Windows (SPSS Inc., Armonk, NY, USA) was utilized for data
analyses. Continuous values are presented as the mean
To set multiple critical values for the continuous variable CLR, a series of
sensitivity and specificity values were calculated via ROC curve analysis. The
ordinate of the curve was sensitivity, while the abscissa of the curve was
1-specificity. In this study, the optimal cut-off point for the CLR was 0.019
(AUC = 0.817, 95% CI: 0.811–0.823, p
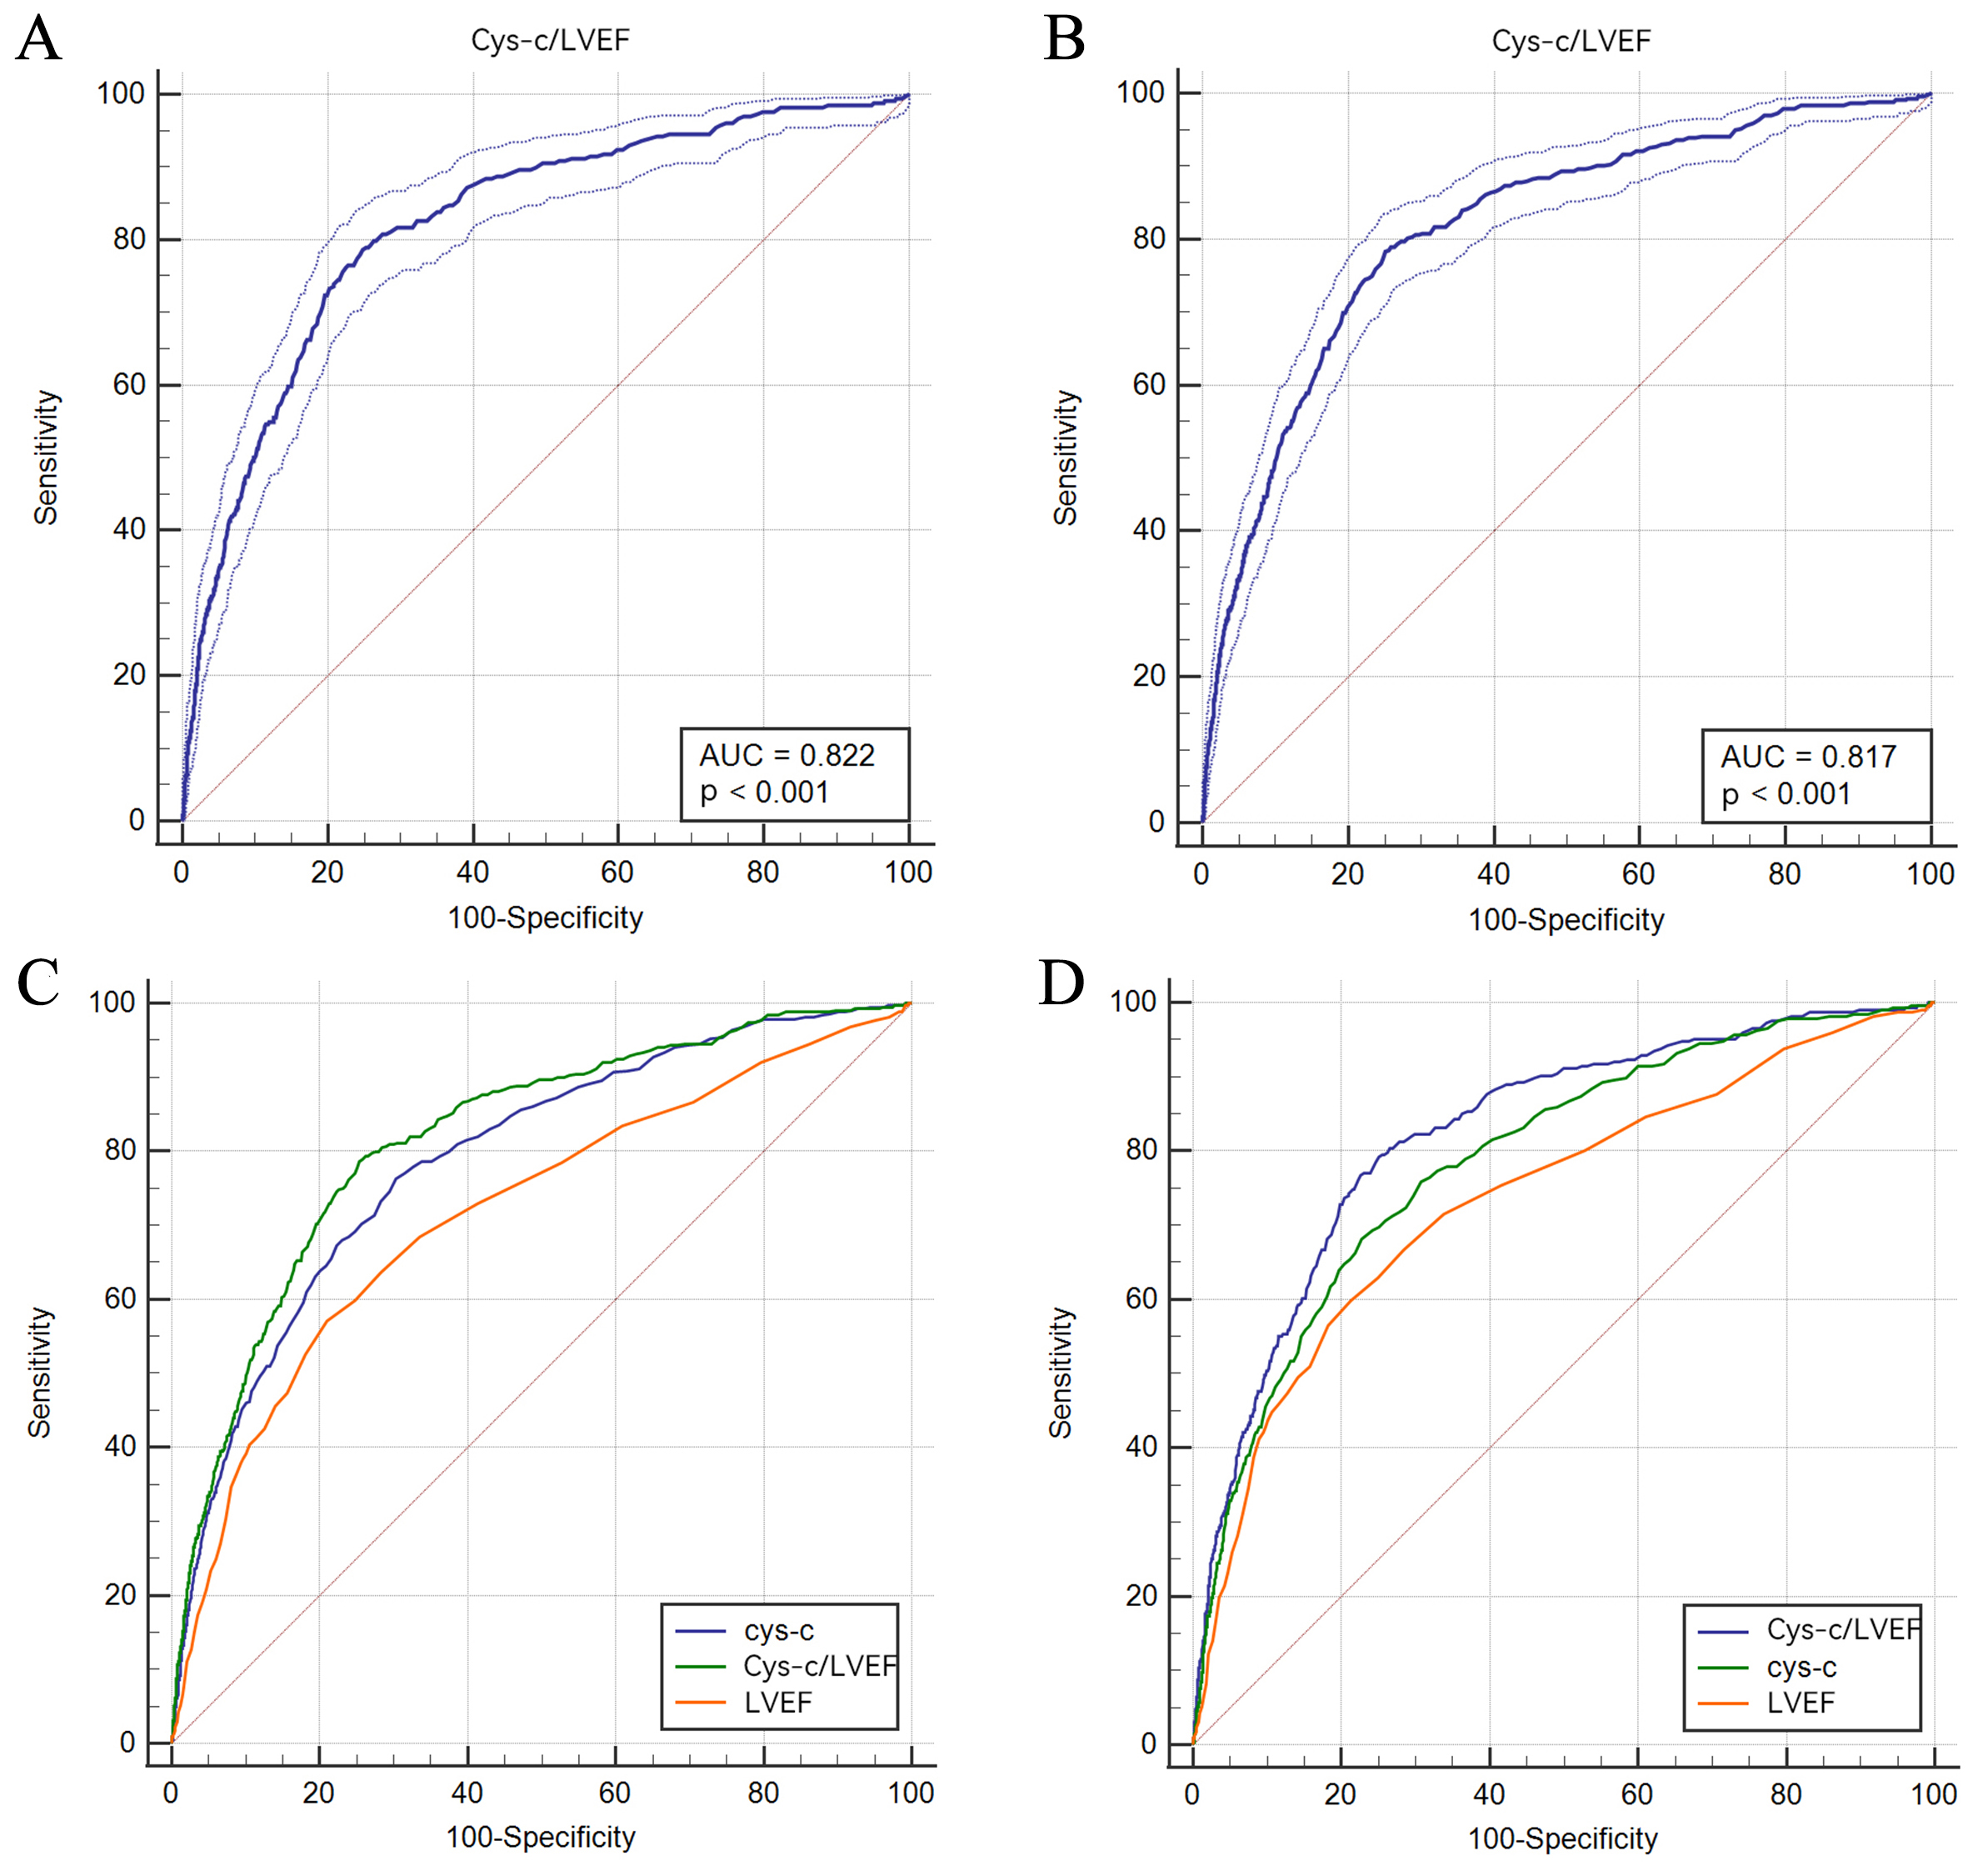 Fig. 2.
ROC analysis of the predictability of CLR for ACM (A) and CM (B) and comparison among Cys-C, CLR, and LVEF in terms of ACM (C) and CM (D). ACM, all-cause mortality; CM, cardiac mortality; LVEF, left ventricular ejection fraction; Cys-C, Cystatin C; CLR, Cys-C/LVEF ratio; ROC, receiver operating characteristic curve analysis.
Overall, no significant differences were observed between the two groups in
terms of
| Characteristic | Low-CLR | High-CLR | p-values | |
| Total (n = 14,733) | n = 10,856 | n = 3877 | ||
| Male sex, n (%) | 7953 (73.3) | 2934 (75.7) | 8.659 | 0.003 |
| Smoking, n (%) | 4395 (40.5) | 1451 (37.4) | 11.166 | 0.001 |
| Drinking, n (%) | 2708 (24.9) | 784 (20.2) | 35.237 | |
| Hypertension, n (%) | 7310 (67.4) | 2780 (72.2) | 31.173 | |
| Diabetes, n (%) | 4600 (42.4) | 2369 (61.1) | 402.092 | |
| Age (years) | 58.44 |
64.93 |
44.922 | |
| BMI (kg/m |
26.08 |
25.67 |
12.239 | 0.006 |
| BUN (mmol/L) | 8.92 |
9.94 |
2.464 | 0.064 |
| Uric acid (mmol/L) | 435.48 |
436.09 |
51.283 | 0.958 |
| SCr (µmol/L) | 83.55 |
97.64 |
0.016 | |
| eGFR (mL/min/1.73 m |
102.10 |
82.69 |
582.437 | |
| TC (mmol/L) | 3.93 |
3.74 |
3.236 | |
| HDL-C (mmol/L) | 1.08 |
1.01 |
2.917 | |
| LDL-C (mmol/L) | 2.50 |
2.39 |
12.544 | |
| LVEF (%) | 62.52 |
53.53 |
5020.597 | |
| LVEDD (mm) | 48.92 |
53.34 |
1978.634 | |
| Cys-C (mg/L) | 0.84 |
1.58 |
1378.582 | |
| ARB or ACEI, n (%) | 4509 (41.5) | 1849 (47.7) | 44.144 | |
| 6046 (57.9) | 2114 (58.1) | 0.054 | 0.817 | |
| CCB, n (%) | 2290 (21.9) | 735 (20.2) | 4.727 | 0.030 |
| Aspirin, n (%) | 10,387 (95.7) | 3631 (93.7) | 25.368 | |
| Statins, n (%) | 10,180 (93.8) | 3510 (90.5) | 45.564 | |
| Clopidogrel, n (%) | 5569 (51.3) | 1999 (51.6) | 0.078 | 0.780 |
| SCAD (n = 6111) | n = 4851 | n = 1260 | ||
| Male sex, n (%) | 3533 (72.8) | 928 (73.7) | 0.342 | 0.559 |
| Smoking, n (%) | 1964 (40.5) | 455 (36.1) | 8.007 | 0.005 |
| Drinking, n (%) | 1231 (25.4) | 254 (20.2) | 14.801 | |
| Age (years) | 59.61 |
66.67 |
11.361 | |
| BMI (kg/m |
26.28 |
25.88 |
1.506 | 0.066 |
| BUN (mmol/L) | 9.18 |
11.55 |
3.226 | 0.018 |
| Uric acid (mmol/L) | 445.70 |
426.00 |
32.310 | 0.302 |
| SCr (µmol/L) | 77.89 |
99.43 |
1.360 | 0.010 |
| eGFR (mL/min/1.73 m |
102.49 |
82.19 |
244.703 | |
| TC (mmol/L) | 3.92 |
3.74 |
2.260 | |
| HDL-C (mmol/L) | 1.09 |
1.04 |
1.774 | |
| LDL-C (mmol/L) | 2.49 |
2.38 |
5.057 | |
| LVEF (%) | 62.88 |
55.24 |
1703.314 | |
| LVEDD (mm) | 48.78 |
52.41 |
619.446 | |
| Cys-C (mg/L) | 0.83 |
1.60 |
377.134 | |
| ARB or ACEI, n (%) | 2059 (42.4) | 606 (48.1) | 12.985 | |
| 2771 (59.0) | 702 (58.8) | 0.014 | 0.906 | |
| CCB, n (%) | 1187 (25.3) | 322 (26.9) | 1.383 | 0.240 |
| Aspirin, n (%) | 4716 (97.2) | 1212 (96.2) | 3.629 | 0.057 |
| Statins, n (%) | 4575 (94.3) | 1164 (92.4) | 6.514 | 0.011 |
| Clopidogrel, n (%) | 2603 (53.7) | 664 (52.7) | 0.371 | 0.542 |
| ACS (n = 8622) | n = 6005 | n = 2617 | ||
| Male sex, n (%) | 4420 (73.6) | 2006 (76.7) | 8.916 | 0.003 |
| Smoking, n (%) | 2431 (40.5) | 996 (38.1) | 4.472 | 0.034 |
| Drinking, n (%) | 1477 (24.6) | 530 (20.3) | 19.258 | |
| Age (years) | 57.50 |
64.10 |
26.313 | |
| BMI (kg/m |
25.88 |
25.53 |
12.361 | 0.060 |
| BUN (mmol/L) | 8.71 |
9.16 |
8.398 | 0.483 |
| Uric acid (mmol/L) | 427.33 |
440.79 |
18.442 | 0.279 |
| SCr (µmol/L) | 88.17 |
96.78 |
0.547 | 0.362 |
| eGFR (mL/min/1.73 m |
101.78 |
82.93 |
333.321 | |
| TC (mmol/L) | 3.93 |
3.74 |
0.786 | |
| HDL-C (mmol/L) | 1.07 |
0.99 |
2.254 | |
| LDL-C (mmol/L) | 2.51 |
2.39 |
6.205 | |
| LVEF (%) | 62.22 |
52.70 |
2994.446 | |
| LVEDD (mm) | 49.04 |
53.78 |
1238.945 | |
| Cys-C (mg/L) | 0.84 |
1.57 |
1201.891 | |
| ARB or ACEI, n (%) | 2450 (40.8) | 1243 (47.5) | 33.393 | |
| 3275 (56.9) | 1412 (57.7) | 0.438 | 0.508 | |
| CCB, n (%) | 1103 (19.2) | 413 (16.9) | 5.879 | 0.015 |
| Aspirin, n (%) | 5671 (94.4) | 2419 (92.4) | 12.642 | |
| Statins, n (%) | 5605 (93.3) | 2346 (89.6) | 34.660 | |
| Clopidogrel, n (%) | 2966 (49.4) | 1335 (51.0) | 1.914 | 0.166 |
Abbreviations: BMI, body mass index; SCr, serum creatinine; BUN, blood urea nitrogen; eGFR, estimated glomerular filtration rate; TC, total cholesterol; HDL-C, high-density lipoprotein cholesterol; LDL-C, low-density lipoprotein cholesterol; LVEF, left ventricular ejection fraction; LVEDD, left ventricular end diastolic diameter; ARB, angiotensin receptor blocker; ACEI, angiotensin-converting enzyme inhibitor; CCB, calcium channel blocker; SCAD, stable coronary artery disease; Cys-C, Cystatin C; ACS, acute coronary syndrome; CLR, Cys-C/LVEF ratio.
For the primary endpoints, as shown in Table 2, ACM occurred in 443 patients out
of the total population during the follow-up. Among the low-CLR group, ACM
occurred in 100 (0.9%) patients, while it occurred in 343 (8.8%) patients among
the high-CLR group, and highly incidence of ACM was determined in the high-CLR
group compared to the low-CLR group (p
In terms of the secondary endpoints, we also found significant differences for
MACEs (5.9% vs. 12.7%, p
Subgroup analysis indicated that for SCAD patients, there were significant
differences in the incidence of ACM (0.9% vs. 7.5%, p
| Outcomes | Low-CLR | High-CLR | p-values | |
| Total (n = 14,733) | n = 10,856 | n = 3877 | ||
| ACM | 100 (0.9) | 343 (8.8) | 615.344 | |
| CM | 69 (0.6) | 260 (6.7) | 482.219 | |
| NFMI | 97 (0.9) | 129 (3.3) | 112.032 | |
| MACEs | 643 (5.9) | 492 (12.7) | 183.996 | |
| MACCEs | 729 (6.7) | 517 (13.3) | 161.705 | |
| SCAD (n = 6111) | n = 4851 | n = 1260 | ||
| ACM | 43 (0.9) | 94 (7.5) | 197.231 | |
| CM | 29 (0.6) | 64 (5.1) | 134.040 | |
| NFMI | 208 (4.3) | 53 (4.2) | 0.016 | 0.899 |
| MACEs | 252 (5.2) | 125 (9.9) | 38.590 | |
| MACCEs | 280 (5.8) | 137 (10.9) | 40.933 | |
| ACS (n = 8622) | n = 6005 | n = 2617 | ||
| ACM | 57 (0.9) | 249 (9.5) | 390.656 | |
| CM | 40 (0.7) | 196 (7.5) | 318.755 | |
| NFMI | 296 (4.9) | 122 (4.7) | 0.283 | 0.595 |
| MACEs | 391 (6.5) | 367 (14.0) | 128.285 | |
| MACCEs | 449 (7.5) | 380 (14.5) | 104.045 |
Abbreviations: ACM, all-cause mortality; CM, cardiac mortality; MACEs, major adverse cardiovascular events; MACCEs, major adverse cardiovascular and cerebrovascular events, NFMI, nonfatal myocardial infarction; SCAD, stable coronary artery disease; ACS, acute coronary syndrome; CLR, cystatin C/left ventricular ejection fraction ratio.
As shown in Fig. 3, Kaplan-Meier survival analysis was performed to further
investigate the effect of CLR on patients’ prognosis. Patients in the high-CLR
group (CLR
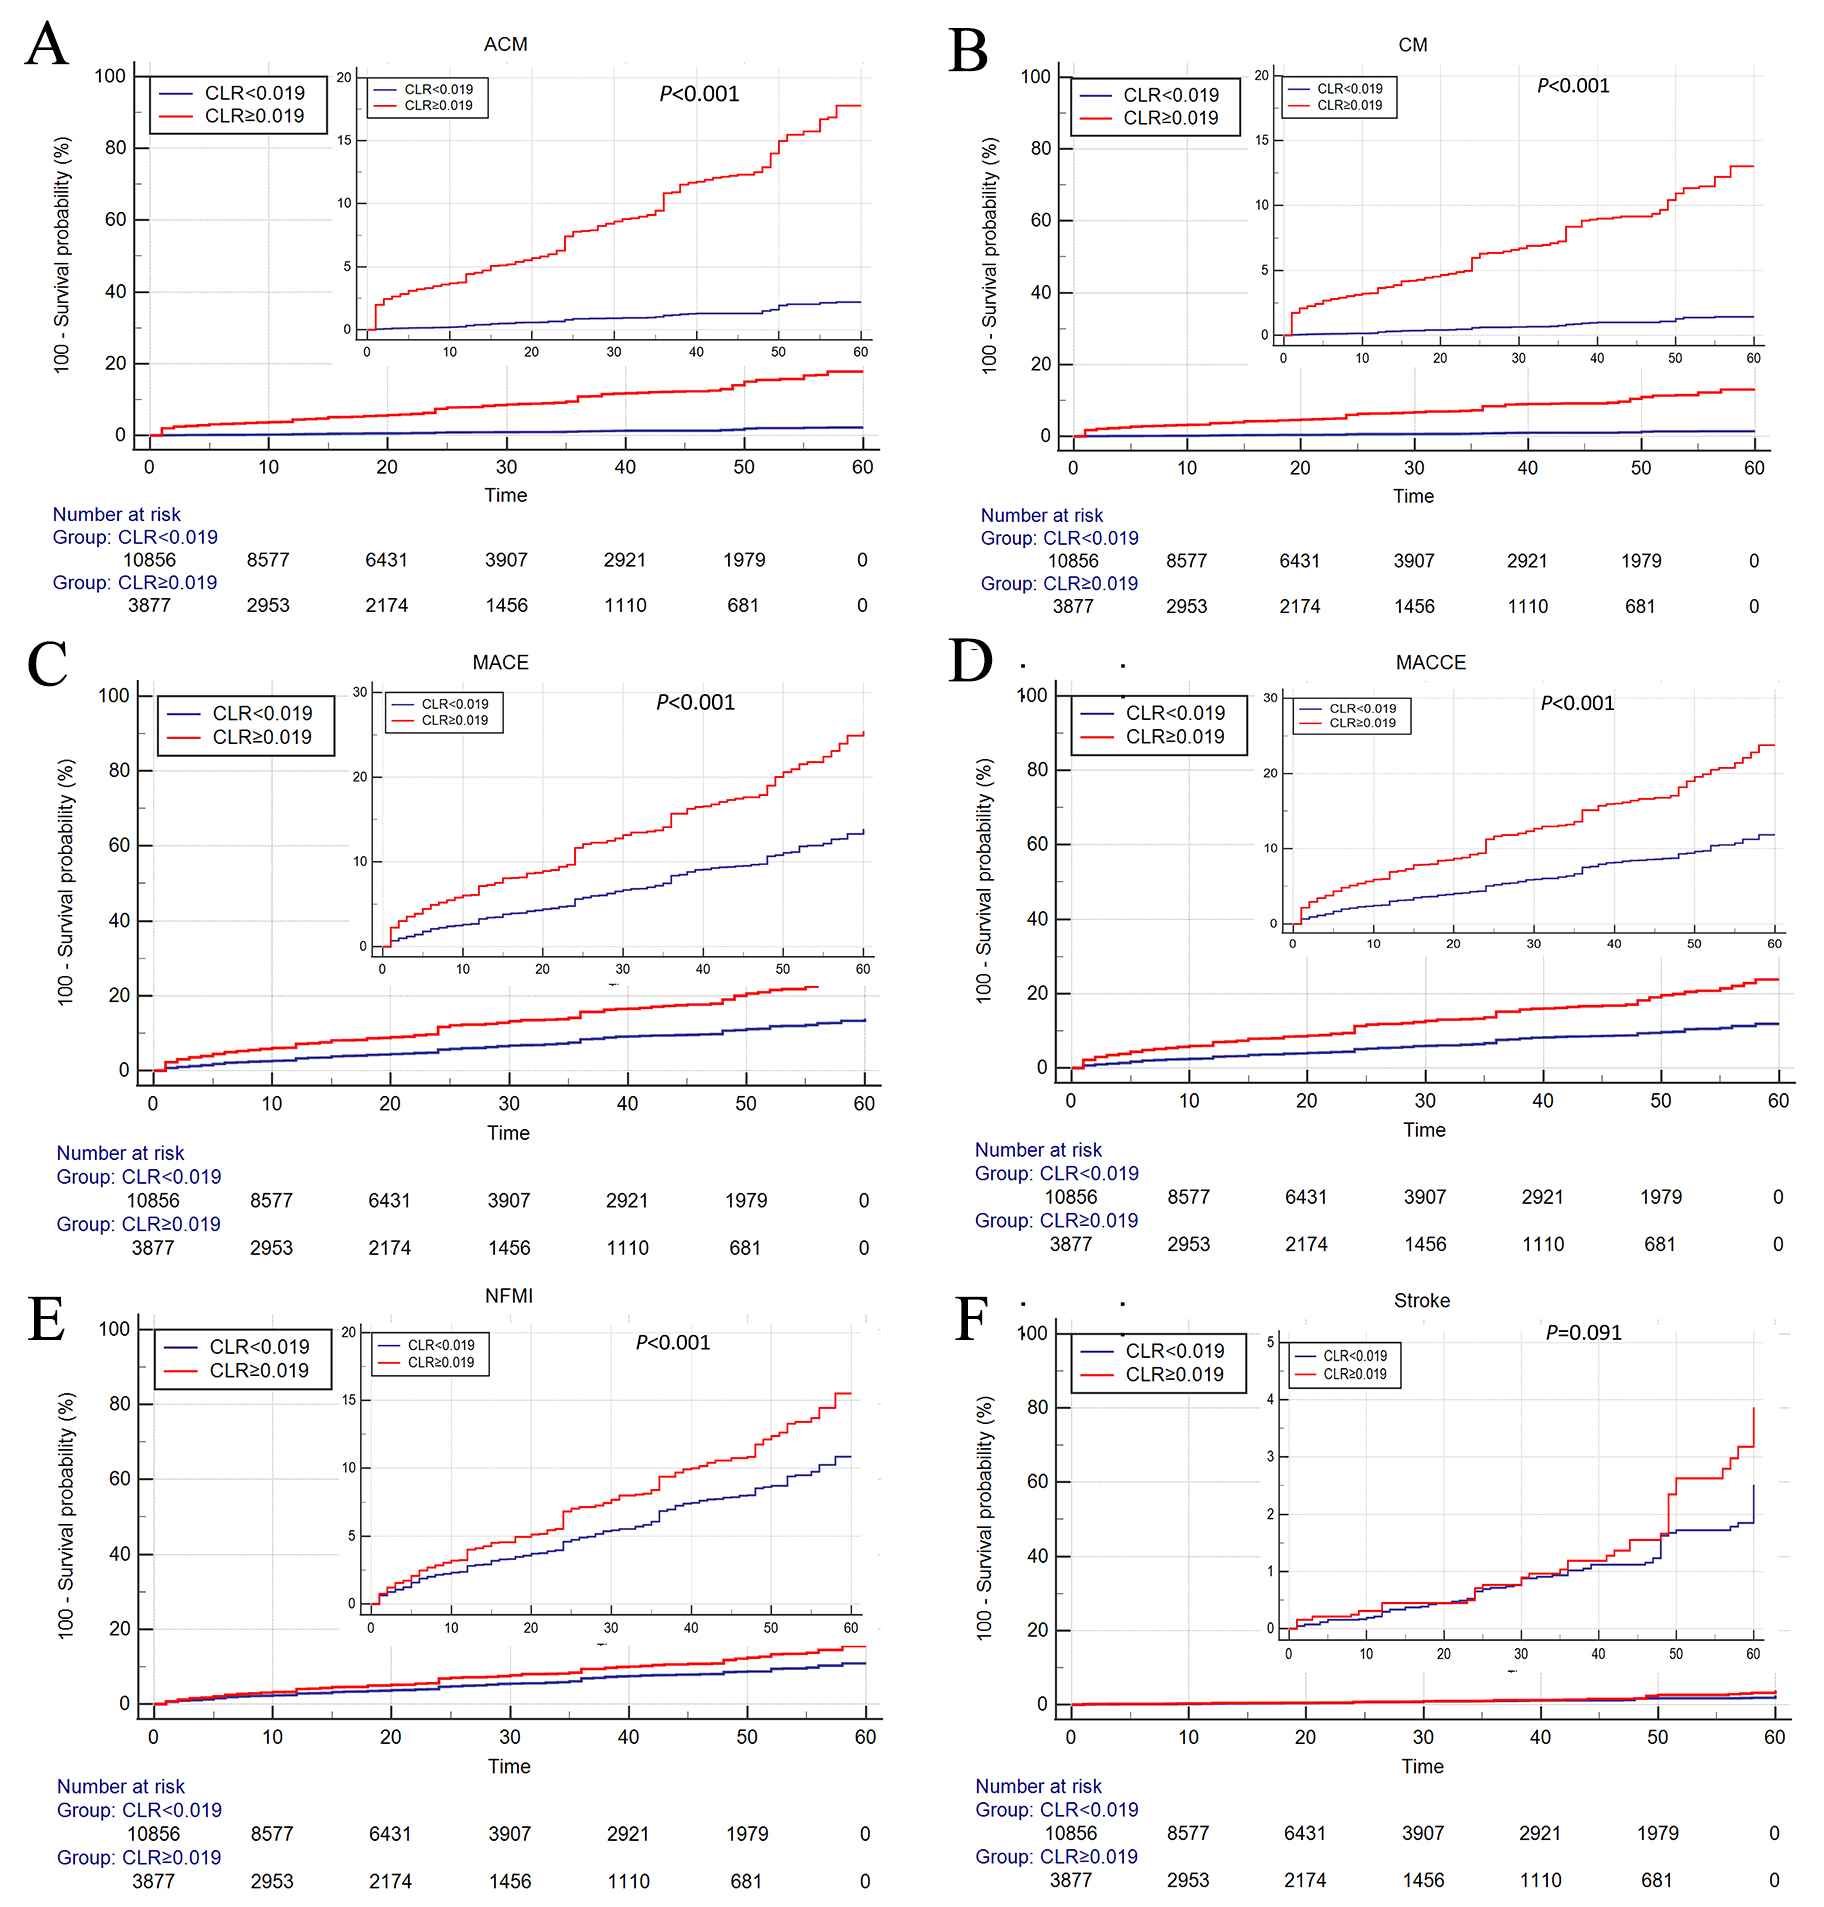 Fig. 3.
Cumulative Kaplan‒Meier estimates of the time to the first occurrence of ACM (A), CM (B), MACE (C), MACCE (D), NFMI (E), and stroke (F). ACM, all-cause mortality; CM, cardiac mortality; MACE, major adverse cardiovascular event; MACCE, major adverse cardiovascular and cerebrovascular event, NFMI, nonfatal myocardial infarction; CLR, cystatin C/left ventricular ejection fraction ratio.
We performed multivariate Cox regression analysis after
adjusting for age, sex, smoking, drinking, hypertension, diabetes, TC, HDL-C,
LDL-C, BMI, therapy with ARB or ACEI,
| Variables | Beta | SE | Wald | p-values | Hazard ratio (95% CI) |
| Age | 0.059 | 0.012 | 24.053 | 1.061 (1.036~1.087) | |
| Male sex | –0.664 | 0.317 | 4.391 | 0.036 | 0.515 (0.277~0.958) |
| Smoking | –0.361 | 0.288 | 1.573 | 0.210 | 0.697 (0.396~1.226) |
| Drinking | 0.110 | 0.325 | 0.116 | 0.734 | 1.117 (0.591~2.110) |
| Hypertension | 0.001 | 0.289 | 0.000 | 0.997 | 1.001 (0.568~1.763) |
| Diabetes | 0.404 | 0.252 | 2.564 | 0.109 | 1.497 (0.914~2.454) |
| TC | 0.133 | 0.231 | 0.333 | 0.564 | 1.143 (0.727~1.797) |
| HDL-C | –0.188 | 0.449 | 0.175 | 0.675 | 0.828 (0.343~1.998) |
| LDL-C | –0.060 | 0.294 | 0.041 | 0.839 | 0.942 (0.529~1.678) |
| BMI | –0.055 | 0.031 | 3.211 | 0.073 | 0.946 (0.891~1.005) |
| CLR | 2.100 | 0.278 | 56.879 | 8.163 (4.730~14.087) |
TC, total cholesterol; HDL-C, high-density lipoprotein cholesterol; LDL-C, low-density lipoprotein cholesterol; BMI, body mass index; CLR, cystatin C/left ventricular ejection fraction ratio; ACM, all-cause mortality.
| Variables | Beta | SE | Wald | p-values | Hazard ratio (95% CI) |
| Age | 0.048 | 0.014 | 12.387 | 1.050 (1.022~1.078) | |
| Male sex | –0.754 | 0.382 | 3.896 | 0.048 | 0.470 (0.222~0.995) |
| Smoking | –0.434 | 0.330 | 1.725 | 0.189 | 0.648 (0.339~1.238) |
| Drinking | 0.321 | 0.359 | 0.801 | 0.371 | 1.379 (0.682~2.785) |
| Hypertension | –0.002 | 0.332 | 0.000 | 0.994 | 0.998 (0.520~1.914) |
| Diabetes | 0.534 | 0.298 | 3.210 | 0.073 | 1.707 (0.951~3.062) |
| TC | –0.066 | 0.384 | 0.030 | 0.863 | 0.936 (0.441~1.985) |
| HDL-C | 0.047 | 0.528 | 0.008 | 0.929 | 1.048 (0.373~2.948) |
| LDL-C | 0.085 | 0.460 | 0.034 | 0.854 | 1.088 (0.442~2.680) |
| BMI | –0.034 | 0.035 | 0.957 | 0.328 | 0.967 (0.903~1.035) |
| CLR | 2.365 | 0.334 | 49.991 | 10.643 (5.525~20.501) |
TC, total cholesterol; HDL-C, high-density lipoprotein cholesterol; LDL-C, low-density lipoprotein cholesterol; BMI, body mass index; CLR, cystatin C/left ventricular ejection fraction ratio; CM, cardiac mortality.
| Age | Beta | SE | Wald | p-values | Hazard ratio (95% CI) |
| Male sex | –0.003 | 0.004 | 0.460 | 0.498 | 0.997 (0.988~1.006) |
| Smoking | –0.036 | 0.122 | 0.088 | 0.767 | 0.965 (0.760~1.224) |
| Drinking | –0.329 | 0.116 | 8.049 | 0.005 | 0.720 (0.573~0.903) |
| Hypertension | 0.335 | 0.118 | 8.104 | 0.004 | 1.397 (1.110~1.759) |
| Diabetes | 0.091 | 0.107 | 0.724 | 0.395 | 1.095 (0.888~1.351) |
| TC | 0.061 | 0.093 | 0.433 | 0.511 | 1.063 (0.886~1.277) |
| HDL-C | –0.107 | 0.113 | 0.897 | 0.344 | 0.899 (0.721~1.121) |
| LDL-C | 0.012 | 0.172 | 0.005 | 0.943 | 1.012 (0.723~1.418) |
| BMI | 0.130 | 0.131 | 0.979 | 0.322 | 1.139 (0.880~1.472) |
| CLR | 0.457 | 0.110 | 17.223 | 1.580 (1.273~1.960) |
TC, total cholesterol; HDL-C, high-density lipoprotein cholesterol; LDL-C, low-density lipoprotein cholesterol; BMI, body mass index; CLR, cystatin C/left ventricular ejection fraction ratio; NFMI, nonfatal myocardial infarction.
| Variables | Beta | SE | Wald | p-values | Hazard ratio (95% CI) |
| Age | 0.004 | 0.007 | 0.392 | 0.531 | 1.004 (0.991~1.017) |
| Male sex | –0.462 | 0.194 | 5.668 | 0.017 | 0.630 (0.431~0.922) |
| Smoking | –0.271 | 0.165 | 2.695 | 0.101 | 0.762 (0.551~1.054) |
| Drinking | 0.215 | 0.171 | 1.587 | 0.208 | 1.240 (0.887~1.732) |
| Hypertension | 0.160 | 0.165 | 0.941 | 0.332 | 1.173 (0.850~1.621) |
| Diabetes | 0.404 | 0.142 | 8.118 | 0.004 | 1.497 (1.134~1.976) |
| TC | 0.112 | 0.095 | 1.390 | 0.238 | 1.119 (0.928~1.349) |
| HDL-C | –0.346 | 0.265 | 1.710 | 0.191 | 0.707 (0.421~1.189) |
| LDL-C | –0.035 | 0.127 | 0.074 | 0.785 | 0.966 (0.753~1.239) |
| BMI | 0.001 | 0.017 | 0.001 | 0.970 | 1.001 (0.967~1.035) |
| CLR | 0.855 | 0.150 | 32.621 | 2.352 (1.754~3.154) |
TC, total cholesterol; HDL-C, high-density lipoprotein cholesterol; LDL-C, low-density lipoprotein cholesterol; BMI, body mass index; CLR, cystatin C/left ventricular ejection fraction ratio; MACEs, major adverse cardiovascular events.
| Variables | Beta | SE | Wald | p-values | Hazard ratio (95% CI) |
| Age | 0.006 | 0.006 | 1.065 | 0.302 | 1.007 (0.994~1.019) |
| Male sex | –0.430 | 0.180 | 5.698 | 0.017 | 0.650 (0.457~0.926) |
| Smoking | –0.304 | 0.158 | 3.692 | 0.055 | 0.738 (0.541~1.006) |
| Drinking | 0.265 | 0.163 | 2.659 | 0.103 | 1.304 (0.948~1.793) |
| Hypertension | 0.255 | 0.160 | 2.545 | 0.111 | 1.291 (0.943~1.766) |
| Diabetes | 0.271 | 0.133 | 4.163 | 0.041 | 1.311 (1.011~1.700) |
| TC | 0.095 | 0.099 | 0.918 | 0.338 | 1.100 (0.905~1.335) |
| HDL-C | –0.185 | 0.245 | 0.568 | 0.451 | 0.831 (0.514~1.344) |
| LDL-C | –0.015 | 0.128 | 0.013 | 0.910 | 0.986 (0.766~1.268) |
| BMI | –0.004 | 0.017 | 0.048 | 0.827 | 0.996 (0.964~1.029) |
| CLR | 0.759 | 0.144 | 27.776 | 2.137 (1.611~2.834) |
TC, total cholesterol; HDL-C, high-density lipoprotein cholesterol; LDL-C, low-density lipoprotein cholesterol; BMI, body mass index; CLR, cystatin C/left ventricular ejection fraction ratio; MACCEs, major adverse cardiovascular and cerebrovascular events.
We clarified, in the present study, that CAD patient with high-CLR who received PCI have a worse survival over 5 years compare to those with low-CLR. Besides, elevated CLR was confirmed to be an independent predictor of ACM, CM, MACEs and MACCEs for both SCAD and ACS patients underwent PCI. And this is the first study to reveal the association between CLR and adverse outcomes in CAD patients, as far as we know.
As a latent cysteine protease inhibitor, Cys-C plays a crucial part in human
vascular pathophysiology [22]. High levels of Cys-C in serum were previously
considered to be independently connected to the incidence of cardiovascular
events, even among patients considered to be low risk for renal function
dysfunction [23, 24, 25]. Cys-C, therefore, was regarded as a potential biomarker for
cardiovascular disease. Furthermore, there is increasing evidence suggesting that
Cys-C is a effective predictor of prognosis, whether CAD patients are undergoing
coronary revascularization or not [26, 27, 28]. According to the study of Wallentin
et al. [29], Cys-C has been linked to cardiovascular events and death
among CAD patients. In additon, evaluated levels of Cys-C in serum were linked to
increased long-term ACM and CM risks among STEMI patients in a retrospective
study by Chen et al. [30]. Taglieri et al. [31] demonstrated
that enhanced Cys-C levels were relevant to higher mortality risk and incidence
of myocardial infarction in patients with ACS. Interestingly, Liu et al.
[32] found that Cys-C levels in serum were not an independent predictor of
long-term mortality among patients following coronary angiography. We determined
that Cys-C levels and CAD prognosis were positively correlated in our study,
which involved 14,733 patients with CAD patients. Besides, we also assessed the
predictive efficacy of the LVEF for CAD outcomes and demonstrated its good
discriminability for mortality (AUC = 0.719 for ACM; AUC = 0.739 for CM).
Although either Cys-C or LVEF alone is a powerful predictor for mortality, the
ratio of Cys-C to LVEF (the CLR) showed better performance in predicting
mortality (AUC = 0.819 for ACM; AUC = 0.826 for CM). Therefore, we believe that
the CLR is a stronger predictor of adverse outcomes than Cys-C or LVEF alone in
CAD patients. Similarly, Serkan Ordu et al. [33] found that Cys-C is an
independent risk factor for evaluating the prognosis of patients with chronic
heart failure. When LVEF
Furthermore, compare to patients with low CLR, those with high CLR are prominently more likely to experience ACM, CM, NFMI, MACEs and MACCEs. The two groups differed significantly in many baseline characteristics, including age, sex, smoking, drinking, hypertension, diabetes, TC, HDL-C, LDL-C, and BMI. Taking these confounders into account, multivariable Cox regressions was performed, which shows that the incidence of ACM, CM, MACEs, and MACCEs remarkably strengthened in patients with high-CLR compared to those with low-CLR, and this result was more pronounced in SCAD and ACS patients after PCI. Therefore, those results are credible and likely not incidental. The association between an increased CLR and adverse outcomes may be explained by several potential pathophysiological mechanisms. A previous study [34] indicated that patients with higher Cys-C levels have a higher metabolic state, and Cys-C is a fruitful inhibitor of lysosomal protease and cysteine protease was produced by almost all human cells at a constant rate [35]. A high Cys-C concentration may promote inflammation, regulate oxidative stress, and release more cytokines [36]. In addition, a reduced LVEF suggests the presence of heart failure, which indicates that the patient has a poor prognosis. Therefore, a combined analysis of these two parameters may improve the predictive ability for a CAD prognosis.
There are several strengths in our study. First, the AUC and HR values of the CLR were considerably higher than those independent of Cys-C or LVEF indicators, making the CLR highly innovative. Second, the CLR was observed to be associated with outcomes in CAD for the first time in current study, which increases the strength of our claims. Third, a prospective cohort with a large number of patients was constructed in this study, which improved its statistical power. Fourth, we performed multivariable regression analyses, thus improving the reliability and generalizability of our results. Nonetheless, there are still several limitations in our research. First, we only collected baseline serum Cys-C and LVEF data, and dynamic changes in these two parameters were not available in current study. Second, since this study is a single-centre study, a multicentre study was needed to confirm those results.
In summary, in the current study we indicated that an elevated serum Cys-C to LVEF ratio was significantly associated with a poor prognosis in patients with CAD who underwent PCI and that it shows effective predictive value in SCAD and ACS patients. Hence, CLR might be a novel and credible indicator of mortality and adverse events among CAD patients. Furthermore, it might be helpful to distinguish patients at high risk of cardiovascular disease through CLR.
The datasets used and/or analyzed during the current study available from the corresponding author on reasonable request.
Conceived and designed the study: XX, YN, K-YW, XM, X-GH, T-TW and Y-TM. Data collection and analyzed the data: XX, YN, K-YW, XM, X-GH, T-TW and Y-TM. Quality control the study and revision: XX, YN, K-YW, XM, X-GH, T-TW and Y-TM. Wrote the paper: XX, YN, K-YW, XM, X-GH, T-TW and Y-TM. All authors read and approved the final manuscript. All authors have participated sufficiently in the work and agreed to be accountable for all aspects of the work.
Because all indicators were obtained from the medical record system, the informed consent exemption was applied for. The study protocol was approved by the Ethics Committee of the First Affiliated Hospital of Xinjiang Medical University (Y101310008), and the requirement for informed consent was waived by the ethics committee.
Not applicable.
This research was funded by the National Natural Science Foundation of China (82170345 and 82000238).
The author declares no conflict of interest. Xiang Xie is serving as one of the Guest editors of this journal. We declare that Xiang Xie had no involvement in the peer review of this article and has no access to information regarding its peer review. Full responsibility for the editorial process for this article was delegated to Ezra Abraham Amsterdam.
Publisher’s Note: IMR Press stays neutral with regard to jurisdictional claims in published maps and institutional affiliations.