


 , Zhi Jian Wang 1,*
1 Department of Cardiology, Beijing Anzhen Hospital, Capital Medical University, Beijing Institute of Heart Lung and Blood Vessel Disease, Beijing Key Laboratory of Precision Medicine of Coronary Atherosclerotic Disease, Clinical Center for Coronary Heart Disease, Capital Medical University, 100029 Beijing, China
2 Department of Cardiology, Jiangxi Provincial People's Hospital, The First Affiliated Hospital of Nanchang Medical College, 330006 Nanchang, Jiangxi, China
†These authors contributed equally.
Academic Editor: Pietro Scicchitano
Abstract
Background: Homeostasis of thyroid hormones has significant effects on
the cardiovascular system. The aim of this study was to investigate the
association between free triiodothyronine (FT3) and adverse cardiovascular events
in patients with acute coronary syndrome (ACS) who were undergoing percutaneous
coronary intervention (PCI). Methods: A total of 1701 patients with ACS
undergoing PCI were included in this study. All patients were divided into three
groups according to the tertiles of FT3 level: the lowest tertile (FT3
Keywords
- free triiodothyronine
- acute coronary syndrome
- percutaneous coronary intervention
- adverse cardiovascular events
Acute coronary syndrome (ACS), the most severe ischemic heart disease, has been recognized as one of the major causes of mortality globally and considered to be a serious public health problem. Despite the increased number of therapeutic interventions performed in patients with ACS, such as advanced pharmacotherapy and myocardial reperfusion therapy, there is still a significant incidence of major adverse cardiovascular events in these patients. Identifying the risk factors that affect the prognosis of ACS patients, is therefore, of great importance.
Homeostasis of thyroid hormones has a significant impact on the cardiovascular
system [1, 2]. The abnormalities of thyroid function, subclinical or overt
hypothyroidism and hyperthyroidism, have been associated with the progression of
atherosclerosis and increased cardiovascular morbidity and mortality in patients
with coronary artery disease (CAD) [2, 3, 4, 5, 6]. Serum triiodothyronine (T3), which is
the principal bioactive thyroid hormone for cardiomyocytes, has an effect on
myocardial contractility, systemic vascular resistance and cardiovascular
hemodynamics. T3 works mainly through the modulation of the relative proteins
coded by target genes in the cardiovascular system such as myosin heavy chains,
sarcoplasmic reticulum proteins, and calcium-activated ATPase (Ca
Although previous studies have found that lower FT3 level have a close relationship with major adverse cardiovascular events (MACE) in ACS patients, the relationship between the level of FT3 and adverse cardiovascular events in such patients undergoing PCI has not been defined. Therefore, our study aimed to investigate the association between FT3 level and adverse cardiovascular events in patients with ACS undergoing PCI.
This study is a retrospective analysis based on a single-center prospective registry (ChiCTR1800017417). From June 2016 to November 2017, 1770 ACS patients treated with PCI were admitted in our cardiovascular center and consecutively enrolled in the prospective registry. The first patient was recruited in June 2016 and follow-up was completed in December 2019. All patients were regularly followed through telephone contact by independent personnel. Four patients were lost during the period of follow-up. We ultimately included 1701 patients after excluding patients with thyroid dysfunction, infectious diseases, malignant tumors, previous coronary artery bypass grafting (CABG), and loss to follow-up.
The primary study endpoint was a composite of major adverse cardiovascular
events (MACE), which
consists of
all-cause death, ischemic stroke, myocardial infarction, or unplanned repeat
revascularization. The secondary study endpoints were each individual component
of the MACE. We choose the most serious endpoint event for endpoint analysis if
Data on demographics, cardiovascular risk factors, and medication history were
collected by using a standard questionnaire. Coronary angiographic findings and
procedural results were obtained from medical records. Body mass index (BMI) was
calculated as weight (kg) divided by height (m) squared. Diabetes was diagnosed
as typical symptoms of diabetes and a random plasma glucose
Blood samples were collected from a cubital vein 12 hours from the time of admission in the fasting state to determine thyroid hormones, lipid profiles and other biochemical parameters, and were measured in the central laboratory of the Beijing Anzhen Hospital. Thyroid-related hormones, such as thyroid-stimulating hormone (TSH), FT3 and free thyroxine (FT4) were measured by the electrochemiluminescent immunoassay method. Serum levels of TG, TC, LDL-C and HDL-C were measured by enzymatic methods. Estimated glomerular filtration rate (eGFR) was calculated using the Chronic Kidney Disease Epidemiology Collaboration (CKD-EPI) equation. Left ventricular ejection fraction (LVEF) was measured by Doppler echocardiography by an experienced ultrasound cardiologist.
Continuous variables were expressed as mean
Statistical analysis was performed with SPSS (version 24.0; IBM, IL, USA) and R
Programming Language (version 4.1.0; Vienna, Austria). All probability values
were 2-tailed. A p value of
Fig. 1 shows the flow chart of the study. The average age of the study patients
was 60
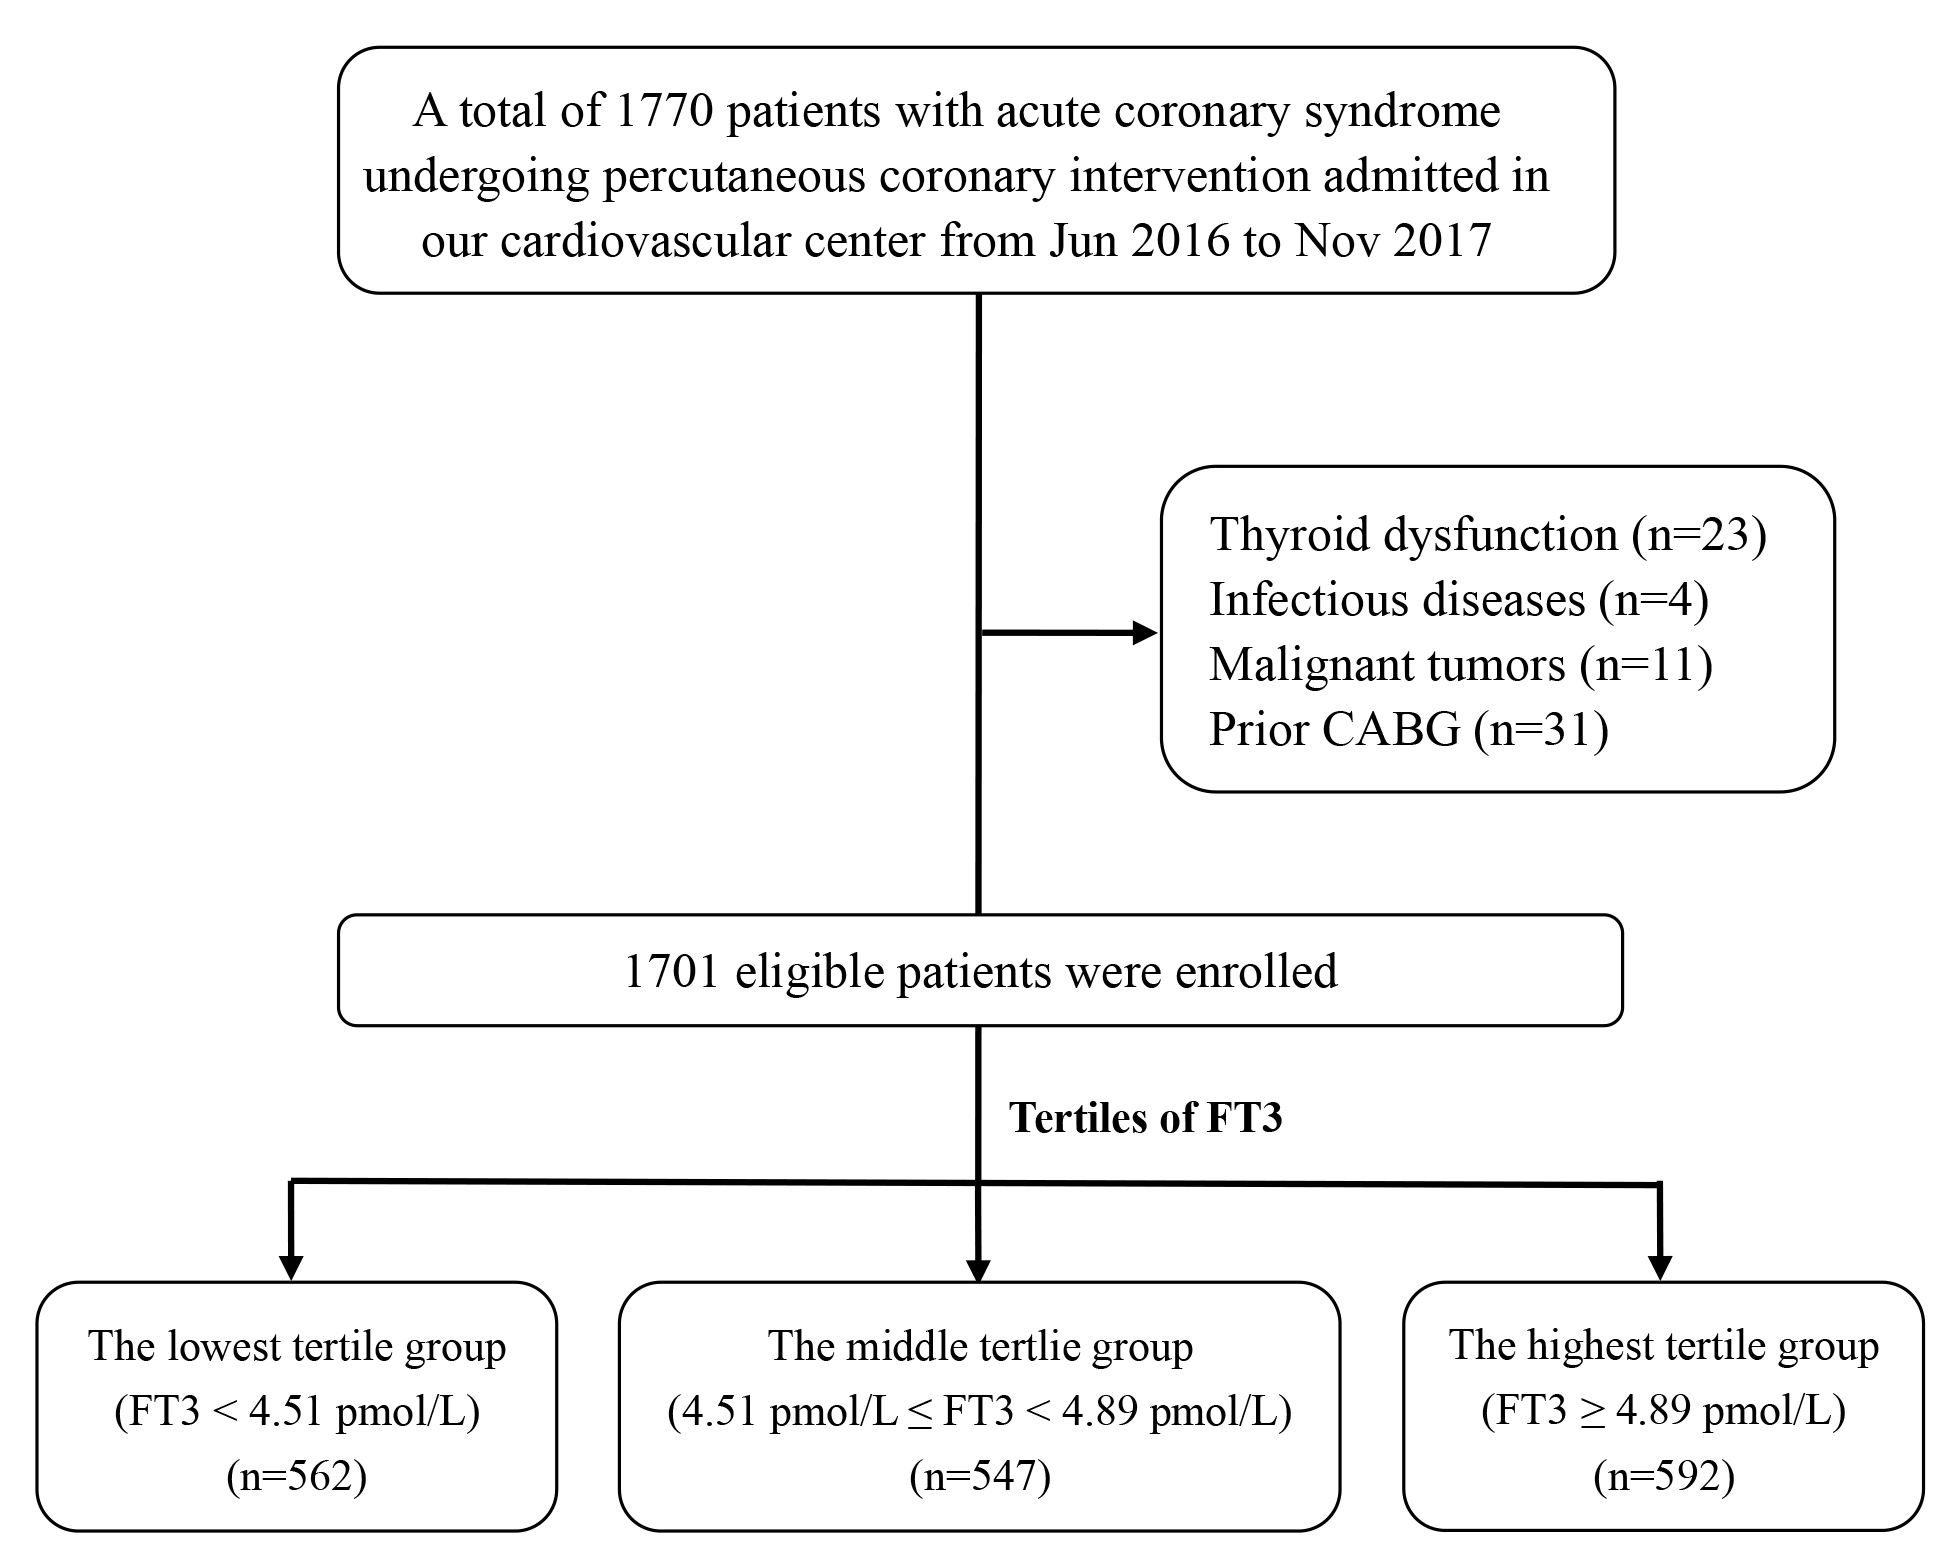 Fig. 1.
The flow chart of the study.
| Characteristics | All patients (n = 1701) | Tertiles of FT3 | ||||
| Lowest group (n = 562) | Middle group (n = 547) | Highest group (n = 592) | p valve | |||
| Demographics | ||||||
| Age-years | 60 |
62 |
59 |
58 |
||
| Male-n (%) | 1312 (77.1) | 407 (72.4) | 417 (76.2) | 488 (82.4) | ||
| BMI-kg/m |
25.7 |
25.5 |
25.7 |
25.9 |
0.051 | |
| Risk factors | ||||||
| Current smokers-n (%) | 756 (44.4) | 219 (39.0) | 239 (43.7) | 298 (50.3) | ||
| Family history of CAD-n (%) | 546 (32.1) | 177 (31.5) | 174 (31.8) | 195 (32.9) | 0.858 | |
| Hypertension-n (%) | 1080 (63.5) | 368 (64.8) | 358 (65.4) | 358 (60.5) | 0.163 | |
| Diabetes-n (%) | 787 (46.3) | 281 (50.0) | 259 (47.3) | 247 (41.7) | 0.016 | |
| Dyslipidemia-n (%) | 1366 (80.3) | 453 (80.6) | 438 (80.1) | 475 (80.2) | 0.974 | |
| CKD-n (%) | 52 (3.1) | 33 (5.9) | 12 (2.2) | 7 (1.2) | ||
| Previous MI-n (%) | 325 (19.1) | 125 (22.2) | 101 (18.5) | 99 (16.7) | 0.052 | |
| Past PCI-n (%) | 338 (19.9) | 119 (21.2) | 109 (19.9) | 110 (18.6) | 0.544 | |
| PAD-n (%) | 177 (10.4) | 78 (13.9) | 61 (11.2) | 38 (6.4) | ||
| Heart Failure-n (%) | 118 (6.9) | 72 (12.8) | 31 (5.7) | 15 (2.5) | ||
| LVEF (%) | 63 |
62 |
63 |
64 |
0.002 | |
| Killip class |
63 (3.7) | 40 (7.1) | 18 (3.3) | 5 (0.8) | ||
| SBP on admission (mmHg) | 130 |
130 |
130 |
129 |
0.562 | |
| HR on admission (bmp) | 69 |
69 |
69 |
69 |
0.979 | |
| GRACE risk score | 104 |
113 |
103 |
96 |
||
| Type of ACS | ||||||
| UA-n (%) | 1261 (74.1) | 401 (71.4) | 399 (72.9) | 461 (77.9) | 0.030 | |
| NSTEMI-n (%) | 222 (13.1) | 74 (13.2) | 76 (13.9) | 72 (12.2) | 0.683 | |
| STEMI-n (%) | 218 (12.8) | 87 (15.5) | 72 (13.2) | 59 (10.0) | 0.019 | |
| Laboratory measurements | ||||||
| TSH (mIU/L) | 2.08 |
2.24 |
2.08 |
1.94 |
||
| FT4 (pmol/L) | 11.37 |
11.00 |
11.52 |
11.59 |
||
| hsCRP (mmol/L) | 1.36 (0.65–3.49) | 1.68 (0.72–5.05) | 1.34 (0.67–3.40) | 1.21 (0.55–2.63) | ||
| TG (mmol/L) | 1.45 (1.01–2.07) | 1.43 (0.98–2.01) | 1.43 (1.03–2.10) | 1.50 (1.03–2.10) | 0.364 | |
| TC (mmol/L) | 4.15 |
4.11 |
4.10 |
4.24 |
0.028 | |
| HDL-C (mmol/L) | 1.03 |
1.02 |
1.02 |
1.04 |
0.078 | |
| LDL-C (mmol/L) | 2.45 |
2.42 |
2.40 |
2.51 |
0.020 | |
| FPG (mmol/L) | 5.81 (5.23–6.94) | 5.89 (5.26–7.14) | 5.78 (5.24–6.83) | 5.73 (5.19–6.85) | 0.104 | |
| Glycosylated hemoglobin (%) | 6.1 (5.6–7.1) | 6.2 (5.7–7.2) | 6.1 (5.5–7.1) | 6.0 (5.5–7.0) | 0.011 | |
| Angiographic findings | ||||||
| LM/three-vessel disease-n (%) | 81 (4.8) | 21 (3.7) | 30 (5.5) | 30 (5.1) | 0.358 | |
| Two-vessel disease-n (%) | 488 (28.7) | 140 (24.9) | 167 (30.5) | 181 (30.6) | 0.054 | |
| One-vessel disease-n (%) | 260 (15.3) | 79 (14.1) | 86 (15.7) | 95 (16.0) | 0.606 | |
| Proximal LAD stenosis-n (%) | 857 (50.4) | 286 (50.9) | 272 (49.7) | 299 (50.5) | 0.925 | |
| SYNTAX score | 21.3 |
21.7 |
20.9 |
21.1 |
0.245 | |
| Procedural results | ||||||
| DES-n (%) | 1398 (82.2) | 455 (81.0) | 447 (81.7) | 496 (83.8) | 0.430 | |
| BRS-n (%) | 94 (5.5) | 36 (6.4) | 33 (6.0) | 25 (4.2) | 0.220 | |
| Complete revascularization-n (%) | 1048 (61.6) | 318 (56.6) | 349 (63.8) | 381 (64.4) | 0.011 | |
| Medication at discharge | ||||||
| Aspirin-n (%) | 1685 (99.1) | 552 (98.2) | 543 (99.3) | 590 (99.7) | 0.033 | |
| Clopidogrel-n (%) | 1563 (91.9) | 526 (93.6) | 507 (92.7) | 530 (89.5) | 0.029 | |
| Ticagrelor-n (%) | 138 (8.1) | 36 (6.4) | 40 (7.3) | 62 (10.5) | 0.029 | |
| Statins-n (%) | 1701 (100.0) | 571 (100.0) | 571 (100.0) | 559 (100.0) | ||
| ACEI/ARBs-n (%) | 822 (48.3) | 299 (53.2) | 272 (49.7) | 251 (42.4) | 0.001 | |
| Beta-blockers-n (%) | 1193 (70.1) | 407 (72.4) | 371 (67.8) | 415 (70.1) | 0.247 | |
| The groups were stratified by the tertiles of FT3. | ||||||
During the 927-day (IQR, 927–1109 days) follow-up period, 349 (20.5%) patients
with ACS undergoing PCI developed MACE, which included 44 (2.6%) all-cause
death, 22 (2.6%) ischemic stroke, 41 (2.4%) MI, and 242 (14.2%) unplanned
repeat revascularization. The incidence of adverse events was compared among
groups divided by the tertiles of the FT3 level. Patients in lowest level of FT3
had a significantly higher incidence of MACE than the highest and middle groups
(31.5% versus 15.0% and 15.2%; chi-square p
| Cardiovascular outcomes | Lowest group (n = 562) | Middle group (n = 547) | Highest group (n = 592) | p valve |
| MACE | 177 (31.5%) | 83 (15.2%) | 89 (15.0%) | |
| All-cause death | 33 (5.9%) | 5 (0.9%) | 6 (1.0%) | |
| Nonfatal stroke | 14 (2.5%) | 4 (0.7%) | 4 (0.7%) | 0.009 |
| Nonfatal MI | 24 (4.3%) | 7 (1.3%) | 10 (1.7%) | 0.002 |
| Unplanned repeat revascularization | 106 (18.9%) | 67 (12.2%) | 69 (11.7%) | 0.001 |
| The groups were stratified by the tertiles of FT3. | ||||
Kaplan-Meier curves for survival free of any MACE and its individual components
according to the tertiles of FT3 levels are shown in Fig. 2. The survival free of
MACE in the lowest FT3 tertile group was significantly lower than that in the
highest and middle groups at follow-up (Fig. 2a, Log-rank p
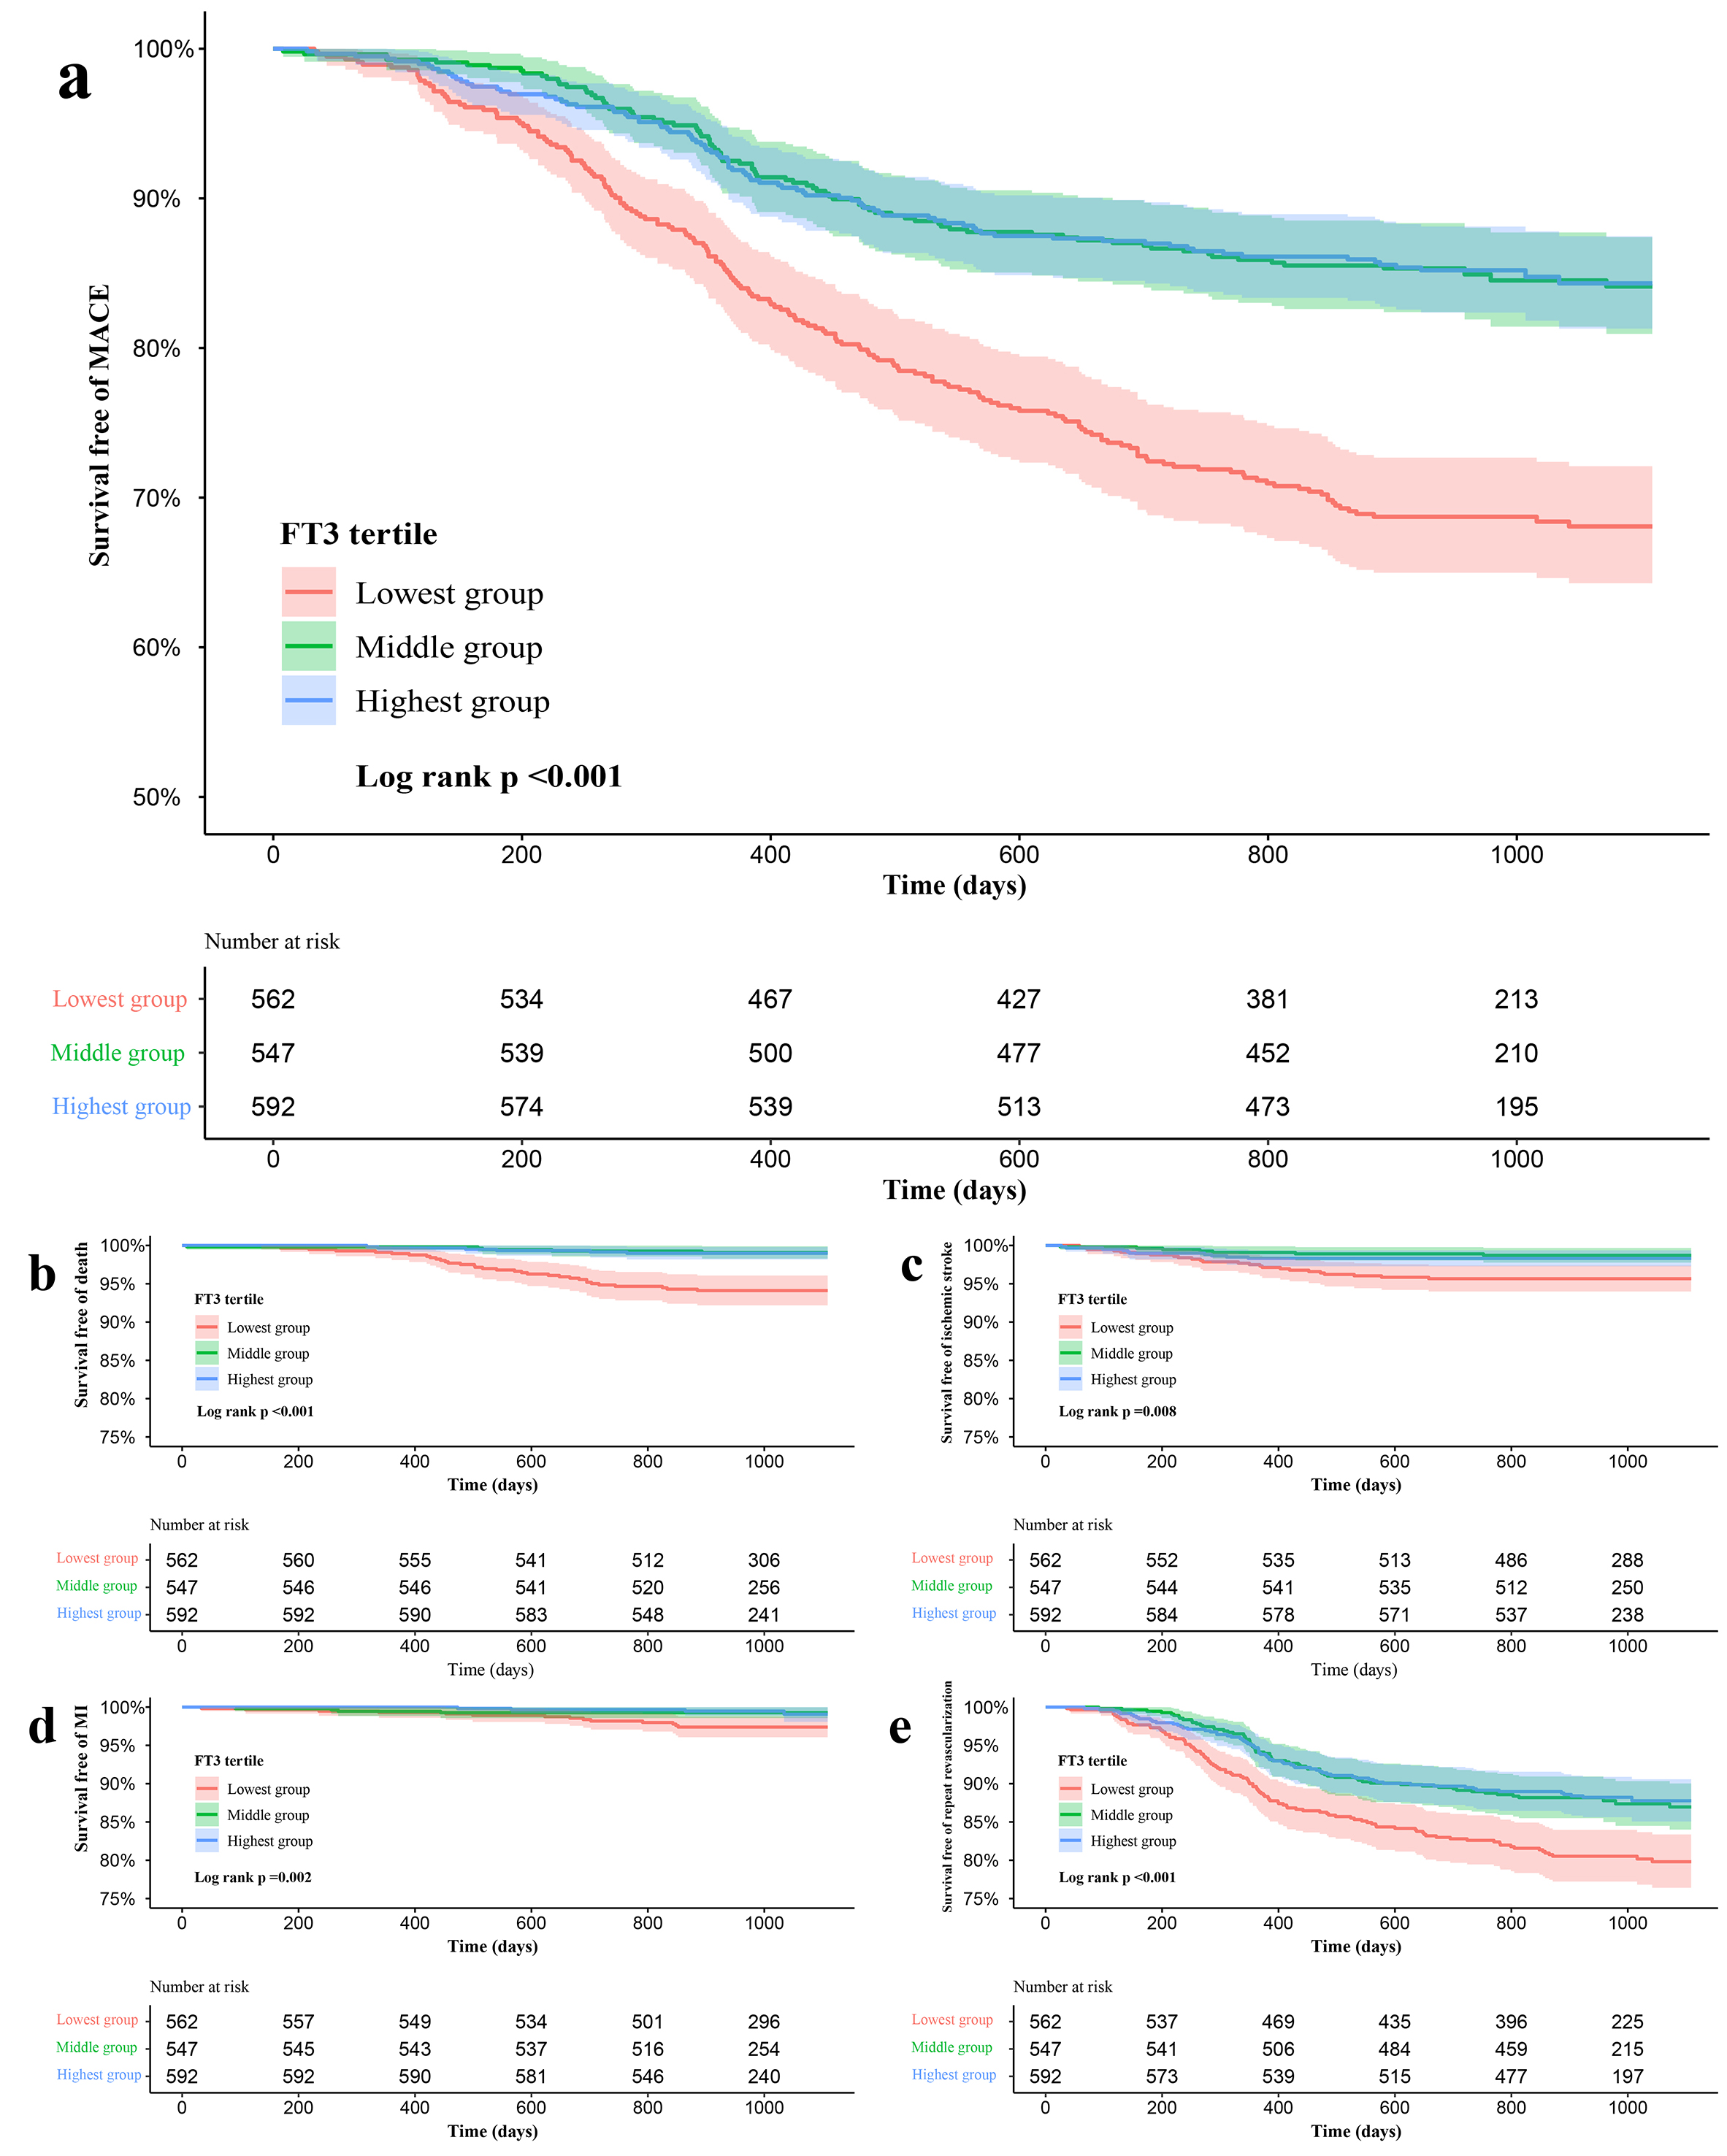 Fig. 2.
Kaplan-Meier curves for no events survival according to the tertiles of FT3. (a) Kaplan-Meier curves for MACE. (b) Kaplan-Meier curves for All-cause death. (c) Kaplan-Meier curves for ischemic stroke. (d) Kaplan-Meier curves for MI. (e) Kaplan-Meier curves for Unplanned repeat revascularization.
In Cox regression analysis, compared with the highest tertile, the middle
tertile had a similar risk of MACE (HR = 0.986, 95% CI 0.728–1.336), but
patients with the lowest tertile had a 92.9% higher risk of MACE (HR = 1.929,
95% CI 1.467–2.535, p
| Variables | Univariate analysis | Multivariate analysis | ||||
| HR (95% CI) | p value | HR (95% CI) | p value | |||
| MACE | ||||||
| FT3 tertiles | ||||||
| Highest group | Ref | Ref | ||||
| Middle group | 0.999 (0.741–1.348) | 0.997 | 0.986 (0.728–1.336) | 0.929 | ||
| Lowest group | 2.275 (1.763–2.935) | 1.929 (1.467–2.535) | ||||
| Age | 1.007 (0.997–1.017) | 0.172 | 0.995 (0.977–1.013) | 0.589 | ||
| Sex | 1.036 (0.804–1.334) | 0.784 | 0.874 (0.640–1.194) | 0.397 | ||
| Current smoking | 1.144 (0.927–1.411) | 0.210 | 1.248 (0.970–1.605) | 0.085 | ||
| Hypertension | 1.065 (0.855–1.326) | 0.576 | 1.172 (0.907–1.515) | 0.224 | ||
| Diabetes | 1.549 (1.254–1.913) | 1.373 (1.099–1.716) | 0.005 | |||
| Dyslipidemia | 1.333 (1.002–1.774) | 0.049 | 0.758 (0.539–1.067) | 0.112 | ||
| HF | 1.903 (1.369–2.645) | 1.438 (0.912–2.267) | 0.118 | |||
| CKD | 2.729 (1.771–4.204) | 1.841 (1.143–2.967) | 0.012 | |||
| Previous MI | 1.507 (1.186–1.915) | 0.935 (0.697–1.253) | 0.651 | |||
| Past PCI | 1.553 (1.227–1.966) | 1.608 (1.213–2.132) | 0.001 | |||
| Types of ACS | ||||||
| UA | Ref | Ref | ||||
| NSTEMI | 1.160 (0.857–1.571) | 0.337 | 0.977 (0.597–1.599) | 0.926 | ||
| STEMI | 1.025 (0.747–1.408) | 0.877 | 0.964 (0.456–2.036) | 0.923 | ||
| GRACE risk score | 1.003 (1.000–1.005) | 0.052 | 0.999 (0.991–1.006) | 0.711 | ||
| TG | 1.110 (1.051–1.173) | 1.049 (0.980–1.121) | 0.166 | |||
| HDL-C | 0.379 (0.235–0.611) | 0.438 (0.237–0.810) | 0.009 | |||
| LDL-C | 1.185 (1.049–1.338) | 0.006 | 1.229 (1.070–1.411) | 0.004 | ||
| hsCRP | 1.034 (1.019–1.049) | 1.019 (1.001–1.037) | 0.041 | |||
| TSH | 1.187 (1.078–1.307) | 1.104 (0.995–1.226) | 0.063 | |||
| FT4 | 0.861 (0.801–0.924) | 0.889 (0.824–0.960) | 0.003 | |||
| Complete revascularization | 0.416 (0.337–0.515) | 0.576 (0.453–0.733) | ||||
| SYNTAX score | 1.035 (1.026–1.044) | 1.025 (1.014–1.037) | ||||
| Medication at discharge | ||||||
| Aspirin | 0.242 (0.129–0.454) | 0.454 (0.233–0.882) | 0.020 | |||
| ACEI/ARBs | 1.139 (0.923–1.405) | 0.224 | 0.911 (0.716–1.158) | 0.444 | ||
| Beta-Blockers | 0.769 (0.617–0.958) | 0.019 | 0.653 (0.519–0.822) | |||
| The groups were stratified by the tertiles of FT3. | ||||||
A subgroup analysis was performed to further estimate the risk stratification
value of FT3 level for MACE in the study population. The association between
decreased FT3 level and higher risk of MACE was consistent between several
patient characteristics including sex [HR (95% CI), 2.025 (1.006–4.074) Female,
p = 0.048 vs. 1.830 (1.351–2.480) Male, p
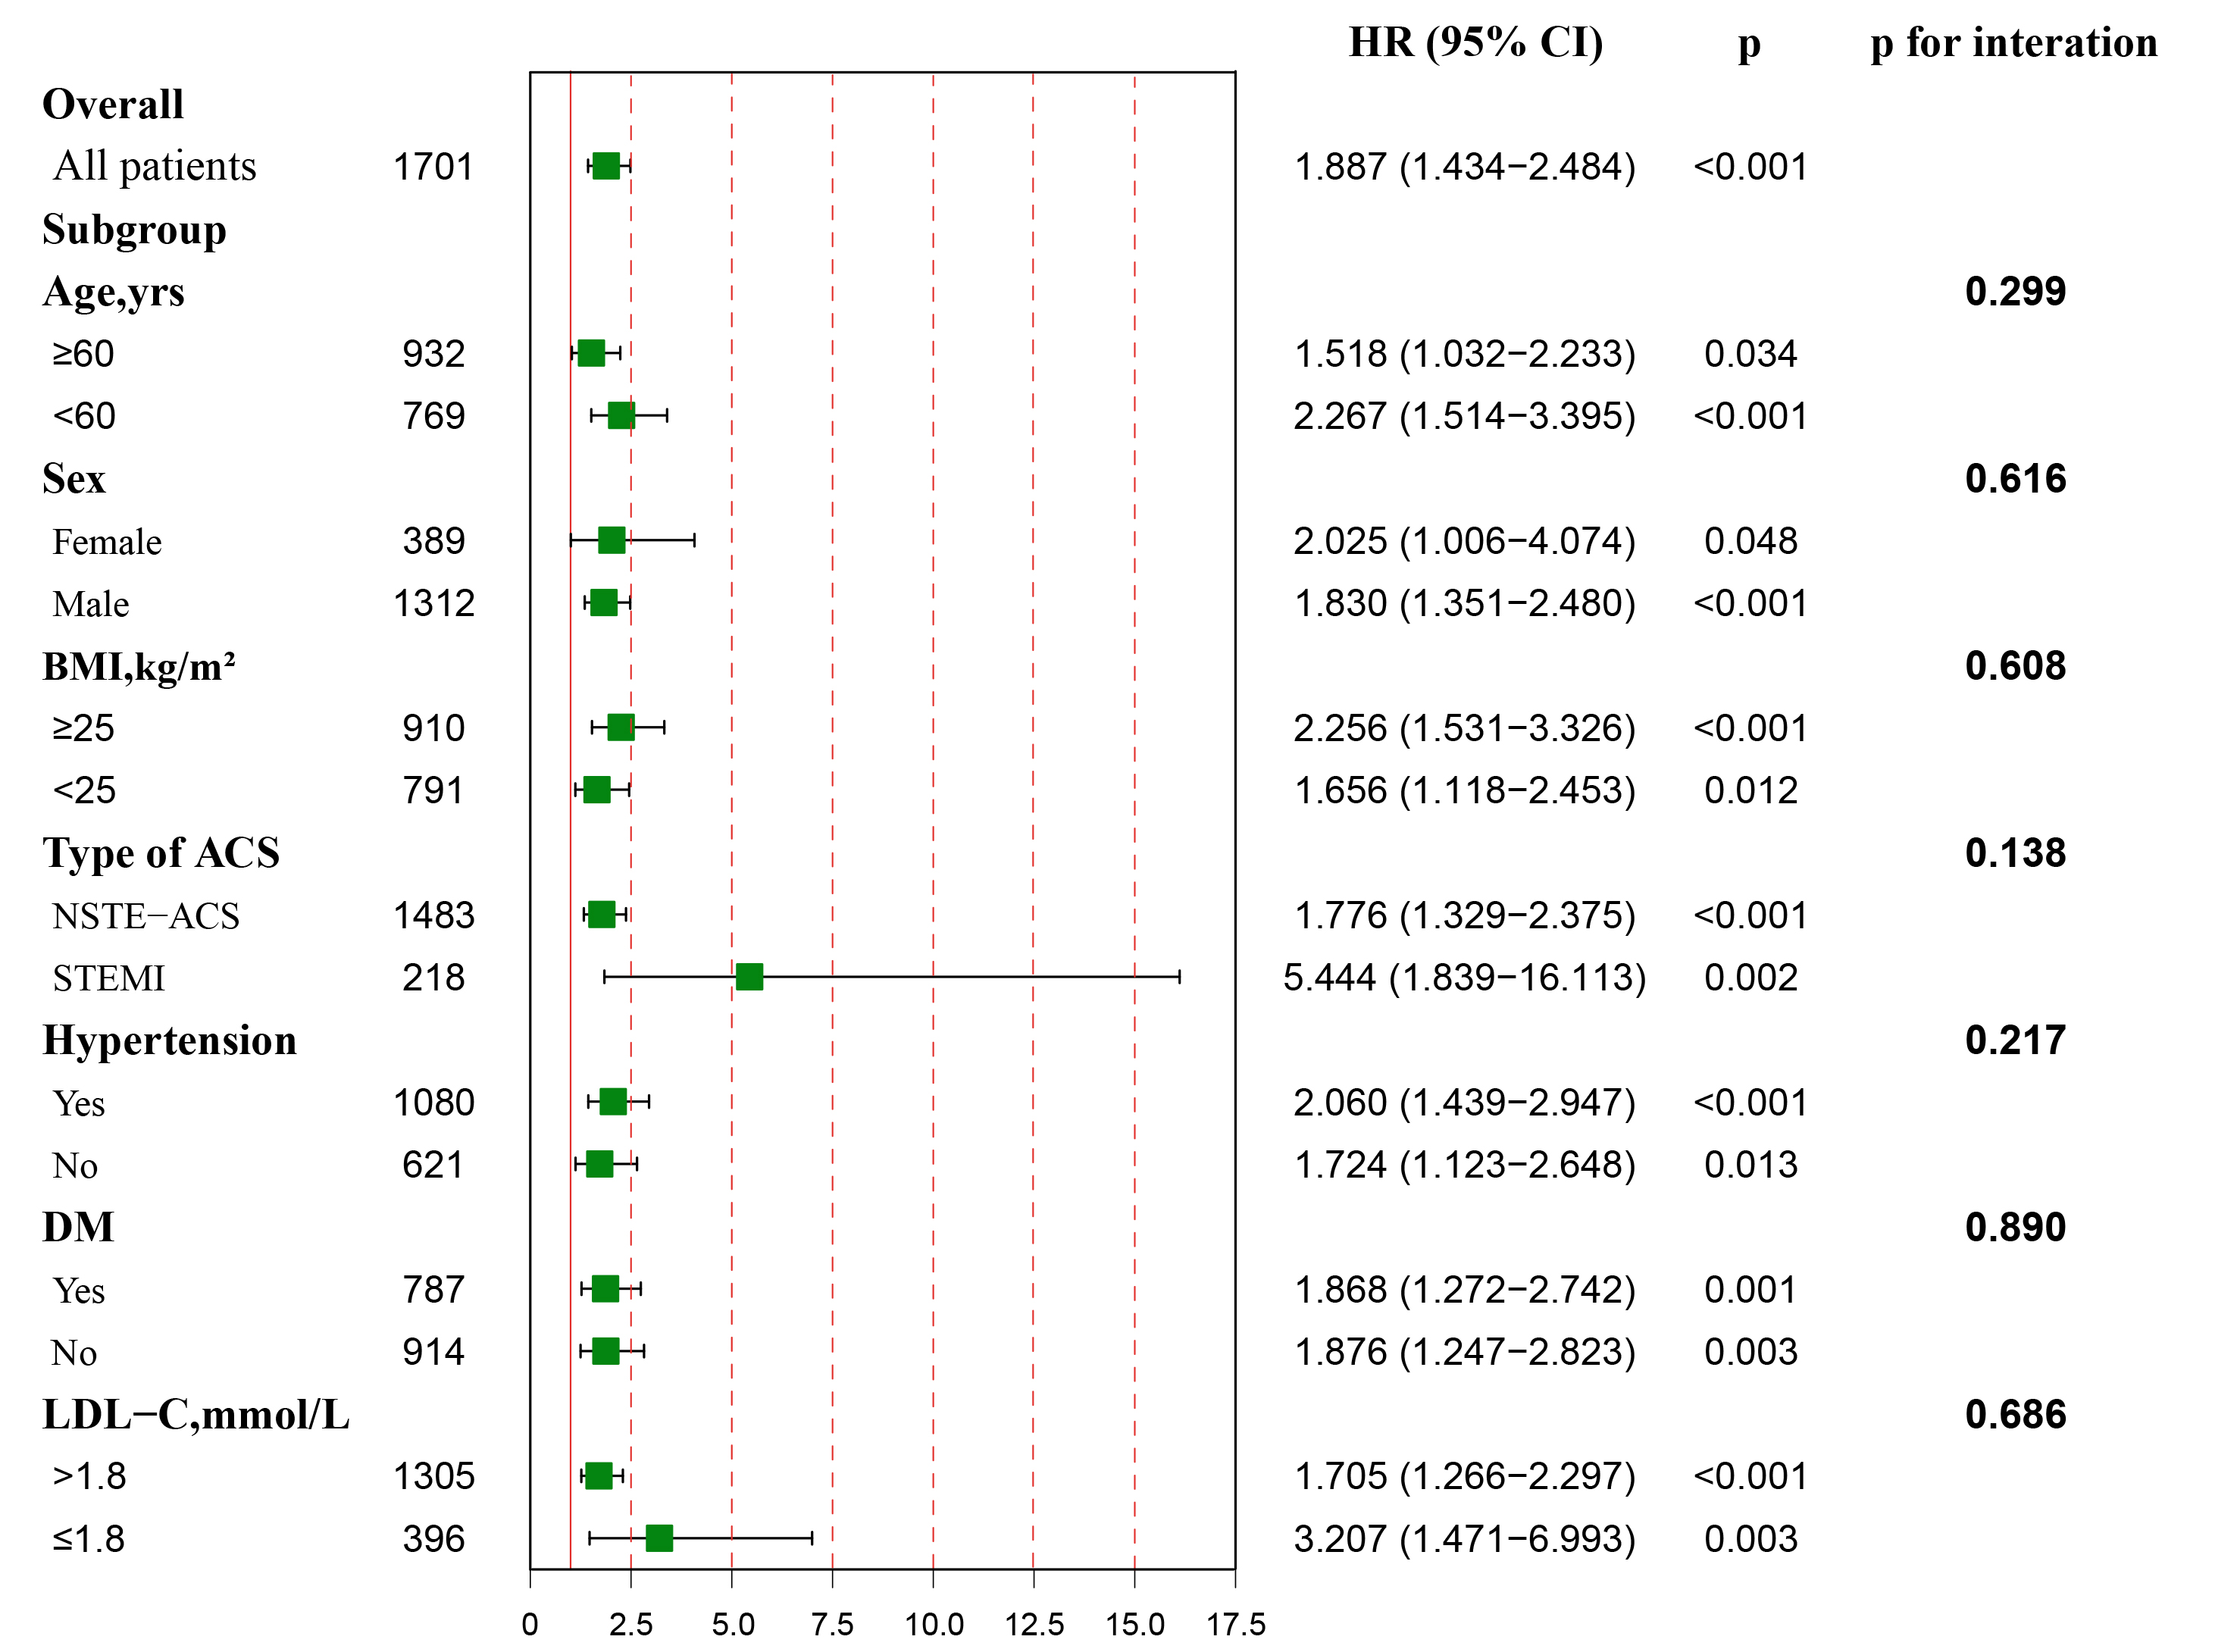 Fig. 3.
Association between FT3 levels and the risk of MACE in overall and subgroups. Hazard ratio (HR) was calculated by multivariate Cox regression analysis. The analysis was performed after adjusting for variates including age, gender, BMI, current smoking, hypertension, DM, dyslipidemia, HF, CKD, previous MI, past PCI, Type of ACS, GRACE risk score, TG, HDL-C, LDL-C, hs-CRP, TSH, FT4, complete revascularization, SYNTAX score, medication at discharge (aspirin, ACEI/ARBs, Beta-blockers). Red vertical solid line represents the HR value of 1.
Restricted cubic splines were used to investigate the relationships between FT3
and MACE and each component of MACE. Fig. 4 showed a non-linear association
between FT3 and MACE, all-cause death and unplanned repeat revascularization (all
p values for non-linear association
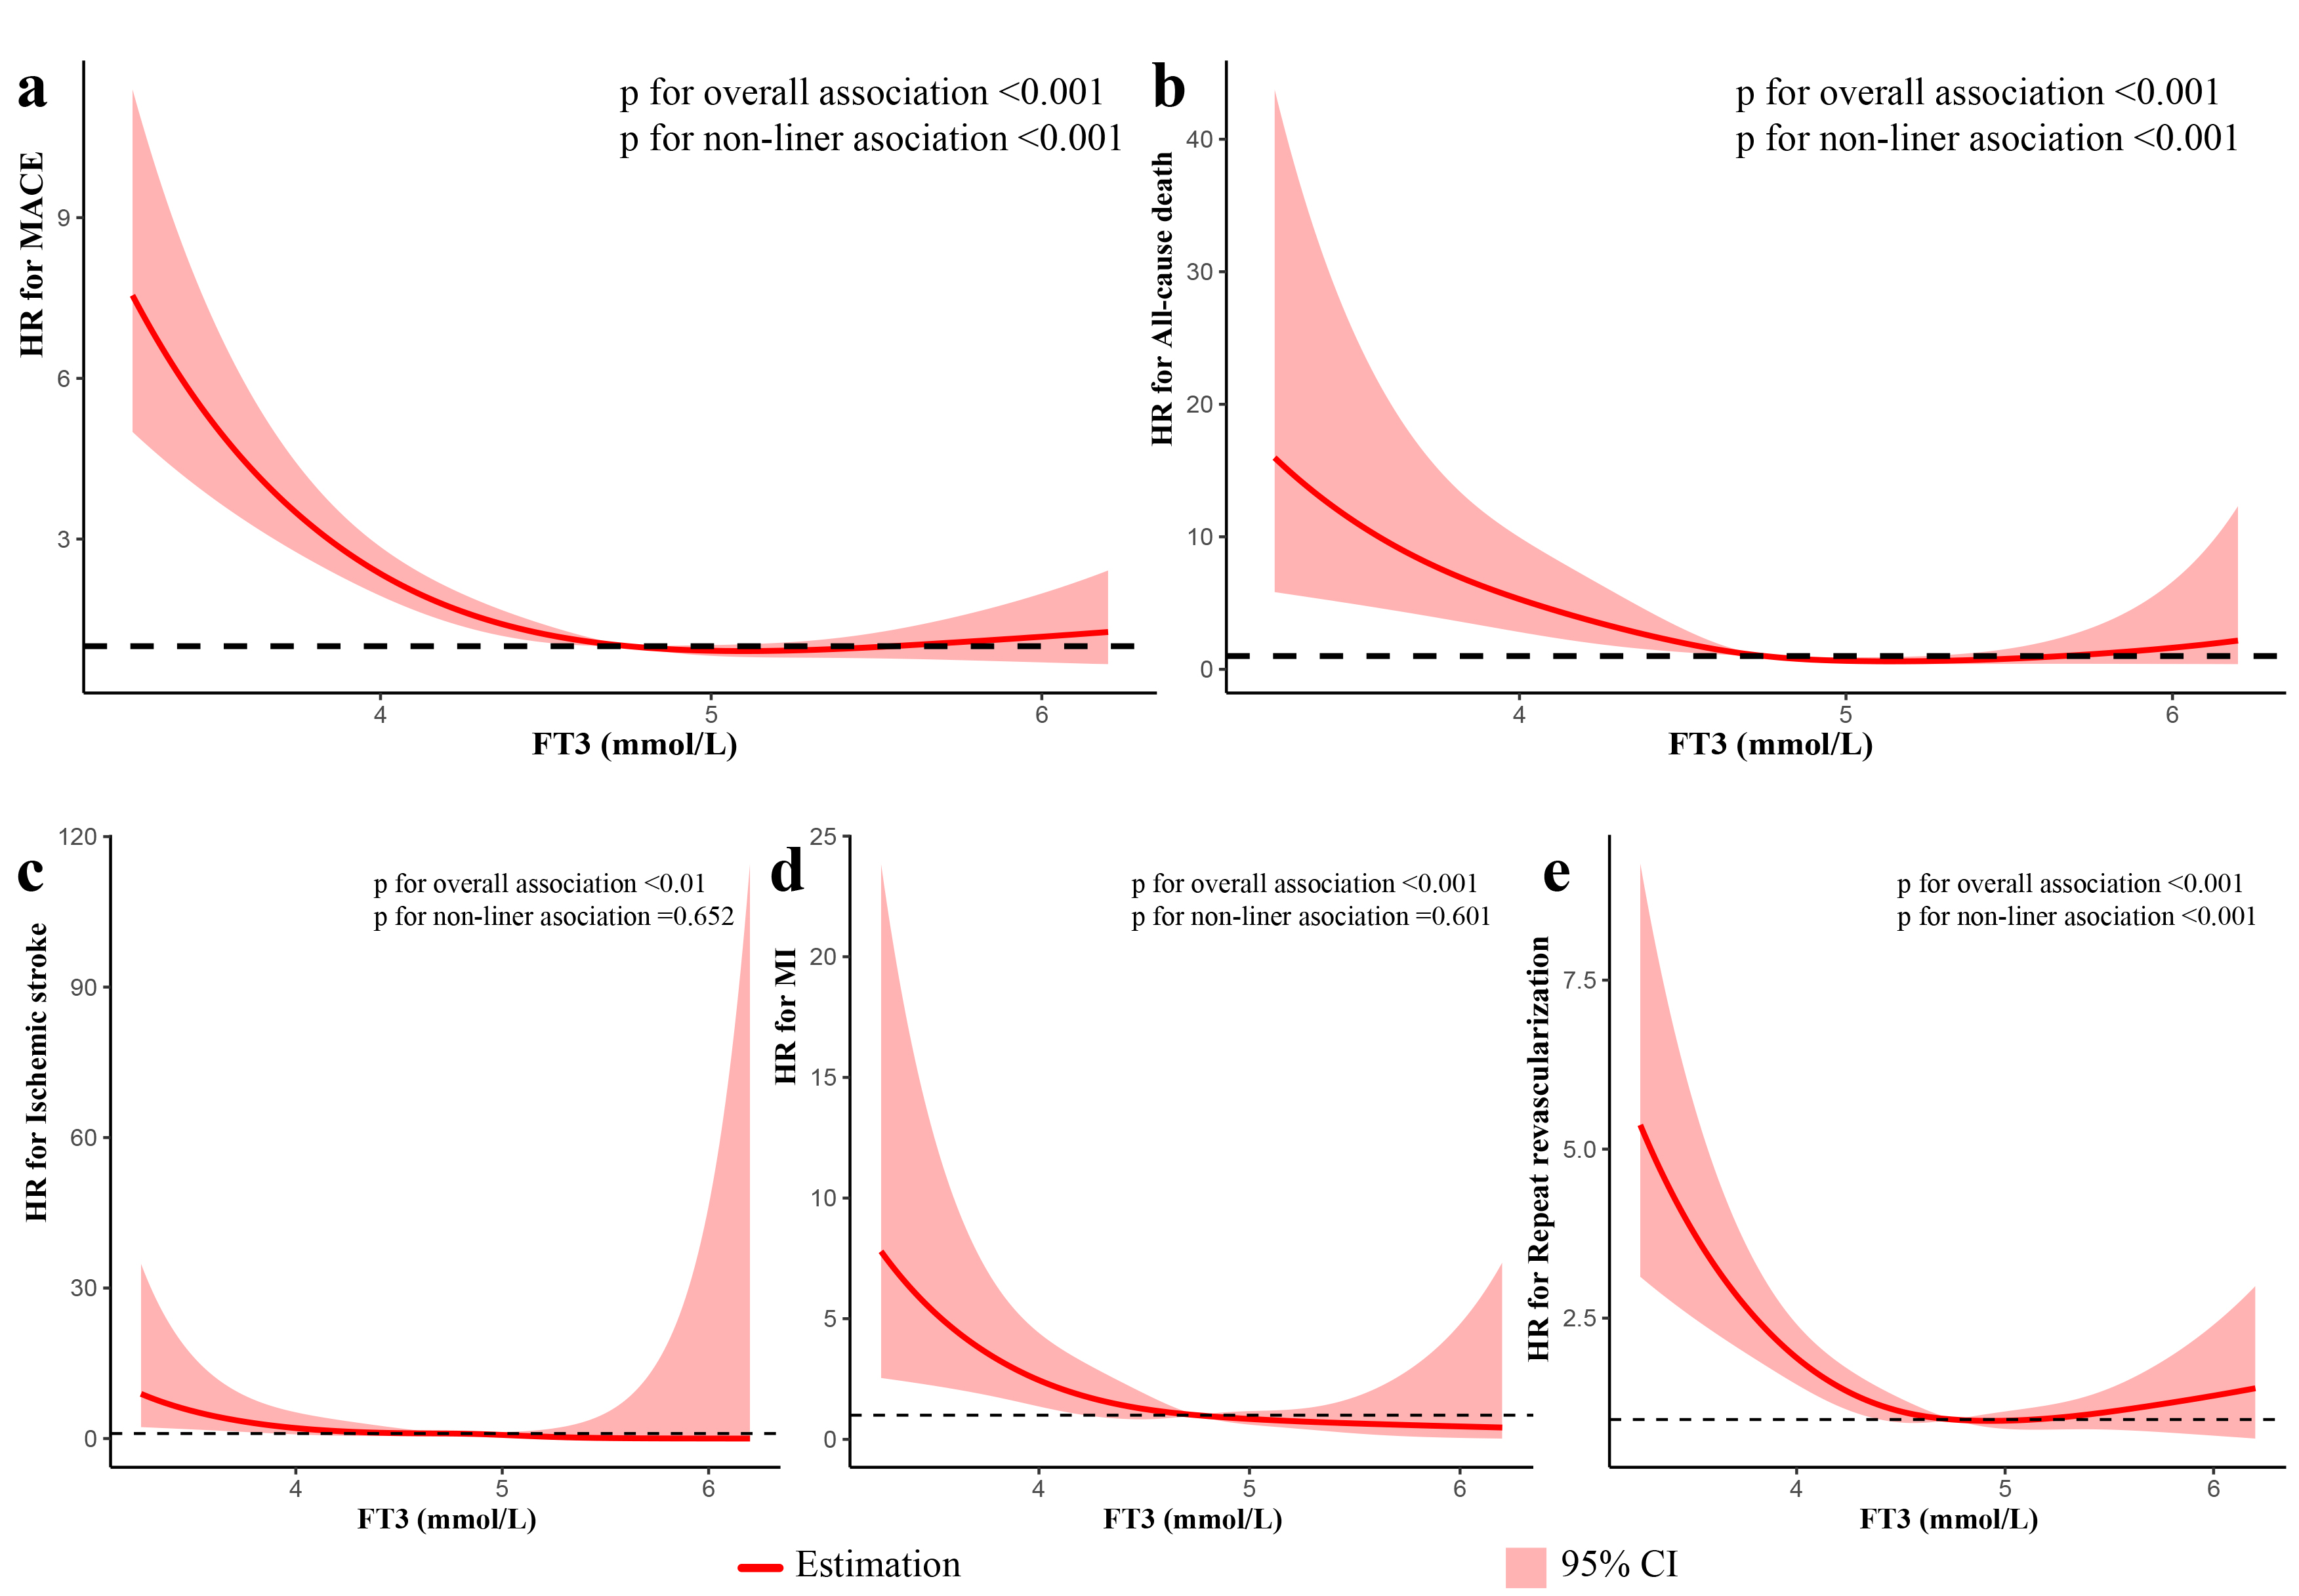 Fig. 4.
Restricted spline curves for the associations of FT3 with MACE and each component of MACE in patients with ACS undergoing PCI in univariate analysis. The red lines represent the hazard ratio, and the shaded area represents the 95% confidence intervals (CI). (a) Association of FT3 with MACE. (b) Association of FT3 with All-cause death. (c) Association of FT3 with ischemic stroke. (d) Association of FT3 with MI. (e) Association of FT3 with Unplanned repeat revascularization.
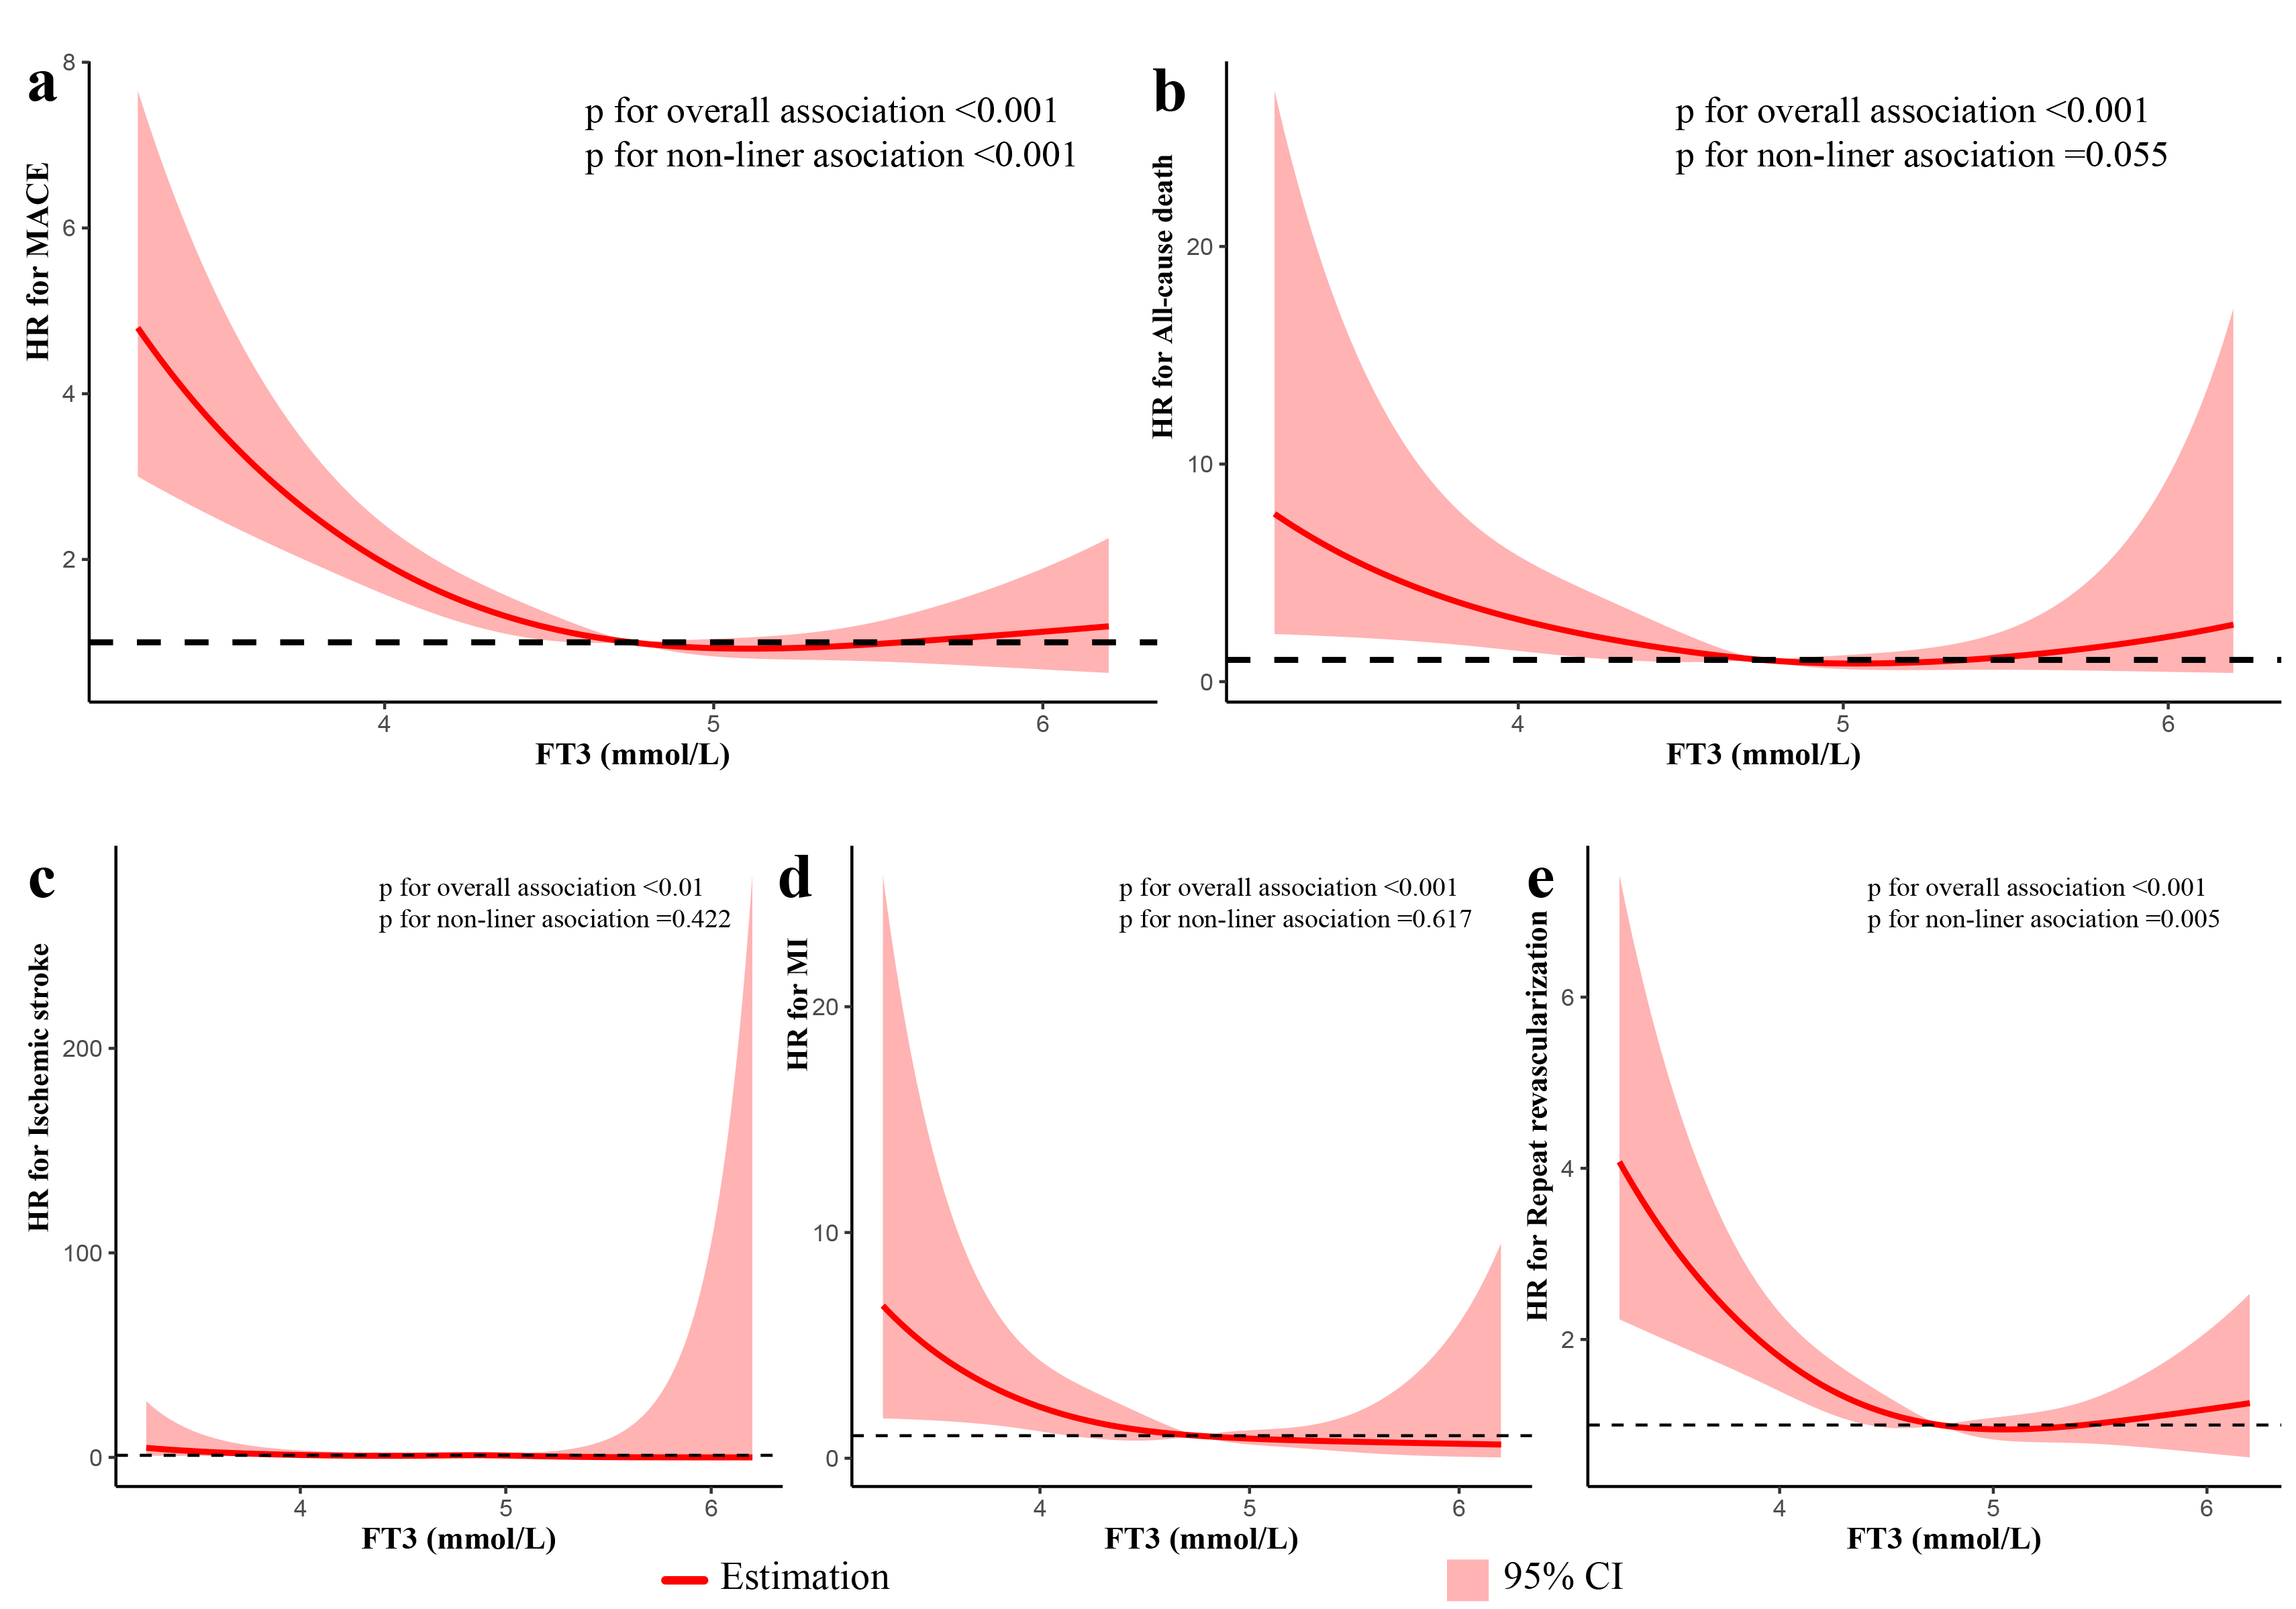 Fig. 5.
Restricted spline curves for the associations of FT3 with MACE and each component of MACE in patients with ACS undergoing PCI in multivariate analysis. The analysis was performed after adjusting for variates including age, gender, BMI, current smoking, hypertension, DM, dyslipidemia, HF, CKD, previous MI, past PCI, Type of ACS, GRACE risk score, TG, HDL-C, LDL-C, hs-CRP, TSH, FT4, complete revascularization, SYNTAX score, medication at discharge (aspirin, ACEI/ARBs, Beta-blockers). The red lines represent the hazard ratio, and the shaded area represents the 95% confidence intervals (CI). (a) Association of FT3 with MACE. (b) Association of FT3 with All-cause death. (c) Association of FT3 with ischemic stroke. (d) Association of FT3 with MI. (e) Association of FT3 with Unplanned repeat revascularization.
The baseline risk model included risk factors such as age, sex, current smoking,
hypertension, diabetes, dyslipidemia, HF, CKD, previous MI, past PCI, types of
ACS, GRACE risk score, TG, HDL-C, LDL-C, hs-CRP, hTSH, FT4, complete
revascularization, SYNTAX score, and medication at discharge (aspirin, ACEI/ARB,
Beta-Blockers). The addition of the
tertiles of FT3 level has a significant incremental effect on baseline tables for
predicting the risk of MACE (AUC: baseline risk model, 0.732 vs. baseline risk
model + FT3 level, 0.745,
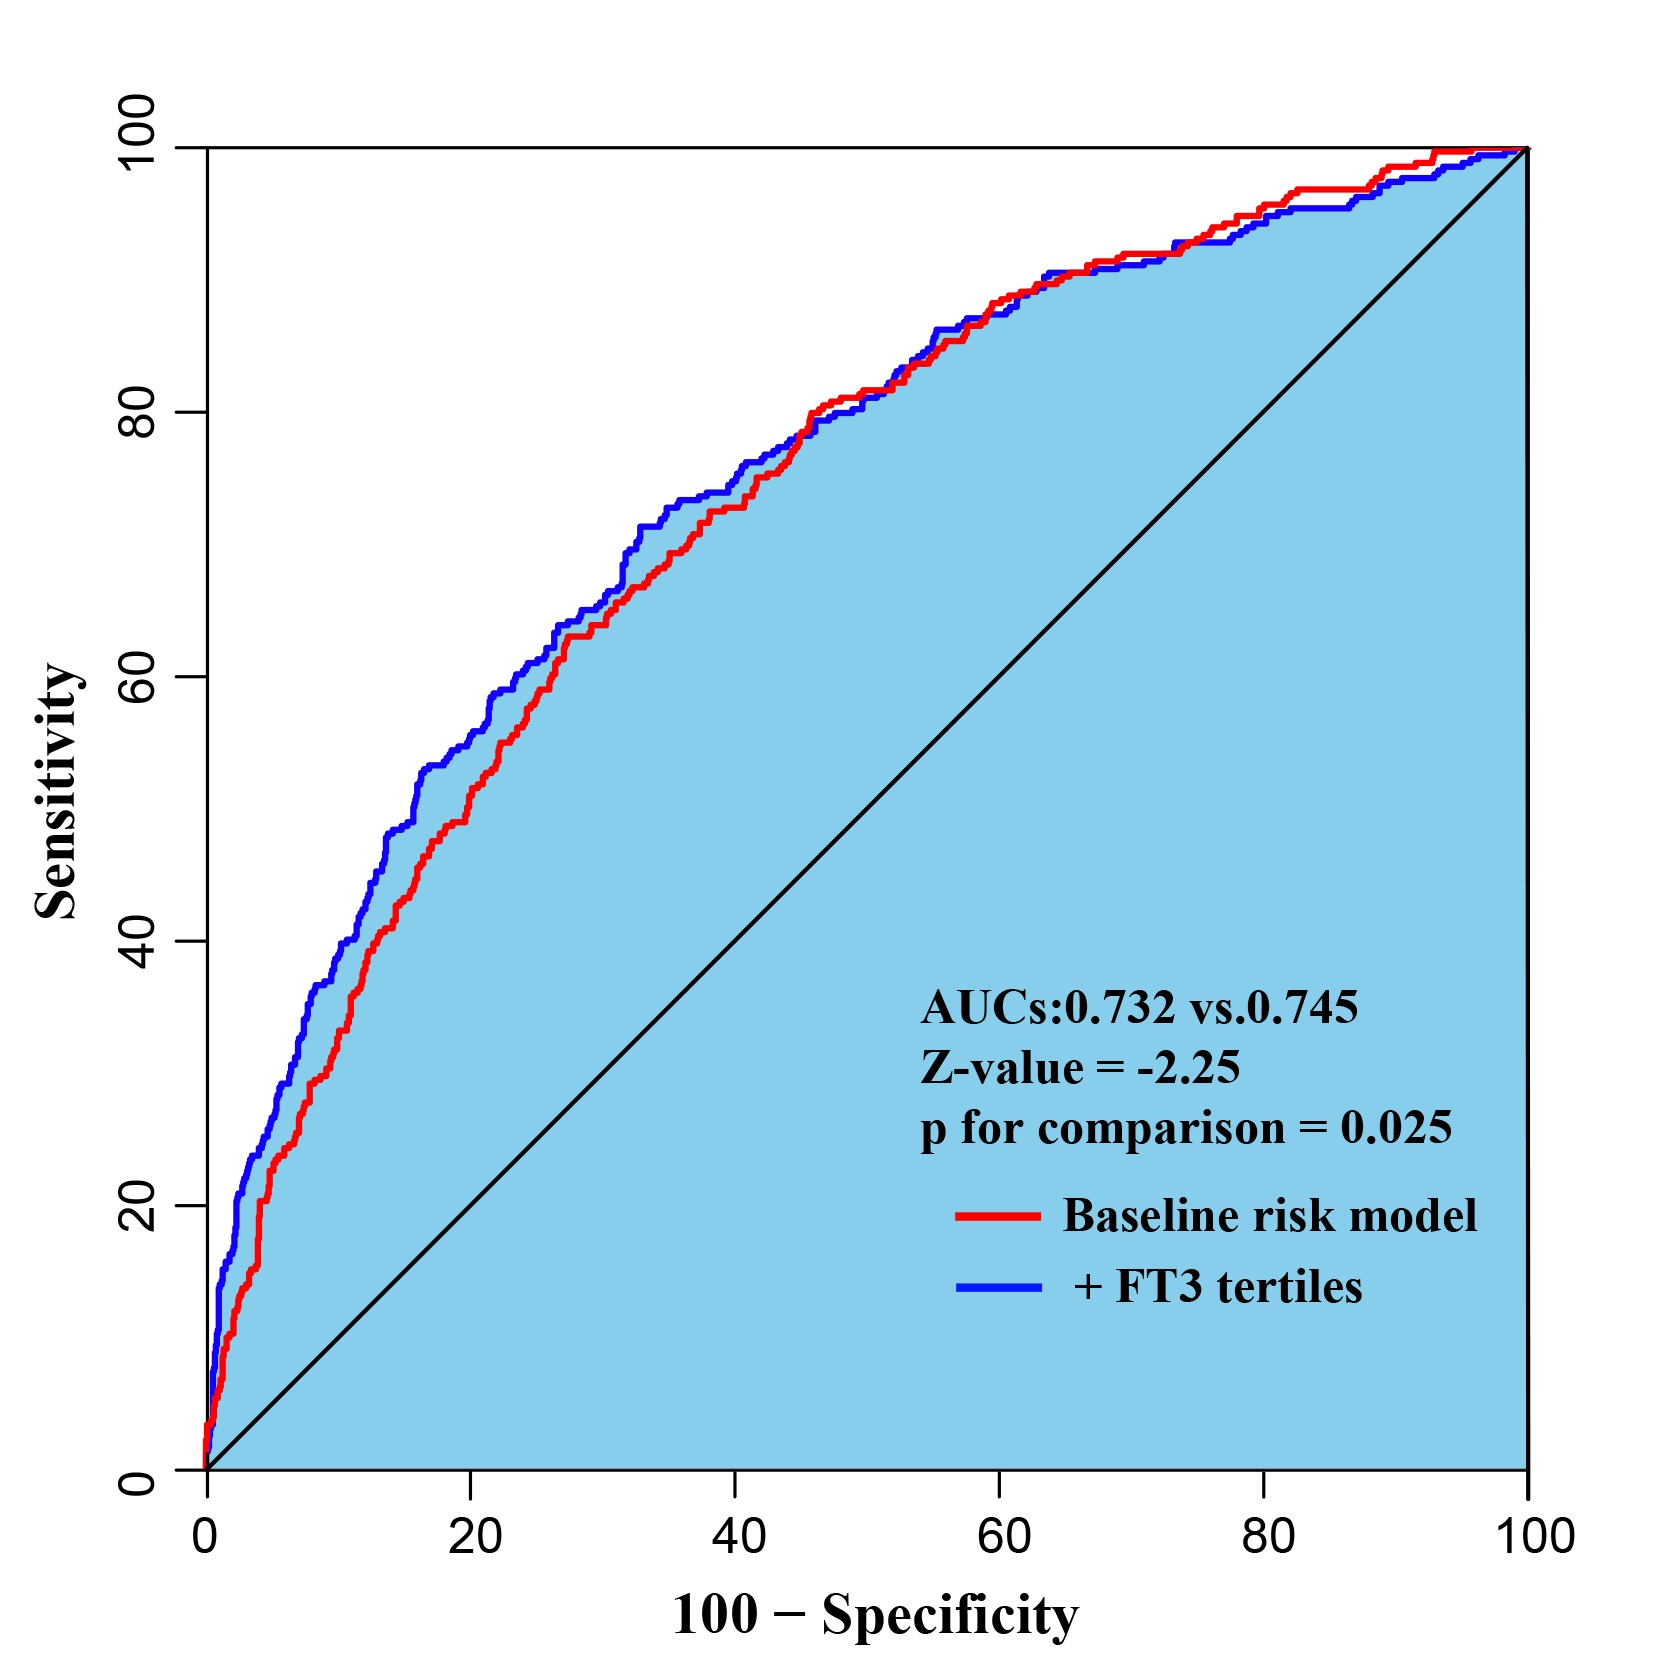 Fig. 6.
Receiver operating characteristic curves evaluating incremental effect of FT3 beyond baseline risk model. The baseline risk model includes age, sex, current smoking, hypertension, diabetes, dyslipidemia, HF, CKD, previous MI, past PCI, types of ACS, GRACE risk score, TG, HDL-C, LDL-C, hs-CRP, hTSH, FT4, complete revascularization, SYNTAX score, medication at discharge (aspirin, ACEI/ARB, Beta-Blockers).
The present study retrospectively investigated the predictive value of FT3 levels for adverse cardiovascular events in ACS patients undergoing PCI. The major findings are: (1) compared with the highest level of FT3, those with lower FT3 levels had a significantly higher incidence of MACE; (2) decreased FT3 levels were an independent predictor of poor prognosis; (3) there was a non-linear association between FT3 level and MACE, and unplanned repeat revascularization, but not with all cause death, ischemic stroke and MI; (4) the additional prognosis value of the baseline risk model was found after adding the tertiles of each FT3 level.
Thyroid hormone has a direct effect on the cardiac, and is an important
regulator of cardiac function and hemodynamics [2]. Thyroid hormones affect
cardiac status: (1) by direct genomic actions on cardiomyocytes via binding to
nuclear receptors, which regulates the expression of target genes encoding
sodium/potassiumtransporting ATPases,
Thyroid hormone metabolism disorders increase the risk of CAD and cardiovascular death, therefore evaluation of FT3 levels may benefit to identify patients who are susceptible to cardiovascular disease [16, 17, 18]. Therefore, assessment of FT3 levels has important clinical significance for risk stratification and individualized treatment of such patients.
Previous studies have found that patients with overt hyperthyroidism present with hyperdynamic circulation, such as increased cardiac preload and contractility, decreased systemic vascular resistance, increased heart rate, increased systolic blood pressure and pulmonary hypertension, while overt hypothyroidism is associated with a reduction in cardiac output and cardiac contractility, decreased heart rate, increased peripheral vascular resistance, dyslipidemia, and atherosclerotic plaque development and instability [1, 4, 5, 11]. Both overt hyperthyroidism and hypothyroidism are significantly associated with a higher incidence of adverse cardiovascular events [19, 20, 21, 22]. Even CAD patients with mild thyroid dysfunction and subclinical hyperthyroidism may also experience adverse cardiovascular events, such as supraventricular tachyarrhythmias, especially atrial fibrillation [23], and subclinical hypothyroidism is a strong indicator for the risk of atherosclerosis and myocardial infarction [1, 24, 25], both of which may markedly increase cardiovascular morbidity and mortality.
Several studies have shown a significant correlation between FT3 levels and adverse cardiovascular events. Lower FT3 levels have been correlated with HF, lower LVEF and serum biomarkers of myocardial injury, such as troponin T (cTnT) and N-terminal pro-brain natriuretic peptide (NT-proBNP) [26, 27]. Lymvaios et al. [28] found a significant correlation of low T3 with impaired ventricular function in patients with acute MI (AMI), and that T3 levels appear to be an independent predictor of late functional recovery. In addition, D. H. Kim et al. [29] reported that in STEMI patients, the degree of transmural involvement accessed by contrast-enhanced cardiac magnetic resonance (CMR) imaging is strongly correlated with T3 levels. Chang et al. [30] demonstrated that low FT3 levels was an independent indicator of long-term worse prognosis in STEMI patients undergoing PCI. Other studies also found that low T3 levels have been correlated with short and long-term mortality in STEMI patients undergoing PCI [9, 31]. Similar to patients with STEMI, NSTE-ACS patients with low FT3 levels had an increased risk of mortality during 1-month and 1-year follow-up [17]. Furthermore, reverse T3 (rT3) was independently associated with 1-year mortality [32]. In most of the above studies, PCI was not performed in all the study populations; therefore, whether PCI combined with the FT3 level improves the prognostic value of the baseline risk factors is controversial. Our study is unique in that all patients received PCI, and therefore allowed us to assess the prognostic value of the FT3 level and its incremental effect on risk stratification based on traditional risk factors in these patients.
In the study, we found that low FT3 has an impact on cardiovascular system and clinical outcomes. However, there are a large number of factors contributing to low FT3, such as demographic factors (age, gender and BMI [33, 34, 35, 36]), lifestyle factors (alcohol consumption [37]), diet (soy-based food [38, 39], olive oil [40]), exercise [41, 42], pollutants (chemicals and heavy metals) [43]. We also found that age, gender and BMI, which were all associated with low FT3, were significantly different from MACE. Besides, after multivariate analysis, decreased FT3 levels were an independent predictor of poor prognosis.
Rapid down-regulation of the thyroid hormone system in patients with acute
myocardial ischemia might be of great help to reducing oxygen demands on the
myocardium. Several studies confirmed that the function of pituitary gland and
the release of TSH could directly affected by cytokines, such as Interleukin-6
(IL-6), tumor necrosis factor-
Previous studies have demonstrated that lower FT3 levels have adverse prognostic
value for ACS patients undergoing PCI. Therefore, incorporating assessment and
intervention of thyroid function into long-term management might be beneficial to
these patients. F. Forini et al. [54] found that long-term L-T3
replacement in a rat model after MI reduces the infarct size by 50% and prevents
the progression to HF. K. K. Henderson et al. [57] revealed that T3
treatment to euthyroid levels improves systolic function, and tends to improve
diastolic function in an animal model of myocardial infarction-induced HF. In
clinical studies, J. D. Klemperer et al. [58] found that raising serum
T3 concentration in patients undergoing coronary artery bypass surgery improves
cardiac function, but there was no significant difference in outcomes. A
double-blind, randomized, placebo-controlled trial found that treatment with T3
in children after cardiopulmonary bypass operation improves myocardial function
[53]. A recent RCT found that compared with placebo, patients with subclinical
hypothyroidism and acute MI treated with Levothyroxine did not improve LVEF
during a 52-week follow-up period [59]. The therapeutic mechanisms of action of
TH are not well studied in humans, but in vitro and in vivo disease models have
provided important knowledge of its repair and regeneration properties. The TH
signaling pathway is a universally conserved pathway with pleiotropic effects
that regulates biological development, metabolism and homeostasis, as well as
having an important effect in tissue repair/regeneration. Indeed, a growing
number of experimental and clinical studies suggest that TH may be critical for
recovery after injury. Katzeff H L et al. [60] revealed that T3 can
activate Akt signaling in rat cardiomyocytes, which protects myocytes against
serum starvation-induced cell death, and also found that T3 supplementation
protected myocytes against ischemic-induced apoptosis, which may be mediated by
Akt signaling [61]. In an ischemia/reperfusion model, Pantos et al. [62]
demonstrated that T3 administration had an anti-apoptotic effect associated with
lower levels of p38 mitogen-activated protein kinase (MAPK). Several studies
illustrated that L-T3 therapy increases the expression of hypoxia-inducible
factor-1
This study retrospectively demonstrated the predictive value of FT3 levels for adverse cardiovascular events in ACS patients undergoing PCI, and demonstrated that FT3 levels are a useful predictor in clinical practice and have a positive impact on the traditional risk factors-based risk stratification. There are several limitations. (1) This was a single-center, observational study with strict exclusion criteria, and a relatively small number of patients. Some key data were collected from medical records, so the potential confounders and selections bias could not be completely adjusted, which might limit the application of our results. (2) The FT3 level was measured only once in the present study and the alteration of FT3 levels during follow-up were not known, which may have a greater predictive value for a poor prognosis. (3) Our study does not include rT3 and cytokines, which may diminish its potential correlations. (4) We only analyzed the correlation between FT3 levels and adverse cardiovascular events; other related indicators such as TT3, TT4, FT4, rT3, and the FT3/FT4 ratio might also have some potential influence for cardiovascular events. (5) There are many factors associated with low FT3, we just analyzed a few of them in this observational study.
In ACS patients undergoing PCI, the present study revealed that decreased FT3 levels was significantly associated with a worse prognosis. There was a non-linear association between FT3 and MACE, all-cause death and unplanned repeat revascularization. The addition of FT3 levels to the baseline risk model significantly improved the ability for risk prediction. Additional large scale randomized studies are needed to confirm whether FT3 levels have a positive effect on improving clinical outcomes.
FT3, free triiodothyronine; BMI, body mass index; CAD, coronary artery disease; CKD, chronic kidney disease; MI, myocardial infarction; PCI, percutaneous coronary intervention; PAD, peripheral artery disease; LVEF, left ventricular ejection fraction; SBP, systolic blood pressure; HR, heart rate; GRACE, global registry of acute coronary events; ACS, acute coronary syndrome; UA, unstable angina pectoris; MI, myocardial infraction; NSTEMI, non-ST segment elevation myocardial infarction; STEMI, ST segment elevation myocardial infarction; TSH, thyroid stimulating hormone; FT4, free thyroxine; hsCRP, high-sensitivity C-reactive protein; TG, triglycerides; TC, total cholesterol; HDL-C, high-density lipoprotein-cholesterol; LDL-C, low-density lipoprotein-cholesterol; FPG, fasting plasma glucose; LM, left-main; LAD, left anterior descending; SYNTAX, SYNergy between percutaneous coronary intervention with TAXus and cardiac surgery; DES, drug eluting stent; BRS, bioresorbable scaffold; ACEI, angiotensin converting enzyme inhibitor; ARB, angiotensin II receptor blocker; MACE, major adverse cardiovascular events; eGFR, estimated glomerular filtration rate; HR, hazard ratio; CI, confidence interval; Ref, reference.
Conceptualization, ZQY and QYS; methodology, ZQY, XTM and JL; software, ZQY; validation, QXL, YFW and XLL; formal analysis, ZQY and ZJW; investigation, DMS; resources, ZJW; data curation, ZQY and XTM; writing—original draft preparation, ZQY; writing—review and editing, ZF and ZJW; supervision, HS and ZJW; project administration, ZF and ZJW; funding acquisition, ZJW and YJZ. All authors have read and agreed to the published version of the manuscript.
This study was conducted in accordance with the guidelines of the Declaration of Helsinki and approved by the institutional review board of Beijing Anzhen Hospital, Capital Medical University (Ethic approval number: 2016034x). Given the retrospective nature of this study, the requirement for informed consent was waived.
We would like to express our gratitude to all those who helped us during the writing of this manuscript, and thanks to all the peer reviewers for their opinions and suggestions.
Project funded by National Key Research and Development Program of China (2017YFC0908800, Yu-Jie Zhou), Beijing Municipal Administration of Hospitals’ Mission plan (SML20180601, Yu-Jie Zhou), China Postdoctoral Science Foundation (2021M692253, Xiao-Teng Ma), Beijing Postdoctoral Research Foundation (2021-ZZ-023, Xiao-Teng Ma), Beijing Municipal Health Commission (Jing 19-15, Hua Shen), Beijing Municipal Health Commission (2022-2-1052, Zhi-Jian Wang).
The authors declare no conflict of interest.
References
Publisher’s Note: IMR Press stays neutral with regard to jurisdictional claims in published maps and institutional affiliations.