
In autoimmune diseases like rheumatoid arthritis (RA), multidrug resistance (MDR) transporters of the ATP-binding cassette (ABC) transporter superfamily harbor dual functions by extruding pro-inflammatory mediators and exporting disease modifying anti-rheumatics drugs (DMARDs), hence contributing to diminished treatment response. Herein we determined the expression (mRNA/protein) and functional efflux activities of multiple selected ABC transporters in immune-effector cells of RA patients in relation to DMARD response. ABC transporter profiling included ABCB1 (P-glycoprotein), ABCC1-6/ABCC10-12 (multidrug resistance proteins 1-9) and ABCG2 (Breast Cancer Resistance Protein). Analyses were performed in peripheral blood lymphocytes (PBL) and monocyte-derived macrophages (MDM) obtained from 52 RA patients (DMARD-naïve and DMARD (non)-responders) and HC (n = 19) using PCR, immunohistochemistry and flow cytometry. Notwithstanding the large inter-patient variabilities, PBLs from RA patients displayed significantly higher mRNA levels of ABCC1 (2.1-fold), ABCC4 (1.6-fold) and ABCC10 (1.9-fold) compared with HC. Expression levels of ABCB1, ABCC1, ABCC4 and ABCC10 were significantly and positively correlated with each other. Furthermore, significantly increased ABCG2 mRNA (2.8-fold) and protein levels (2.4-fold) were observed in MDM from RA patients compared to HC. Additional analyses revealed that a 1.8-fold increased functional activity of ABCB1 in CD3+ cells in RA patients receiving DMARD treatment versus DMARD-naïve patients, was exclusively contributed by DMARD non-responders. Although up to 1.7-fold higher levels of MDR mRNA levels were noted in PBL of DMARD non-responders over DMARD responders, these differences were not statistically significant. Together, these results underscore the involvement of multiple ABC transporters in immune-competent cells in relation to RA and DMARD response.
Rheumatoid arthritis (RA) is a common autoimmune disease characterized by chronic inflammation of the synovial joints and infiltration by blood-derived inflammatory cells, e.g. T-cells, B-cells and macrophages [1, 2]. From a therapeutic perspective, Disease Modifying Anti-Rheumatic Drugs (DMARDs), either as single drug or in combination, find widespread application as first line treatment option [2, 4, 5, 6]. In addition, the DMARD methotrexate (MTX) is commonly used in combination schedules with other DMARDs and biological agents [7, 8, 9, 10, 11, 12]. Monotherapy with a DMARD is initially successful in about 50-60% of RA patients, depending on the specific anti-rheumatic drug used [13]. However, despite chronic treatment with DMARDs, reactivation of inflammation often occurs, indicating that these drugs lose their efficacy over time [14, 15, 16, 17, 18, 19, 20]. In this respect, it has been recognized that RA patients remain on the anchor drug MTX for a median period of 5-6 years, whereas for the DMARDs (hydroxy)chloroquine ((h) CHQ) or sulfasalazine (SSZ) this period is much shorter being typically one to two years [15, 16]. Apart from loss of efficacy, adverse effects are another common reason for switching to other DMARDs or biological agents [21, 22]. Currently, it is still an unresolved issue whether tapering of DMARD efficacy is mechanistically associated with the development of cellular drug resistance.
One important mechanism of drug resistance is based on cellular extrusion of drugs, an efflux process that is mediated by specific members of the family of ATP-Binding Cassette (ABC) proteins [23, 24, 25, 26, 27, 28, 29, 30]. These extrusion proteins mediate drug efflux thereby conferring multidrug resistance (MDR) to a wide range of structurally and mechanistically unrelated drugs. Resistance to several anticancer drugs has been associated with overexpression of specific MDR proteins, including ABCB1 (P-glycoprotein, P-gp, MDR1), ABCC1-6 and ABCC10-12 (Multidrug Resistance Proteins (MRP) 1-9) and ABCG2 (Breast Cancer Resistance Protein, BCRP) [31, 32, 33, 34, 35, 36, 37, 38, 39, 40]. Next to anticancer drugs, there is also cumulative evidence, mostly based on in vitro data, that several DMARDs are also potential transport substrates of ABC drug efflux transporters and, upon chronic drug treatment they induce upregulation of selected ABC transporters [24]. Specifically, MTX is known to be transported by several ABC transporters, including ABCC1-5 and ABCG2, while CHQ was identified as a transport substrate for ABCC1 whereas both SSZ and leflunomide were ABCG2 transport substrates [41, 42, 43, 44, 45]. Moreover, studies with T-cell subsets from RA patients revealed that efflux and resistance to glucocorticoids can be mediated by enhanced activity of ABCB1 [46, 47, 48, 49, 50]. A putative role for ABCB1 was also suggested in conferring drug resistance to MTX [50, 51]; however, due to its anionic nature, MTX is apparently not a substrate for ABCB1 [24, 37]. Recently, we showed that the ABC transporters ABCG2 and to a minor extent ABCC1 were expressed on synovial tissue macrophages from RA patients; this correlated with an attenuated response to MTX and leflunomide [52]. It is now being appreciated that various ABC transporters can be differentially expressed in immune-effector cells where they may have dual functions; on the one hand they may neutralize potential toxic effects of xenobiotic environmental compounds [25, 53], while on the other hand they may facilitate the extrusion of intracellular substrates that serve as mediators of immunological and inflammatory processes [54].
Taken together, there is consensus that ABC transporters could play a role in DMARD resistance. Since thus far most studies on this topic either focussed on one specific ABC transporters or specific cell types, there is a need to extend these studies to multiple MDR/ABC transporters on immune cells derived from RA patients in relation to clinical status of DMARD (non) responsiveness [55]. For this purpose, we herein determined the expression levels of key ABC transporters (ABCB1, ABCC1-6, ABCC10-12 and ABCG2) on peripheral blood lymphocytes (PBLs) and monocyte-derived macrophages (Mφ) from HC and RA patients and assessed whether or not these parameters correlated with the clinical response to DMARDs.
Iscove’s modified Dulbecco’s medium (IMDM) and fetal calf serum (FCS) were obtained from Gibco Chemical Co (Grand Island NY, USA). The ABCG2 inhibitor Ko143 was kindly provided by Prof. G. J. Koomen (University of Amsterdam, Amsterdam, The Netherlands) and the ABCC1 inhibitor MK571 and the ABCB1 inhibitor Reversin-121 (P121) were obtained from Alexis Benelux, Breda, The Netherlands. The BCRP substrate bodipy-prazosin, the ABCB1 substrate Syto16 and the ABCC1 substrate Calcein-AM were obtained from Invitrogen, Breda, The Netherlands. Fluorescein isothiocyanate (FITC)-conjugated CD8 and phycoerythrin (PE)-conjugated CD3, CD4, CD20 and CD25 were obtained from Becton-Dickinson (Alphen aan den Rijn, The Netherlands). Macrophage colony stimulating factor (M-CSF) was obtained from R&D systems (Minneapolis, USA).
During the period 2002-2006, blood samples were obtained from 52 patients fulfilling the American College of Rheumatism (ACR) criteria for RA and 19 healthy individuals. The clinical disease activity of the RA patients was determined by using the disease activity score evaluating 28 joints (DAS28) [56]. Subjects were categorized into four sub-groups: (1) Healthy controls (HC), (2) DMARD-naïve RA patients (defined as not receiving any DMARD therapy in the present and past), (3) DMARD-responders (defined as having a DAS28 score ≤ 3.2 under DMARD therapy) and (4) DMARD non-responders (defined as having a DAS28 of > 3.2 under DMARD therapy as described before [57]). Patients taking DMARDs were on a stable dose for at least 3 months. Patients taking glucocorticoids within 3 months before entering the study were excluded. The study protocol entitled ‘DMARD resistance’ was approved by the local Medical Ethics Committee of the VU University Medical Centre (Amsterdam, The Netherlands) and all subjects gave written informed consent before entering the study.
Peripheral blood mononuclear cells (PBMCs) were isolated from freshly obtained blood samples by gradient centrifugation (35 minutes at 400× g) on Ficoll-Paque Plus (Amersham Biosciences, Amersham, UK) according to the manufacturer’s instructions. After centrifugation, the interphase was carefully collected and washed 3 times using phosphate-buffered saline (PBS) supplemented with 1% BSA. The lymphocyte fraction was counted and resuspended in IMDM culture medium supplemented with 10% FCS, 2 mM L-glutamine and 100 μg/ml penicillin and streptomycin. Monocytes were isolated by adherence after 2 hours of incubation at 37 oC in culture flasks followed by RNA extraction. A portion of the adhered monocytes were used for macrophage (Mφ) differentiation by culturing the monocytes for 7 days in the presence of 50 ng/ml M-CSF and RNA was extracted. Peripheral blood lymphocytes (PBLs) remaining in the suspension after monocyte adherence were collected for analysis of ABC transporter mRNA expression and functional efflux activity of ABC transporters.
Measurement of ABCB1, ABCC1 and ABCG2 transport activity was performed essentially as previously described [58, 59]. Assays were validated using human cell lines overexpressing either ABCC1 (GLC4/ADR [60]), ABCB1 (CEM/VBL [61]) or ABCG2 (MCF7/MR [62]). In short, cells were incubated in a total volume of 500 µL at a cell density of 3 × 10⁵ cells/ml for 60 minutes in a 37 oC water bath in the presence of a fluorescent transport substrate; Calcein-AM (4 nM), Syto16 (1 nM) and Bodipy-prazosin (25 nM) for the detection of ABCC1, ABCB1 and ABCG2 efflux activities, respectively. To measure functional ABC transporter-mediated efflux activity, cells were also incubated with specific transport inhibitors; MK571 (50 μM), P121 (10 μM) and Ko143 (200 nM) for the inhibition of ABCC1, ABCB1 and ABCG2, respectively. After incubation with the chromophoric substrates alone or in the presence of the specific transport inhibitor, cells were washed twice using ice-cold PBS supplemented with 0.1% bovine serum albumin (BSA) and kept on ice protected from light for 30 minutes. Flow cytometric analysis was performed using a FACS Scan (Becton Dickinson) equipped with a 488-nm argon laser with 530 nm (FL1), 585 nm (FL2) and a 670 nm (FL3) band pass filter. Cell Quest software (Becton Dickinson) was used for data acquisition and analysis. ABC/MDR transporter activity was expressed as an Activity Index (AI) described by the following formula:
An index of ≥ 1.10 is representative for functional MDR efflux activity.
RNA from PBLs and Mφ was isolated using the Qiagen RNeasy Plus isolation kit (Qiagen, Hilden, Germany) according to the instructions of the manufacturer. Total RNA concentrations were determined using a Nanodrop ND-1000 spectrophotometer (Nanodrop Technologies, Wilmington, USA). RNA was reverse-transcribed to copy DNA (cDNA) using random hexamers as described previously [63] using 1 μg of RNA. Real time PCR analysis was performed using the LightCycler 2.0 (LC) instrument (Roche Diagnostics, Penzberg, Germany) and Hybridization Probes, essentially as described earlier [64]. All samples were tested by using the LightCycler FastStart DNA MasterPLUS HybProbe kit (Roche Diagnostics) according to manufacturer’s recommendations. PCR reactions were performed in duplicates using 5 μl cDNA, equivalent to 20 ng RNA, which was added to 15 μl of reaction mixture in a final volume of 20 μl. The primers and probes were as previously published [65, 66]. The primer/probe sequences and their concentrations are depicted in the Supplementary Table S1. The PCR program for all targets consisted of an initial denaturation step at 95 oC for 10 min and 45 cycles of warming up to 95 ºC, immediately followed by 15 s at 60 oC. After the final cycle, capillaries were cooled for 30 s at 40 ºC. Fluorescence curves were analyzed with the LC software (version LCS4 4.0.5.415). This software uses the second derivative maximum method to calculate the fractional cycle numbers where the fluorescence signals are above background (crossing point, CP), being the point at which the rate of change of fluorescence is greatest. The relative mRNA expression levels of the target genes were calculated using Qbase analysis software [67] in which β-glucuronidase (GUS) and GAPDH were used as control housekeeping genes. For correction of inter-run variation, a calibrator sample based on a cDNA pool derived from various ABC transporter-overexpressing human cell lines, including 2008/MRP1-3 (ABCC1-3), HEK/MRP4-7 (ABCC4-6, ABCC10), MCF7/MR (ABCG2), CEM/VBL (ABCB1), was used in every PCR analysis. The calibrator sample was also used as a reference sample, to calculate the relative mRNA expression levels in all tested samples.
Immunohistochemistry was performed as previously described [68, 69] and all antibody dilutions were prepared in PBS supplemented with 1% (w/v) BSA. In short, cytocentrifuge preparations with 20,000 cells/spot were air-dried overnight and fixed with 100% acetone for 10 minutes. Non-specific binding sites were blocked for 30 minutes at room temperature with PBS containing 5% normal rabbit serum (DakoCytomation). Next, cells were incubated for one hour at room temperature with primary monoclonal antibodies against ABCG2 (BXP-21, 1 : 50 and BXP-53, 1 : 25) [68], ABCB1 (JSB-1, 1 : 25) [70], ABCC1 (MRPr1, 1 : 50) [69], ABCC2 (M2III6, 1 : 50) [69], ABCC4 (M4I10, 1 : 50) [69], ABCC5 (M5I1, 1 : 50) [69]) and ABCC6 (M6II3, 1 : 25) [69] together with the appropriate negative controls, IgG subclass with appropriate secondary antibody. The slides were then washed 3 times in PBS and incubated with biotinylated rabbit-anti-mouse (1 : 150, DakoCytomation) or biotinylated rabbit-anti-rat (1 : 100, DakoCytomation) as secondary antibody. After one hour of incubation at room temperature, the slides were washed 3 times in PBS and incubated with streptavidin conjugated to horseradish peroxidase (1 : 500; Zymed, San Francisco, CA) for 30 minutes. After washing 5 times with PBS, bound peroxidase was developed with 0.02% (w/v) 3-amino-9-ethylcarbazole and 0.02% (v/v) H2O2 in 0.1 M sodium acetate (pH 5.0) and nuclei were stained with hematoxylin. The staining results were scored by determining staining intensity of 100 cells utilizing the following scores: 0 (negative cells), 1 (weakly positive cells), 2 (positive cells) and 3 (strongly positive cells). The total scores ranged from 0 (100% × 0) to 3.0 (100% × 3).
Statistical analyses for 2-group comparisons were performed using Student’s t-test or Mann-Whitney U test, where appropriate. Correlation analyses were performed using a Pearson or Spearman test, where appropriate. These data were analyzed using GraphPad Prism 5.01 software. A two-tailed P-value < 0.05 was considered to be statistically significant.
Blood was obtained from 52 RA patients and 19 HC and their baseline characteristics are summarized in Table 1. Nine RA patients were DMARD-naive with an average DAS28 score of 5.2 ± 1.2 (SD). DMARD responder and non-responder groups included 15 and 28 patients with an average DAS28 score of 2.2 ± 0.7 and 4.8 ± 0.6), respectively. Mean treatment duration was 27 months (SD ± 36) and 43 months (SD ± 40) for patients in the DMARD responder and non-responder group, respectively. Among the majority of the RA patients, 36 out of 43, MTX was included in the treatment schedule. Mean age was not significantly different between the selected groups.
| Controls | DMARD |
DMARD |
DMARD |
|
|---|---|---|---|---|
| Total (n) | 19 | 9 | 15 | 28 |
| male/female | 10/9 | 4/5 | 5/10 | 8/20 |
| Age (year) | 54.3 (± 16.3) | 58.9 (± 19.8) | 56.1 (± 20.3) | 55.5 (± 13.2) |
| DAS28 | NA | 5.22 (± 1.23) | 2.20 (± 0.72) | 4.79 (± 0.57) |
| ESR (mm/hr) | NA | 46 (± 30) | 13 (± 13) | 28 (± 22) |
| Treatment duration (months) | 27 (± 36) | 43 (± 40) | ||
| DMARD treatment | ||||
| Methotrexate (n) | NA | NA | 13 | 24 |
| Sulphasalazine (n) | 3 | 5 | ||
| Hydroxychloroquine (n) | 1 | 10 | ||
| Combination therapy (n) | NA | NA | 2 | 8 |
Overview of subjects who participated in the study. 19 HC, 9 DMARD-naive (patients who had not received DMARD treatment in the past or present), 15 DMARD responders (defined as having a DAS28 score ≤ 3.2 under DMARD therapy) and 28 DMARD non-responders (defined as having a DAS28 of ≥ 3.2 under DMARD therapy) were included in the study. For each group the average age, DAS28 and ESR are depicted. Patients used methotrexate, sulphasalazine or hydroxychloroquine either as mono-therapy or in combination regimens. Values depicted represent mean ± SD. Abbreviations: NA: Not Applicable; DMARD: Disease Modifying Anti Rheumatic Drug; DAS: Disease Activity score; ESR: Erythrocyte Sedimentation Rate.
Flow cytometry with fluorescent substrates was used to determine the functional activities of ABCB1, ABCC1 and ABCG2 in PBLs (Fig. 1A) and in CD3+ cells (Fig. 1B) from RA patients and HC. ABCB1 and ABCC1 efflux activities were readily detectable in all tested samples of both PBL and CD3+ fractions of peripheral blood cells, whereas ABCG2 activity was below the pre-set threshold indicative for functional efflux activity; activity index ≥ 1.1. Mean values for the transport activity index (AI) of ABCB1 activity were slightly higher in PBLs and significantly higher in CD3+ cells of RA patients vs. controls (AI: 2.6 vs. 2.0, P = 0.058 and AI: 2.4 vs. 1.7, P = 0.012). Consistently, the mean ABCB1 mRNA levels relative to GUS, were significantly higher in RA patients vs. controls (ratio: 2.5 vs. 1.9, P = 0.009; Fig. 1C). Regarding ABCC1 and ABCG2, very low and no significant differences were observed in functional efflux activities between PBLs and the CD3+ fraction from RA patients and HC (AI: 1.1 for ABCG2 and 1.3 for ABCC1, Fig. 1A and 1B).
 Fig. 1.
Functional efflux activity of ABC transporters and relative mRNA expression in peripheral blood lymphocytes and CD3+ cells from RA patients and healthy controls. (A) Functional efflux activity of ABCB1, ABCG2 and ABCC1 in peripheral blood lymphocytes and (B) CD3+ cells in RA patients and controls. (C) Relative mRNA expression of ABCB1, ABCG2 and ABCC1 in peripheral blood lymphocytes from RA patients and controls, and (D) Relative mRNA expression of ABCC2-6 and ABCC10 in peripheral blood lymphocytes from RA patients and controls. ABCC11 and ABCC12 mRNA levels were below the limit of detection. Data are presented in box plots, where the boxes represent the 25th to 75th percentiles, the lines within the boxes represent the median, and the lines outside the boxes represent the 10th and 90th percentiles. Statistically significant differences between RA patients and HC are indicated with an asterisk when P ≤ 0.05 or ** when P ≤ 0.01. ABC transporter efflux activity was expressed as an Activity Index (AI) by comparing the mean fluorescence level in the presence of the appropriate inhibitor with the fluorescence level in the absence of the inhibitor.
Evaluation of mRNA expression levels of ABCB1, ABCC1-6, ABCC10-12 and ABCG2 in PBLs from RA patients over HC showed significantly higher values for ABCC1 (2.1-fold, P = 0.005), ABCC4 (1.6-fold, P = 0.014) and ABCC10 (1.9-fold, P = 0.015) (Fig. 1C and 1D). However, no significant differences were observed for ABCC2, ABCC3, ABCC5 and ABCC6, while expression levels of ABCC11 and ABCC12 mRNA were below the limit of detection (data not shown). Collectively, these results indicate that mRNA levels of four ABC transporters including ABCB1, ABCC1, ABCC4 and ABCC10 were differentially expressed in PBLs from RA patients relative to HC, but regarding the functional activities of 3 central MDR transporters (ABCB1, ABCC1 and ABCG2, only ABCB1 efflux activity was significantly increased.
Given the large inter-individual differences in mRNA expression levels of ABC transporters in PBL of RA patients and HC, we next examined whether expression levels were correlated for selective transporters. Indeed, Fig. 2 shows highly significant correlations (P value and Spearman r value) for mRNA expression of ABCC1 and ACB1 (P < 0.001, r = 0.707; Fig. 2A), ABCC1 and ABCC2 (P < 0.001, r = 0.684; Fig. 2B), ABCC1 and ABCC10 (P < 0.001, r = 0.758; Fig. 2C), ABCC10 and ABCB1 (P < 0.001, r = 0.587; Fig. 2D), ABCC2 and ABCC10 (P = 0.001, r = 0.577; Fig. 2E) as well as ABCC4 and ABCC10 (P = 0.002, r = 0.534; Fig. 2F). Moderate correlations were also observed for other ABC transporter combination (Supplementary Fig. S1), and the complete overview of P-values and Spearman r values for all ABC transporter combinations is summarized in Table 2. From this table, a weak, but non-significant, negative correlation is noted for ABCG2 mRNA and other ABC transporters. Collectively, these data illustrate a positive interconnection between expression of ABCB1, ABCC1, ABCC4 and ABCC10 in PBL of RA patients and healthy individuals.
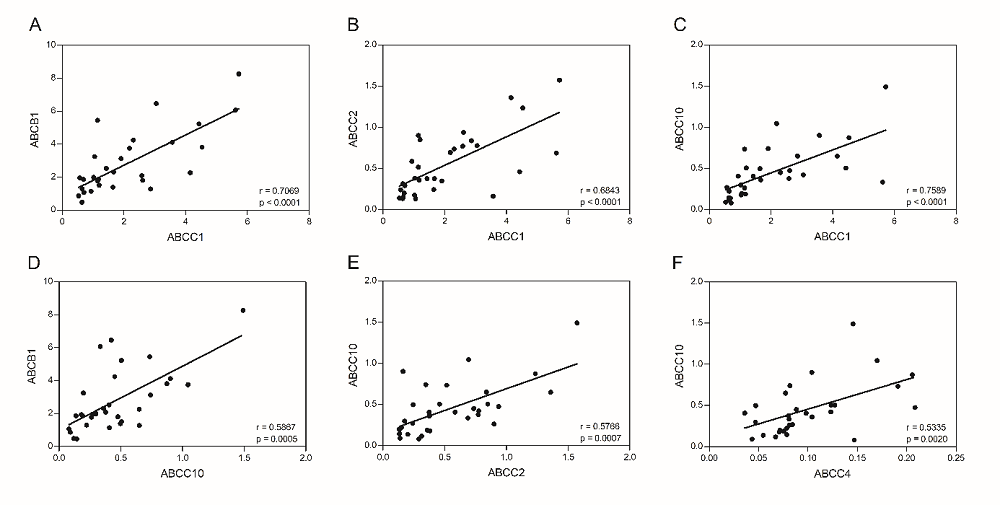 Fig. 2.
Correlations of mRNA expression levels of various ABC transporters in PBL of RA patients and healthy controls. Selected significant correlations of mRNA expression of multiple ABC transporters from PBL of RA patients and HC: (A) ABCC1 and ABCB1, (B) ABCC1 and ABCC2, (C) ABCC1 and ABCC10, (D) ABCC10 and ABCB1, (E) ABCC2 and ABCC10 and (F) ABCC4 and ABCC10. Significance is indicated by P value and Spearman r values.
| Pairs (n) | ABCB1 |
ABCC1 |
ABCC2 |
ABCC3 |
ABCC4 |
ABCC5 |
ABCC6 |
ABCC10 |
ABCG2 |
DAS28 |
BSE |
|---|---|---|---|---|---|---|---|---|---|---|---|
| ABCB1 | 0.7069 | 0.3456 | -0.0460 | 0.5121 | 0.4069 | -0.2333 | 0.5867 | -0.0902 | 0.2842 | 0.1724 | |
| ABCC1 | < 0.0001 | 0.6843 | 0.2399 | 0.5081 | 0.3718 | 0.4667 | 0.7589 | -0.1970 | 0.2045 | 0.0497 | |
| ABCC2 | 0.0569 | < 0.0001 | 0.1815 | 0.4798 | 0.2851 | 0.6333 | 0.5766 | -0.0526 | 0.1429 | 0.1340 | |
| ABCC3 | 0.8060 | 0.1936 | 0.3286 | -0.0948 | 0.5044 | 0.4167 | 0.0232 | 0.1925 | -0.1579 | -0.0633 | |
| ABCC4 | 0.0032 | 0.0035 | 0.0063 | 0.6121 | 0.6294 | 0.3167 | 0.5335 | 0.1985 | 0.2992 | 0.4593 | |
| ABCC5 | 0.0231 | 0.0395 | 0.1201 | 0.0038 | 0.0001 | 0.0977 | 0.5698 | 0.1351 | 0.1775 | 0.0572 | |
| ABCC6 | 0.5517 | 0.2125 | 0.0760 | 0.2696 | 0.4101 | 0.8025 | 0.1000 | -0.1774 | -0.8340 | -0.5798 | |
| ABCC10 | 0.0005 | < 0.0001 | 0.0007 | 0.2086 | 0.0020 | 0.0008 | 0.8100 | -0.4451 | 0.2165 | 0.1845 | |
| ABCG2 | 0.7052 | 0.4052 | 0.8256 | 0.4162 | 0.4015 | 0.5071 | 0.6479 | 0.0492 | 0.3632 | 0.3927 | |
| DAS28 | 0.2246 | 0.3871 | 0.5480 | 0.5061 | 0.1999 | 0.4539 | 0.0390 | 0.2165 | 0.2722 | 0.7643 | |
| BSE | 0.4672 | 0.8352 | 0.5732 | 0.7911 | 0.0416 | 0.8106 | 0.2417 | 0.4362 | 0.2366 | < 0.0001 |
Lower left area depicts P-values for ABC transporter combinations, Upper right area Pearson or Spearman r correlations where appropriate. Bold numbers in light grey shaded boxes indicate significant correlations.
Macrophages represent a cell type of key relevance in driving RA disease and thus serve as a target for DMARD therapy. To investigate expression levels of ABC transporters in human monocyte-derived macrophages (MDM), protein and mRNA levels were analyzed by immunohistochemistry and RT-PCR, respectively. A large inter-individual variation in ABCG2, ABCB1 and ABCC1 protein levels was observed both in the MDM of the control group and in the RA patients group (Fig. 3A and 3B). Of note, ABCG2 protein levels were significantly higher (2.4-fold, P = 0.025) in the RA group (mean: 1.27) compared to HC (mean: 0.53) (Fig. 3B). No significant differences in protein expression were observed for ABCB1, ABCC1, ABCC4-6 and the macrophage marker 3A5 (Fig. 3B). Consistent with ABCG2 protein data (Fig. 3B), relative ABCG2 mRNA expression (Fig. 3C) was also significantly increased (2.8-fold, P = 0.036) in RA patients (mean: 0.074) compared to HC (mean: 0.026). In addition, relative mRNA expression of ABCC3 was 1.4-fold higher (P = 0.019) in MDM from RA patients (mean: 1.43) compared to HC (mean: 1.02). As to the remaining ABC transporters tested, ABCB1, ABCC1-2, ABCC4-6, ABCC10 and ABCC11-12 (data not shown), no significant differences in relative mRNA levels were found between RA patients and controls (Fig. 3C). Collectively, these results demonstrate that ABCG2 expression both at the mRNA and protein levels, is the most differentially upregulated ABC transporter in MDM from RA patients.
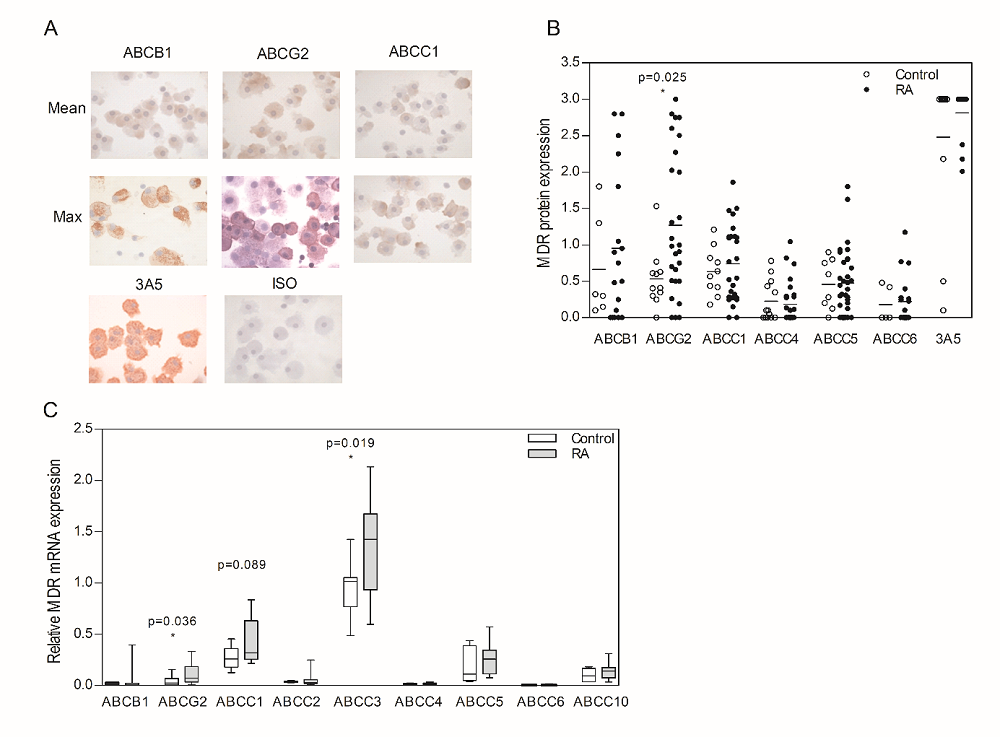 Fig. 3.
ABC transporter protein and mRNA expression in monocyte-derived macrophages (MDM) from RA patients and healthy controls. (A) Representative immunohistochemical staining of ABCB1, ABCG2 and ABCC1 on monocyte-derived macrophages from RA patients, together with the appropriate macrophage marker 3A5 and negative control (isotype antibody). (B) Staining intensity for ABCB1, ABCG2, ABCC1, ABCC4-6 and 3A5 on MDM from RA patients as determined by scoring the staining intensity of 100 cells, range: 0 (negative) to 3 (strongly positive). (C) ABC transporter mRNA expression of ABCB1, ABCG2, ABCC1-6 and ABCC10 relative to the mRNA expression levels from a ABC transporter cell-line pool. mRNA of ABCC11 and ABCC12 were below the detection level. Horizontal bars depict the mean value. Data in box plots, where the boxes represent the 25th to 75th percentiles, the lines within the boxes represent the median, and the lines outside the boxes represent the 10th and 90th percentiles. Statistically significant differences between RA patients and HC are indicated with an asterisk when P ≤ 0.05. Note: for technical reasons, no ABCC2 and ABCC3 staining was performed.
To analyze whether expression of ABC transporters in RA patients is affected by DMARD treatment per se, ABC transporter expression levels in PBL and CD3+ cells of DMARD-naïve RA patients were initially compared with those of DMARD-treated RA patients (regardless of their clinical DMARD response). It is noteworthy that the functional activity of ABCB1 was 2-fold higher in PBLs of DMARD-treated patients versus DMARD- naïve patients (median AI: 2.9 vs. 1.5, respectively, P = 0.08) (Fig. 4A). In CD3+ cells from DMARD-treated patients a significant (P = 0.022) 1.5-fold increase in ABCB1 efflux activity was also observed in DMARD-treated versus DMARD-naive RA patients (median AI: 2.4 vs. 1.6) (Fig. 4B). No differences were observed for ABCC1 efflux activity between PBL/CD3+ cells of DMARD-treated and DMARD-naïve RA patients (Fig. 4A and 4B).
In line with the functional activity of ABCB1 in PBLs, median relative ABCB1 mRNA levels were also increased (1.7-fold) in DMARD-treated over DMARD-naïve RA patients, even though this difference was not statistically significant (Fig. 4C). For all other ABC transporters tested (ABCG2, ABCC2-6 and ABCC10), no significant differences in relative mRNA expression levels were observed between DMARD-naive and DMARD-treated RA patients (Results not shown).
Finally, no marked differences in relative mRNA levels of ABCB1, ABCG2, ABCC1-6 and ABCC10 were observed with MDM from DMARD-naïve and DMARD-treated RA patients (Results not shown). Together, these findings indicate that DMARD treatment markedly affects the functional activity of ABCB1 in PBLs from RA patients, while those of ABCC1, ABCG2 and other ABC transporters are just marginally influenced.
 Fig. 4.
Functional efflux activity and mRNA expression of ABCB1 and ABCC1 in relation to DMARD treatment. (A) Activity levels of ABCB1 and ABCC1 in peripheral blood lymphocytes and (B) CD3+ cells from DMARD-treated and DMARD-naive RA patients. (C) Differential MDR mRNA expression of ABCB1 and ABCC1 in PBLs of DMARD-treated vs. DMARD-naive patients, relative to the mRNA expression levels from a MDR cell-line pool. Data are presented in box plots, where the boxes represent the 25th to 75th percentiles, the lines within the boxes represent the median, and the lines outside the boxes represent the 10th and 90th percentiles. Statistically significant differences between RA patients and HC are indicated with an asterisk when P ≤ 0.05. MDR transporter activity was expressed as an Activity Index (AI) by comparing the mean fluorescence level in the presence of the appropriate inhibitor with the fluorescence level in the absence of the inhibitor.
Next, the expression of ABC transporters in DMARD non-responders (DAS28 > 3.2 under therapy) was compared with DMARD-responding patients (DAS28 ≤ 3.2 under therapy). No significant differences could be observed between DMARD responders and DMARD non-responders. Similar levels of ABCB1 efflux activity were noted in both PBLs and CD3+ cells of DMARD-responders vs. non-responders (Fig. 5A). In concordance with the functional activity of ABCB1, no statistically significant difference in relative mRNA levels was observed for this transporter in PBLs (Fig. 5B), even though mRNA levels of ABCB1 tended to be slightly increased (1.5-fold) in DMARD non-responders. Modest ABCC1 and neglible ABCG2 functional activity was found in PBL samples from DMARD non-responders, but insufficient samples sizes in the group of DMARD-responders did not allow an assessment of significant differences between these two groups. For all other ABC transporters tested, mRNA levels in the non-responder group were up to 1.7-fold higher in the DMARD non-responder group vs. DMARD responder group, with significant differences for ABCC2 (P = 0.05) and ABCC4 (P = 0.018) (Fig. 5C). Additionally, ABC transporter mRNA levels were compared in MDM from DMARD-responders versus DMARD non-responders (Fig. 5D), revealing no significant differences.
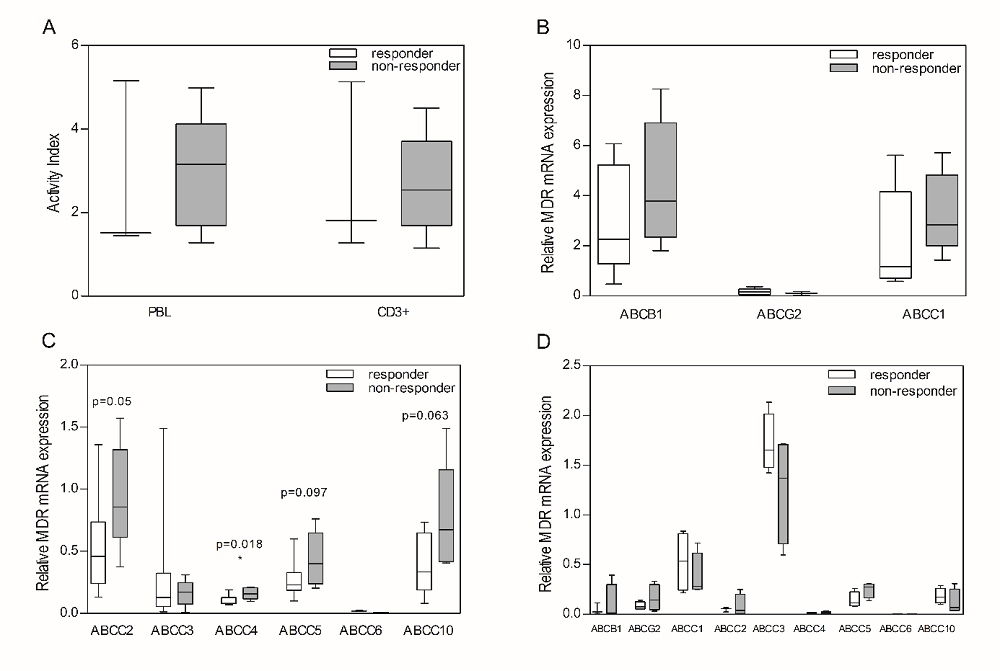 Fig. 5.
DMARD response related to ABC transporter efflux activity and mRNA expression in peripheral blood lymphocytes and monocyte-derived macrophages from RA patients with different response to DMARD treatment. (A) Functional activity of ABCB1 in peripheral blood lymphocytes and CD3+ cells derived from RA patients which were indicated as DMARD non-responders or responders, (B) Relative mRNA expression of ABCB1, ABCG2 and ABCC1 in peripheral blood lymphocytes, (C) Relative mRNA expression of ABC transporters ABCC2-6 and ABCC10 in peripheral blood lymphocytes, and (D) Relative mRNA expression of ABC transporters ABCB1, ABCG2, ABCC1-6 and ABCC10 in monocyte-derived macrophages. Data are presented in box plots, where the boxes represent the 25th to 75th percentiles, the lines within the boxes represent the median, and the lines outside the boxes represent the 10th and 90th percentiles. Statistically significant differences between RA patients and HC are indicated with an asterisk when P ≤ 0.05. MDR transporter activity was expressed as an Activity Index (AI) by comparing the mean fluorescence level in the presence of the appropriate inhibitor with the fluorescence level in the absence of the inhibitor.
One other set of comparisons included ABCB1 functional activity and mRNA levels in PBL and CD3+ cells of DMARD non-responders vs. DMARD-naïve patients. An increased ABCB1 efflux activity was observed in PBLs (1.5-fold, P = 0.076) and CD3+ cells (1.8-fold, P = 0.019 respectively) of DMARD non-responders (Fig. 6A). In line with this observation, a 2-fold increase of ABCB1 mRNA expression was found in PBLs of DMARD non-responders when compared with DMARD-naïve patients (Fig. 6B). No additional significant differences were observed in mRNA levels of the other ABC transporters in PBLs (not shown).
Lastly, we assessed by linear regression analysis whether ABC transporter expression is correlated with clinical parameters of DMARD response, including DAS28 and ESR. Overall, no correlation was found between the functional activity of any of the tested MDR transporters in PBL/CD3+ cells and the DAS28 score or ESR from DMARD responders and DMARD non-responders, although ABCB1, ABCC1, ABCC2 and ABCC10 mRNA levels in PBLs of RA patients trended to increase with increasing DAS28 activity (Results not shown). For MDM however, a significant correlation was observed for ABCB1 protein levels and DAS28 values (P = 0.0207, Spearman r = 0.7129, Fig. 6C). Taken collectively, these results demonstrate that selective ABC transporters including ABCB1, ABCC1, ABCC2, ABCC4 and ABCC10 differentially upregulated in either PBLs or MDM following DMARD treatment or in conjunction with disease activity.
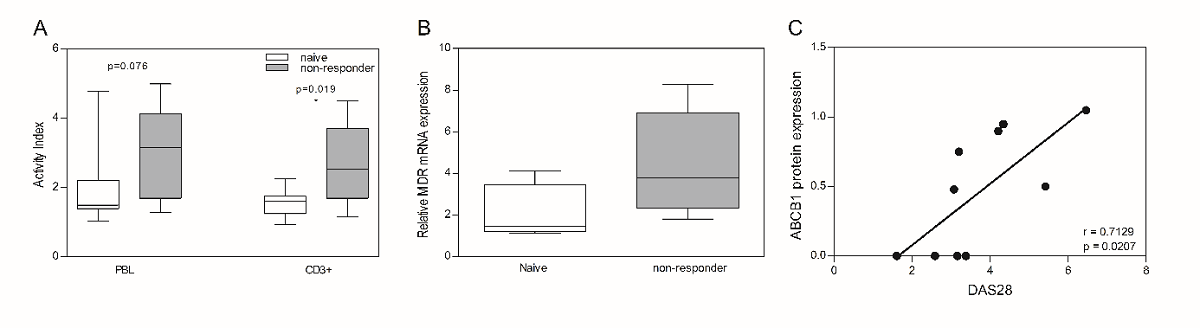 Fig. 6.
ABCB1 functional activity and mRNA expression in peripheral blood lymphocytes DMARD non-responders compared to DMARD-naive patients, and correlations ABCB1 protein expression in monocyte-derived macrophages with DAS28 score. ABCB1 functional activity (A) and relative mRNA expression (B) in peripheral blood lymphocytes derived from RA patients which were indicated as DMARD non-responders or DMARD-naive. Data are presented in box plots, where the boxes represent the 25th to 75th percentiles, the lines within the boxes represent the median, and the lines outside the boxes represent the 10th and 90th percentiles. Statistically significant differences between RA patients and HC are indicated with an asterisk when P ≤ 0.05. ABCB1 transporter activity was expressed as an Activity Index (AI) by comparing the mean fluorescence level in the presence of the appropriate inhibitor with the fluorescence level in the absence of the inhibitor. (C) Correlation of DAS28 scores and with ABCB1 protein expression in monocyte-derived macrophages derived from RA patients. Significance is indicated by P value and Pearson rvalue.
This study demonstrates that selected members of the ABC superfamily of MDR efflux transporters are differentially upregulated in immune-effector cells from RA patients as compared to HC. In particular, mRNA levels of ABCB1, ABCC1, ABCC4 and ABCC10 are upregulated in PBLs from RA patients, whereas ABCG2 mRNA and protein levels were markedly upregulated in MDM from RA patients. Furthermore, ABCB1 functional activity and mRNA levels were increased in PBLs from RA patients that had an attenuated clinical response to DMARDs.
Although the current treatment of RA with DMARDs has proven its effectiveness, patients are still confronted either with inherent or acquired resistance phenomena to DMARD therapy [14, 15, 16, 19, 20, 23, 24, 48, 71] for which the underlying molecular mechanisms remain still unclear. It has been recognized that enhanced cellular drug extrusion, facilitated by MDR efflux pumps of the ABC superfamily, could contribute to an attenuated response/resistance to DMARDs [23, 24, 26, 27, 52, 55]. Moreover, there is cumulative evidence that beyond a pharmacological function of ABC transporters, some of them may also elicit a physiological function by mediating the efflux of pro-inflammatory factors, thereby promoting (anti) inflammatory responses [23, 25, 53, 72, 73, 74, 75, 76, 77, 78]. The objectives of the current study were to focus on a selected group of 11 ABC transporters (ABCB1, ABCG2, ABCC1-6 and ABCC10-12) and investigate whether: (a) the expression and activity of ABC transporters was differentially upregulated in RA patients compared to HC, (b) ABC transporter expression is provoked following DMARD treatment, and/or (c) is implicated in DMARD responsiveness. These questions were addressed in two populations of immune cells, PBLs and MDMs, implicated in the pathophysiology of RA [1, 2], obtained from healthy donors and DMARD-naive and DMARD-(non) responding RA patients.
Previously other groups also demonstrated that ABCB1 expression (mRNA levels and functional efflux activity) can be increased in PBLs/CD3+ cells of RA patients [46, 50] and for other auto-immune diseases [49, 74, 79]. On top of this, the present study also revealed that ABCC1, ABCC4 and ABCC10 mRNA expression were significantly increased (Fig. 1). Interestingly, important immuno-regulatory functions of ABCC1 and ABCC4 have been demonstrated in dendritic cells [80, 81, 82, 83] as well as for ABCB1 in T-cells [84]. Notably, within the T cell population, particularly pro-inflammatory Th17 cells express Pgp [85]. The presence of these ATP-driven efflux transporters could also be involved in conferring resistance to anti-rheumatic drugs, e.g. glucocorticoids by ABCB1 [29, 47, 49, 85], chloroquine by ABCC1 [42], and MTX by ABCC1 and ABCC4 [24, 86]. ABCC10 has not been previously investigated in the context of RA and no DMARD substrates for ABCC10 have yet been reported. However, ABCC10 has been characterized for exporting several physiological substrates like Leukotriene C4 and estrogen conjugates, and is subject to inhibiting by various tyrosine kinase inhibitors and phosphodiesterase type 5 inhibitors (e.g. sildenafil) [87, 88, 89, 90, 91]. Hence the role of ABCC10 in RA disease and DMARD response warrants further investigations.
The present study has its limitations due to its cross-sectional design, the small sample size of the 3 subgroups of RA patients, and limited functional activity test in DMARD-responders, which underpowered statistical analyses. Thus, caution should be made in jumping to conclusive statements what proportion of the upregulated expression of multiple ABC transporters is attributable to the inflammatory process and/or disease activity and what proportion is a DMARD treatment- and/or resistance-induced phenomenon. We noted that ABCB1 expression in monocyte-derived macrophages was correlated with disease activity (DAS28) in RA patients. Also ABCB1, ABCC1, ABCC2 and ABCC10 mRNA levels in PBLs of RA patients trended to increase with increasing DAS28 activity, suggesting that disease activity is a contributing factor in the upregulation of specific ABC transporters. Interestingly, a recent study by Li et al. [92] demonstrated that ABCB1 mRNA PBL of RA patients is upregulated by the inflammatory cytokine IL17A. Additionally, gene expression profiling studies by Blits et al. [93] that concurrent with an immune-activation in DMARD-naïve RA patients, expression levels of several ABC transporters, notably ABCC2 and ABCC5, were increased. Upon MTX treatment, up to concentrations of 25 mg/week at which patients were clinically refractory to this drug, mRNA expression levels did not further increase as a primary mediator of resistance. Rather, MTX normalized ABCC1-5 and ABCG2 levels to those observed in HC, thus pointing to lowered ABC transporter expression being associated with immune-suppressive effects. Consistently, Hider et al. [94] and Micsik et al. [95] showed that treatment of primary RA patients with a constant low dose of MTX reduced disease activity as well as ABCC1 expression in PBLs. In addition, Agarwal et al. showed that with refractoriness to MTX therapy, ABCB1 protein expression on PBLs was increased and associated with disease activity, but ABCB1 was not a common cause of methotrexate resistance [96, 97]. This is further supported by the fact that MTX, as a hydrophilic drug, is not a substrate for ABCB1; its cellular export is primarily mediated by ABCC1-5 and ABCG2 [24, 37, 86]. A prominent role for ABCB1 in disease activity and drug resistance has been particularly indicated for glucocorticoid resistance in RA, consistent with the notion that ABCB1 primarily export hydrophobic drugs [30, 49]. Treatment with the anti-TNF biological etanercept suppressed ABCB1 expression on lymphocytes of RA patients and concomitantly increased intracellular levels of glucocorticoids [98]. Similarly, chemical blocking of ABCB1 with tacrolimus overcame glucocorticoids resistance in treatment refractory RA patients [99]. Altogether, these studies indicate that increased disease activity comes with a chronic inflammation driven upregulation of specific ABC transporters, having pharmacological implications of diminished responsiveness when DMARDs are substrates for one of these specific ABC transporters.
Little information is available as to whether ABCG2 in PBL is involved in DMARD non-responsiveness. Consistent with low ABCG2 mRNA expression levels in PBL (Fig. 1C), no appreciable functional ABCG2 activity was detected in PBLs and CD3+ cells of either DMARD response or non-responsive RA patients (Fig. 1A and 1B). Interestingly, Atisha-Fregoso et al. [100] reported increased ABCG2 activity in PBLs of RA patients with active disease compared with those in remission. ABCG2 activity, however, was only noted in small fractions of PBLs; median 3.9% of PBLs of patients with active disease and median 0.9% in patients in remission. Methodological differences may account for the apparent discrepancies in ABCG2 activity in PBLs. In the present study we analyzed functional ABCG2 activity with low non-toxic concentrations (25 nM) of bodipy-prazosin as fluorochromic ABCG2 substrate, whereas in studies by Atisha-Freoso et al. [100] high concentrations (500 µM) of the fluorescent anticancer drug mitoxantrone was used as an ABCG2 substrate. The sensitivity and specificity fluorescent substrates for functional analysis of ABCB1, ABCC1 and ABCG2 was critically reviewed by Lebedeva et al. [101].
The present study also revealed that the profile of ABC transporter expression in MDM differs considerably from that of PBLs/CD3+ cells from RA patients and controls. In particular, ABCG2 mRNA and protein levels were differentially and significantly increased in MDMs obtained from RA patients as compared to those from controls. Intriguingly, the data for ABCG2 expression on MDM is very much reminiscent of the marked expression of ABCG2 on macrophages in the synovial lining and sublining layers in inflamed synovial tissue from RA patients [52]. In fact, ABCG2 expression on macrophages residing in the synovial sublining correlated with a diminished response to two DMARD substrates of ABCG2; MTX and leflunomide [52]. However, in the current study, ABCG2 expression on MDMs was not significantly correlated with DMARD-responsiveness, neither were expression levels of the other ABC transporters. It is conceivable that a 7 day ex vivo/in vitro culture period of MDMs could have deranged possible correlative effects as opposed to macrophages directly stained for ABCG2 within the synovial architecture of RA patients [52]. Furthermore, it should also be considered that ABCG2 expression on synovial macrophages was observed already prior to the initiation of treatment with the DMARDs MTX and leflunomide [52], while in the present study ABCG2 expression was noted on MDMs from patients of whom the majority received MTX treatment. Hence, when ABCG2 expression would be dominantly influenced by micro-environmental factors (e.g. hypoxia [102]) in synovial tissue rather than being DMARD therapy induced, this may also account for an apparent lack of correlation of ABCG2 expression on MDMs with MTX response. Whether this also holds for other DMARDs or combinations of DMARDs, remains to be established.
Finally, the present study evaluated ABC transporter expression in two dominant immune cell subtypes, lymphocytes and macrophages, being implicated in evaluated in RA disease onset and progression [2]. However, a recent study also reported ABCB1 overexpression in fibroblast-like synoviocytes (FLS) of RA patients as a possible contributor of resistance in RA treatment [103]. This study did not report expression levels of other ABC transporters (e.g. ABCG2, ABCC1-6 and ABCC10), so whether ABCB1 is most differentially expressed in FLS remains to be investigated.
In conclusion, this is the first study that investigated the potential involvement of a broad panel of ABC transporters in immune cells in relation to DMARD treatment and clinical response parameters. The study confirms that ABCB1 in PBL and ABCG2 in MDM are potential determinants that could contribute to DMARD resistance. The knowledge of the preferred DMARD transport substrates of ABC transporters [24, 52], combined with the analysis of expression levels of ABC transporters on various subpopulations of immune-competent cells implicated in RA disease, may facilitate the selection of the proper treatment for individual RA patients with those DMARDs or experimental drugs that are not ABC transport substrates for either of the upregulated drug efflux transporters. The present study has its limitations due to its cross-sectional design and the small sample size of 3 RA subgroups of patients, which underpowered statistical analyses. However, the encouraging results obtained warrant further evaluation in studies with a longitudinal design to monitor alterations in expression/functional activity of ABC transporters during the course of treatment of individual RA patients.
| PBL: |
|---|
| ABCB1 functional efflux activity ↑ |
| ABCB1 mRNA ↑ |
| ABCC1 mRNA ↑ |
| ABCC4 mRNA ↑ |
| ABCC10 mRNA ↑ |
| MDM: |
| ABCG2 mRNA ↑ |
| ABCG2 protein ↑ |
Peripheral blood lymphocytes of RA patients differentially express higher mRNA levels of the ABC transporters ABCB1, ABCC1, ABCC4 and ABCC10, and exhibit higher functional efflux activity of ABCB1 over healthy individuals. Monocyte-derived macrophages of RA patients express significantly higher mRNA and protein levels of ABCG2 when compared with healthy individual counterparts.
ABC transporter transcript levels in PBL of DMARD of non-responding RA patients are increased over DMARD-responders, but did not attain statistical significance.
Elevated ABC transporter expression in 2 types of blood cell types of RA patients may underscore both a physiological role of ABC transporters in extrusion of inflammatory mediators and a pharmacological role in exporting DMARDs.
BACD, WFL, YGA, RJS, GJ designed the research study. RO, JWvdH, RvdV, GLS performed the research. RO, MB, JWvdH analyzed the data. RO and MB prepared the graphs. RO, BACD, WFL, YGA, RJS, GJ wrote the manuscript. All authors contributed to editorial changes in the manuscript. All authors read and approved the final manuscript.
The study protocol entitled ‘DMARD resistance’ was approved by the local Medical Ethics Committee of the VU University Medical Centre (Amsterdam, The Netherlands) and all subjects gave written informed consent before entering the study.
This study was supported by the Dutch Arthritis Association/ReumaNederland (NRF 03-I-40, to GJ), ZonMW (The Netherlands Organization for Health Research and Development (Grant 920-03-362, to JWvdH), and a visiting professor fellowship from the Royal Netherlands Academy of Arts and Sciences (to YGA).
The authors declare no conflict of interest.