

1 Ophthalmology Unit, Neurosciences, Mental Health, and Sense Organs (NESMOS) Department, Faculty of Medicine and Psychology, University of Rome Sapienza, 00189 Rome, Italy
2 Ophthalmology Unit, Sant'Andrea hospital, 00189 Rome, Italy
Abstract
Parkinson’s disease (PD) is a neurodegenerative disorder characterized by motor symptoms such as tremors, rigidity, and bradykinesia. While the diagnosis of PD primarily relies on clinical assessments and neurological examination, there has been growing interest in exploring non-invasive imaging techniques to aid in early detection and monitoring of the disease. In recent years, retinal imaging has emerged as a promising tool for studying PD due to the close anatomical and functional similarities between the retina and the brain. Retinal imaging methods, such as spectral domain optical coherence tomography and optical coherence tomography angiography, enable non-intrusive visualization and measurement of retinal structures and blood vessels. These techniques hold the promise of capturing alterations in retinal structure and function that could potentially mirror the underlying pathological mechanisms in PD. This review article aims to provide an overview of the current understanding of retinal changes in PD and the potential utility of retinal imaging as a diagnostic and monitoring tool.
Keywords
- Parkinson’s disease
- retinal imaging
- spectral-domain optical coherence tomography
- optical coherence tomography angiography
- neurodegenerative disorders
-synuclein
Parkinson’s disease (PD) is a progressive and chronic neurodegenerative
condition characterized by the degeneration of dopaminergic neurons in the
midbrain substantia nigra pars compacta. Additionally, it is marked by the
presence of abnormal protein aggregates called Lewy bodies and Lewy neurites,
mainly composed of misfolded
The etiology of PD remains largely unknown, with both genetic and environmental factors implicated in its pathogenesis [1]. Approximately 5–10% of PD cases are attributed to monogenic forms of the disease, with mutations in genes such as SNCA, LRRK2, and PARKIN identified [1]. However, most PD cases are idiopathic, with no identifiable genetic etiology. Diagnosing PD is primarily based on recognizing its characteristic motor symptoms [3]. However, accurately diagnosing PD, especially during the early stages, can be challenging due to the subtle nature of the symptoms and potential overlap with other neurological disorders. As a result, misdiagnoses are not uncommon, leading to delays in appropriate treatment and management [2, 4].
In addition to motor symptoms, PD is now recognized as a complex and heterogeneous disorder with various non-motor manifestations. These non-motor symptoms encompass cognitive impairment, mood disorders like depression and anxiety, sleep disturbances, autonomic dysfunction, visual changes, and sensory abnormalities [5]. The presence of non-motor symptoms further complicates the diagnostic process, as they may precede the onset of motor symptoms or occur independently, leading to a broader clinical spectrum of PD [5, 6].
Given the challenges in diagnosing PD and the importance of early detection, there has been a growing interest in exploring alternative diagnostic approaches to complement standard clinical assessments. One emerging area of research focuses on retinal imaging techniques to better understand the pathophysiological changes associated with PD [7, 8, 9].
Retinal imaging has recently emerged as a promising technique for investigating neurodegenerative conditions, including PD [9, 10, 11]. The retina possesses remarkable similarities in embryological development, anatomy, and function with the brain. It consists of diverse cell types, including retinal ganglion cells (RGCs), which act as the primary output neurons of the retina, transmitting their axons through the optic nerve to the brain. Due to the shared embryological origin and the close anatomical relationship between the retina and the brain, there is a hypothesis that retinal changes might reflect alterations in the central nervous system in neurodegenerative diseases and systemic disease [12, 13, 14, 15, 16, 17].
Retinal imaging techniques, such as spectral domain optical coherence tomography (SD-OCT) and optical coherence tomography angiography (OCTA), allow for non-invasive visualization and quantification of retinal structures and vasculature [18, 19]. These techniques offer the potential to capture structural and functional changes in the retina that may reflect the underlying pathological processes in PD. Consequently, there has been growing interest in exploring the utility of retinal imaging as a diagnostic and monitoring tool in PD [20, 21, 22].
The objective of this review is to provide a comprehensive overview of the current knowledge regarding retinal changes in PD and to assess the potential of retinal imaging as a valuable approach for diagnosing and monitoring the disease. The aim is to contribute to the advancement of more precise diagnostic methods and monitoring strategies, ultimately enhancing patient outcomes and facilitating the development of novel therapies for PD.
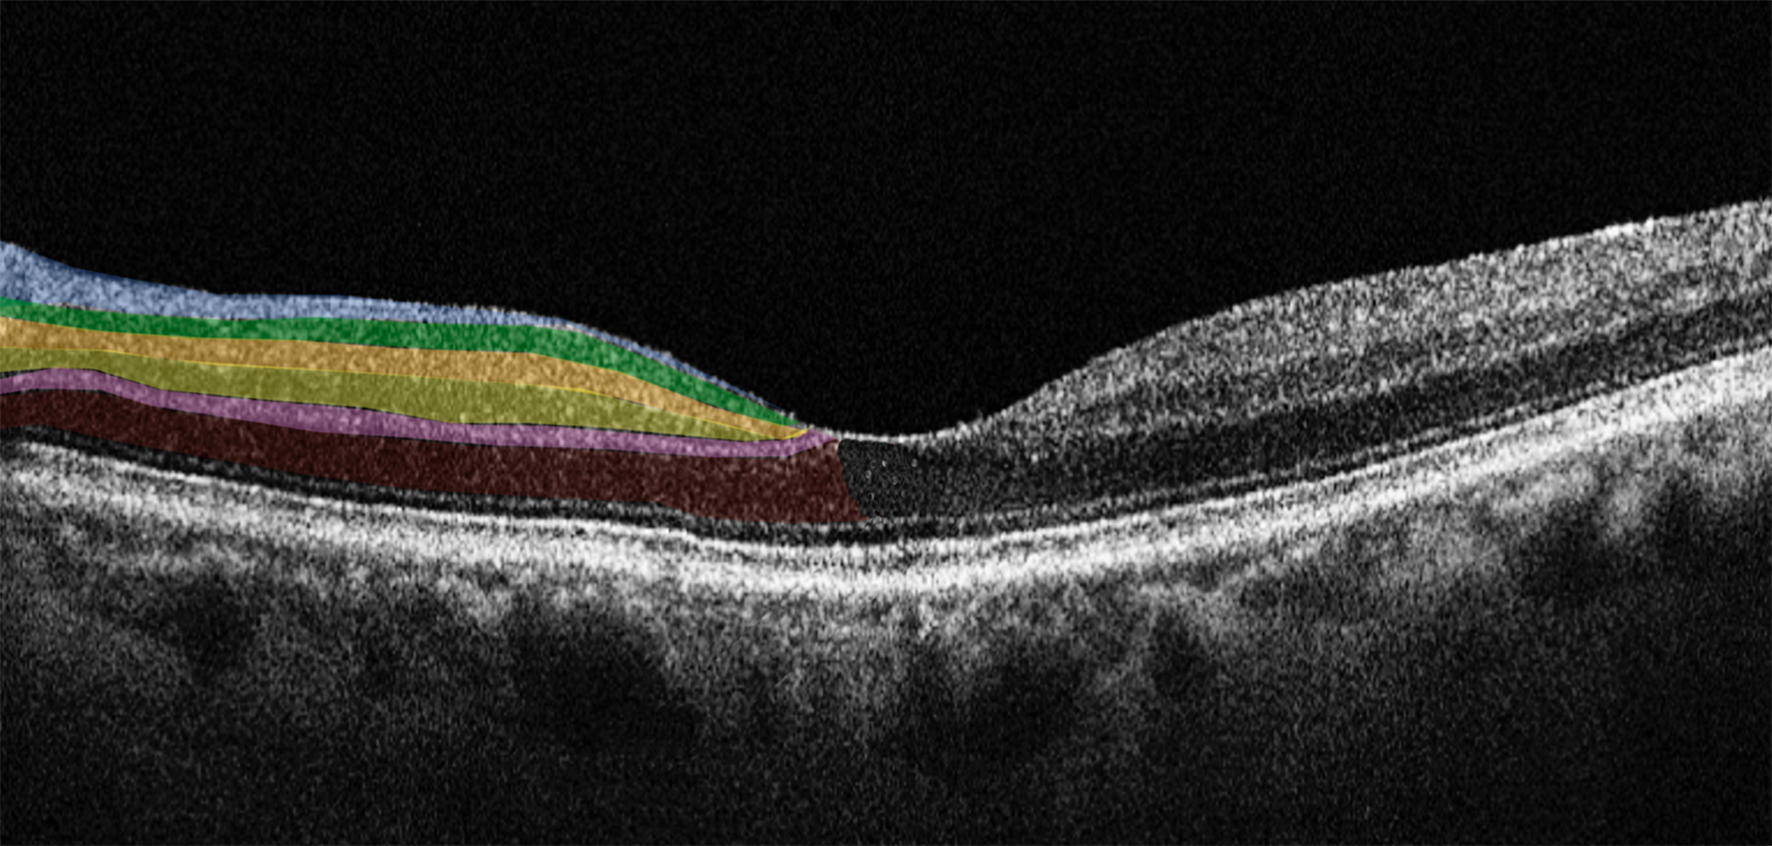
The retina is an extension of the central nervous system and consists of several layers, including from inside to outside: the retinal nerve fiber layer (RNFL), the ganglion cell layer (GCL), the inner plexiform layer (IPL), the inner nuclear layer (INL), the outer plexiform layer (OPL), the outer nuclear layer (ONL), the photoreceptor layer, and the retinal pigmented epithelium (RPE) (Fig. 1, Ref. [8]).
 Fig. 1.
Horizontal spectral domain optical coherence tomography (SD-OCT) cross-sectional scan passing through the fovea. The various retinal layers are shown with added color overlayers on the left side as follows: blue: retinal nerve fiber layer; green: ganglion cell layer; orange: inner plexiform layer; yellow: inner nuclear layer; pink: outer plexiform layer; red: outer nuclear layer. The right side shows original SD-OCT output in scales of grey. Reproduced with permission from Di Pippo M, Fragiotta S, Di Staso F, Scuderi L, Abdolrahimzadeh S. The Role of Alpha-Synuclein Deposits in Parkinson’s Disease: A Focus on the Human Retina. International Journal of Molecular Sciences 2023; 24: 4391 [8].
These layers are analogous to specific regions of the brain, allowing for
comparative analysis between retinal and brain pathologies [7, 23, 24]. In PD there
are numerous observed retinal pathophysiological changes, making it highly
intriguing to explore the connection between these retinal alterations and the
underlying PD pathology. Extensive research on retinal changes in PD has provided
compelling evidence of
Further investigations have revealed
Notably, intraneuronal globular Lewy bodies have been observed in the INL and
diffuse
Retinal imaging techniques have emerged as potentially valuable means in PD research, offering promising avenues for non-invasive and comprehensive exploration of the neurodegenerative processes associated with the condition. Among the advanced methods employed in this field are SD-OCT and OCTA. Although their full recognition and integration into PD diagnosis and monitoring are still evolving, these techniques show significant potential in unraveling the complexities of the disease and may eventually play a crucial role in enhancing our understanding and management of PD [10].
SD-OCT is a cutting-edge imaging technique widely employed in ophthalmology and medical research to non-invasively visualize and analyze ocular structures, particularly the retina, with exceptional resolution [34, 35, 36]. By utilizing low-coherence interferometry principles, SD-OCT enables high-definition cross-sectional imaging of tissue microstructures at the micrometer level.
In SD-OCT, a broad-spectrum light source is divided into sample and reference arms. The sample arm directs near-infrared light onto the target tissue, while the reference arm establishes a mirrored path [18, 37]. The interference between the light from both arms creates an interference pattern, from which time-delay information at various depths within the tissue is extracted. This data is Fourier-transformed to generate depth-resolved A-scans, providing detailed reflectivity profiles of the retinal layers and structures. With its exceptional resolution, SD-OCT allows in vivo evaluation of the retina, allowing for the analysis of individual retinal layer thickness and morphology, facilitating the assessment of subtle changes in retinal thickness, detection of abnormalities, and monitoring of disease progression [18, 34, 38, 39].
As for its application in PD research, SD-OCT shows potential in investigating retinal alterations associated with the condition [8]. Some studies reported a reduction in mean RNFL and retinal thickness, particularly in the nasal sector [40]. Additionally, thinning of macular and peripapillary RNFL and diminished macular volumes in para- and perifoveal regions were observed, indicating potential ganglion cell loss and dopaminergic depletion [41, 42].
However, not all studies found significant differences in SD-OCT parameters
between PD patients and controls. Some studies reported no changes in RNFL and
ganglion cell complex (GCC) thickness, suggesting that retinal damage in PD may
be challenging to detect with current instrumentation [43, 44]. In contrast, other
studies highlighted thinning of retinal layers and GCC thickness in PD patients
[45]. Some discrepancies might be attributed to the varying disease stages of the
PD patients included in the studies [45]. Moreover, the presence of
It is important to acknowledge that while SD-OCT holds promise as a means to study PD-related retinal changes, its definitive recognition as a diagnostic tool for PD remains an area of active investigation. Continued research and exploration of SD-OCT’s capabilities may ultimately lead to its broader integration as a valuable adjunctive method for diagnosing and managing PD and other neurodegenerative conditions.
OCTA represents a groundbreaking extension of SD-OCT, allowing non-invasive visualization of the retinal vasculature without needing contrast agents. OCTA leverages the motion contrast of red blood cells to create high-resolution three-dimensional angiograms of the retinal microvasculature. This technique enables the assessment of blood flow within the different retinal layers, including the superficial and deep capillary plexuses, and the choriocapillaris, and may offer insight into the pathophysiological processes of neurodegenerative conditions [19, 48, 49, 50, 51].
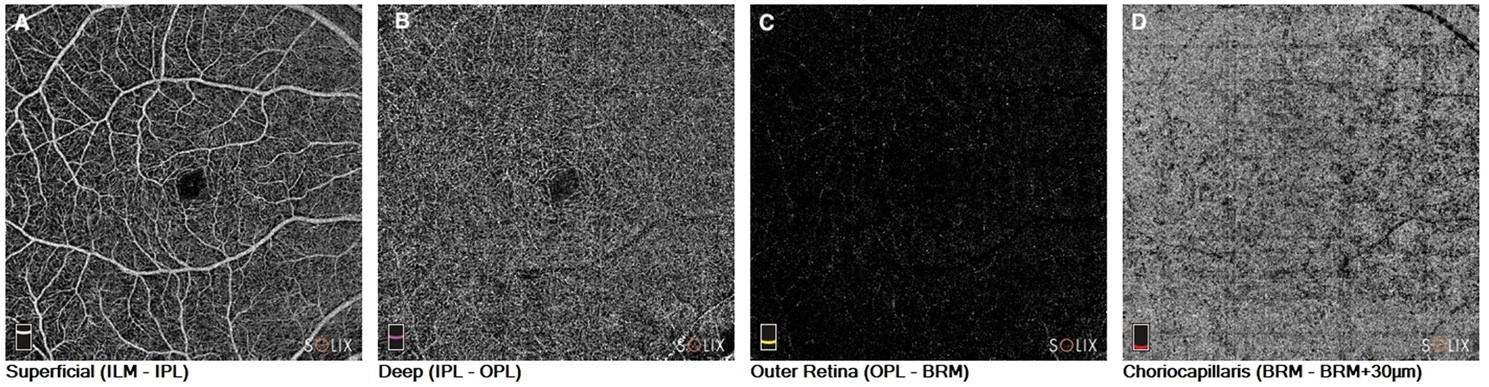
OCTA has been instrumental in identifying microvascular changes associated with PD. Studies have reported alterations in retinal vessel density, perfusion, and vascular flow in individuals with PD, suggesting the presence of retinal microvascular abnormalities. This non-invasive imaging method offers advantages in detecting early vascular changes that might be linked to PD pathology, allowing researchers to investigate the potential of retinal vasculature as a biomarker for the disease [20] (Fig. 2).
 Fig. 2.
Optical coherence tomography angiography in a patient with Parkinson’s disease. En-face images of the (A). Superficial capillary plexus of the retina. (B) Deep capillary plexus of the retina. (C) Outer retina; and (D) Choriocapillaris. ILM, internal limiting membrane; IPL, inner plexiform layer; OPL, outer plexiform layer; BRM, Bruch’s membrane.
The first OCTA study in PD patients was carried out by Kwapong et al.
[52] in 2018. The authors showed a reduction in the retinal vascular density (VD)
of the superficial capillary plexus (SCP) and the deep capillary plexus (DCP)
compared to healthy subjects, with greater involvement of the SCP than the DCP.
Kwapong et al. [52] speculated that their results may be justified by
the increased accumulation of
Shi et al. [53] conducted a study of retinal capillary complexity by analyzing the fractal dimension of OCTA images. The authors reported a reduction of the capillary retinal VD, a reduction in the PFD, and a reduction in the complexity of the capillary network in both the SCP and the DCP, with an inverse correlation between the complexity of the SCP and the thickness of the GCL. They also showed a progressive reduction in the complexity of the DCP as the duration of the disease progressed. The authors highlighted how the loss of capillary complexity, although present in both plexuses, was more represented in the SCP, suggesting that retinal micro vascularization in the inner layers of the retina is particularly susceptible and closely related to retinal structural changes due to disease [53].
Xu et al. [54] explored the VD of the SCP and the foveal avascular zone (FAZ) in PD patients, dividing them into subgroups according to the Hoehn-Yahr disease stage (H-Y). The authors showed, in line with previous studies, an overall reduction of VD of the SCP in PD patients compared to healthy controls, and a negative correlation between VD and H-Y stage. As for the FAZ, the authors found a significant reduction in patients with stage H-Y I versus healthy controls, suggesting that this parameter could be a more reliable biomarker in identifying early-stage disease [54]. Berkowitz and Patel, and Murueta-Goyena et al. [55] also found the same results on the FAZ [56].
From a physiopathological point of view, the mechanism by which intraretinal vascular changes arise has not yet been well clarified. It is known that at cerebral level, together with neuronal degeneration, there is also a degeneration of vascularity, evident in particular at the level of the endothelium of the vessels [57]. Zhang et al. [58] evaluated the macular density of the SCP and the thickness of the GCC in patients with PD by comparing it with healthy subjects. The authors showed a reduction of both parameters in affected subjects and a correlation between the two, suggesting a relationship between vascular damage and neuronal damage.
Given the homology between retinal and cerebral microvascularization, concurrent cerebral angiopathy in PD may extend to the retina, resulting in changes to the microvascular network [52]. As for the FAZ, its involvement in PD may be related to its anatomical structure. It is known that the FAZ is an avascular region surrounded by a continuous capillary network. This area is rich in dopaminergic neurons, whose ongoing depletion of PD could stimulate the vasculogenesis of the surrounding continuous capillary network by reducing the size of the FAZ [59].
The diagnostic potential of retinal imaging in PD has gained significant attention in recent years due to its non-invasive nature and the potential to capture disease-specific retinal changes. Several studies have been conducted to investigate the diagnostic accuracy of various retinal imaging techniques for PD, shedding light on their sensitivity and specificity in distinguishing PD patients from healthy individuals or other neurodegenerative disorders.
SD-OCT has shown findings of thinning in the RNFL and GCL in PD patients compared to healthy controls. The thinning of these layers appears to correlate with disease severity and duration, making SD-OCT a potential tool for monitoring disease progression [60, 61].
OCTA studies have revealed alterations in the retinal microvasculature of PD patients, including reduced VD and changes in perfusion patterns. These vascular changes may reflect underlying neurovascular dysfunction in PD and could serve as valuable biomarkers for the disease [52, 53, 54].
The sensitivity and specificity of retinal imaging techniques in differentiating PD patients from healthy individuals or other neurodegenerative disorders have varied across studies. While some investigations have reported high sensitivity and specificity, others have shown more modest results [43, 62]. SD-OCT has demonstrated relatively good sensitivity and specificity in distinguishing PD patients from healthy controls. The thinning of the RNFL and GCL appears to be a useful marker, although its specificity may be limited by similar findings in other neurodegenerative conditions [63, 64, 65]. OCTA sensitivity and specificity in PD diagnosis are still under investigation. While changes in retinal vasculature have been linked to PD, standardization of OCTA protocols and rigorous validation in large and diverse populations are required to establish its diagnostic accuracy conclusively [20, 43]. As OCTA is an evolving technology, analysis of images should be performed by expert ophthalmologists in imaging owing to the possible sources of artifacts such as projection artifacts, shadowing artifacts, segmentation errors, and motion artifacts [66, 67, 68]. In the context of performing OCTA in PD patients, it is crucial to account for motion artifacts as they can affect image quality. A study by Lauermann et al. [67] shed light on the impact of artifacts and revealed that their frequency is comparable between PD patients and healthy controls. However, within the PD group, longer disease duration and more severe motor symptoms were associated with a higher occurrence of movement artifacts [67]. It is essential to recognize that even in healthy individuals, OCTA imaging can be susceptible to artifacts, including those caused by motion, as supported by this study. Nonetheless, PD is characterized by distinctive motor symptoms like tremors, bradykinesia, and stiffness, along with neuropsychiatric symptoms such as reduced attention control, worsening progressively as the disease progresses [69]. These factors can significantly impact the quality of OCTA images, making it critical to carefully consider their influence during the analysis and interpretation of results in PD patients.
One of the most promising aspects of retinal imaging in PD is its potential for early detection of the disease. As PD-related retinal changes may precede clinical motor symptoms, retinal imaging could serve as a non-invasive and cost-effective screening tool. Early detection could facilitate timely interventions and possibly slow disease progression [70, 71]. Despite the encouraging findings, challenges remain in establishing retinal imaging as a standalone diagnostic tool for PD. Standardization of imaging protocols, large-scale multicenter studies, and validation in diverse populations are essential for establishing robust diagnostic criteria. Moreover, longitudinal studies are needed to evaluate the stability of retinal changes over time and their correlation with disease progression.
Within the realm of PD detection strategies, a salient emphasis rests on the non-motor symptoms, which are progressively being acknowledged as pivotal indicators of the condition. These symptoms often unveil themselves before the overt motor manifestations, carrying paramount diagnostic value. These include mood disorders, such as anxiety and depression; sleep irregularities, especially of the rapid eye movement (REM) phase; cognitive impairment; autonomic dysfunctions; and visual disturbances, particularly changes in contrast sensitivity and in color discrimination [72]. Timely recognition of these symptoms could potentially serve as a formidable arsenal for the early diagnosis of PD.
Diederich et al. [73] conducted a study aimed at unraveling the discriminative potential of these non-motor symptoms in identifying incipient forms of PD. Among the diverse parameters scrutinized, the visual deficits, assessed via the Farnsworth-Munsell test for color discrimination and the Pelli-Robson test for contrast sensitivity, emerged as preeminent entities. These visual metrics demonstrated substantial discriminatory ability, characterized by an area under the receiver operating characteristic (ROC) curve of 0.83. Notably, this discrimination efficacy augmented when synergized with the dysautonomia questionnaire scores. Their deduction posited these visual assessments as expeditious screening tools for early PD diagnosis [73].
Subsequent corroboration was provided by Hannaway et al. [74] through a prospective study encompassing a 3-year follow-up of 100 PD subjects. Their investigation illuminated the predictive role of the alteration of higher-order visual function in foreseeing outcomes such as dementia onset, mortality, and frailty in PD patients. Intriguingly, a parallel analysis of variations in retinal thicknesses yielded non-statistically significant results. This discrepancy was rationalized by invoking the retrograde propagation model of PD damage, whereby cortical neurodegeneration outpaces retinal neurodegeneration. While these results offer interesting insights, further in-depth investigations are warranted to unravel the intricate pathogenic underpinnings of this phenomenon [74].
In recent years, retinal imaging has emerged as a promising tool also for monitoring PD progression and evaluating treatment responses. Longitudinal studies utilizing various retinal imaging techniques have provided valuable insights into the dynamic retinal changes associated with PD over time. Additionally, the potential of retinal imaging to assess treatment response and the effectiveness of therapeutic interventions in PD patients has been explored. Longitudinal studies involving retinal imaging have revealed that retinal changes in PD may evolve over time and correlate with disease severity and duration [75, 76]. Garcia-Martin et al. [75] in a longitudinal SD-OCT study demonstrated progressive thinning of the RNFL and GCL in PD patients, suggesting ongoing neurodegeneration. However, challenges remain, and further research is needed to fully utilize retinal imaging as a reliable monitoring tool in PD.
Assessing treatment response is crucial for evaluating the efficacy of therapeutic interventions in PD. Longitudinal studies using retinal imaging have explored the impact of dopaminergic medications on retinal changes in PD. In a research endeavor by Normando et al. [77], an investigation was undertaken into the retinal and cerebral modifications in rodent models of PD induced by rotenone. The study traced the changes in the retina and brain, employing sophisticated imaging techniques encompassing detection of retinal cells in apoptosis (DARC) and OCT. The findings revealed that the alterations in the retina, as discerned through these imaging modalities, manifested approximately 40 days prior to the histological transformations observed in the cerebral region. Subsequent therapeutic intervention employing the liposomal formulation of prolonged-release rosiglitazone yielded noteworthy outcomes. The neuroprotective effects of this therapy manifested initially in retinal cells and subsequently extended to impact the nigrostriatal neurons [77].
However, the long-term effects of dopaminergic therapy on retinal changes are still under investigation [62, 76, 78].
The incorporation of retinal imaging in PD, both regarding research and clinical evaluation, is a burgeoning field with significant potential, yet it is crucial to acknowledge and address the inherent limitations and challenges of this methodology. Ensuring the reliability and validity of retinal imaging findings in PD necessitates a thorough understanding of the factors influencing data acquisition, analysis, and interpretation of its use as a diagnostic and monitoring instrument [8, 43, 79].
A significant obstacle in retinal imaging research is the heterogeneity in image acquisition protocols and analysis techniques across different studies and imaging platforms. This lack of standardization can result in inconsistent findings and impede direct comparisons between studies. Factors such as imaging device settings, operator expertise, and patient cooperation during image capture can introduce variability [80]. Efforts are being made to establish standardized imaging protocols and develop automated image analysis algorithms to reduce inter-operator variability. Collaborative initiatives among research centers can facilitate the sharing of imaging data and validate findings across diverse patient populations[80].
Furthermore, it is crucial to emphasize that PD diagnosis currently relies on clinical criteria established by the International Parkinson Disease and Movement Disorder Society, exhibiting an accuracy surpassing 90%. Within this context, retinal imaging does not confer supplementary diagnostic insights compared to the existing gold standard. Conversely, its potential utility emerges in the early diagnostic phase, prior to the complete manifestation of all distinctive symptoms [81].
In PD research, it is imperative to account for confounding factors that may influence retinal imaging outcomes. Age, for instance, can affect various retinal parameters, and given that PD is predominantly a disease of the elderly, age-related changes are an important consideration. Additionally, the presence of other systemic comorbidities, such as hypertension or diabetes, or ocular comorbidity, such as age-related macular degeneration and glaucoma, can influence retinal vasculature and thickness measurements [35, 82, 83, 84, 85].
In recent years, retinal imaging has emerged as a promising non-invasive tool for investigating PD. Studies utilizing various retinal imaging techniques, such as SD-OCT and OCTA, have provided valuable insights into the structural and functional changes that occur in the retina in PD.
Key findings include thinning of the RNFL, alterations in retinal vasculature, and changes in RGCs. These retinal changes show correlations with disease severity and motor symptoms, suggesting the potential of retinal imaging as a biomarker for PD.
The future potential of retinal imaging in PD research and clinical practice is significant. Incorporating retinal imaging into routine assessments could aid in early PD detection, differential diagnosis from other neurodegenerative disorders, and monitoring disease progression. Moreover, retinal imaging may also facilitate the evaluation of treatment responses and the effectiveness of therapeutic interventions. This non-invasive and accessible approach to PD assessment could offer several advantages, including cost-effectiveness, patient acceptance, and the possibility of remote monitoring through telemedicine platforms. With the potential to identify retinal biomarkers and enable personalized medicine, retinal imaging holds promise for transforming PD management in the coming years.
While retinal imaging shows great promise, further research is essential to validate and establish standardized protocols for its clinical utility in PD management. Collaborative efforts among researchers, clinicians, and technologists are crucial to refine imaging techniques, optimize data analysis, and ensure reproducibility of results.
Longitudinal studies are needed to better understand the temporal relationship between retinal changes and PD progression. Additionally, large-scale multi-center trials should be conducted to validate the sensitivity and specificity of retinal imaging in distinguishing PD from other conditions and to identify its potential in tracking disease progression. With continued advancements in imaging technology and data analysis, retinal imaging may soon become an integral part of comprehensive PD assessment, offering improved patient outcomes and enhancing our understanding of this complex neurodegenerative disorder.
MDP and SA designed the research study. MDP, SDA, FR, CC, DF and SA performed the research. MDP, SDA, FR, CC, DF and SA analyzed the data. MDP, SDA, FR, CC, DF and SA drafted the manuscript. MDP and SA prepared the final version of the manuscript. MDP and SA carried out the review for critical intellectual content. All authors contributed to editorial changes in the manuscript. All authors read and approved the final manuscript. All authors have participated sufficiently in the work and agreed to be accountable for all aspects of the work.
Not applicable.
Not applicable.
This research received no external funding.
The authors declare no conflict of interest.
References
Publisher’s Note: IMR Press stays neutral with regard to jurisdictional claims in published maps and institutional affiliations.