


 , Jian Wu 4,*, Ya-li Wang 5,*
1 Department of Rehabilitation Medicine, The Affiliated Suzhou Hospital of Nanjing Medical University, Suzhou Municipal Hospital, Gusu School, 215000 Suzhou, Jiangsu, China
2 Department of Neurosurgery, The Affiliated Hospital of Jiang Nan University, 214000 Wuxi, Jiangsu, China
3 Department of Neurosurgery, The First Affiliated Hospital of Soochow University, 215006 Suzhou, Jiangsu, China
4 Department of Laboratory Medicine, The Affiliated Suzhou Hospital of Nanjing Medical University, Suzhou Municipal Hospital, Gusu School, 215000 Suzhou, Jiangsu, China
5 Department of Neurology, The Affiliated Suzhou Hospital of Nanjing Medical University, Suzhou Municipal Hospital, Gusu School, 215000 Suzhou, Jiangsu, China
†These authors contributed equally.
Abstract
Background: Deep brain stimulation (DBS) is recommended for the treatment of advanced Parkinson’s disease (PD), though individual reactions may be different. There are currently no clinically available biomarkers for predicting the responses of PD patients to DBS before surgery. This study aimed to determine serum biomarkers to predict DBS responses in PD. Methods: We profiled differentially expressed proteins (DEPs) in serum samples and identified potential biomarkers to predict the therapeutic responses to DBS in PD patients. Ten serum samples were selected from PD patients to identify DEPs via mass spectrometry proteomics; these were then verified by enzyme-linked immunosorbent assay in another 21 serum samples of PD patients. Results: The present study identified 14 DEPs (10 downregulated and four upregulated DEPs) with significantly different levels between non-responders and responders. Most of the DEPs were related to amino acid metabolism and protein modification pathways. Bleomycin hydrolase (BLMH) and creatine kinase M-type (CKM) were found to be significantly downregulated in the responders. Additionally, subsequent logistic regression and receiver operating characteristic analyses were performed to determine the diagnostic performance of candidate proteins. Conclusions: The identified DEPs show potential as biomarkers for the accurate evaluation of DBS therapeutic responses before surgery. Furthermore, assessment of serum BLMH and CKM may be particularly useful for predicting the therapeutic responses to DBS in PD patients.
Keywords
- Parkinson's disease
- proteomic
- deep brain stimulation
- serum biomarker
Parkinson’s disease (PD) is a common neurodegenerative disease that mainly manifests as bradykinesia, quiescent myotonia, and postural instability [1]. Although levodopa treatment can mitigate motor symptoms in PD patients, long-term use of levodopa can result in motor complications [2]. Deep brain stimulation (DBS) was first applied in the surgical treatment for PD in 1991 [3]. Recently, DBS has been recommended for treatment of advanced stages of PD [4]. However, there are individual differences in the therapeutic responses to DBS in PD patients. Recently, most studies have shown that different PD patients experience different therapeutic effects and clinical outcomes after DBS surgery [5]. Therefore, in addition to electrode placement and appropriate stimulation parameters, the selection of PD patients is the most important predictor of DBS treatment effect [6, 7]. In practice, the main factors considered in the selection process include PD diagnosis, response to levodopa, cognitive function, and psychiatric symptoms [6, 8]. However, there are no standards governing the evaluation of these aspects, so the clinical variables in these patients are likely to be diverse. In addition, selecting an appropriate patient does not accurately predict the level of patient satisfaction or clinical outcomes after DBS surgery [9]. Hence, it is necessary to explore biomarkers to predict DBS responses in PD patients.
Proteomics is the study of proteins in biological tissues, and is used to quantitatively compare changes in protein levels under different conditions, including after treatment [10]. Recently, proteomics has been used to explore the pathogenesis and associated biomarkers in PD patients [11]. However, there have been only a few studies focusing on predicting the therapeutic responses to DBS in PD patients [12, 13, 14]. Blood, brain tissue, and cerebrospinal fluid (CSF) from PD patients can be used in proteomic analysis [11, 15]. However, compared with brain tissue and CSF, blood is often used for proteomic analysis because this causes the least amount of discomfort for patients [16]. Currently, there are no clinically available serum biomarkers to predict therapeutic responses to DBS in PD patients before surgery.
In this study, we analyzed serum specimens obtained from PD patients before DBS surgery using label-free technology with liquid chromatography-tandem mass spectrometry (LC-MS/MS). We aimed to identify differentially expressed proteins (DEPs) as potential biomarkers for predicting the responses to DBS.
PD patients were screened for eligibility at the Neurosurgery Department of the First Affiliated Hospital of Soochow University between January 2022 and October 2022. These idiopathic PD patients without dementia [17] were enrolled according to the Movement Disorders Society criteria [18]. Participants all underwent subthalamic nucleus deep brain stimulation (STN-DBS) electrode implantation and micro recording was performed intraoperatively. After surgery, these patients were followed up for 1 year. During follow-up, we performed DBS programming for all participants based on the patient’s condition, at least once every 2 weeks. Unified Parkinson’s Disease Rating Scale (UPDRS) scores, Hoehn and Yahr (H&Y) scores, levodopa equivalent daily dose (LEDD), and clinical phenotypes [19] were evaluated at the medication-off state at baseline and after follow-up. All evaluations were conducted by two professional technicians blinded to the grouping.
According to the criteria of DBS response that defined the assessment of significant improvement as a 50% or greater decrease in UPDRS score at the end of follow-up, participants were assigned to the non-responder group or the responder group by two researchers. To analyze global protein expression in the non-responders and responders, we collected serum from these patients and used LC-MS/MS to profile DEPs. The upregulated and downregulated DEPs (the candidate DEPs) were then verified by enzyme-linked immunosorbent assay (ELISA) in a new set of samples, including 21 PD patients (10 Non-responders and 11 Responders) having undergone DBS.
This study was authorized by the Ethics Committee of the First Affiliated Hospital of Soochow University (Ethics Committee approval code: 2022-422). Informed consent was obtained from all patients.
Eleven serum samples were used for proteomic analysis. First, we employed the Pierce Top 14 Abundant Protein Depletion Spin Column kit (Thermo Fisher Scientific, Waltham, MA, USA) to remove high-abundance proteins from each sample. After collecting the supernatant, we determined protein concentrations using the Pierce BCA Protein Assay kit (Thermo Fisher Scientific, USA). Protein solutions were digested using 100 mM TEAB buffer, followed by addition of trypsin at 1:100 trypsin-to-protein mass. The peptides were recovered by centrifugation at 12,000 g for 10 min at room temperature, and the peptides were recovered with ultrapure water once, and then the two peptide solutions were combined [20].
The peptides were added to solvent A, and directly onto a reversed-phase analysis column. On the EASY-nLC 1200 UPLC system (Thermo Fisher Scientific, USA), the gradient with solvent B was increased from 4% to 20% for 68 minutes, from 20% to 32% for 14 minutes, up to 80% for 4 minutes, and then remained at 80% for the last 4 minutes. The peptides were placed in a nanoliter electrospray ionization (NSI) source and then using the Orbitrap Exploris 480 Mass Spectrometer (Thermo Fisher Scientific, USA). With the m/z scan range from 400 to 1200, intact peptides were found in the Orbitrap at 60,000 resolution. Subsequently, we selected peptides for analysis and detected the fragments in the Orbitrap at 30,000 resolution [21].
The LC-MS/MS data were processed using the Proteome Discoverer search engine
(v2.4.1.15) (Thermo Fisher, USA) [21]. Mass spectrometry data were collected from
the FASTA database (homo_sapiens 9606_PR_20201214; 75,777 entries; (https://www.uniprot.org/proteomes/UP000005640)
concatenated with the reverse decoy database. Trypsin (full) was used as the
cleavage enzyme that allows up to two missing cleavages. The mass value of the
precursor ion was 10 ppm and that of the fragment ion was 0.02 Da. The fixed
modification was carbamidomethyl (Cys), while the variable modifications included
protein N-terminal acetylation, oxidation (Met), Met-loss (Met), and Met-loss +
acetyl (Met). The false discovery rate for proteins and peptides was set at
The characteristics of the participants who underwent proteomic analysis are
shown in Table 1. Before DBS surgery, no obvious differences were found in sex,
age, disease duration, H&Y scale score, UPDRS score, clinical phenotype, or LEDD
in the medication-off state. At the end of the follow-up, the UPDRS and LEDD
scores were significantly reduced in the responder group (p
| Non-responders (n = 4) | Responders (n = 6) | p-value | |
| Age (y) | 59.75 |
60.66 |
0.824 |
| Female n (%) | 2 (50.0) | 4 (66.7) | 0.598 |
| Disease duration (y) | 9.50 |
8.33 |
0.579 |
| H&Y score | 3.25 |
3.08 |
0.616 |
| UPDRS score before DBS (off) | 50.00 |
47.83 |
0.483 |
| UPDRS score after DBS (off) | 34.00 |
19.83 |
0.006* |
| TD subtype n (%) | 2 (50.0) | 4 (66.7) | 0.598 |
| LEDD before DBS (mg/d) | 825.0 (468.7–1012.5) | 737.5 (512–800.0) | 0.517 |
| LEDD after DBS (mg/d) | 825.0 (637.5–975.0) | 500.0 (362.5–625.0) | 0.025* |
Values are presented as mean
The UniProt-GOA database (http://www.ebi.ac.uk/GOA/) was used for gene ontology
(GO) annotation, and eggnog-mapper software
(http://eggnog5.embl.de/) was used to
obtain the GO functions of proteins. We divided proteins into three categories.
Statistical significance was set at p
For the validation study, three proteins were selected as being highly
differentially expressed (absolute fold change
IBM SPSS software (version 24.0; IBM Corp., Armonk, NY, USA) was used for
statistical analysis. The comparisons of variables between non-responders and
responders were analyzed using two-sample t-tests or Mann–Whitney U
tests for continuous data, and chi-squared tests for categorical data.
Furthermore, we used logistic regression and receiver operating characteristic
(ROC) curve analyses to determine the diagnostic performance of candidate
proteins. Statistical significance was set at p
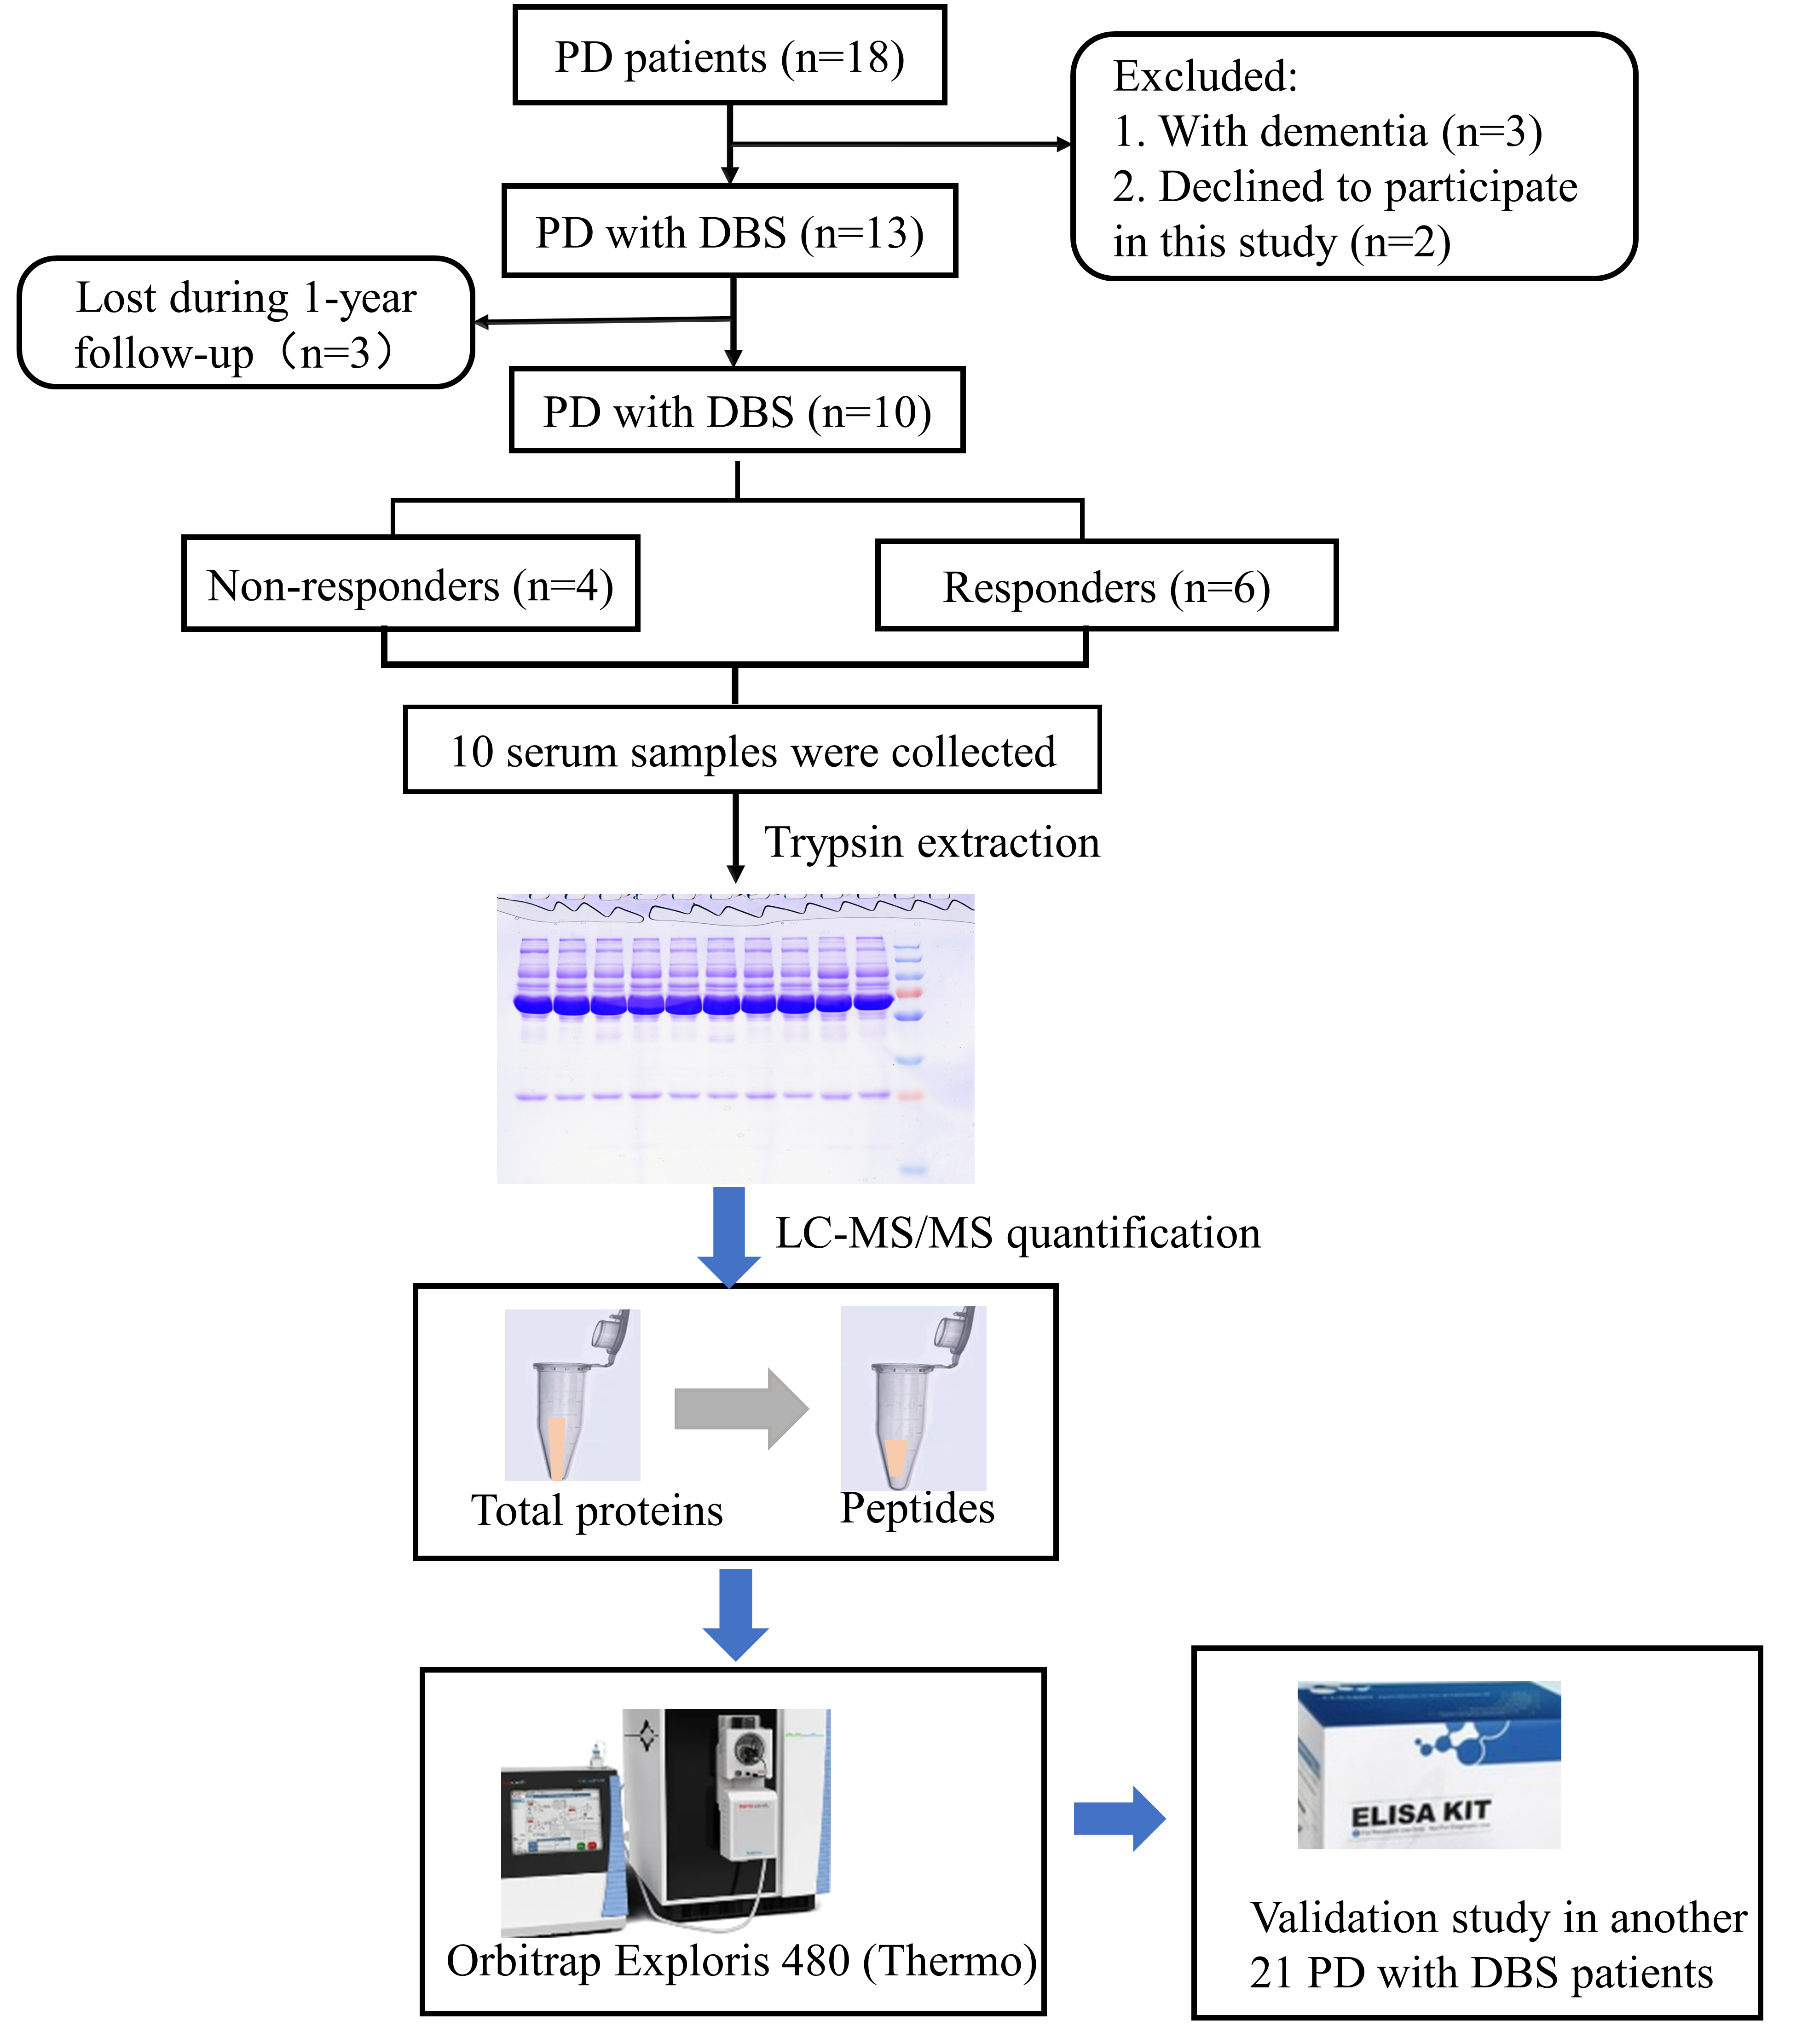
Eighteen PD patients were screened for eligibility. In accordance with the inclusion and exclusion criteria, three patients with dementia were excluded and two patients declined to participate in this study. Finally, 13 participants were enrolled. These patients underwent STN-DBS electrode implantation and were then followed up for 1 year after DBS surgery. Three patients were subsequently lost during follow-up, and 10 PD patients (four non-responders and six responders) were enrolled for proteomics analysis. The study workflow is shown in Fig. 1.
 Fig. 1.
Study workflow. LC‒MS/MS, liquid chromatography-tandem mass spectrometry.
First, we evaluated mass spectrometry-based proteomics data based on
multifaceted quality control indexes. Proteins above 10 kDa were evenly
distributed without significant molecular weight drift (Fig. 2A). The proportion
of proteins with more than two peptides was 72% (Fig. 2B). Most of the peptides
were between 10 and 30 amino acids in length (Fig. 2C). Most proteins had a
coverage of less than 20% (Fig. 2D). In total, we detected 601,818 spectra, 7875
unique peptides, 8741 peptides, 130,117 matched spectrums, 1290 proteins, and we
quantified 1157 proteins. Compared with the non-responder group, there were 10
downregulated and four upregulated proteins in the responder group (Fig. 2E).
Significant differences were defined as a
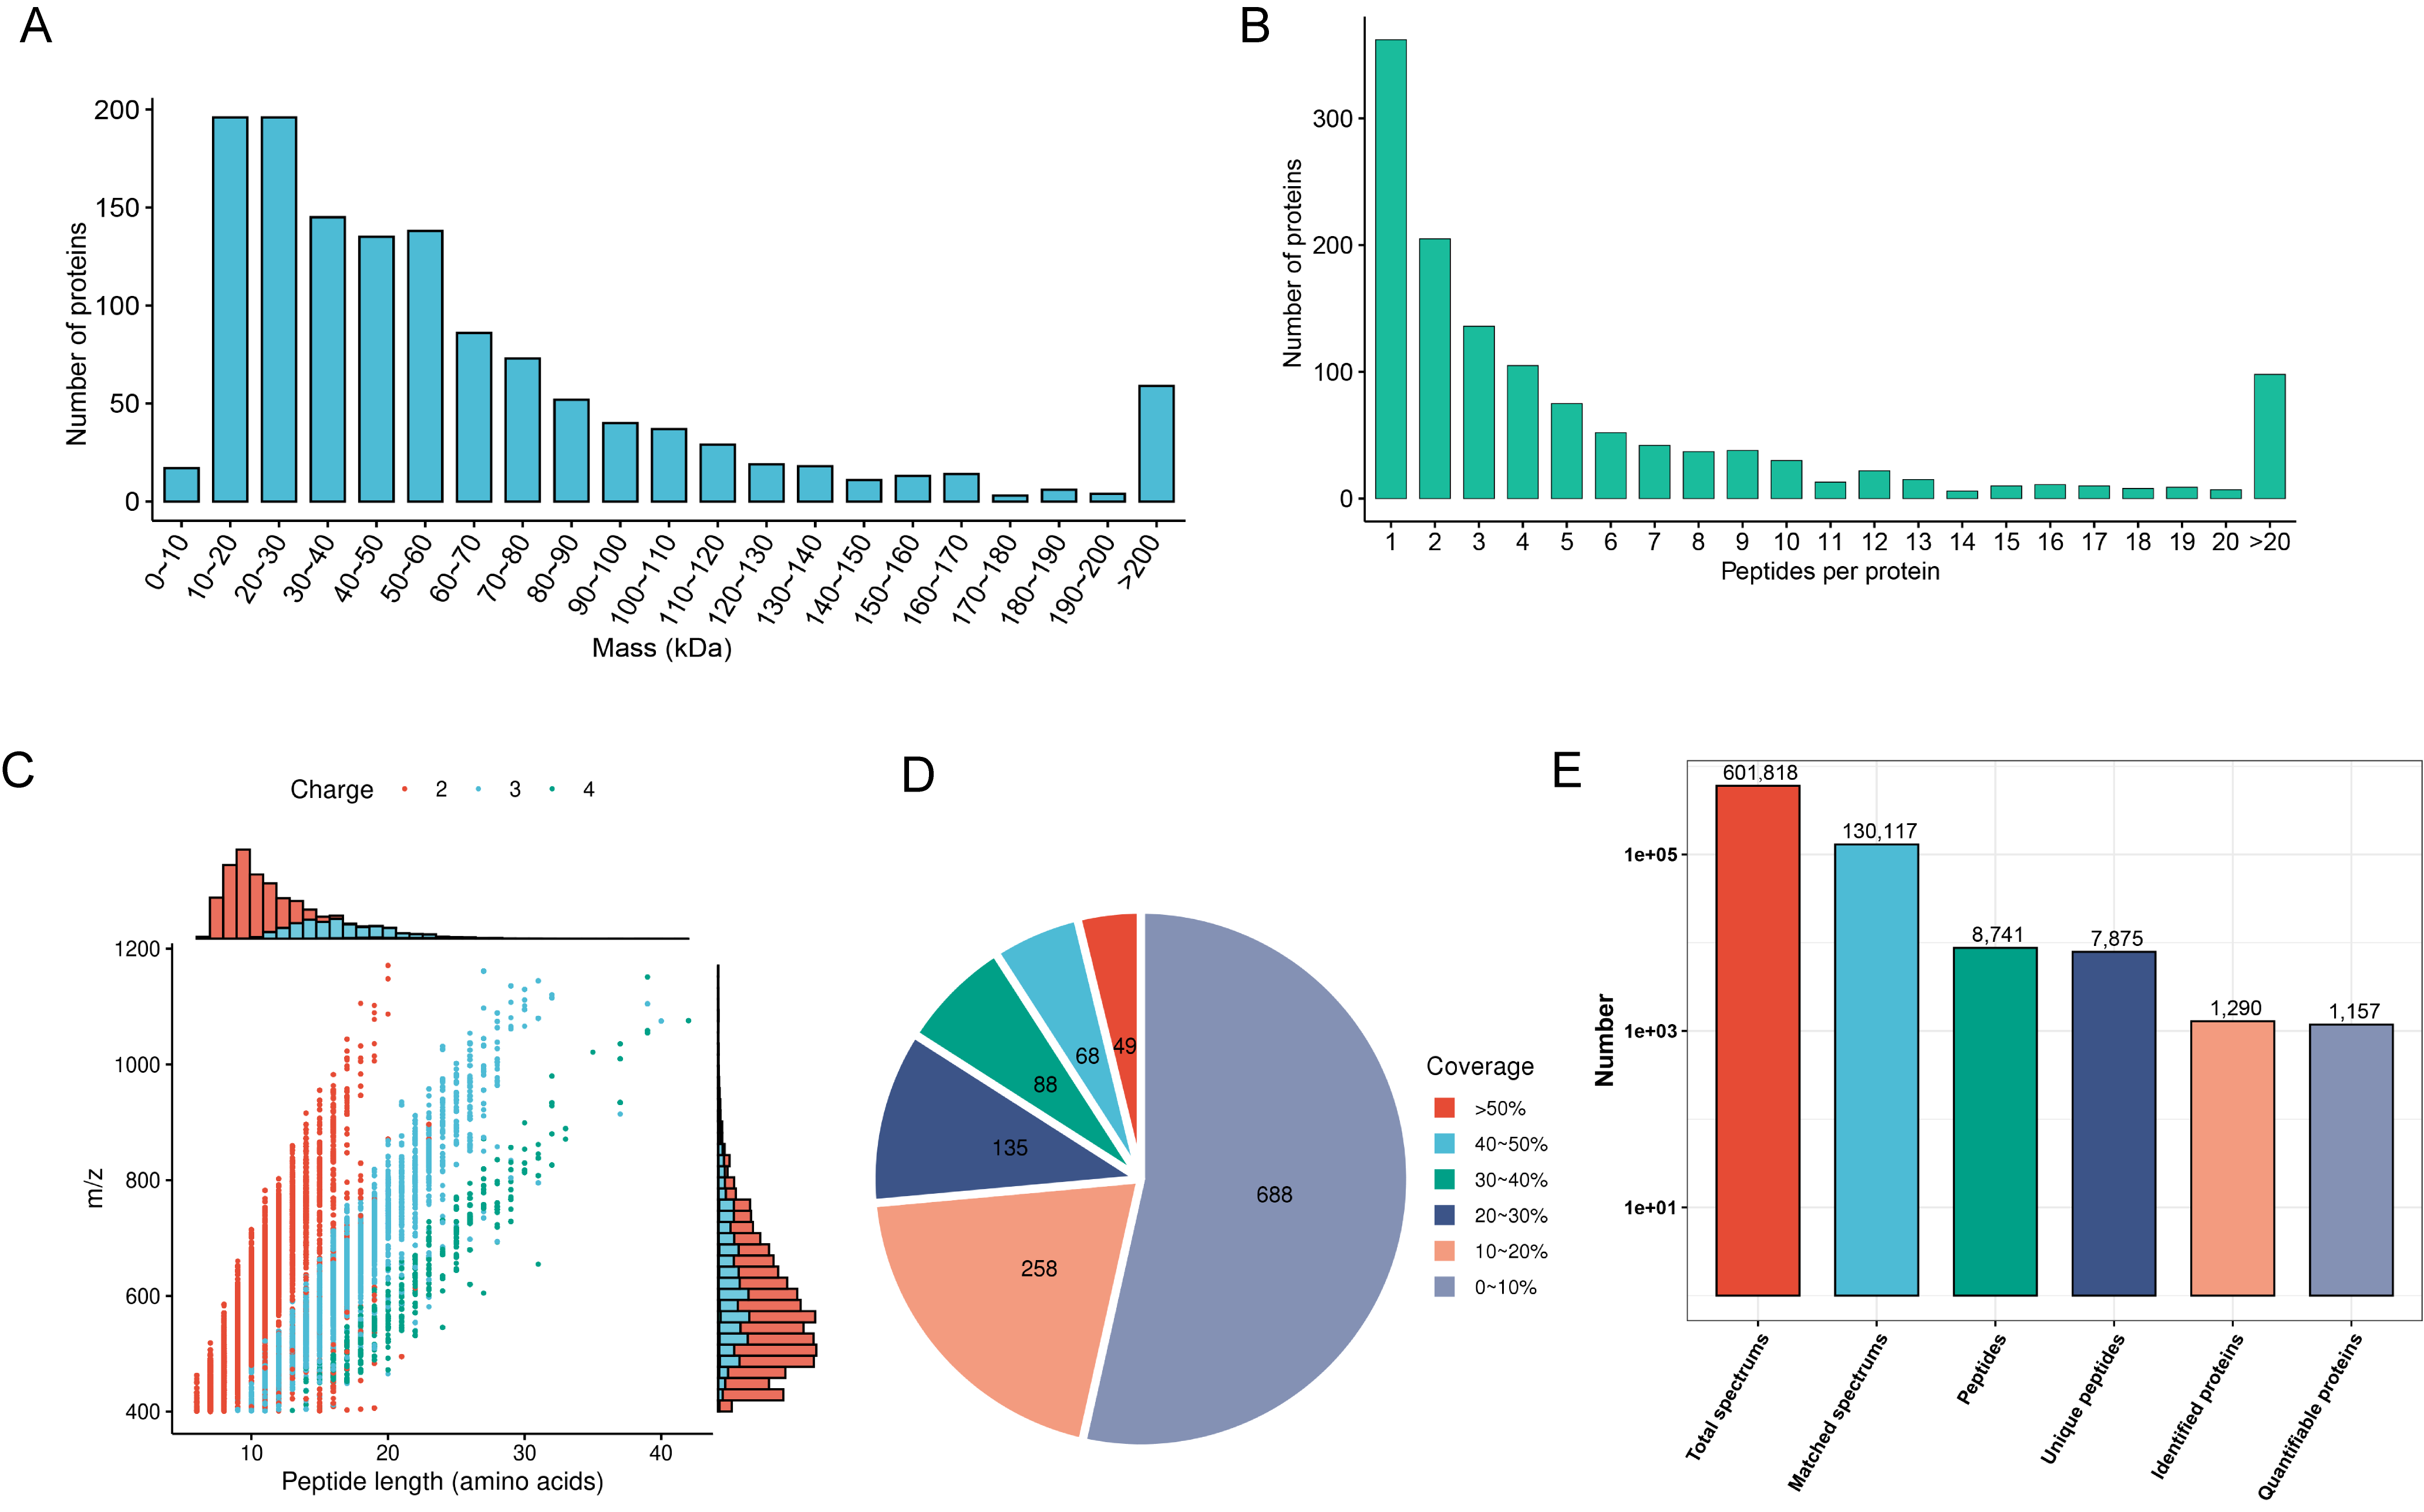 Fig. 2.
Mass spectrometry data for quality control and proteomic mapping of DEPs. (A) Identified protein mass distribution. (B) Number of peptides per protein distribution. (C) Distribution of identified peptide lengths. (D) Protein sequence coverage distribution. (E) Number of total spectrums, matched spectrums, identified peptides, unique peptides, identified proteins, and quantifiable proteins. DEPs, differentially expressed proteins.
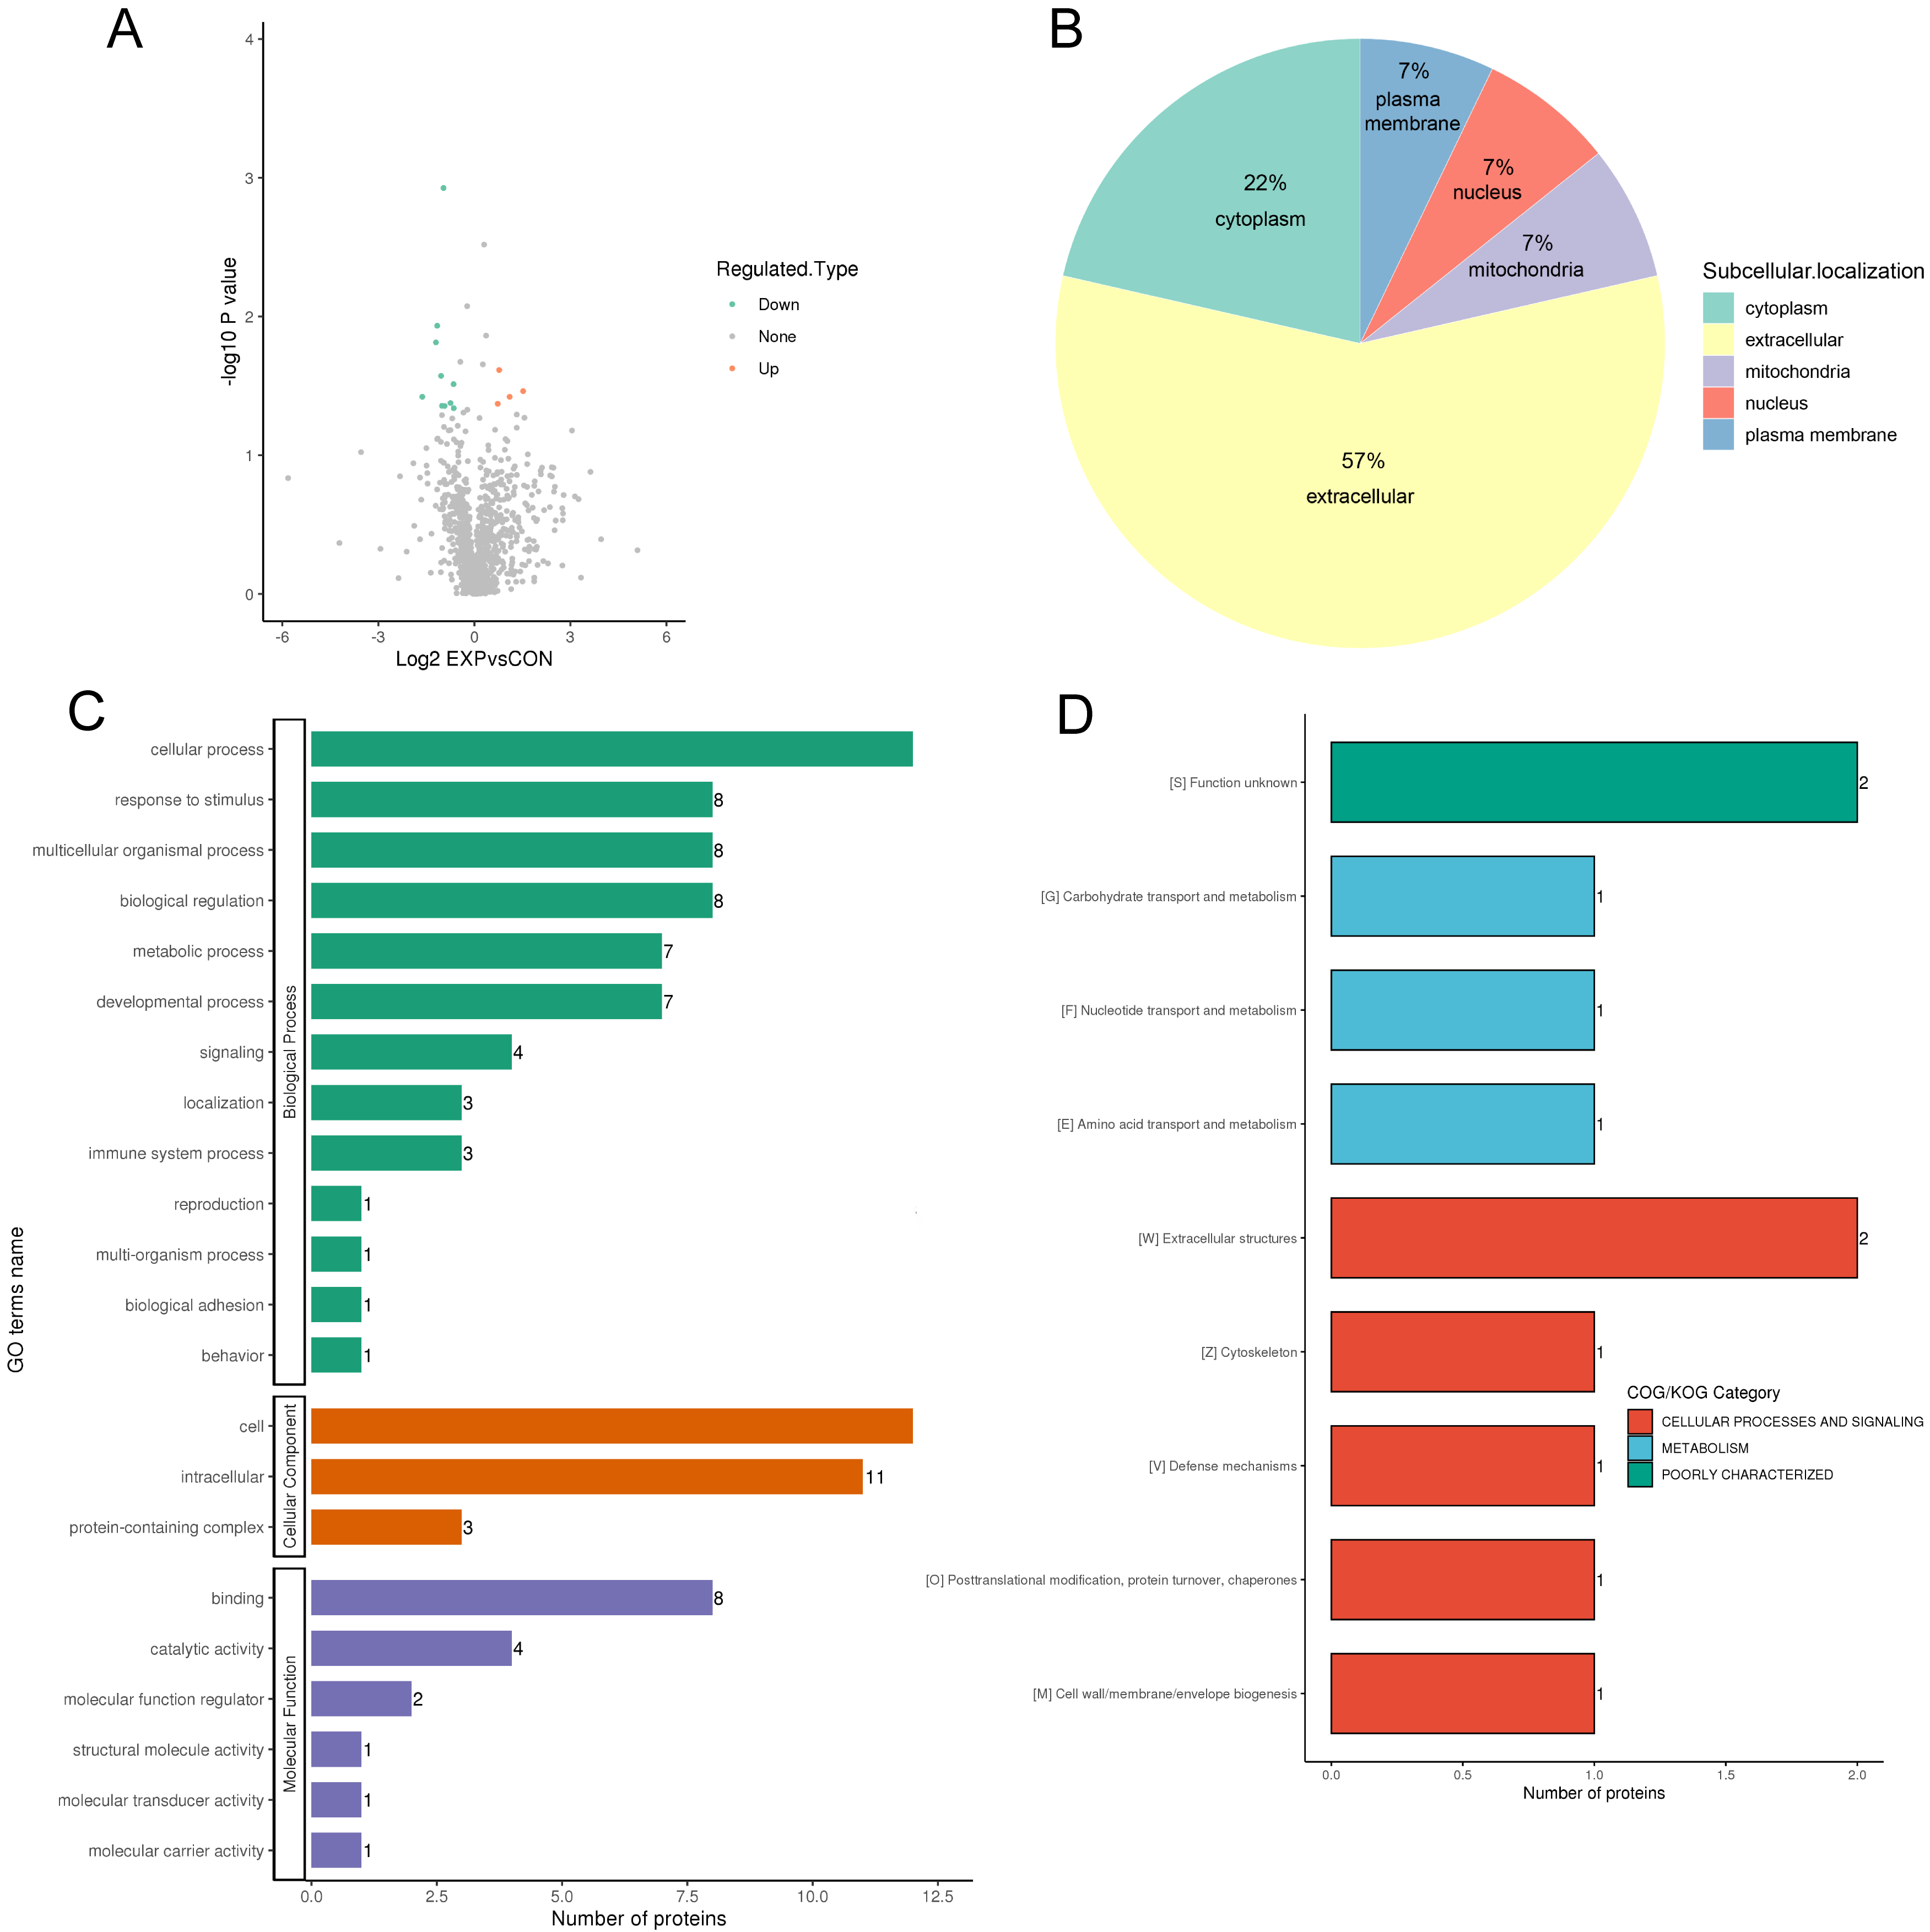
Fourteen DEPs between responders and non-responders are illustrated in the volcano map in Fig. 3A, and DEP information is shown in Table 2. The DEPs were mainly located in the extracellular space (57%), cytoplasm (22%), and plasma membrane (7%) (Fig. 3B). GO analyses of the DEPs revealed that the top five biological processes were response to stimulus process (eight DEPs), cellular process (12 DEPs), metabolic process (seven DEPs) multicellular organismal process (eight DEPs), and biological regulation (eight DEPs) (Fig. 3C green). The top three cellular components were cell (12 DEPs), intracellular (11 DEPs), and protein-containing region (three DEPs) (Fig. 3C orange). The top three molecular functions were catalytic activity (four DEPs), binding (eight DEPs) and molecular function regulator (two DEPs) (Fig. 3C purple). DEPs were also categorized according to functionality and homology (Fig. 3D). The top category was cellular processes and signaling, which included six DEPs (Fig. 3D). The second category was metabolism, which included three DEPs (Fig. 3D). Furthermore, the data revealed that cellular processes and metabolism of biological functions might be associated the response and clinical outcomes of DBS. Three DEPs (CKM, BLMH, and NID1) were closely associated with cellular processes and metabolism.
 Fig. 3.
Protein function annotation and category analysis of differentially expressed proteins. (A) The horizontal axis and vertical axis of the volcano plot shows the logarithmically converted value of the relative quantitative value of the protein and the logarithmically converted p-value after the log-log conversion, respectively. In the volcano plot, the red dot indicates significantly upregulated proteins and the blue dot indicates significantly downregulated proteins. (B) Sub cellular localization and classification of differentially expressed proteins. (C) The secondary classification of differentially expressed proteins under each Gene Ontology category. (D) Clusters of Orthologous Groups of protein/EuKaryotic Orthologous Groups (COG/KOG) category analysis of the up and downregulated differentially expressed proteins.
| UniProt accession number | Protein name | Gene name | Responders vs non-responders | p-value |
| K7ESE8 | Bleomycin hydrolase | BLMH | Down | 0.038* |
| P06732 | Creatine kinase M-type | CKM | Down | 0.011* |
| P14543 | Nidogen-1 | NID1 | Up | 0.034* |
| P02787 | Serotransferrin | TF | Down | 0.045* |
| P01718 | Immunoglobulin lambda variable 3-27 | IGLV3-27 | Down | 0.015* |
| Q86U17 | Serpin A11 | SERPINA11 | Up | 0.042* |
| P20930 | Filaggrin | FLG | Up | 0.038* |
| Q99972 | Myocilin | MYOC | Down | 0.044* |
| Q9UNW1 | Multiple inositol polyphosphate phosphatase 1 | MINPP1 | Down | 0.042* |
| P00995 | Serine protease inhibitor Kazal-type 1 | SPINK1 | Up | 0.024* |
| H0Y586 | Proteasome subunit alpha type-7 | PSMA7 | Down | 0.030* |
| P20036 | HLA class II histocompatibility antigen, DP alpha 1 | HLA-DPA1 | Down | 0.026* |
| O00754 | Lysosomal alpha-mannosidase | MAN2B1 | Down | 0.044* |
| Q9BXJ0 | Complement C1q tumor necrosis factor-related protein 5 | C1QTNF5 | Down | 0.001* |
*, p
The results of the enrichment analysis of protein GOs and hierarchical analysis of enrichment-based clustering of GOs are illustrated in Fig. 4A. Enriched DEPs were classified into four subgroups, labeled Q1–Q4. Next, the four subgroups were hierarchically clustered using a heatmap, as illustrated in Fig. 4B. Based on the 14 DEPs between the non-responder group and responder group, ontological functions were explored using UniProt-GOA, and were mainly clustered into 22 GO functional categories. The most significantly enriched biological processes of the DEPs were cellular amino acid metabolic process (CKM and BLMH), cellular protein modification process (BLMH, CKM, TF, MAN2B1, PSMA7, MINPP1, and FLG), protein modification process (BLMH, TF, MAN2B1, PSMA7, MINPP1, and FLG), and ion homeostasis (SPINK1, TF, and MYOC). For biological processes, the major functional categories of downregulated proteins were the carboxylic acid metabolic processes (CKM, BLMH), positive regulation of cell adhesion (MYOC and HLA-DPA1), alpha-amino acid metabolic process (CKM, BLMH), and cellular amino acid metabolic process (CKM, BLMH) in Q1 (Fig. 4B). Thus, the biological functions of the DEPs were related to metabolic and protein modification processes.
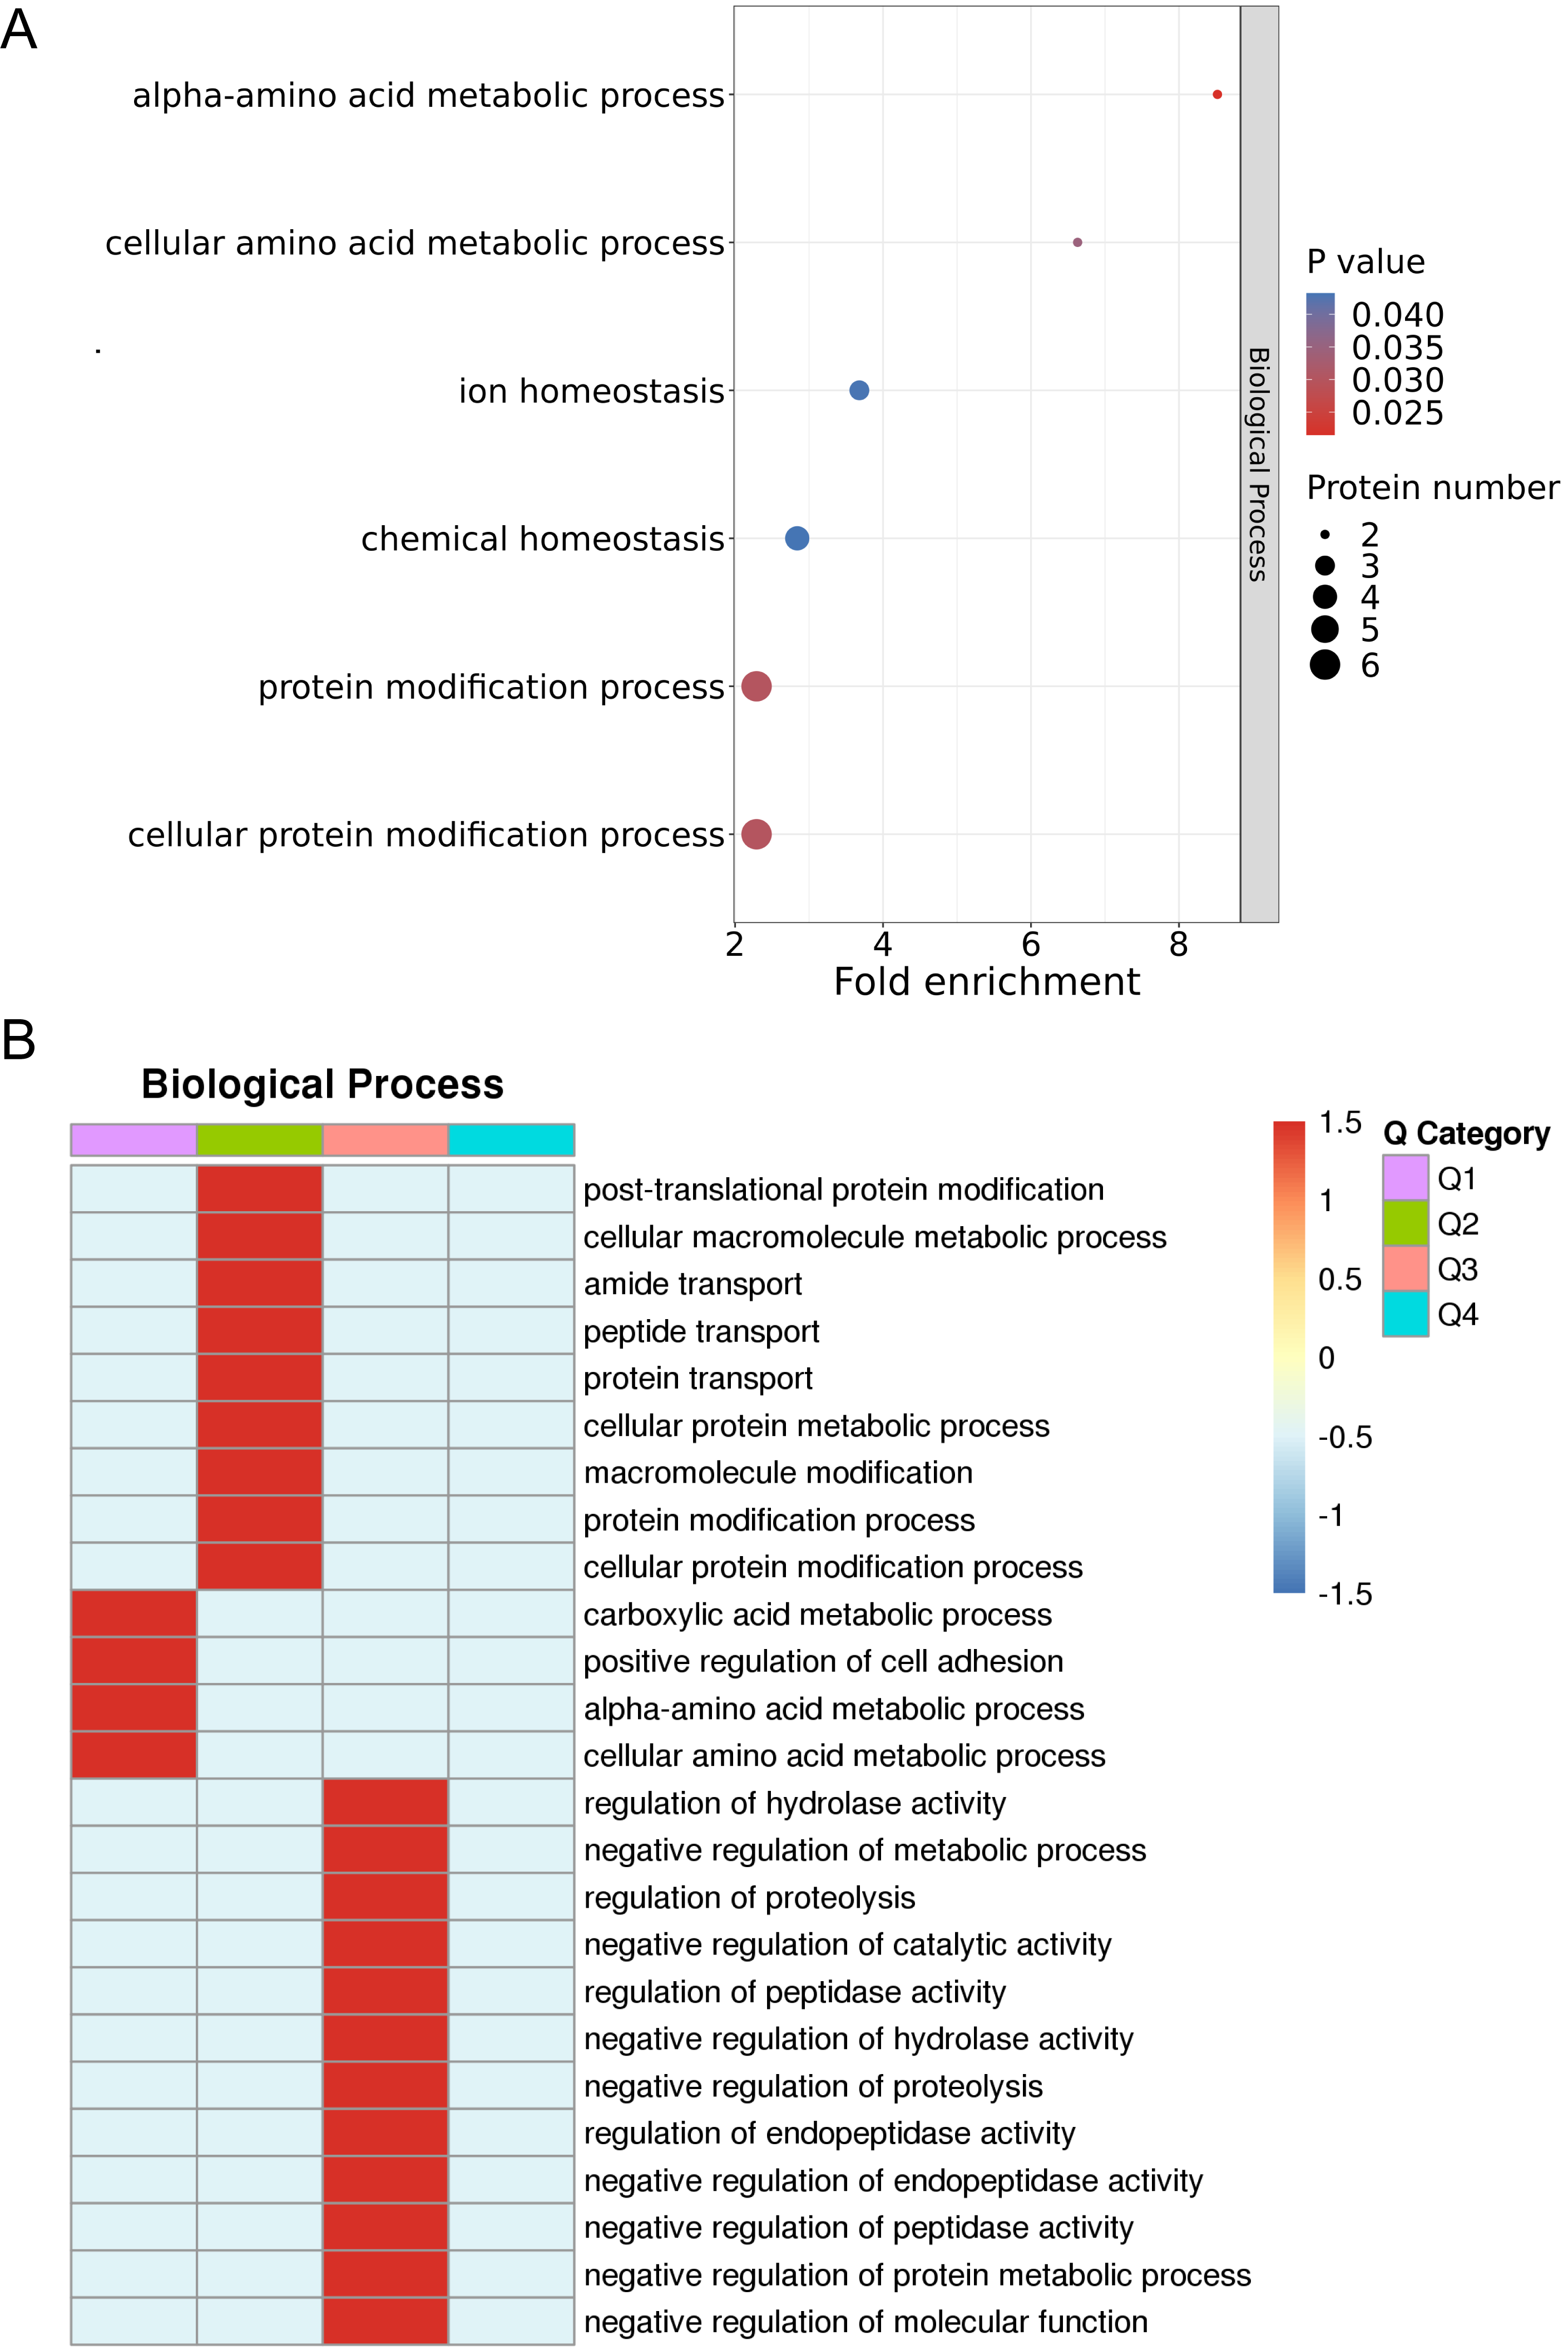 Fig. 4.
Enrichment analysis and enrichment-based clustering analysis of GO. (A) Enrichment analysis of protein GOs. (B) Hierarchical analysis of enrichment-based clustering of GOs. GO, gene ontology.
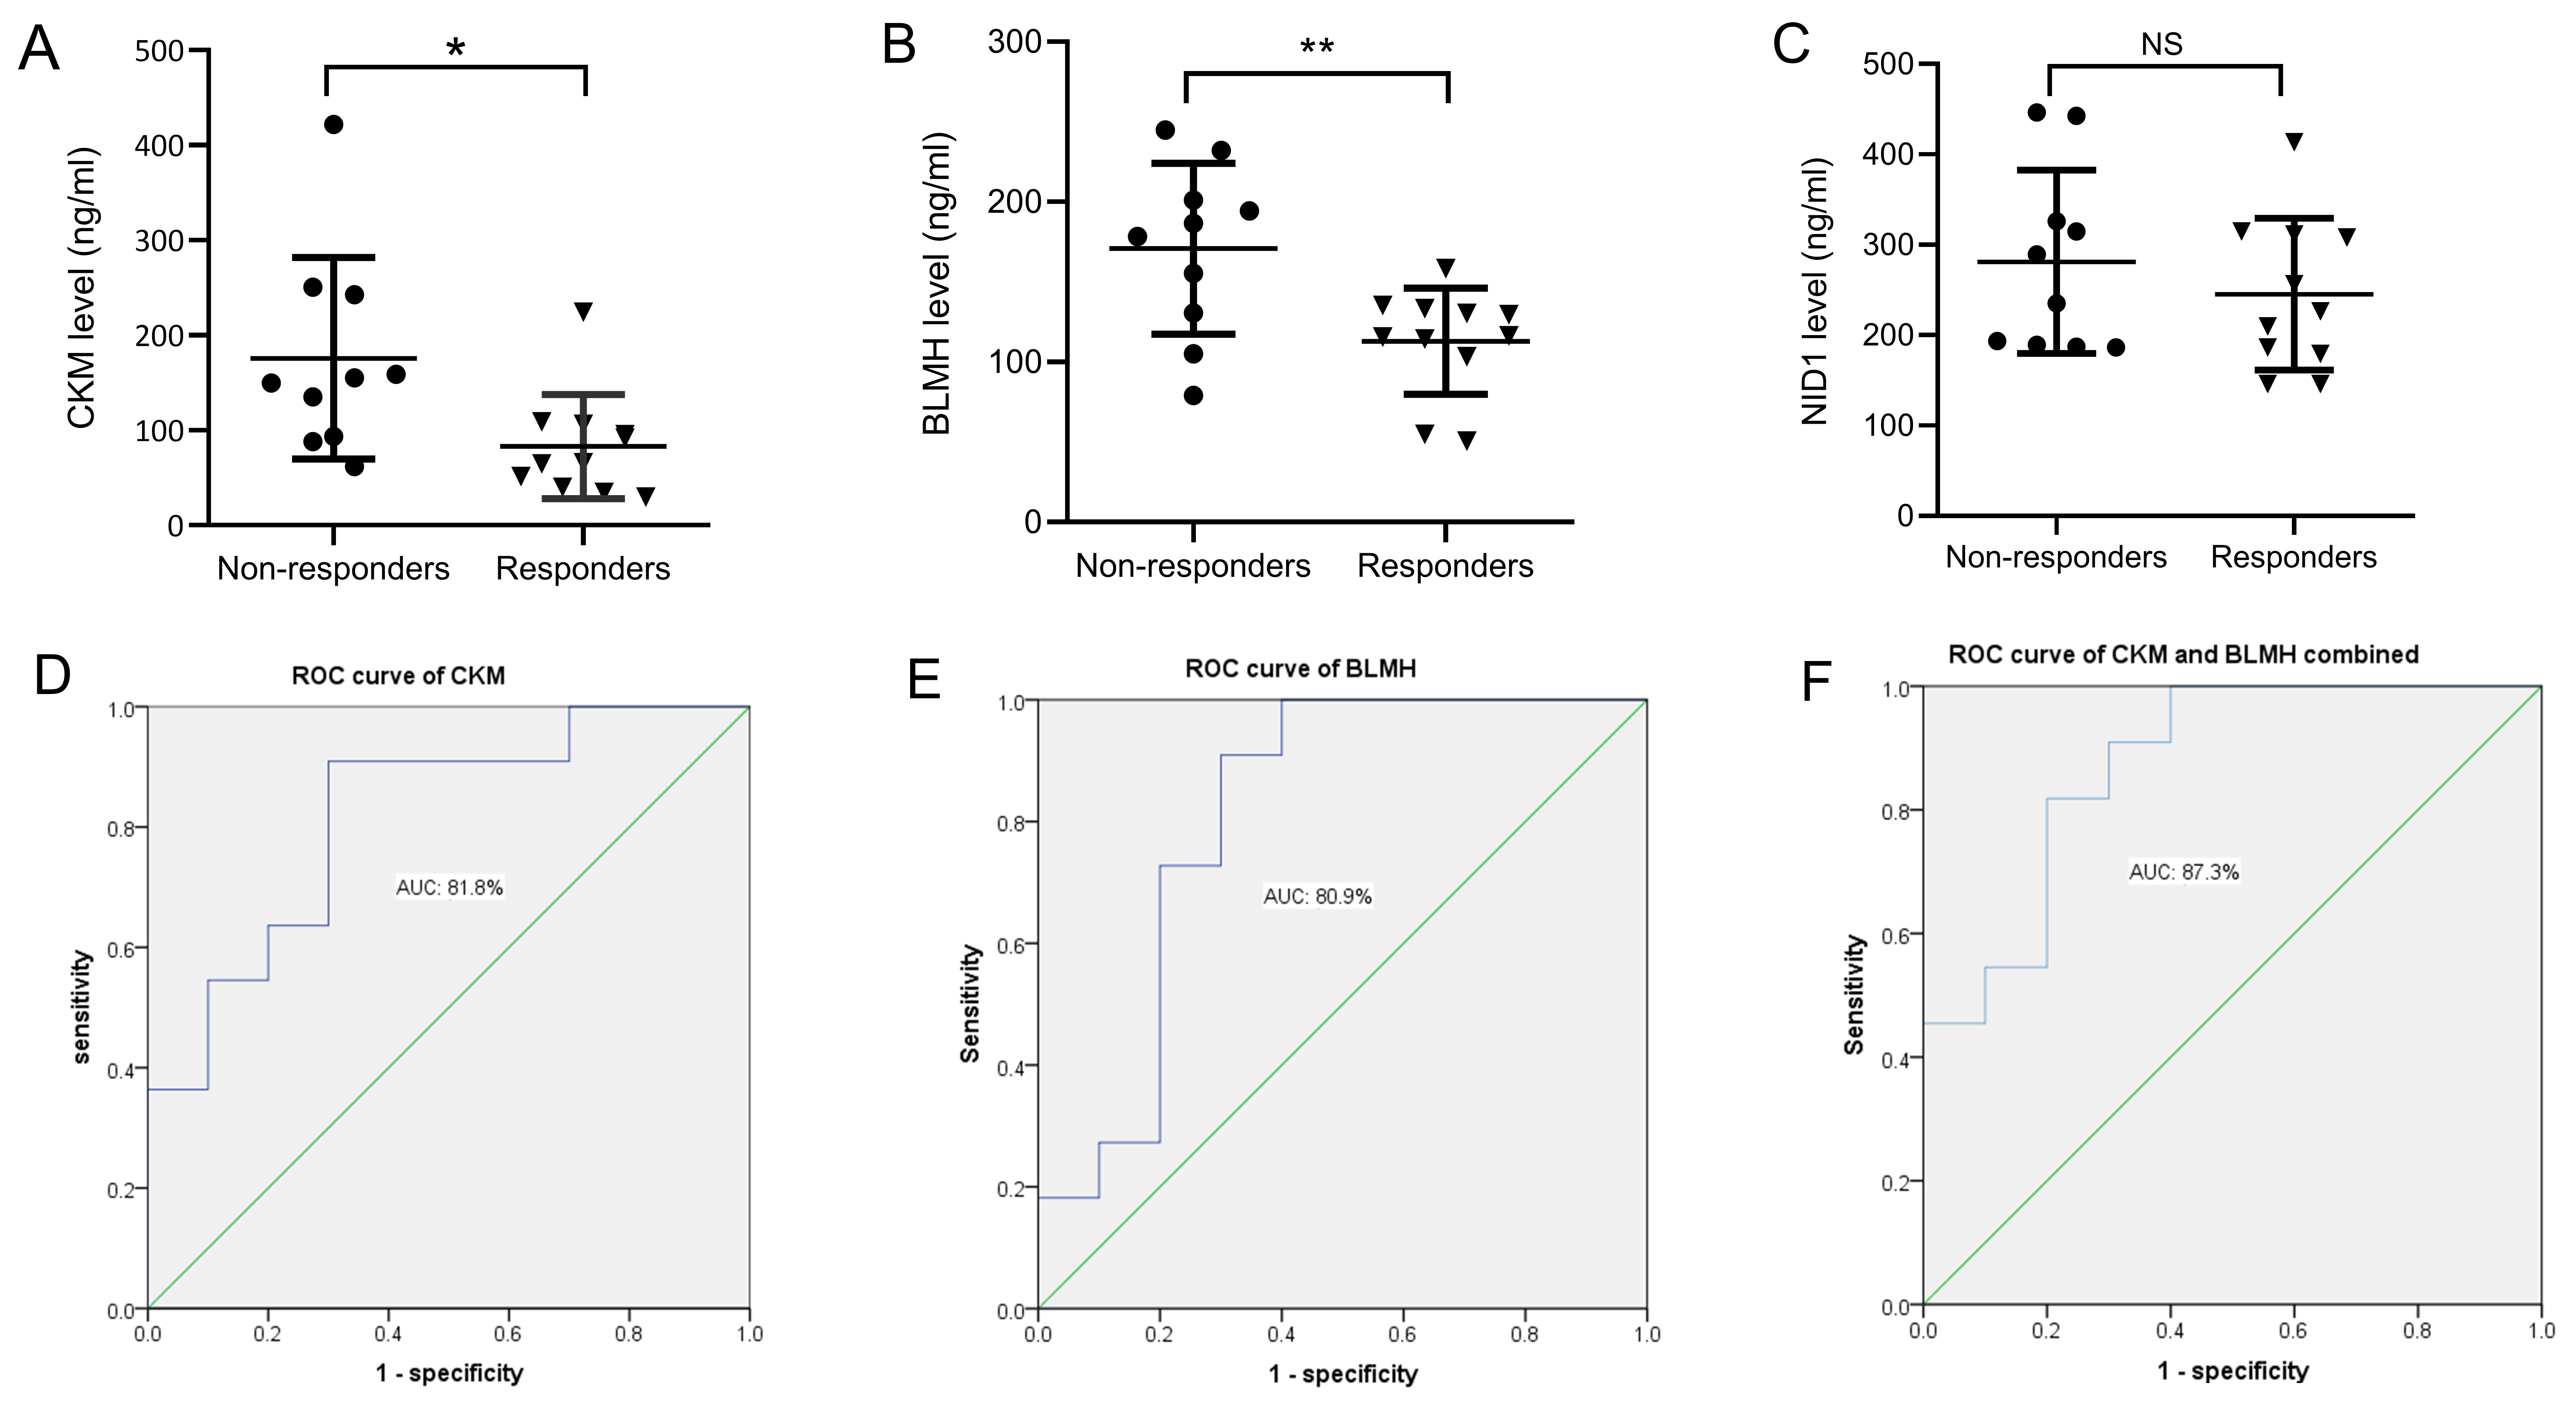
Based on the results of bioinformatics analysis, three DEPs were closely related to the therapeutic responses to DBS in PD patients, including CKM, BLMH, and NID1. In the validation study, ELISA was used to verify candidate DEPs in additional patient samples. The general characteristics of patients and serum levels of the candidate DEPs are shown in Table 3. As illustrated in Fig. 5, compared with the non-responders, CKM and BLMH levels were decreased in the responder group (Fig. 5A,B). However, no differences were found in the serum levels of NID1 (Fig. 5C). Additionally, binary logistic regression and ROC analyses indicated that CKM and BLMH could be predictive biomarkers for therapeutic responses to DBS, with p-values of 0.014 and 0.017 and areas under the curve of 0.818 (95% confidence interval (CI) 0.634–1.000) (Fig. 5D) and 0.809 (95% CI 0.605–1.000) (Fig. 5E). When CKM and BLMH were included in the modelling analysis, CKM and BLMH contributed prominently, with an area under the curve of 0.873 (95% CI 0.721–1.000) (Fig. 5F).
| Non-responders (n = 10) | Responders (n = 11) | p-value | |
| Age (y) | 59.70 |
63.54 |
0.259 |
| Female n (%) | 6 (60.0) | 6 (54.5) | 0.801 |
| Disease duration (y) | 8.50 |
7.54 |
0.448 |
| H&Y score | 3.10 |
2.95 |
0.382 |
| UPDRS score before DBS (off) | 49.60 |
48.72 |
0.656 |
| UPDRS score after DBS (off) | 31.40 |
18.63 |
|
| TD subtype n (%) | 5 (50.0) | 6 (54.5) | 0.835 |
| LDE before DBS (mg/d) | 787.5 (525–937.5) | 783.0 (675.0–800.0) | 0.750 |
| LDE after DBS (mg/d) | 787.5 (593.5–881.2) | 575.0 (487.5–725.0) | 0.011* |
| NID1 (ng/mL) | 262.20 (188.7–355.3) | 226.40 (179.5–311.4) | 0.275 |
| CKM (ng/mL) | 152.48 (92.3–244.6) | 65.95 (40.0–106.3) | 0.014* |
| BLMH (ng/mL) | 170.80 |
112.98 |
0.007* |
Values are presented as mean
 Fig. 5.
Changes in the serum levels of candidate DEPs in each group.
(A) Levels of CKM in non-responders and responders. (B) Levels of BLMH in
non-responders and responders. (C) Levels of NID1 in non-responders and
responders. The performance of baseline degree centrality of CKM (D), BLMH (E),
and the combined value of CKM and BLMH (F) in distinguishing responders from
non-responders, using receiver operating characteristic (ROC) curve analysis.
*p
DBS is an important treatment for patients with advanced PD, but not all patients have a good response to treatment. Therefore, it is important to determine which patients are suitable for DBS. This study identified 14 DEPs in the serum of PD patients before DBS surgery. GO analysis was performed to summarize the functionality of the DEPs and provide fundamental information for further bioinformatics research. These DEPs were found to be primarily enriched in the amino acid metabolic and protein modification processes. Furthermore, BLMH and CKM were involved in the regulation of these biological functions. ELISA validation and subsequent analysis confirmed significant downregulation of BLMH and CKM in PD patients with a good DBS response. These findings contribute to being able to predict the therapeutic responses to DBS before surgery in PD patients.
Previous studies have reported that modifications to proteins, such as
The CKM protein is the main subtype of CK in serum, which is primarily found in energy-intensive cells and is susceptible to muscle injury and activation [31]. It was reported that high CK levels are associated with severe levodopa-induced dyskinesia (LID) [32]. Furthermore, Delamarre et al. [33] also found that CK levels are correlated with LID severity. In our study, through proteomic analysis and ELISA validation, we also found that PD patients with significant improvement after DBS had lower serum CKM levels than PD patients without significant improvement after DBS. Additionally, CK plays an important role in normal energy homeostasis, including metabolic control [34]. At present, an increasing number of studies have indicated that metabolic changes may accelerate dopaminergic neurodegeneration [35, 36]. Increased serum levels of ornithine and proline have been reported in PD [37]. Therefore, systemic amino acid metabolism may be related to the pathological processes of PD. Serum CKM levels may be an objective biomarker for evaluating and predicting therapeutic responses to DBS in PD patients.
BLMH is another highly downregulated DEP found in this study. BLMH is a thiol-dependent cytoplasmic aminopeptidase that is widely expressed in mammals. Additionally, BLMH also plays an important role in the central nervous system [38]. Previous studies have found that BLMH is involved in the pathophysiology of Alzheimer’s disease and Huntington’s disease [39, 40]. However, data on the relationship between BLMH and PD are rare. Recently, increased homocysteine (Hcy) concentrations have also been observed in PD patients [41], especially in PD patients with postural instability and gait difficulty (PIGD) [42]. Several studies have suggested that levodopa treatment could lead to hyperhomocysteinaemia in PD and then further induce the development of dyskinesia [43, 44, 45]. It is widely accepted that BLMH has hydrolase activity towards an Hcy metabolite, and another role of BLMH is as a modulator of the brain proteome [38]. In our study, proteomic analysis and subsequent validation revealed that BLMH was downregulated in PD patients with significant improvement after DBS, and we also found that BLMH was closely related to the acid metabolic process and protein modification process. The results show that PD patients with low BLMH may have severe dopamine neuron and motor complications. According to the mechanism of DBS action, PD patients with downregulated BLMH may have a good response after DBS surgery. Thus, BLMH may be another useful biomarker for predicting therapeutic responses to DBS in PD patients.
Our study revealed that DEPs between PD patients with significant improvement and those patients with no significant improvement after DBS may contribute to predicting therapeutic responses to DBS. Furthermore, ELISA validation confirmed that serum CKM and BLMH levels in PD patients could be useful biomarkers for predicting therapeutic responses to DBS. To obtain the maximum benefits of DBS, it is necessary to explore potential biomarkers for accurate screening and selection of potential DBS candidates before surgery. The addition of predictive biomarkers of the therapeutic responses to DBS in PD patients will be beneficial to clinical applications and future studies.
The study had some strengths. First, we used the high-performance liquid chromatography-tandem mass spectrometry (HPLC-MS/MS) proteomic technique to explore serum biomarkers for predicting therapeutic responses to DBS in PD before surgery. Second, serum samples from PD patients were selected and matched based on age, disease severity, and equivalent levodopa dosage. Additionally, ELISA experiments further confirmed the potential of CKM and BLMH in predicting therapeutic responses to DBS in PD patients. The limitations were that the study was of a preliminary and exploratory nature, with a small sample size. In the future, we will expand the sample size to further explore potential biomarkers that are useful in PD patients before DBS surgery.
In summary, this study revealed that therapeutic responses to DBS are associated with pathways of amino acid metabolism and protein modification in PD. The identified DEPs in PD patients have the potential for use as biomarkers for the accurate prediction of DBS therapeutic responses before surgery. Additionally, serum BLMH and CKM levels may be potential biomarkers for predicting therapeutic responses to DBS in PD patients before surgery. We will conduct further studies to confirm these findings.
All data can be acquired through reasonable inquiry, and the raw files of proteome datasets are available from PRIDE database (accession number: PXD042534).
YG, SQ, MY, JW, and YLW designed the research study. YG and SQ performed the research. YG, SQ, and DC conducted experiments. YG, SQ, and DC analyzed the data. All authors contributed to editorial changes in the manuscript. All authors read and approved the final manuscript. All authors have participated sufficiently in the work and agreed to be accountable for all aspects of the work.
This study was authorized by the Ethics Committee of the First Affiliated Hospital of Soochow University (Ethics Committee Approval code: 2022-422). Informed consent was available from all patients.
We gratefully thank Jingjie PTM BioLab (Hangzhou) Co. Inc for its technical support in proteomic.
This study was supported by the National Natural Science Foundation of China (82102664), the Gusu District Health Talent Training Project (GSWS2022073 and GSWS2020076), the Suzhou “Kejiaoxingwei” Youth Science and Technology project (KJXW2020004), and Gusu school clinical new technology guidance project (GSKY20220610).
The authors declare no conflict of interest.
References
Publisher’s Note: IMR Press stays neutral with regard to jurisdictional claims in published maps and institutional affiliations.