


 , Waldemar Karwowski 2,*
1 Department of Industrial Engineering and Management Systems, Arab Academy for Science, Technology, and Maritime Transport, 1029 Alexandria, Egypt
2 Computational Neuroergonomics Laboratory, Department of Industrial Engineering and Management Systems, University of Central Florida, Orlando, FL 32826, USA
Abstract
Background: Neuroergonomics is an emerging science that focuses on the human brain’s performance during physical work. The advent of portable neurophysiological methods, including electroencephalography (EEG), has enabled measurements of real-time brain activity during physical tasks without restricting body movements. However, the EEG signatures of different levels of physical exertion activity involving the musculoskeletal system remain poorly understood. Objective: This study investigated the EEG source localization activity induced by predefined force exertion levels during an isometric arm force exertion task in healthy female participants for the alpha and beta frequency bands. Methods: Exact low-resolution electromagnetic tomography (eLORETA) was used to localize the current source densities (CSDs) in 84 anatomical brain regions of interest. Results: The maximum CSDs for extremely hard force exertion levels for the alpha frequency were localized in Brodmann area (BA) 6, whereas CSDs associated with other exertion levels were localized in BA 8. The maximum CSDs for extremely hard force exertion levels for beta were localized in BA 5, whereas CSDs associated with other exertion levels were localized in BA 7. Conclusions: These findings extend the current understanding of the neurophysiological basis of physical exertion with various force levels and suggest that specific brain regions are involved in generating the sensation of force exertion. To our knowledge, this is the first study localizing EEG activity among various predefined force exertion levels during an isometric arm exertion task in healthy female participants.
Keywords
- Brodmann areas
- EEG
- eLORETA
- force exertion
- perceived exertion
Numerous occupations require the application of muscular strength in the workplace for lifting, carrying, pulling, pushing, holding, moving, or restraining objects. Forceful exertion, high task repetition, and sustained awkward postures occurring in the workplace are ergonomic risk factors that significantly increase the likelihood of work-related musculoskeletal disorders [1] in addition to individual-related risk factors [2, 3].
Human muscular strength is defined as the maximum force that a muscle can generate under prescribed conditions, varying according to gender, sex, weight, and stature [4, 5]. Perceived muscular exertion, also known as perception of effort or the sense of effort, is the conscious sensation of physical activity [6, 7] that provides information regarding the difficulty of a physical task or exercise intensity. The perception of physical exertion is subject to the psychophysical power law [8], which defines the nonlinear relationship between the perceived intensity and the strength of a physical stimulus. Improving understanding of the mechanisms underlying the generation of the perception of effort [9], endurance in physical performance [10, 11], and the relationship between workload and physical fatigue [12, 13] are important to prevent work-related musculoskeletal injuries.
Various subjective and physiological measures have been used to quantify perceived exertion during physical activity. Specifically, the rate of perceived exertion, introduced by Borg [14, 15, 16], has been found to be a useful tool for assessing perceived exertion through subjective rating of a physical activity’s strenuousness or difficulty. Although subjective scaling methods have greatly contributed to the assessment of perceived exertion [17, 18], they are insufficient for decoding complete perception [19, 20, 21]. Karwowski et al. [22] have highlighted the importance of studying human brain function during physical activities combined with perceptual, cognitive, and affective processes, under the umbrella of “physical neuroergonomics”.
Studying the neural signatures of physical exertion might provide useful information to aid in explaining the integration of physiological and psychological processes involved in physical activities [23]. In this regard, identifying the brain regions associated with force exertion with various levels of perceived rates of physical exertion is important.
Recently, a combination of techniques and methods have been used to measure and evaluate neural signatures associated with human activities observed in everyday settings [24, 25, 26]. Neurophysiological measures provide reliable assessments of the brain’s functional states that can be acquired through various techniques [27]. Electroencephalography (EEG), a powerful noninvasive technique, is one of the most commonly used neurophysiological techniques to study the high-temporal dynamics of functional brain networks on the order of milliseconds [28, 29, 30]. Despite the low spatial resolution of the EEG, it is possible to make spatial measurements [31]. The mobility and portability of contemporary EEG systems enables recording of brain data during physical movements without any restrictions, thus offering new opportunities for sports neuroscience, neuromarketing, brain-computer interfaces, and human factor studies [32, 33, 34]. Despite these benefits, little is known regarding the neural processes underlying the perception of physical exertion according to EEG neurophysiological data, particularly in work-related settings.
EEG signals are composed of different frequency components divided into frequency bands and rhythms including delta (0.5–3.5 Hz), theta (4–8 Hz), alpha (8–13 Hz), beta (13–30 Hz), and gamma (30–100 Hz) bands. The most commonly analyzed EEG bands to assess human physical activities are the alpha and beta bands [35, 36]. In general, temporary changes in the power spectrum density of alpha and beta bands are associated with various levels of physical activity [37, 38, 39, 40, 41]. Frontal alpha activity is crucial for evaluating human performance during physical task performance [41, 42]. For instance, the absolute power of alpha activity is greater immediately after and during physical activity [43]. The power of the alpha band in the central brain region increases under conditions of muscle fatigue [44] and in frontal brain regions after exercise [45]. Moraes et al. [46] have reported an increase in the power of the beta band in frontal and central brain areas associated with increased cortical activation. Similarly, Bailey et al. [47] have reported an increase in theta, alpha, and beta power in frontal, central, and parietal brain regions with higher levels of physical workload. An increase in cortical activation after a maximal effort exercise has been demonstrated through an increase in the absolute value of beta power in frontal and central brain areas [46]. An increase in the power spectrum density of the prefrontal and central beta bands is also associated with greater muscle fiber recruitment [35]. Of note, an earlier study by Kubitz and Mott [48] has reported that an increase in the level of the cortical activation during physical activity is associated with decreased alpha power and increased beta power. Recent studies have combined energy parameters for alpha and beta with connectivity and complexity parameters to detect mental fatigue during physical-mental tasks [49].
The evaluation of changes in the brain activity after localization of the EEG source through brain mapping and by solving the inverse solution problem has been the focus of many neuroscience studies [50]. These studies have discussed and assessed changes in brain function corresponding to specific brain regions commonly known as Brodmann areas (BA). For example, Schneider et al. [51] have reported an increase in alpha activity in the left frontal gyrus region corresponding to BA 8 immediately after physical exercise, with respect to the pre-exercise state, as well as significant changes in beta and gamma activity in BA18 after 15 minutes of exercise. Enders et al. [52] have shown that high-intensity exercise induces greater brain activity in BA 8, followed by BA 6 and BA 7, for the alpha and beta bands.
In general, exercise preferences affect brain activation patterns differently. For example, Schneider et al. [53] found an increase in the alpha activity in both parietal brain regions after biking exercise, whereas other treadmill, biking, and arm-crank exercise showed increases in the beta band corresponding to BA 7. In another study, an increase in the left frontal gyrus, corresponding to BA 8, was found immediately after exercise [51], whereas decreases were observed in alpha 2 (9.9–12.9) Hz, beta 1 (12.9–19.2) Hz, and gamma activity in the left inferior, middle, and superior temporal gyri, corresponding to BA 18, 20, 21, and 22, respectively. A comparison of younger and older participants in a pre- and post-exercise study has indicated significant increases in alpha and beta 2 (18–30) Hz activity in BA 24, 33, and 23 in the younger group only [40]. A frontal alpha increase has been shown to be associated with affective responses [42], emotional processing [54], motor coordination [51], mood improvement, diminished anxiety, and calmness [40].
Nybo and Nielsen [55, 56] have hypothesized that perceived exertion is associated with altered EEG brain activity, mainly in the frontal region, during physical exercise. Specifically, the prefrontal cortex plays an important role in the initiation of volitional movement [57, 58, 59]. Guoa et al. [60] have reported an association between perceived exertion and cortical activity during movement execution, including the prefrontal cortex, supplementary motor area, and primary motor cortex. The power spectrum of alpha and beta for the F3 electrode in the prefrontal cortex enables prediction of the rate of perceived exertion.
The premotor cortex, supplementary motor area, and primary motor cortex are associated with the planning and execution of movement and voluntary actions [61, 62, 63]. The EEG amplitude of motor-related cortical potentials at frontal–central brain electrode sites has been shown to be a useful measure for assessing the intensity of perceived exertion associated with increasing force production rates [64] and different weight levels [65]. Desmurget et al. [66] have suggested that the frontal cortex and the parietal cortex, primarily the posterior parietal cortex, are involved in the experience of conscious intention. Theoretically, the prefrontal cortex, the presupplementary and supplementary motor areas, the premotor cortex, the primary motor cortex, and the posterior parietal cortex can be considered crucial brain regions, along with sensory brain areas [67], for investigating the perception of physical effort [65]. Although the neural mechanisms regarding the perception of physical efforts have been studied to some extent, more neurophysiological studies are needed to better understand brain function and dysfunction among brain regions that form large-scale networks.
The main objective of this study was to investigate EEG source localization activity induced by different force exertion levels in a group of healthy female participants for two frequency bands.
To our knowledge, this is the first study localizing the EEG activity among various predefined force exertion levels during an isometric arm exertion task in healthy female participants. This article is organized as follows: section 2 outlines the methods; section 3 describes the statistical analysis; section 4 describes the results; and section 5 provides a discussion. In the final section, we present our conclusions.
The study included 12 healthy female participants who met the experimental requirements, including an absence of history of cardiovascular problems, neurological disorders, fatigue-related disorders, chronic physical, and musculoskeletal disease. Pregnant female participants were not allowed to participate. Participants were instructed not to consume any medication, coffee, or alcohol for a minimum of 24 hours before the experiment, and not to exercise for 48 hours before the study. To minimize the risk of selection bias, all participants were randomly selected. The participants had no previous knowledge regarding the study purpose (to decrease performance bias) and hypothesized outcomes (to decrease detection bias). All incomplete data outcomes (i.e., reporting bias) and excluded data (i.e., attention bias) were recorded [68].
The laboratory experiment was designed to record EEG signals during an isometric arm exertion at predefined levels of exertion. The isometric arm exertion task was performed with the Jackson Strength Evaluation System [69]. The participants were asked to exert a force by pulling the chain upward by using their flexed arms without any body movement or jerking [3, 70]. Participants were instructed to avoid any unnecessary movement during the experiment. Participants were asked to apply the maximum force for 3 seconds for each of three trials separated by 30-second rest periods between each trial. Then a 5-minute rest was provided to avoid muscle fatigue. In the isometric arm exertion task, each participant was asked to exert a force that matched one of five predefined exertion levels: (1) extremely light, (2) light, (3) somewhat hard, (4) hard, and (5) extremely hard. The force levels were selected from a 6–20 scale of perceived exertion proposed by Borg [15]. The participants were asked to maintain steady-state exertion for 3 seconds for three trials separated by 120-second rest periods between trials. The order of force exertion levels was determined randomly to prevent potential learning effects. The total time for arm experiment for each participant with EEG preparation time lasts for approximately 62 minutes, unless participants asked for more rest. The laboratory study was conducted in a temperature-controlled and sound-attenuated laboratory in the computational neuroergonomics laboratory at the University of Central Florida. This environment helped participants concentrate on task performance and minimized non-physiological artifacts [71, 72].
EEG signals were recorded with a CGX-64 Mobile gel-based system electrode cap
with Ag/AgCl active electrodes positioned according to the 10–10 international
montage system (CGX system, San Diego, CA, USA, available in
https://www.cgxsystems.com/). The EEG signals
were acquired in Cognionics acquisition software 6.6 [73]. A super Visc (Brain
vision solutions, Morrisville, NC, USA) electrolyte gel was used for active
electrodes, and the connecting impedance was kept below 10 k
The Fast Fourier Transform was used to extract EEG cross spectra for two
frequency bands (alpha = 8–13 Hz and beta = 13–30 Hz) for each participant,
using eLORETA software [77]. The exact low-resolution
electromagnetic tomography (eLORETA) is a genuine inverse solution with exact
zero error localization [78]. The software parcellates the EEG spectral current
density into 6239 voxels with a spatial resolution of 5 mm
For statistical analysis of CSD, the software package of the eLORETA applies a statistical nonparametric mapping method (SnPM) [94]. We analyzed the differences in CSD between different exertion levels for each frequency band with voxel-by-voxel independent F-ratio-tests, based upon eLORETA log-transformed current source density power. This results in three-dimensional statistical mapping, cortical voxels with significant differences were identified by means of a nonparametric permutation/randomization procedure (i.e., based on the Fisher’s permutation method, with the critical probability threshold set at the 5% probability level), comparing the mean source power in each voxel and the distribution in the permutated values. By evaluating the empirical probability distribution of the “maximal-statistics” in the null hypothesis, permutation and randomization tests have demonstrated to be effective in controlling the Type I error [86, 94, 95]. We used 5000 data randomizations to determine the critical probability threshold values for the actually observed log F-ratio values with correction for multiple comparisons across all voxels and all frequencies, without the need to rely on Gaussianity.
eLORETA resulted in three-dimensional intracerebral CSDs of the electrical neuronal generators for alpha and beta waves in each participant. The average CSD for each exertion level for each frequency band for female participants was computed. Detailed information regarding the brain structure, the maximum activated BA with MNI coordinates, and voxel threshold (Th-values) for each exertion level for alpha frequency bands is shown (Appendix Table 5).
For the alpha band, the highest CSD was found in the middle frontal gyrus of the frontal lobe, corresponding to BA 6, for the extremely hard exertion level only. However, for all other exertion levels, the highest CSD was found in the superior frontal gyrus of the frontal lobe, corresponding to BA 8 (Fig. 1). Detailed information regarding the brain structure, the maximum activated BA with MNI coordinates, and voxel threshold (Th-values) for each exertion level for alpha frequency bands is provided in Table 1.
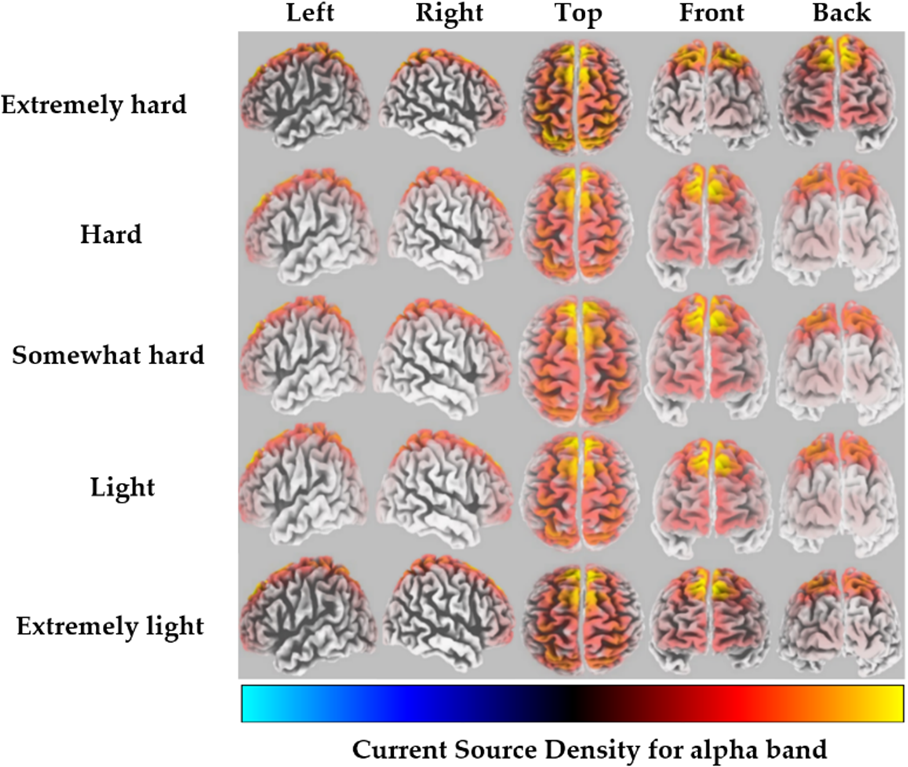 Fig. 1.
Average CSD for each exertion level for the alpha frequency band (red to yellow indicates source-localization strengthening).
| Exertion level | Alpha frequency band | ||
|---|---|---|---|
| Brain structure | Maximum activated BA with MNI coordinates | Voxel threshold (Th-value) | |
| Extremely hard | MFG | BA 6, MNI (X = 5, Y = 20, Z = 65) | 9.49 × 10 |
| Hard | SFG | BA 8, MNI (X = 10, Y = 50, Z = 45) | 4.78 × 10 |
| Somewhat hard | SFG | BA 8, MNI (X = 10, Y = 50, Z = 45) | 4.77 × 10 |
| Light | SFG | BA 8, MNI (X = 10, Y = 50, Z = 45) | 4.79 × 10 |
| Extremely light | SFG | BA 8, MNI (X = 10, Y = 50, Z = 45) | 4.79 × 10 |
| BA, Brodmann area; MNI, Montreal Neurological Institute; Th-value, threshold; MFG, middle frontal gyrus; SFG, superior frontal gyrus. | |||
For the beta band, the highest CSD was localized in the postcentral gyrus of the parietal lobe, corresponding to BA 5, for the extremely hard exertion level (Fig. 2). For all other exertion levels, the highest CSD was highly localized in the precuneus of the parietal lobe, corresponding to BA 7. Detailed information regarding the brain structure, the maximum activated BA with MNI coordinates, and voxel threshold (Th-values) for each exertion level for beta frequency bands is shown in Table 2.
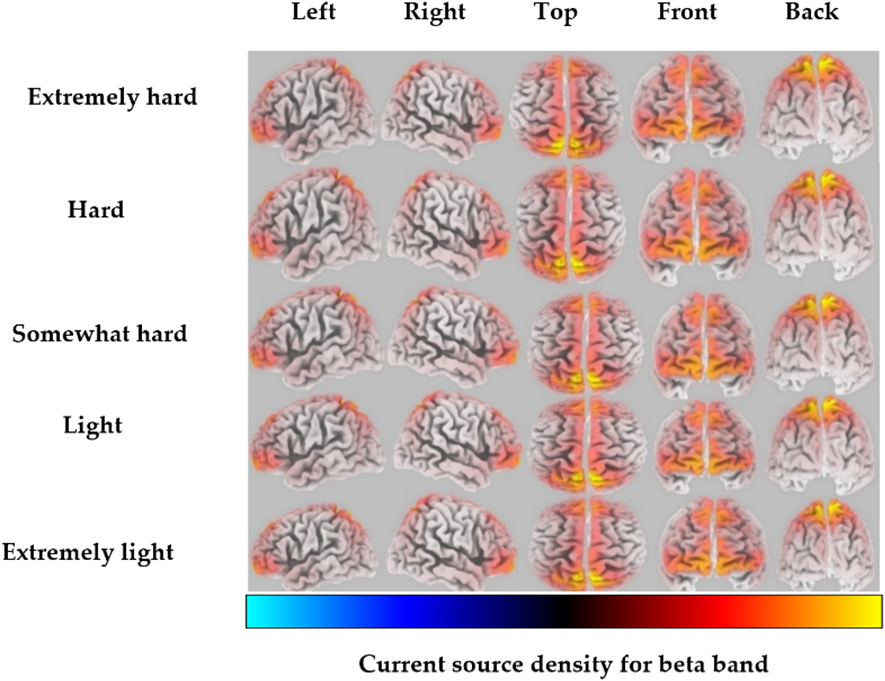 Fig. 2.
Average eLORETA source current density for each exertion level for the beta frequency band (red to yellow indicates source-localization strengthening).
| Exertion level | Beta frequency band | ||
|---|---|---|---|
| Brain structure | Maximum activated BA with MNI coordinates | Voxel threshold (Th-value) | |
| Extremely hard | Postcentral gyrus | BA 5, MNI (X = 5, Y = –50, Z = 70) | 1.75 × 10 |
| Hard | Precuneus gyrus | BA 7, MNI (X = 10, Y = –60, Z = 70) | 1.31 × 10 |
| Somewhat hard | Precuneus gyrus | BA 7, MNI (X = 10, Y = –60, Z = 70) | 1.31 × 10 |
| Light | Precuneus gyrus | BA 7, MNI (X = 10, Y = –60, Z = 70) | 1.30 × 10 |
| Extremely light | Precuneus gyrus | BA 7, MNI (X = 10, Y = –60, Z = 70) | 1.30 × 10 |
| BA, Brodmann area; MNI, Montreal Neurological Institute; Th-value, threshold. | |||
A pairwise comparison between exertion levels for two frequency bands was performed. The CSDs for pairwise exertion levels resulting from the permutation test applied in eLORETA are displayed in Table 3 for alpha frequency and Table 4 for beta frequency. For illustration purposes, the three-dimensional statistical mapping figures are also provided, wherein yellow indicates an increase in oscillatory activity, and blue indicates a decrease in oscillatory activity. Herein, we focused on providing the three-dimensional statistical mapping figures for comparison between the extreme exertion levels (i.e., extremely hard, and extremely light) and the moderate exertion level (i.e., somewhat hard) for the two frequency bands, to avoid excessive figures.
| Exertion level comparison | Brain structure | Maximum/minimum activated BA | Threshold value (Th-value) for p |
|---|---|---|---|
| EH vs H | Precentral gyrus | BA 4 | T-max = 1.45 |
| EH vs SWH | Precentral gyrus | BA 4 | T-max = 1.45 |
| EH vs L | Precentral gyrus | BA 4 | T-max = 1.45 |
| EH vs EL | Precentral gyrus | BA 4 | T-max = 1.45 |
| H vs SWH | Precentral gyrus | BA 7 | T-max = 0.009 |
| H vs L | Superior temporal gyrus | BA 22 | T-max = 0.009 |
| H vs EL | Superior temporal gyrus | BA 22 | T-min = 0.009 |
| SWH vs L | Middle temporal gyrus | BA 21 | T-min = 0.00837 |
| L vs EL | Precuneus | BA 7 | T-max = 0.00442 |
| EH, extremely hard; H, hard; SWH, somewhat hard; L, light; EL, extremely light. | |||
| Exertion level comparison | Brain structure | Maximum/minimum activated BA | Threshold value (Th-value) for p |
|---|---|---|---|
| EH vs H | Inferior parietal lobule | BA 40 | T-max = 0.405 |
| EH vs SWH | Inferior parietal lobule | BA 40 | T-max = 0.407 |
| EH vs L | Inferior parietal lobule | BA 40 | T-max = 0.407 |
| EH vs EL | Postcentral gyrus | BA 2 | T-max = 0.388 |
| H vs SWH | Inferior parietal lobule | BA 40 | T-min = 0.00153 |
| H vs L | Middle occipital gyrus | BA 19 | T-min = 0.00231 |
| H vs EL | Precentral gyrus | BA 4 | T-max = 0.003 |
| SWH vs L | Precuneus gyrus | BA 31 | T-max = 0.00155 |
| L vs EL | Precentral gyrus in frontal lobe | BA 4 | T-max = 0.003 |
| EH, extremely hard; H, hard; SWH, somewhat hard; L, light; EL, extremely light. | |||
Fig. 3 is a representation of the three-dimensional statistical mapping resulting from the comparison of eLORETA CSD between the extremely hard exertion levels for the alpha band. The extremely hard exertion level, compared with the extremely light exertion level, resulted in neurons that oscillated more strongly in the frontal lobe (precentral gyrus, BA 4 (X = 65, Y = –5, Z = 20), BA 6, (X = 65, Y = –5, Z = 25)) and the parietal lobe (postcentral gyrus, BA 43 (X = 65, Y = –10, Z = 20)), with a log-F-ratio threshold T-max = 1.459.
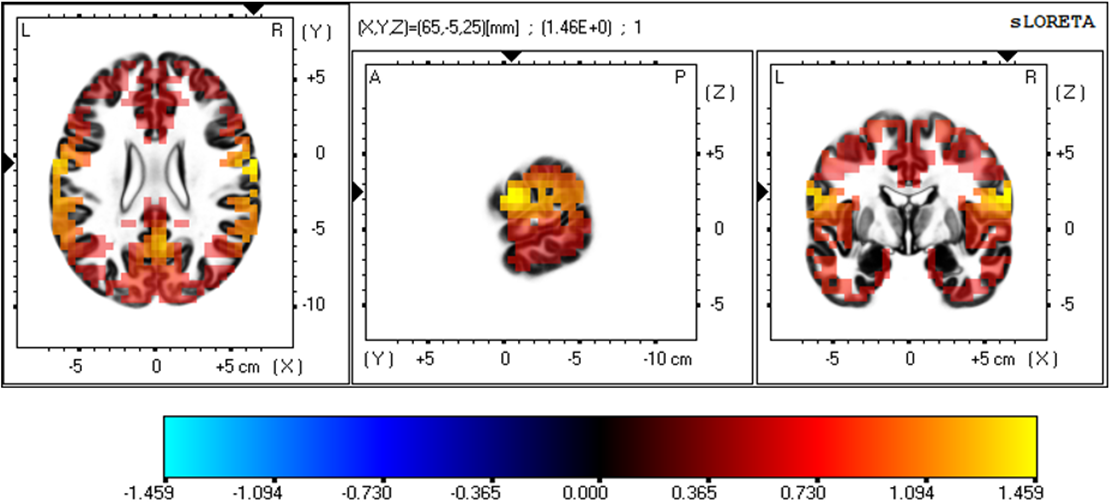 Fig. 3.
Three-dimensional statistical mapping for the alpha frequency band in extremely hard vs extremely light exertion levels.
The three-dimensional statistical mapping resulting from the comparison of eLORETA CSD between the extreme exertion levels for beta band is shown in Fig. 4. Extremely hard exertion, compared with extremely light exertion, resulted in neurons that oscillated more strongly in the parietal lobe (inferior parietal lobule, BA 40 (X = 60, Y = –35, Z = 50) and postcentral gyrus, BA 2 (X = 60, Y = –30, Z = 50), with a log-F-ratio threshold T-max = 0.407.
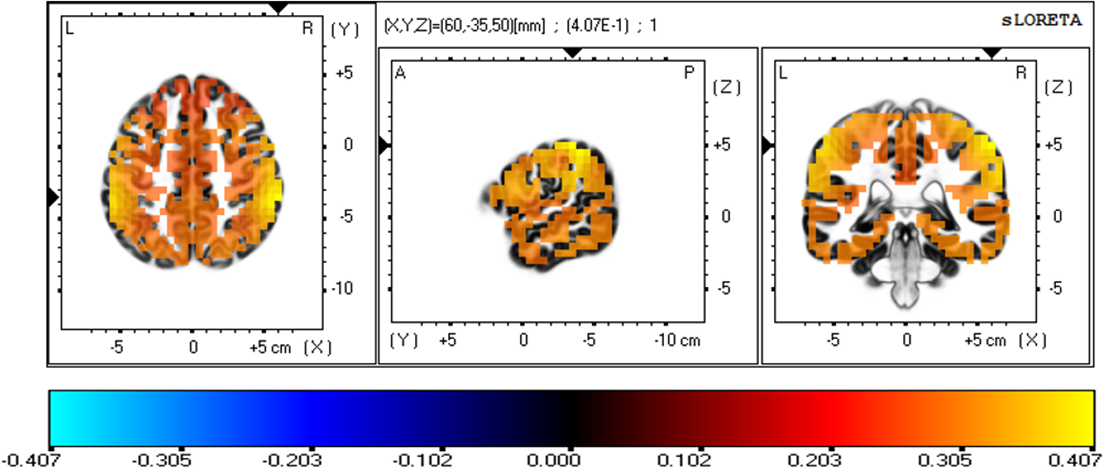 Fig. 4.
eLORETA statistical maps for the beta frequency band in extremely hard vs extremely light exertion levels.
The three-dimensional statistical mapping resulting from the comparison of eLORETA CSD between the extremely hard and somewhat hard exertion levels for the alpha band is depicted in Fig. 5. Extremely hard exertion resulted in neurons that oscillated more strongly than those at the somewhat hard exertion level in the frontal lobe (precentral gyrus, BA 6 (X = 65, Y = –5, Z = 25), with a log-F-ratio threshold T-max = 1.458).
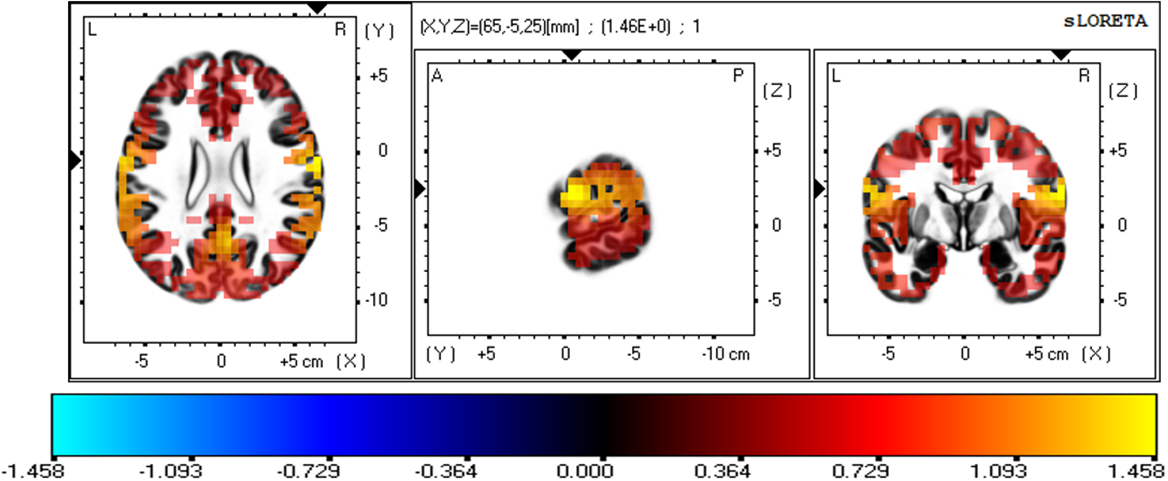 Fig. 5.
eLORETA statistical maps for the alpha frequency band in extremely hard vs somewhat hard exertion levels.
Fig. 6 depicts the three-dimensional statistical mapping resulting from the comparison of eLORETA CSD between the extremely hard and somewhat hard exertion levels for the beta band. The extremely hard exertions resulted in neurons that oscillated more strongly than those at the somewhat hard exertion level in the parietal lobe (inferior parietal lobule, BA 40 (X = 65, Y = –35, Z = 50), with a log-F-ratio threshold T-max = 0.406).
 Fig. 6.
eLORETA statistical maps for the beta frequency band in extremely hard vs somewhat hard exertion levels.
To our knowledge, this is the first study localizing the EEG activity among various predefined force exertion levels during an isometric arm exertion task in healthy female participants. In this study, eLORETA was used with EEG data to examine the effects of induced force exertion in healthy female participants. We applied source localization to identify the activated brain regions at various predefined physical exertion levels for both the alpha and beta bands and detected the maximum activated brain regions at each physical exertion level at each frequency band.
For the alpha band, the maximum CSD was found in the superior frontal gyrus of the frontal lobe, corresponding to BA 6, under the extremely hard exertion level only. However, for all other exertion levels, the highest CSD was observed in the middle frontal gyrus of the frontal lobe, corresponding to BA 8. Findings from this study are in line with previous results reported by Schneider et al. [53], who have concluded that high-intensity physical exercise is associated with in an increase in the CSD of the alpha band in frontal brain areas corresponding to the prefrontal cortex (BA 9) and premotor cortex (BA6). Greater neural activity in BA 9 and BA 6 is crucial for motor planning and sensory integration [53]. In general, changes in the brain activity in the frontal brain regions are involved in cognitive processes such as decision-making, attention motivation, and emotional processing [54, 96, 97, 98]. Therefore, future research should consider that tasks with forceful exertion might affect participants’ moods and workers’ general feelings of wellbeing [99, 100, 101]. Furthermore, the elevated brain activity in these regions might be affected by the progression of fatigue as a result of elevated exertion [102]. Therefore, future studies must investigate the changes in the CSD regarding fatigue exertion task.
For beta activity, the maximum CSD was found in the postcentral gyrus of the parietal lobe, corresponding to BA 5, under only the extremely hard exertion level. For all other exertion levels, the maximum CSD was localized in the precuneus of the parietal lobe, corresponding to BA 7, which is believed to be predominant in motor behavior in general [101, 103], somatosensory perception [104], and conscious awareness [105]. Our results are consistent with those of Fontes et al. [106], who have reported high activation of the posterior cingulate gyrus and precuneus under perceived hard exertion and hypothesized that the “posterior region and precuneus might integrate physiological afferent signals from the periphery to promote emotional and conscious control during exercise through perceived exertion”.
One limitation of the present study is the limited sample of female participants. Another limitation is the selection of only alpha and beta frequency bands. Future studies may need to explore other frequency bands, such as theta and gamma, in studying brain activity in physical exertion tasks. Moreover, this study considered only an arm exertion task, although other body parts, such as the legs and torso, substantially contribute to work-related musculoskeletal disorders. Despite the study limitations, the present study confirms the interest in merging brain activity with perceived exertion in physical tasks to understand the underlying neurophysiological basis under different force levels of human physical exertion and consequently decrease work-related musculoskeletal disorders. Future studies may also pay more attention to connectivity estimation methods to investigate the differences in network topological properties with different force levels [107].
Our findings highlight the dynamic changes in brain activity associated with various levels of predefined forces exerted under predefined task conditions in healthy female participants. For the extremely hard exertion level only the highest CSD was found in the middle frontal gyrus of the frontal lobe (BA 6) for the alpha band. However, for all other exertion levels, the highest CSD was found in the superior frontal gyrus of the frontal lobe (BA 8). For the extremely hard exertion level only, the highest CSD was localized in the postcentral gyrus of the parietal lobe (BA 5) for the beta band. However, for all other exertion levels, the highest CSD was highly localized in the precuneus of the parietal lobe (BA 7). The results of this study appear to provide additional evidence confirming that the human brain recruits’ resources to efficiently respond to increasing demand for exerted force in physical tasks in addition to the need to maintain the required level of task cognitive processes. To our knowledge, this is the first study localizing the EEG activity among various predefined force exertion levels during an isometric arm exertion task in healthy female participants.
The datasets generated and/or analyzed during the current study are not publicly available due to privacy and ethical concerns but are available from the corresponding author on reasonable request.
LI and WK contributed to the conception and design of the study and were involved in drafting and critically revising the manuscript. LI performed experimental work and data processing. WK contributed to the analysis and results of the experimental work. LI provided the discussion of the data and prepared the first draft of the manuscript then WK worked on the draft to produce the final version and gave final approval for publication. All authors contributed to editorial changes in the manuscript. All authors read and approved the final manuscript. All authors have participated sufficiently in the work and agreed to be accountable for all aspects of the work.
This study was approved by the ethical committee of the Institutional Review Board at the University of Central Florida (STUDY00000535). All subjects gave their informed consent for inclusion before they participated in the study.
We thank to all the peer reviewers for their opinions and suggestions. Furthermore, we thank all participants in the experiment.
This research received no external funding.
The authors declare no conflict of interest.
See Table 5.
| Hemisphere | MNI | Lobe | Structure | Brodmann area | ROI | ||
| X | Y | Z | |||||
| Left | –35 | –25 | 55 | Frontal Lobe | Precentral Gyrus | BA 4 | 1 |
| Right | 35 | –20 | 50 | Frontal Lobe | Precentral Gyrus | BA 4 | 2 |
| Right | 15 | –45 | 60 | Frontal Lobe | Paracentral Lobule | BA 5 | 3 |
| Left | –15 | –45 | 60 | Frontal Lobe | Paracentral Lobule | BA 5 | 4 |
| Right | 30 | –5 | 55 | Frontal Lobe | Middle Frontal Gyrus | BA 6 | 5 |
| Left | –30 | –5 | 55 | Frontal Lobe | Middle Frontal Gyrus | BA 6 | 6 |
| Right | 20 | 25 | 50 | Frontal Lobe | Superior Frontal Gyrus | BA 8 | 7 |
| Left | –20 | 30 | 50 | Frontal Lobe | Superior Frontal Gyrus | BA 8 | 8 |
| Left | –30 | 30 | 35 | Frontal Lobe | Middle Frontal Gyrus | BA 9 | 9 |
| Right | 30 | 30 | 35 | Frontal Lobe | Middle Frontal Gyrus | BA 9 | 10 |
| Right | 25 | 55 | 5 | Frontal Lobe | Superior Frontal Gyrus | BA 10 | 11 |
| Left | –25 | 55 | 5 | Frontal Lobe | Superior Frontal Gyrus | BA 10 | 12 |
| Right | 20 | 45 | –20 | Frontal Lobe | Superior Frontal Gyrus | BA 11 | 13 |
| Left | –20 | 40 | –15 | Frontal Lobe | Middle Frontal Gyrus | BA 11 | 14 |
| Right | 5 | 15 | –15 | Frontal Lobe | Subcallosal Gyrus | BA 25 | 15 |
| Left | –10 | 20 | –15 | Frontal Lobe | Medial Frontal Gyrus | BA 25 | 16 |
| Right | 55 | 10 | 15 | Frontal Lobe | Precentral Gyrus | BA 44 | 17 |
| Left | –50 | 10 | 15 | Frontal Lobe | Precentral Gyrus | BA 44 | 18 |
| Right | 50 | 20 | 15 | Frontal Lobe | Inferior Frontal Gyrus | BA 45 | 19 |
| Left | –50 | 20 | 15 | Frontal Lobe | Inferior Frontal Gyrus | BA 45 | 20 |
| Right | 45 | 35 | 20 | Frontal Lobe | Middle Frontal Gyrus | BA 46 | 21 |
| Left | –45 | 35 | 20 | Frontal Lobe | Middle Frontal Gyrus | BA 46 | 22 |
| Right | 30 | 25 | –15 | Frontal Lobe | Inferior Frontal Gyrus | BA 47 | 23 |
| Left | –30 | 25 | –15 | Frontal Lobe | Inferior Frontal Gyrus | BA 47 | 24 |
| Left | –55 | –25 | 50 | Parietal Lobe | Postcentral Gyrus | BA 2 | 25 |
| Left | –45 | –30 | 45 | Parietal Lobe | Postcentral Gyrus | BA 2 | 26 |
| Right | 55 | –25 | 50 | Parietal Lobe | Postcentral Gyrus | BA 2 | 27 |
| Right | 35 | –25 | 50 | Parietal Lobe | Postcentral Gyrus | BA 3 | 28 |
| Right | 40 | –25 | 50 | Parietal Lobe | Postcentral Gyrus | BA 3 | 29 |
| Left | –20 | –65 | 50 | Parietal Lobe | Precuneus | BA 7 | 30 |
| Right | 15 | –65 | 50 | Parietal Lobe | Precuneus | BA 7 | 31 |
| Left | –10 | –50 | 30 | Parietal Lobe | Precuneus | BA 31 | 32 |
| Right | 10 | –50 | 35 | Parietal Lobe | Precuneus | BA 31 | 33 |
| Right | 50 | –30 | 45 | Parietal Lobe | Inferior Parietal Lobule | BA 40 | 34 |
| Right | 50 | –45 | 45 | Parietal Lobe | Inferior Parietal Lobule | BA 40 | 35 |
| Left | –50 | –40 | 40 | Parietal Lobe | Inferior Parietal Lobule | BA 40 | 36 |
| Left | –5 | –40 | 25 | Limbic Lobe | Posterior Cingulate | BA 23 | 37 |
| Right | 5 | –45 | 25 | Limbic Lobe | Posterior Cingulate | BA 23 | 38 |
| Right | 5 | 0 | 35 | Limbic Lobe | Cingulate Gyrus | BA 24 | 39 |
| Right | 5 | 30 | 20 | Limbic Lobe | Anterior Cingulate | BA 24 | 40 |
| Left | –5 | 0 | 35 | Limbic Lobe | Cingulate Gyrus | BA 24 | 41 |
| Left | –5 | 30 | 20 | Limbic Lobe | Anterior Cingulate | BA 24 | 42 |
| Right | 20 | –35 | –5 | Limbic Lobe | Parahippocampal Gyrus | BA 27 | 43 |
| Left | –20 | –35 | –5 | Limbic Lobe | Parahippocampal Gyrus | BA 27 | 44 |
| Left | –20 | –10 | –25 | Limbic Lobe | Parahippocampal Gyrus | BA 28 | 45 |
| Right | 20 | –10 | –25 | Limbic Lobe | Parahippocampal Gyrus | BA 28 | 46 |
| Left | –5 | –50 | 5 | Limbic Lobe | Posterior Cingulate | BA 29 | 47 |
| Right | 5 | –50 | 5 | Limbic Lobe | Posterior Cingulate | BA 29 | 48 |
| Left | –15 | –60 | 5 | Limbic Lobe | Posterior Cingulate | BA 30 | 49 |
| Left | –5 | 20 | 20 | Limbic Lobe | Anterior Cingulate | BA 33 | 50 |
| Right | 0 | 20 | 20 | Limbic Lobe | Anterior Cingulate | BA 33 | 51 |
| Right | 15 | 0 | –20 | Limbic Lobe | Parahippocampal Gyrus | BA 34 | 52 |
| Left | –15 | 0 | –20 | Limbic Lobe | Parahippocampal Gyrus | BA 34 | 53 |
| Left | –20 | –25 | –20 | Limbic Lobe | Parahippocampal Gyrus | BA 35 | 54 |
| Right | 30 | –25 | –25 | Limbic Lobe | Parahippocampal Gyrus | BA 35 | 55 |
| Right | 25 | –25 | –20 | Limbic Lobe | Parahippocampal Gyrus | BA 35 | 56 |
| Left | –30 | –30 | –25 | Limbic Lobe | Parahippocampal Gyrus | BA 36 | 57 |
| Right | –5 | –40 | 25 | Limbic Lobe | Posterior Cingulate | BA 23 | 58 |
| Left | –45 | –20 | –30 | Temporal Lobe | Fusiform Gyrus | BA 20 | 59 |
| Left | –60 | –20 | –15 | Temporal Lobe | Middle Temporal Gyrus | BA 21 | 60 |
| Right | 60 | –15 | –15 | Temporal Lobe | Middle Temporal Gyrus | BA 21 | 61 |
| Left | –45 | –55 | –15 | Temporal Lobe | Fusiform Gyrus | BA 37 | 62 |
| Right | 45 | –55 | –15 | Temporal Lobe | Fusiform Gyrus | BA 37 | 63 |
| Left | –40 | 15 | –30 | Temporal Lobe | Superior Temporal Gyrus | BA 38 | 64 |
| Right | 40 | 15 | –30 | Temporal Lobe | Superior Temporal Gyrus | BA 38 | 65 |
| Right | 45 | –65 | 25 | Temporal Lobe | Middle Temporal Gyrus | BA 39 | 66 |
| Left | –45 | –65 | 25 | Temporal Lobe | Middle Temporal Gyrus | BA 39 | 67 |
| Left | –45 | –30 | 10 | Temporal Lobe | Transverse Temporal Gyrus | BA 41 | 68 |
| Right | 55 | –20 | 5 | Temporal Lobe | Superior Temporal Gyrus | BA 41 | 69 |
| Left | –55 | –25 | 5 | Temporal Lobe | Superior Temporal Gyrus | BA 41 | 70 |
| Right | 45 | –30 | 10 | Temporal Lobe | Transverse Temporal Gyrus | BA 41 | 71 |
| Left | –60 | –10 | 15 | Temporal Lobe | Transverse Temporal Gyrus | BA 42 | 72 |
| Left | –60 | –25 | 10 | Temporal Lobe | Superior Temporal Gyrus | BA 42 | 73 |
| Right | 60 | –10 | 15 | Temporal Lobe | Transverse Temporal Gyrus | BA 42 | 74 |
| Right | 65 | –25 | 10 | Temporal Lobe | Superior Temporal Gyrus | BA 42 | 75 |
| Right | 15 | –85 | 0 | Occipital Lobe | Lingual Gyrus | BA 17 | 76 |
| Right | 10 | –90 | 0 | Occipital Lobe | Lingual Gyrus | BA 17 | 77 |
| Left | –10 | –90 | 0 | Occipital Lobe | Lingual Gyrus | BA 17 | 78 |
| Left | –15 | –85 | 0 | Occipital Lobe | Lingual Gyrus | BA 17 | 79 |
| Left | –25 | –75 | 10 | Occipital Lobe | Cuneus | BA 30 | 80 |
| Right | 10 | –60 | 5 | Occipital Lobe | Cuneus | BA 30 | 81 |
| Right | 25 | –75 | 10 | Occipital Lobe | Cuneus | BA 30 | 82 |
| Right | 40 | –5 | 10 | Sub-lobar | Insula | BA 13 | 83 |
| Left | –40 | –10 | 10 | Sub-lobar | Insula | BA 13 | 84 |
References
Publisher’s Note: IMR Press stays neutral with regard to jurisdictional claims in published maps and institutional affiliations.