
- Academic Editor
Background: Glaucoma is the leading cause of irreversible blindness, and the loss of retinal ganglion cells (RGCs) is the most important pathological feature. During the progression of glaucoma, glutamate content in the optic nerve increases, and glutamate-induced excitotoxicity will aggregate the damage and death of RGCs. We have previously reported that olfactory ensheathing cells (OECs) transplantation preserved the visual function of the glaucoma model but the mechanism is unknown. Methods: Adult Long-Evans rats were used in the present study and injecting magnetic microspheres was used to establish a glaucoma model in rats. Optokinetic response test and Pattern electroretinogram recording were used to assess the visual functions of rats. RT-PCR, immunofluorescence, and co-culture experiments were performed to investigate the therapeutic effects and mechanisms of OECs for glaucoma. Results: In the glaucoma model, increased glutamate content and the damage of astrocytes (AC) and RGCs were observed. OECs transplantation reduced the glutamate concentration in the optic nerve, alleviated the apoptosis of AC and RGCs, and protected the visual function of the glaucoma model. Furthermore, we found that OECs possessed a stronger capacity to metabolize excessive glutamate compared with AC and Müller glia. OECs could improve the glutamate microenvironment of the optic nerve to prevent AC and RGCs from glutamate-induced excitotoxicity in glaucoma. And the recovery of AC function further supported the survival of RGCs. Conclusions: We demonstrate that OECs transplantation could play a neuroprotective role by regulating the glutamate microenvironment in glaucoma.
As the most common cause of global irreversible blindness, glaucoma is a group of heterogeneous diseases characterized by progressive optic nerve damage and retinal ganglion cells (RGCs) death, leading to permanent visual field loss and blindness eventually [1]. Worldwide, the prevalence of glaucoma for people aged 40–80 is 3.5%, and an estimated 70 million people have glaucoma so far [2]. The death of RGCs, the retina’s output neurons that convey visual information to the brain, is the most critical pathological event during glaucoma. So figuring out the mechanisms of RGC’s death and rescuing RGCs are the key points for glaucoma treatment [3].
The pathogenesis of glaucoma is multifactorial including elevated intraocular pressure (IOP), increased age, vascular dysfunction, and genetic deficit [4]. Recently, multiple intrinsic and extrinsic molecules and signaling pathways were proven to trigger optic nerve axon injury and RGCs apoptosis [3, 5]. Among these mechanisms, the neurotoxicity due to the overactivation of N-methyl-d-aspartate (NMDA) receptors by glutamate is regarded as one of the imperative causes of RGCs death [6, 7]. Meanwhile, glutamate excitotoxicity will cause astrocyte dysfunction and damage [8]. Astrocytes provide structural, energic, and trophic support for RGCs by enveloping optic nerve axons without myelin sheath, participating in optic nerve metabolism, and secreting trophic factors [9]. Meanwhile, astrocytes are the predominant glia participating in glutamate metabolism in the optic nerve and the dysfunction of astrocytes will further elevate the level of glutamate and aggravate the degeneration of axons and RGCs [10]. Therefore, targeting glutamate neurotoxicity and enhancing the supportive functions of astrocytes may be promising strategies for glaucoma treatment.
Olfactory ensheathing cells (OECs), a unique macroglia isolated from the olfactory bulb and the olfactory nerve originated from the embryonic ectoderm of olfactory placodes [11]. OECs that were present in Peripheral Nervous System (PNS) and Central Nervous System (CNS) shared the functional characteristic with astrocytes and Schwann cells and possessed more advantages over them like migration, immunomodulatory and pro-regeneration [11, 12]. OECs were first used to treat spinal cord injury and displayed excellent therapeutic potential and the capacity to promote regeneration [13]. Transplanted OECs could envelop injured axons, degrade inhibitory extracellular matrix, modulate the immune response, and secret neurotrophic factors for CNS repair, leading to extensive nerve regeneration and functional recovery [14]. In previous research, we demonstrated that OECs transplantation into sub-retinal space could retard retinal degeneration by clearing cell debris, reducing the gliotic response of Müller cells, and regulating the activation of microglia [15, 16, 17]. In addition, transplanted OECs were observed to incorporate into the optic papilla where OECs enveloped optic nerve axon in a non-myelination manner, leading to the optic nerve axon regeneration and functional recovery in the optic nerve injury model [18, 19]. The interaction between OECs and astrocytes could regulate the astrocyte reactivity, alleviate neurotoxicity, rearrange glial scar, and format “a bridge” that permits axon regeneration, which was recognized as the vital mechanism for CNS repair [20, 21, 22]. Considering the regulatory effect of OECs on astrocytes, glutamate excitotoxicity, and astrocyte functions in the optic nerve, we think OECs may involve in the regulation of glutamate metabolism and astrocyte function in glaucoma. But the relationship between glutamate metabolism, astrocyte function, and RGCs injury in glaucoma after OECs transplantation was unknown.
In the present research, we established an elevated IOP glaucoma rat model in which visual function declined progressively, accompanied by optic nerve fiber damage and astrocyte gliosis by injecting magnetic microspheres into the anterior chamber. The transplantation of OECs alleviated optic nerve axon degeneration and astrocyte gliosis, which caused the improvement of visual functions without decreasing IOP. And this protective effect on the optic nerve and visual function last at least 6 weeks. By exploring mechanisms further, we found that OECs possessed a stronger capacity to metabolize glutamate than astrocytes and Müller glia by expressing high-level glutamate metabolism-related enzymes. OECs could decrease glutamate concentration, which contributed to reducing glutamate-induced neurotoxicity for RGCs. On the other hand, OECs also improved glutamate-induced dysfunction and damage of astrocytes, and the supportive functional improvement of astrocytes further promotes the survival of RGCs. In summary, we demonstrated that OECs transplantation is a prospective treatment for glaucoma.
Adult Long-Evans (LE) rats regardless of sex used in this study were provided by
the Animal Centre of the Third Military Medical University (Army Medical
University). Rats were maintained in the Animal Center of Southwest Hospital
under a regular 12 h light/dark cycle. LE rats were worn animal masks and
anesthetized by inhalation mixed O
IOP of all rats was measured in both eyes 1 day before and 1 day after microspheres injection, then weekly until 8 weeks post-injection (wpi) in a dark room from 9:00 AM to 10:00 AM. After rats were anesthetized by inhalation successfully, the Icare tonometer was used to quickly measure IOP in both eyes of glaucoma rats three times, and the average value was taken.
OECs were isolated and purified from nerve layers of olfactory bulbs from adult
LE rats as described previously [16]. After being anesthetized deeply with
pentobarbital sodium (10 mg/kg; Sigma-Aldrich, St. Louis, MO, USA). The nerve
layer was isolated from the olfactory bulb, cut into 0.5 mm
OECs were digested into single-cell suspension in Phosphate-Buffered Saline
(PBS) for transplantation, as previously described [15]. Rats were anesthetized
by intramuscular injection of sodium pentobarbital (10 mg/kg). Oxybuprocaine
hydrochloride eye drops were used for ocular surface anesthesia, and compound
tropicamide was used for mydriasis. The bulbar conjunctiva of the corneoscleral
limbus was cut with microscissors, and the bulbar conjunctiva and fascia were
bluntly separated to expose the sclera. Anterior chamber puncture was performed
at the limbus to flow out aqueous humor. The sclera was punctured at 2 mm behind
the corneoscleral limbus; 10
Rats were dark-adapted for 2 hours and then placed on the experimental platform for 1 min before the experiment [24]. The optokinetic test device consisted of upper and lower mirrors, four surrounding computer screens, and a platform located in the center. A camera suspended on the top of the test device was used for recording the behaviors of rats during the test. During the test, a total of 8 bars with different spatial frequency (0.05, 0.075, 0.1, 0.2, 0.3, 0.4, 0.5, and 0.6 cycles/degree from wide to narrow under 100% contrast were applied for detecting the visual acuity. Statistical analysis was performed after the highest spatial frequency with which rats could respond was converted into the corresponding visual acuity.
Pattern electroretinogram (PERG) was recorded as described previously [25]. Rats
were dark-adapted over 8 hours and preparations were performed under dim red
light before PERG recording. Rats were anesthetized by intramuscular injection of
sodium pentobarbital (10 mg/kg) and placed on a heating plate to maintain the
body temperature of rats at 37 °C to prevent hypothermia. Briefly, the
ring recording electrode made of gold was put on the center of the cornea, the
ground electrode was inserted subcutaneously in the tail, and the reference
electrode was inserted into the scleral conjunctiva around the equator of the
eyes. The generation, amplification of stimulus (0.1–500 Hz band-pass), and data
acquisition were performed with a RETIscan system (Roland Consult, Brandenburg,
Germany). White and black alternating reversing bars (contrast, 100%; mean
luminance, 50 cd/m
For cultured cells, cell climbing slices were fixed in 4% paraformaldehyde
(PFA) for 15 min. for retinal tissues, after anesthesia with an intramuscular
injection of sodium pentobarbital (10 mg/kg), the rats were perfused with 0.9%
normal saline through the left ventricle continuously. After the blood was washed
out, rats were perfused with 4% PFA solution for internal fixation. Cut the
bulbar conjunctiva around the corneal limbus, separated fascia and muscle, and
the optic nerve was cut near the orbital apex. The cornea, iris, lens, and
vitreous body were cut off, and only the 0.5 mm sclera and optic nerve close to
the optic disc were kept. The optic nerve was placed in 4% PFA, fixed at 4
°C for 0.5 hours, gradient dehydrated in 10%, 20%, and 30% sucrose/PB
solution, and then put into 30% sucrose/PB solution overnight. Then, the sucrose
solution was exhausted, and the optic nerve was embedded in the optimum cutting
temperature compound and quickly frozen in liquid nitrogen. A cold microtome was
used to cut the tissues into 10-
Frozen sections were washed three times in PBS, permeabilized with 0.3% Triton X-100 for 10 min, and blocked by 1% goat serum for 1 hour at 37 °C. Frozen sections were incubated with primary antibody at 4 °C overnight. After washing in PBS three times, sections were incubated in secondary antibody at 37 °C for 30 min. After staining of DAPI, the sections were scanned and photographed by confocal microscopy (Zeiss LSM 880, Oberkochen, Germany) The antibodies and dilutions were used in present study: mouse anti-Tuj1 (ab78078 1:200, Abcam, Cambridge, UK), Rabbit anti-GFAP (ab7260 1:200, Abcam, Cambridge, UK), Rabbit anti-EAAT2 (ab41621 1:200, Abcam, Cambridge, UK), Rabbit anti-GS (ab64613 1:100, Abcam, Cambridge, UK), mouse anti-CRALBP (ab15051 1:50, Abcam, Cambridge, UK), mouse anti-Caspase-3 (ab13847 1:100, Abcam, Cambridge, UK).
Muscle and connective tissue around the eyeball were isolated and removed to expose the optic nerve. The optic nerve was minced and digested in 0.25% trypsin at 37 °C for 40 min, and D/F12 containing 15% FBS and 1% PS was used to terminate digestion. The cell suspension was centrifuged for 5 min, seeded in T75, and cultured at 37 °C. Once cells reached confluence, T75 was shaken on a shaker at 250 rpm for 18 h, the supernatant was removed and fresh medium was added to T75.
P4 AC (astrocytes) was seeded on a cell climbing slice that was placed in a 24-well plate at
10
The eyeball of LE rats at postnatal 8 days was taken out and incubated in dulbecco’s modified eagle medium (DMEM) without serum at 4 °C overnight. Then, the retina was separated from the eyeball that was digested in 1 mg/mL trypsin 1 mg/mL type IV collagenase at 37 °C for 40 min, then was mechanically dissociated into a single cell and cultured in DMEM containing 10% FBS for 7 days. Upon reaching complete confluence, Müller glia was trypsinized for purification and identification.
P4 AC was cultured in 24-well plates at a density of 1
Glutamate concentration was measured by a Glutamate detection kit (ab83389, Abcam, Cambridge, UK).
Briefly, 0, 2, 4, 6, 8, and 10
Total RNAs of cell and optic nerve tissue cells were extracted using RNAiso Plus (Cat. No. D9108A, Takara, Kyoto, Japan). RNA samples were reversed as cDNA by PrimeScriptTM RT reagent kit (Cat. No. #RR037A, Takara, Kyoto, Japan). RT-qPCR was used to measure the expression of various genes as previously described [13]. And the expressions were normalized to the level of GAPDH. All primers were listed in Table 1.
| Genes | Forward primer | Reverse primer |
|---|---|---|
| Neurofilament | CACCGACCGCCACCAT | CACGTAGCGCCGCTTGT |
| GFAP | TCCTGGAACAGCAAAACAAG | CAGCCTCAGGTTGGTTCAT |
| GAPDH | AAGGTCGGTGTGAACGGATT | TGAACTTGCCGTGGGTAGAG |
| GS | TCCTGTGGCCATGTTTCGAG | GCGGGCTTCCGGTTATACTTG |
| Caspase-3 | TACCCTGAAATGGGCTTGTGT | GTTAACACGAGTGAGGATGTG |
| Bcl-2 | CGCCCGCTGTGCACCGAGA | CACAATCCTCCCCCAGTTCACC |
| Bax | GGCGATGAACTGGACAACAA | CCCAGTTGAAGTTGCCGTCT |
| EAAT1 | TCTTGGTTTCGCTGTCTGCCACG | TCCTCATTCATGCCGTCATCGTCC |
| EAAT2 | ATGTCTTCGTGCATTCGGTGTTGGG | AGCCGTGGCACCATCTTCATAGC |
| EAAT3 | GGGACAGATTCTGGTGGATT | GTGATCCTCTTGTCCAC |
| GFAP, glial fibrillary acidic protein; GAPDH, glyceraldehyde-3-phosphate dehydrogenase; GS, Glutamine synthetase; EAAT1, Excitatory Amino Acid Transporter 1; EAAT2, Excitatory Amino Acid Transporter 2; EAAT3, Excitatory Amino Acid Transporter 3. | ||
All data were analyzed statistically by using SPSS 13.0 (IBM Corp., Chicago, IL,
USA). A T-test was used to compare the means of two groups and one-way
or two-way analysis of variance (ANOVA) was used to compare means among multiple
groups. Results are presented in the form of mean
We established the elevated IOP glaucoma model by injecting magnetic
microspheres into the anterior chamber of LE rats. Magnetic microspheres were
evenly distributed in the corner of the chamber under the attraction of the
magnet, destroying the normal function of the trabecular meshwork (Fig. 1A).
Before injection of microspheres, IOP was measured (10.75
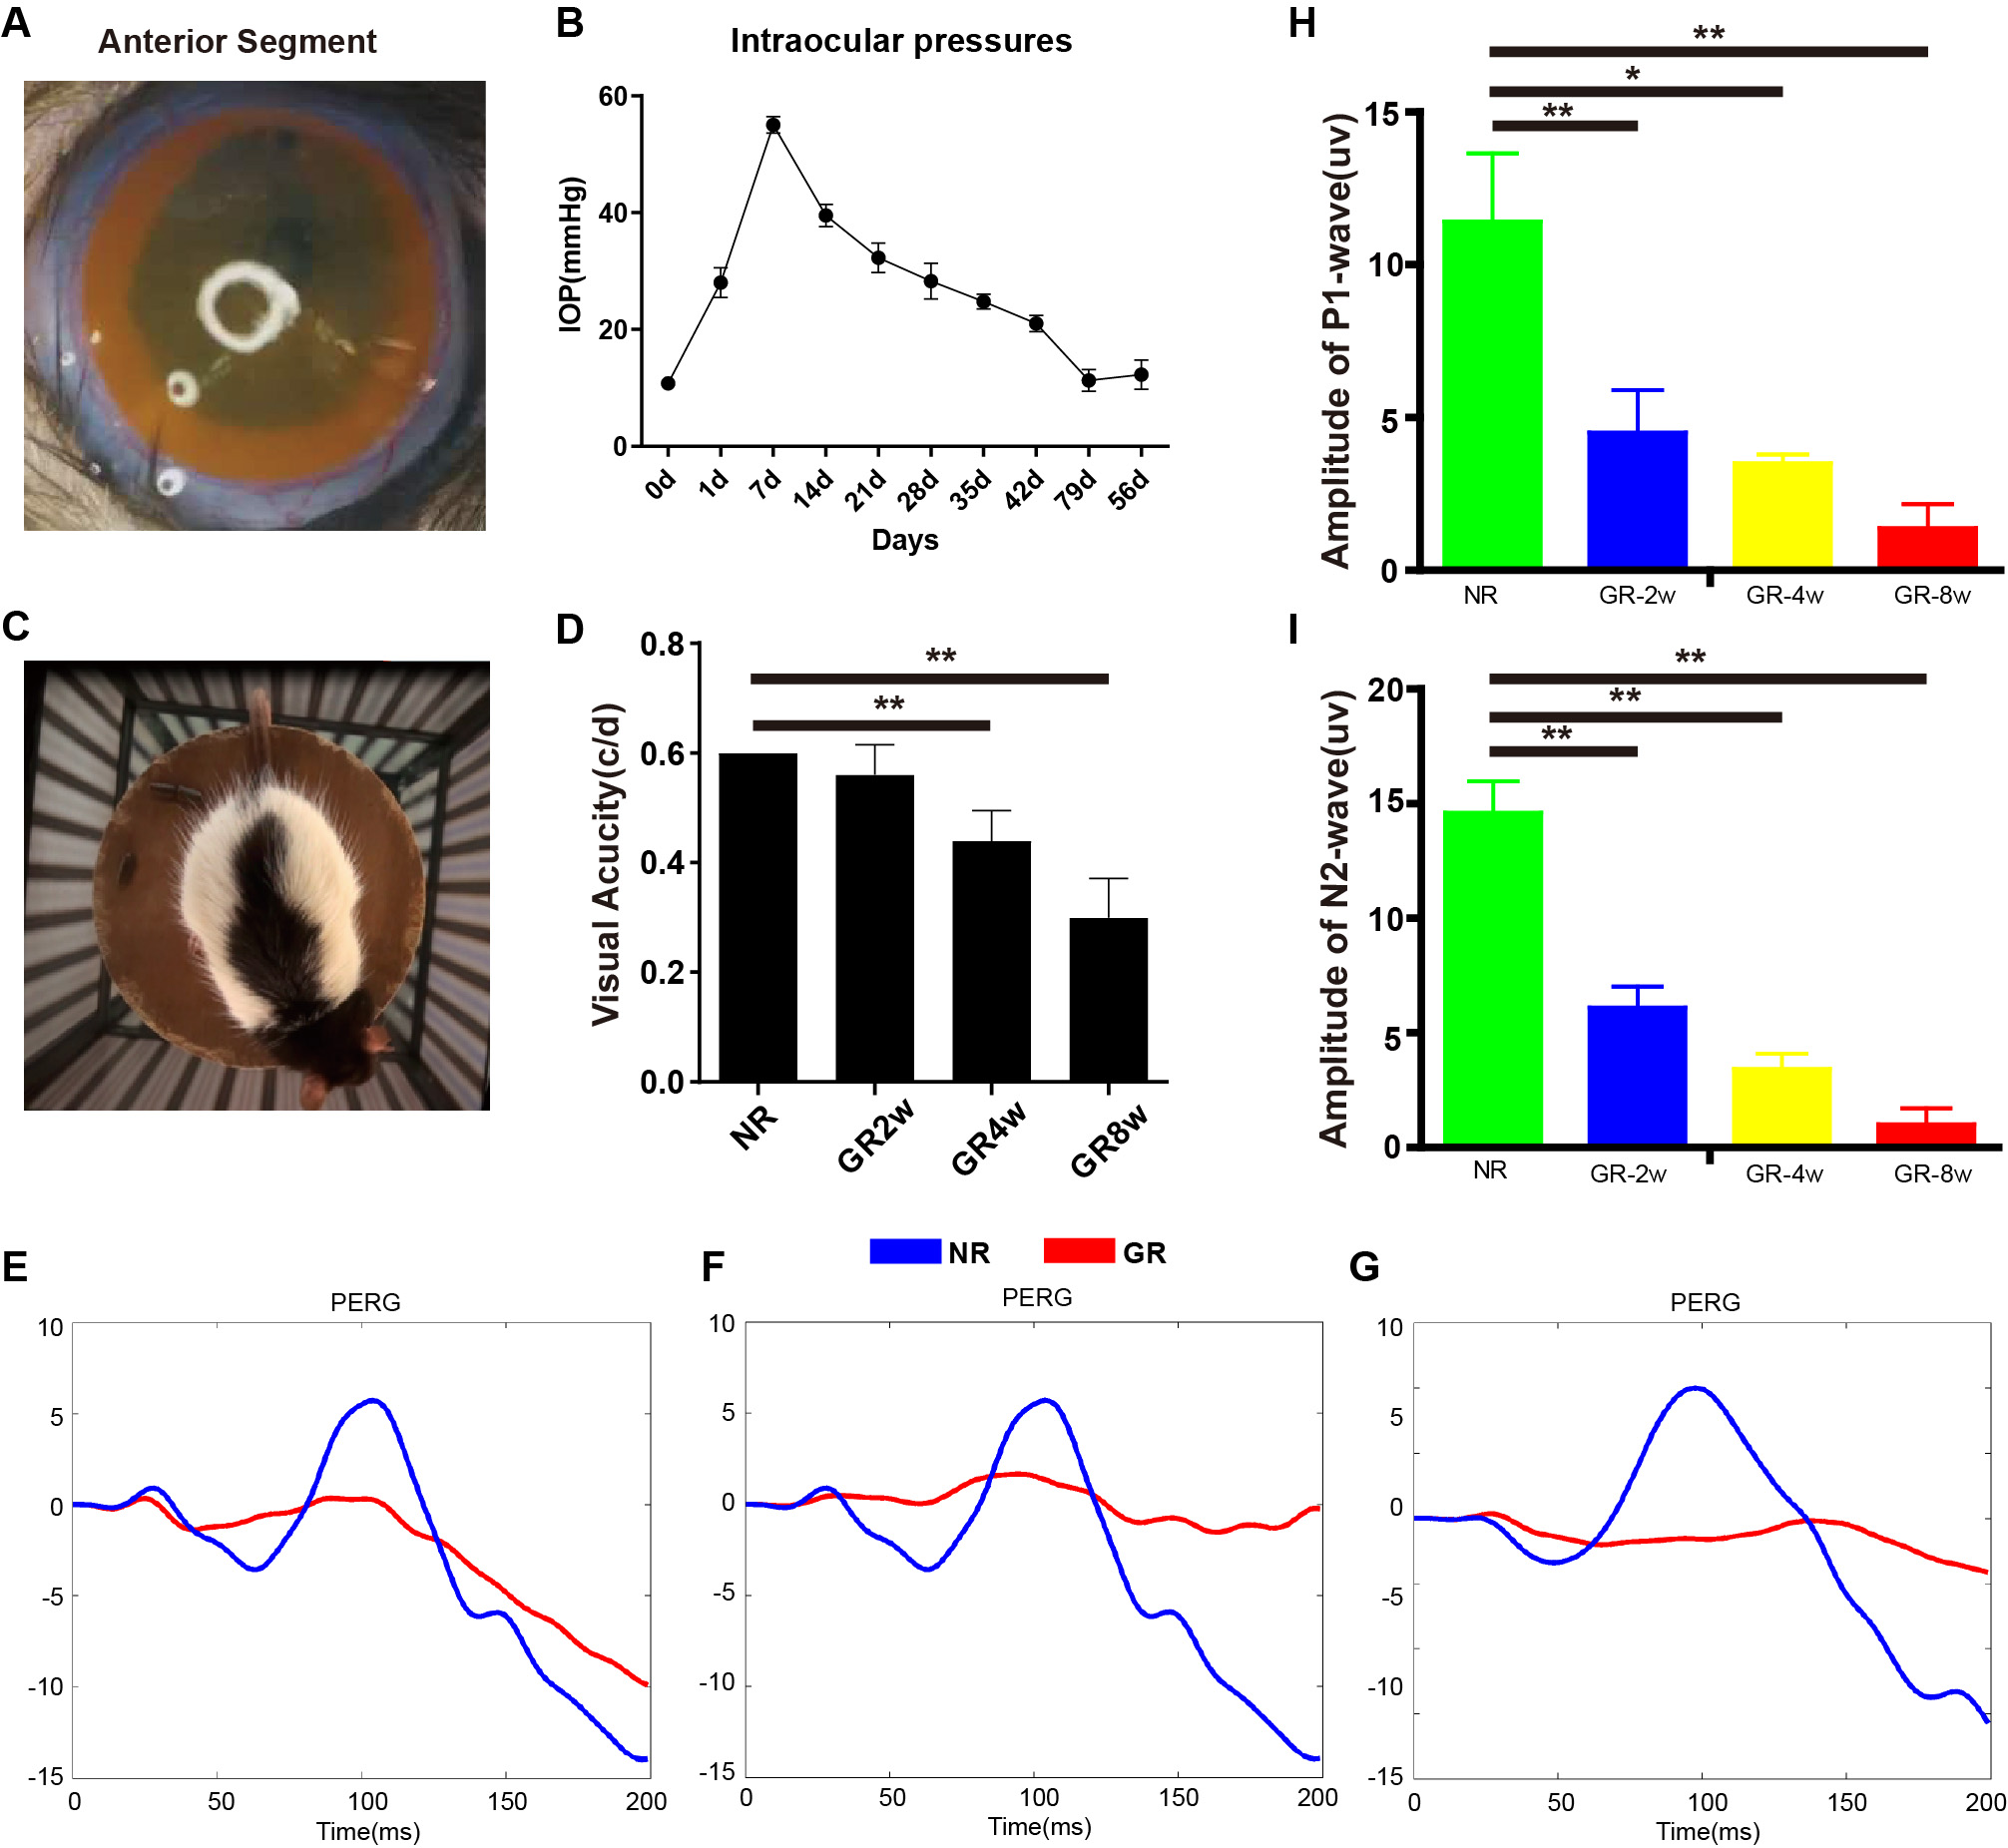 Fig. 1.
The establishment and characteristics of the glaucoma model.
(A) The distribution of magnetic microspheres in glaucoma model rats. (B) Line
chart showing the changes of IOP after injection in glaucoma model rats (n = 5).
(C) Diagram of optokinetic response test. (D) Visual acuity through optokinetic
response test from 2 weeks to 8 weeks post-injection (n = 5). (E–G)
Representative PERG traces in P-wave at 2, 4, and 8 weeks post-injection of
magnetic microspheres. (H,I) Diagram showing P1 and N2 wave amplitude in normal
and glaucoma model rats (n = 4). NR, normal rat; GR, glaucoma rat. *p
During intraocular pressure elevation, the structure of neuronal axons stained
by Tuj1 gradually was disordered, and the loss of axons was observed in some
areas at 2 wpi, and only a small amount of axonal fibers remained at the 8 wpi
(Fig. 2A). The gene expression of Neurofilament declined progressively in
glaucoma (Fig. 2C, p
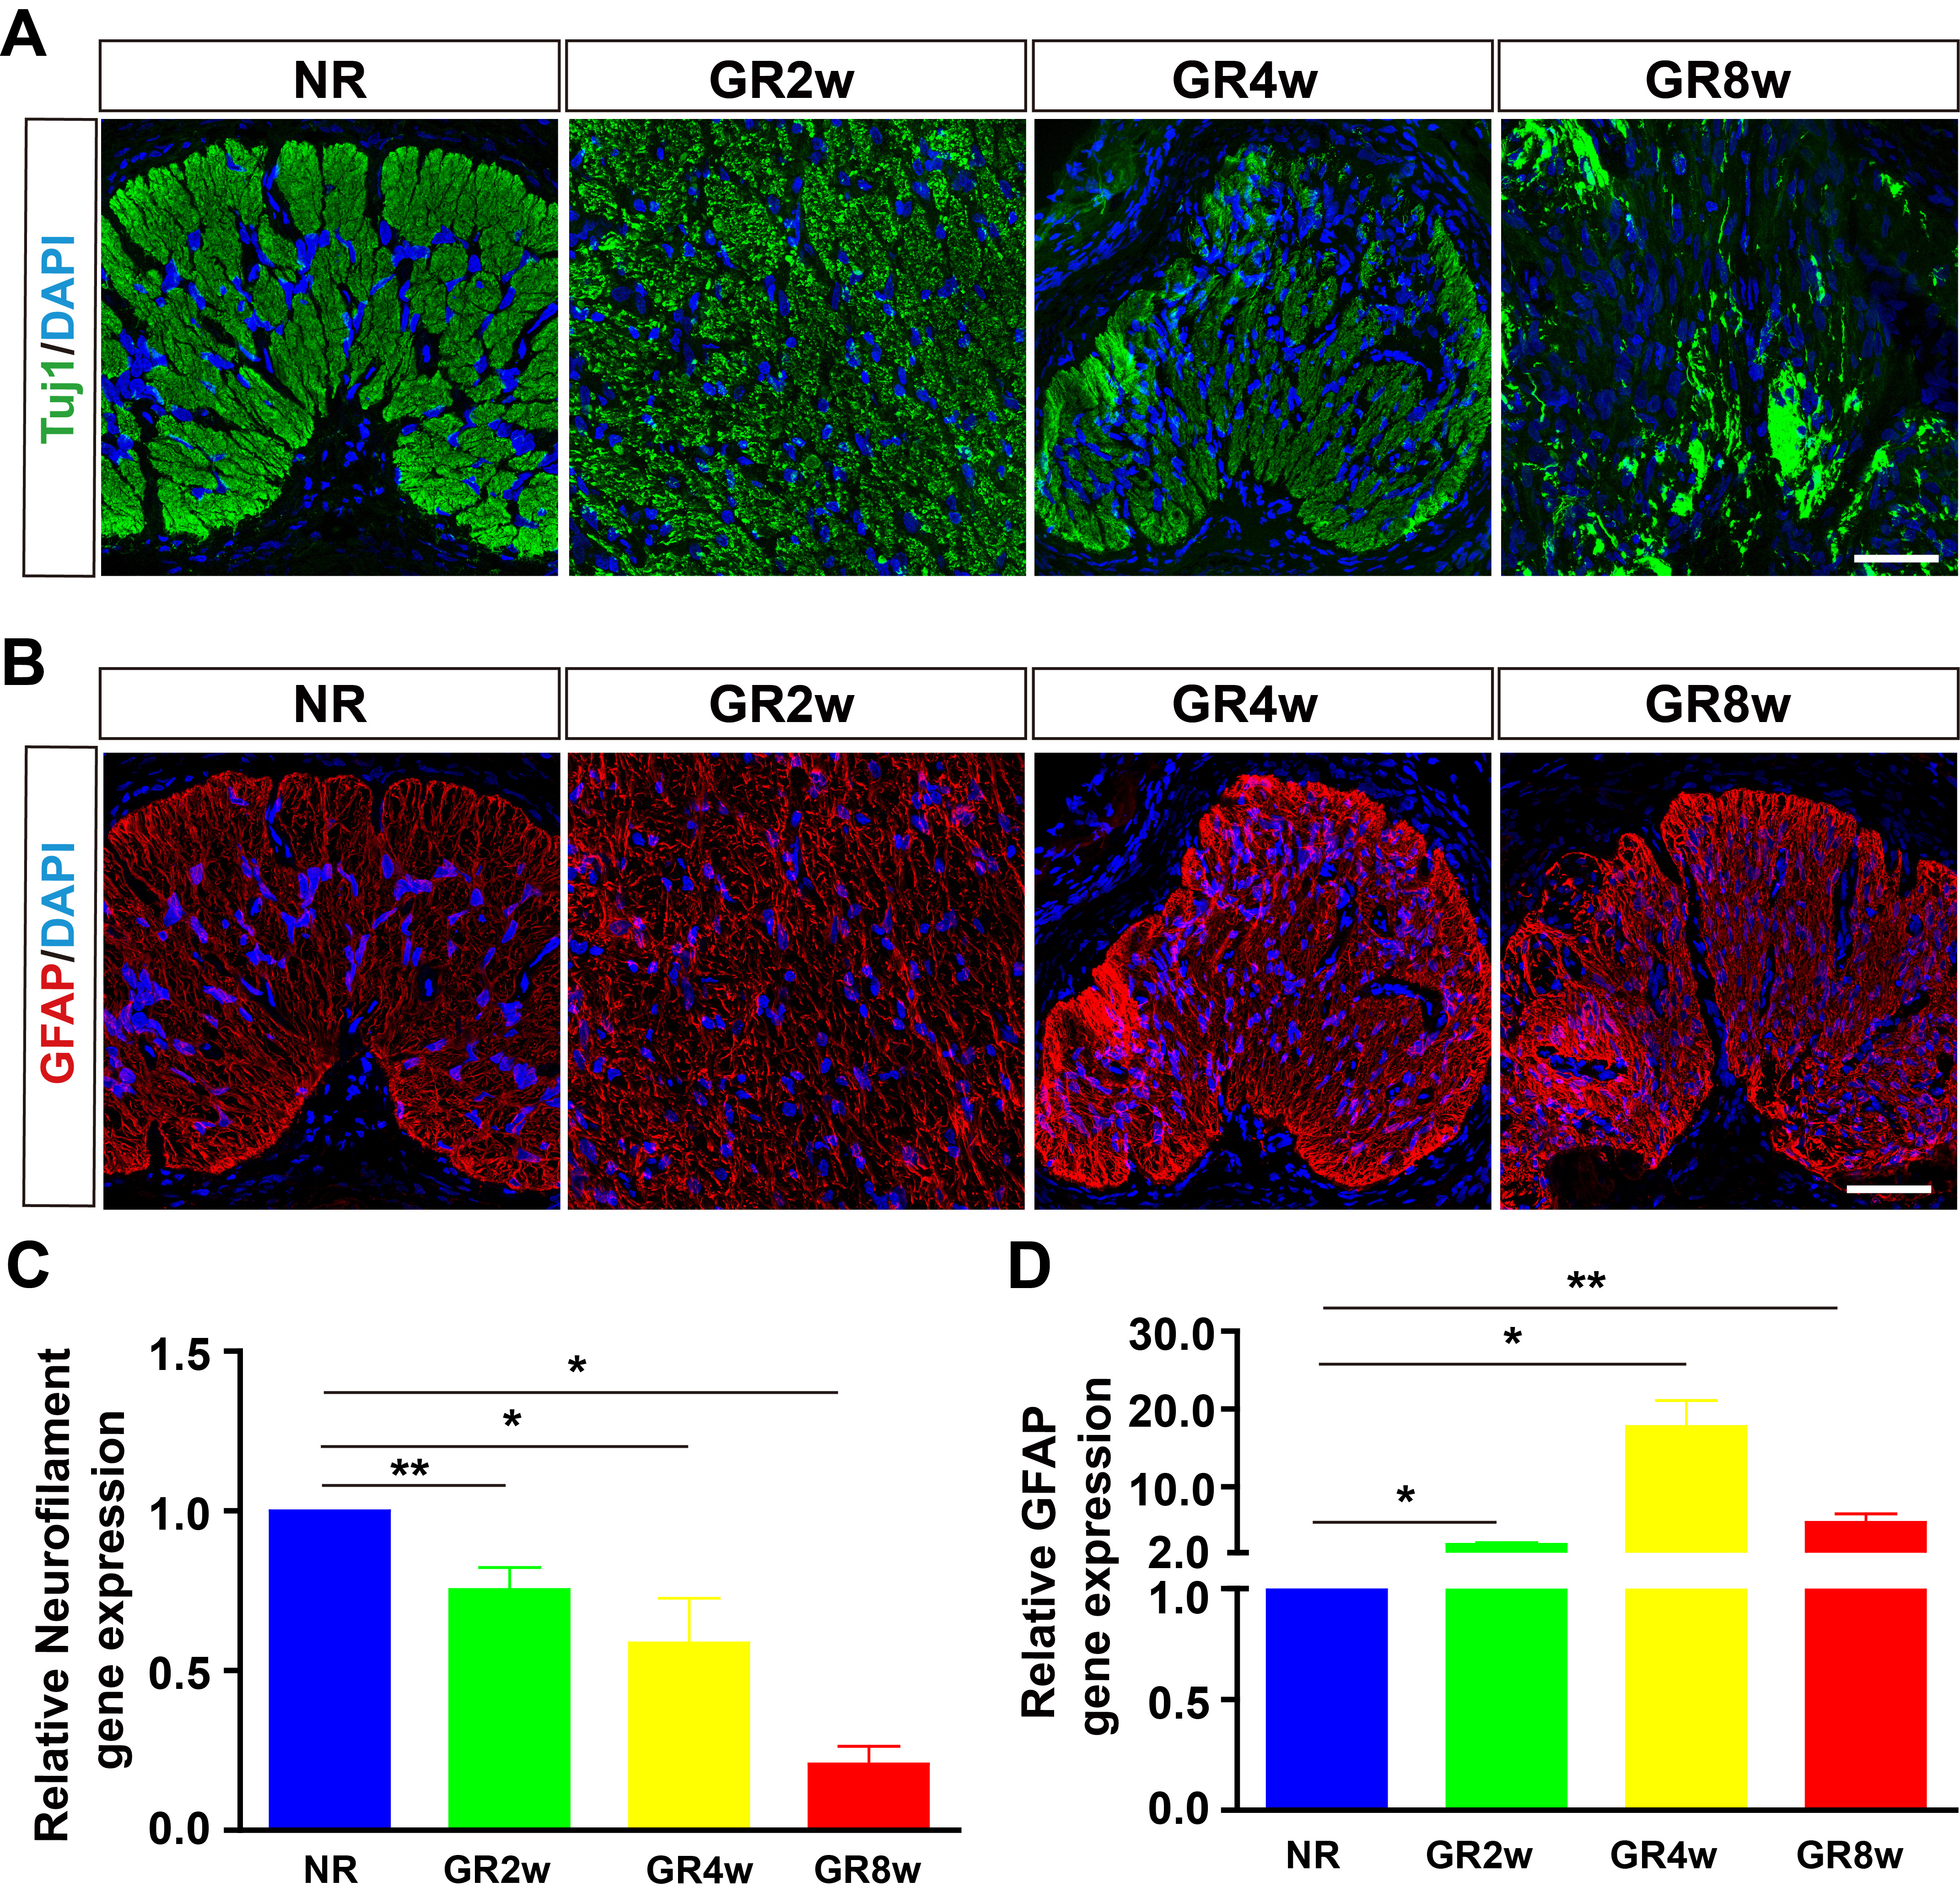 Fig. 2.
Neuronal and glial responses in glaucoma model rats. (A) Tuj1
staining showing the changes of optic nerve axon in glaucoma model rats. (B) GFAP staining showing the gliosis of astrocytes in glaucoma model
rats. (C,D) RT-qPCR analysis showing the relative mRNA expression of
Neurofilament and GFAP (n = 9). *p
OECs were transplanted into subretinal space 2weeks after magnetic microspheres
injection to rescue the elevated IOP-induced optic nerve injury and PBS was used
for control. IOP in OECs and PBS groups declined progressively over time and
there was no statistical difference in IOP between the two groups from 1 week
post-transplantation (wpt) to 7 wpt (Fig. 3A, p
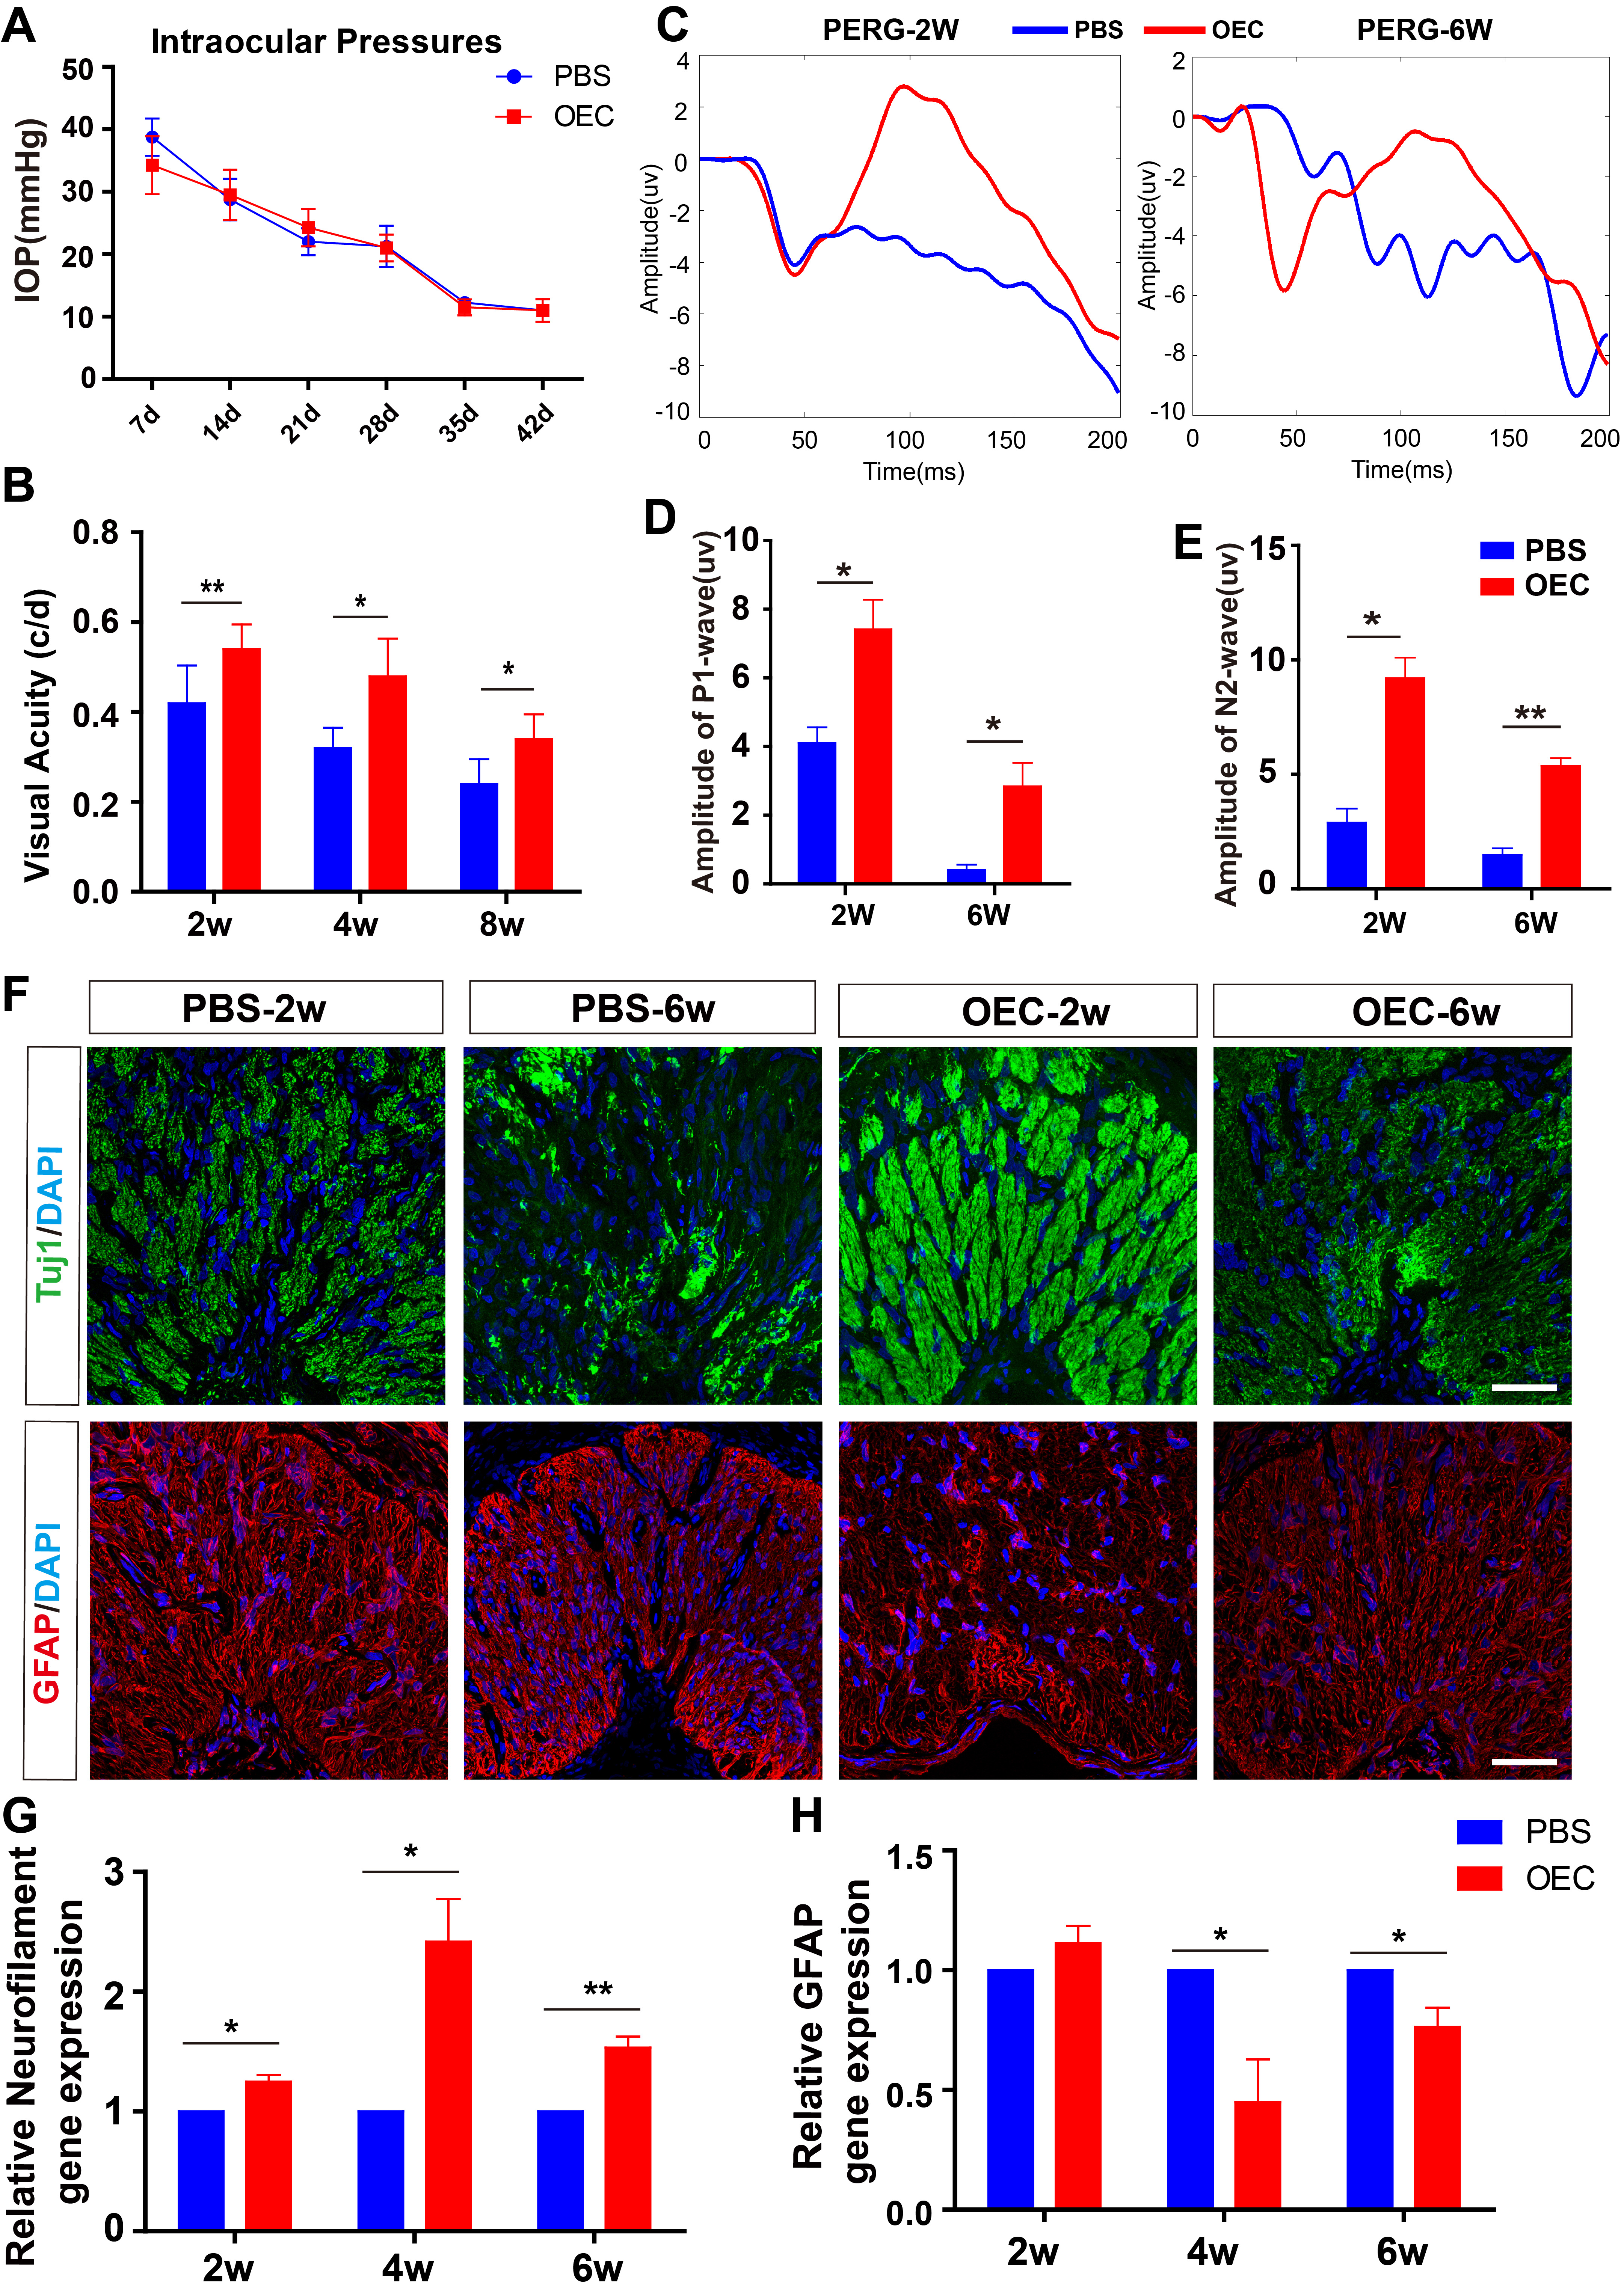 Fig. 3.
OECs transplantation improved the visual functions in glaucoma
models. (A) OECs transplantation decreased the IOP (n = 5). (B)
Optokinetic response test showing OECs improved visual acuity from 2 weeks to 8
weeks post-transplantation (n = 5). (C) Representative PERG traces in
P1-wave of the PBS and OECs groups at 2 and 6 weeks post-transplantation. (D,E)
OECs improved the amplitudes of P1 and N2 wave in glaucoma model (n = 4). (F) Representative images of Tuj1 and GFAP staining in PBS and OECs
groups. (G,H) RT-qPCR analysis showing the relative mRNA expression of
Neurofilament and GFAP in PBS and OECs groups (n = 9). *p
Due to the key role of glutamate in the pathogenesis of glaucoma and the fact
that AC are important regulators of glutamate metabolism, we studied the effects
of OECs on astrocytes in vitro. Firstly, astrocytes isolated from the
optic nerve of neonatal rats were identified by glutamine synthetase (GS)
staining. P4 astrocytes with large and flat cell bodies had many thick processes,
and the positive rate of GS was more than 95% (Fig. 4A). To mimic the glutamate
microenvironment of the optic nerve in glaucoma, astrocytes were treated with
different concentrations of glutamates. Astrocytes survived well and no apoptosis
was observed under 100 mM for 24 h. Under 200 mM glutamate for 6 h, the process
of astrocytes retracted, the cell body was atrophied, and apparent apoptosis was
observed (Fig. 4B), suggesting that 200 mM glutamate could induce astrocytes
apoptosis effectively. Next, RNA was extracted from astrocytes treated with 200
mM for 24 h to detect the changes in gene expression. Apoptosis-related genes
Caspase-3 and Bax were upregulated, while apoptosis inhibitory gene Bcl-2 was
downregulated (Fig. 4C, Caspase-3: p
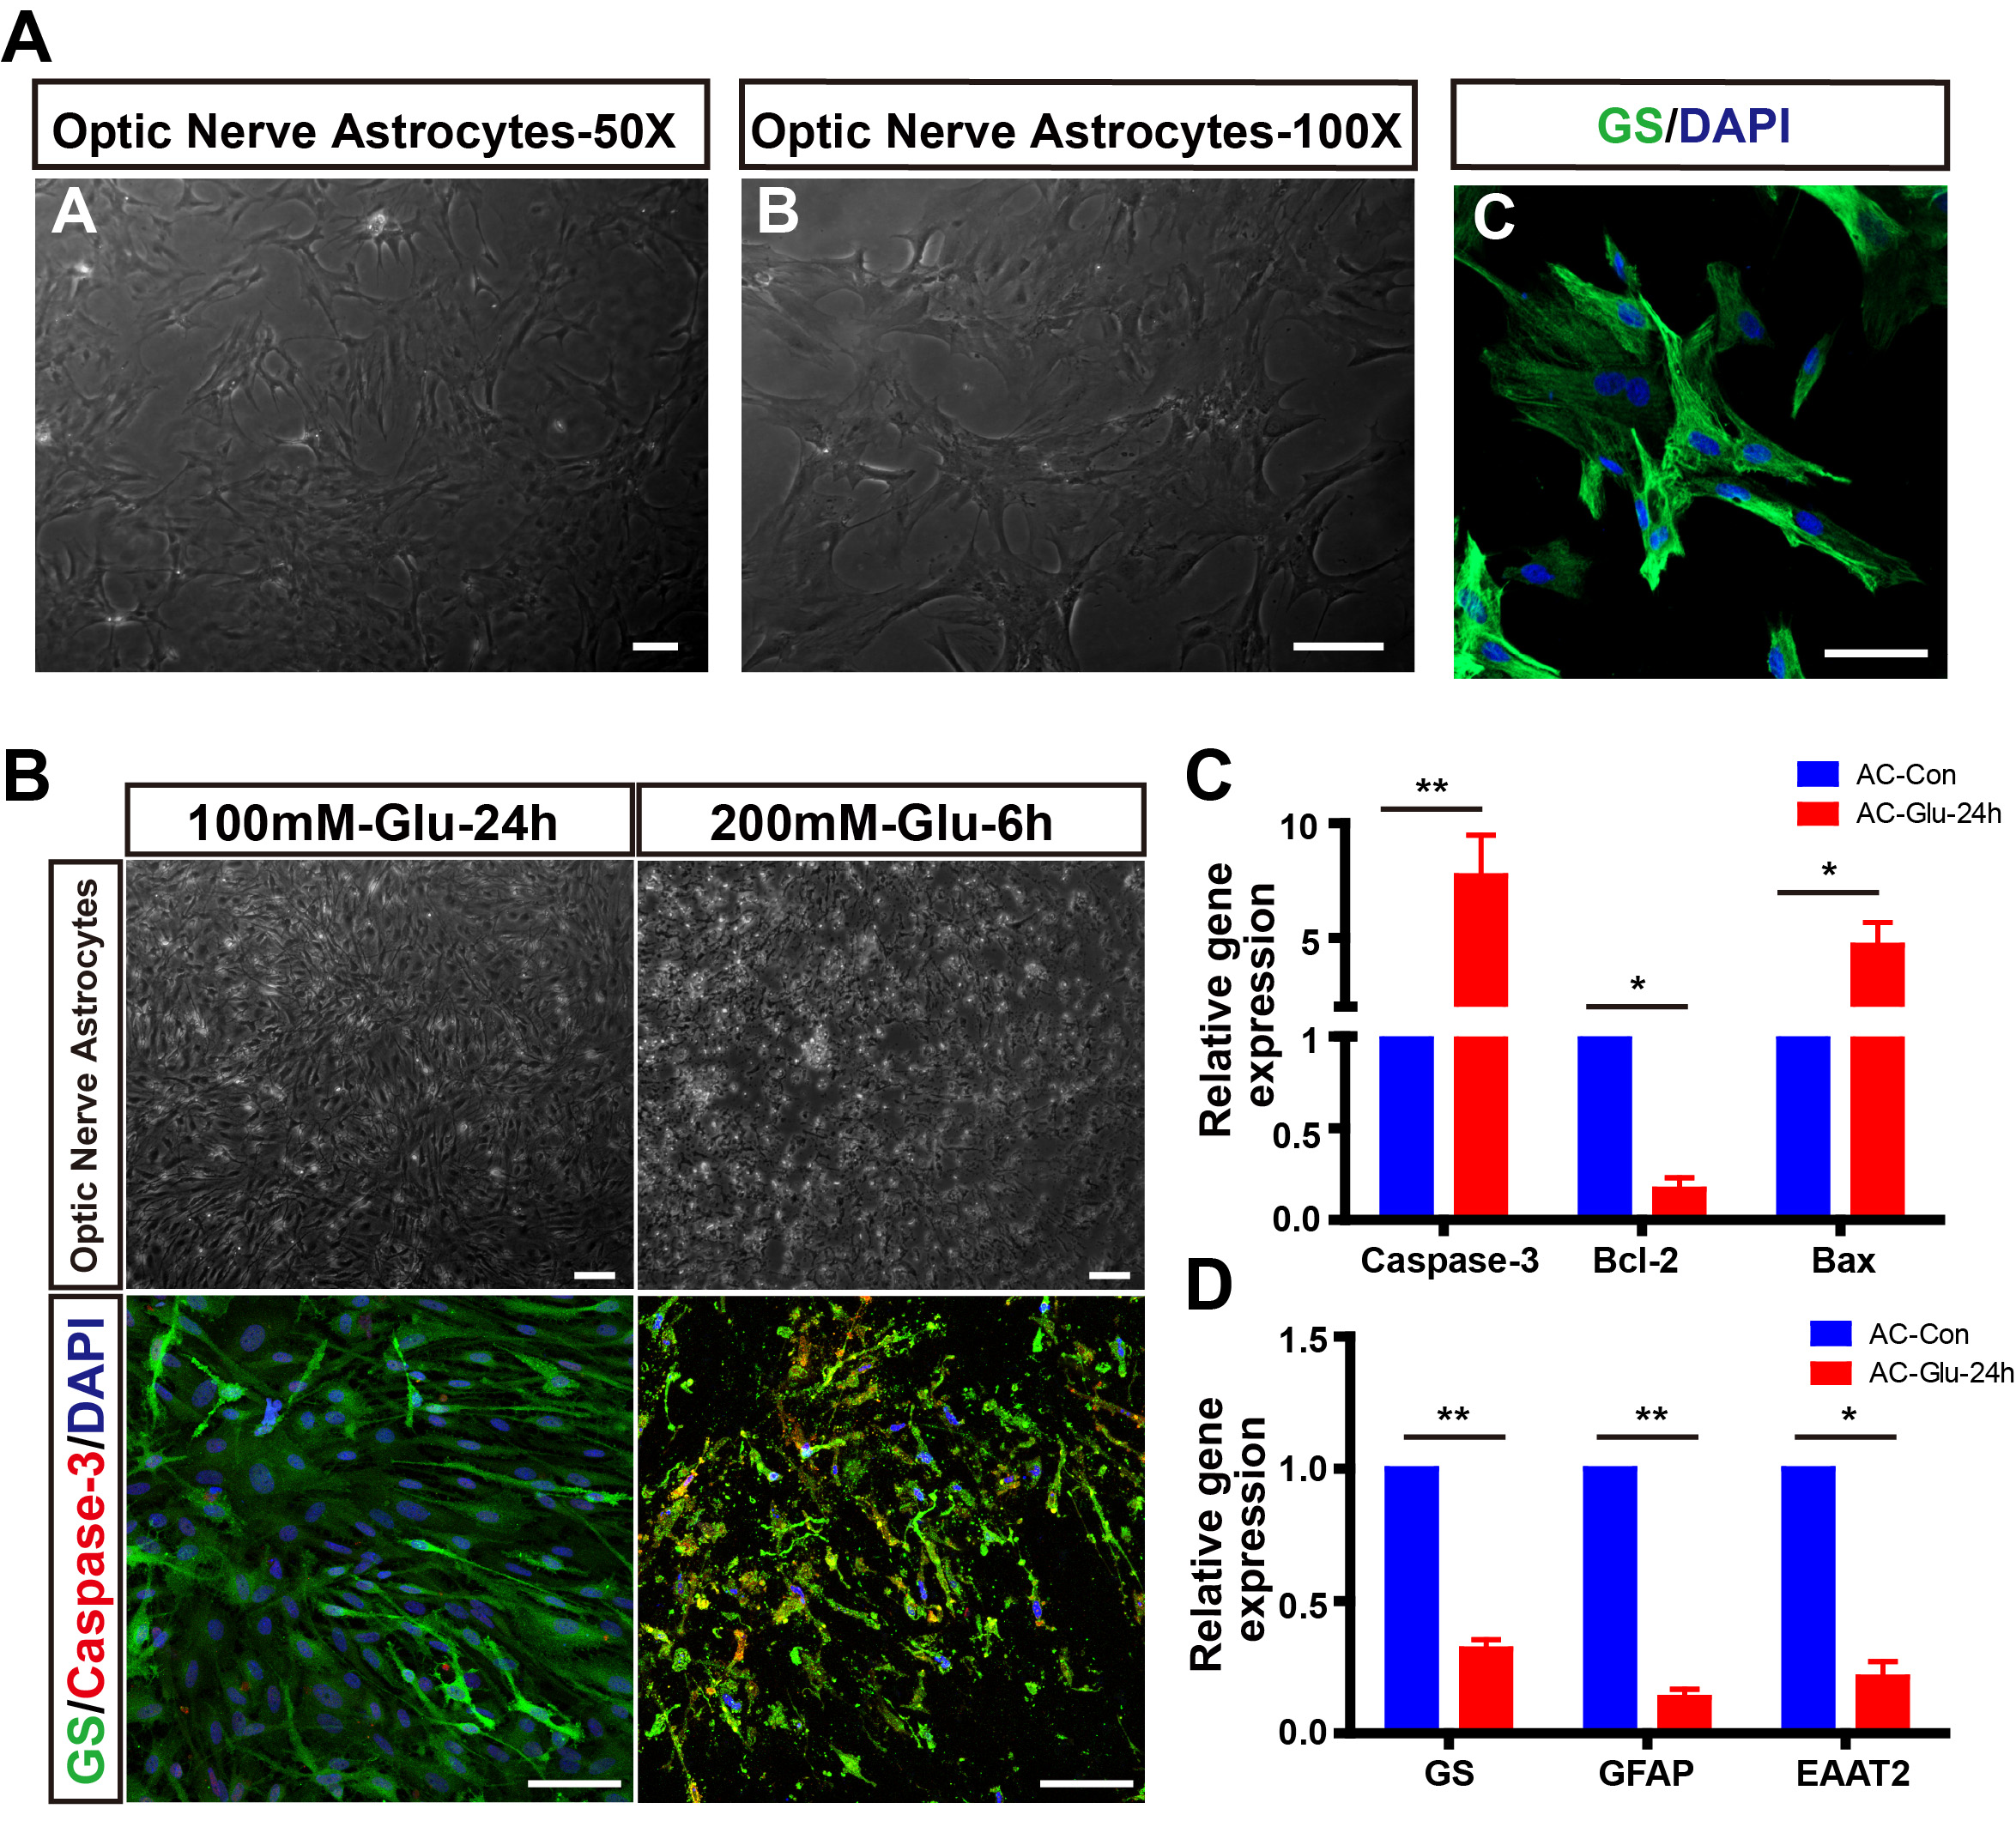 Fig. 4.
Establishment of glutamate-induced astrocytes apoptosis model
in vitro. (A) The isolation and identification of primary astrocytes
from the optic nerve of neonatal rats. (B) Glutamate induced the
apoptosis of astrocytes. (C,D) Relative mRNA expression of GS, GFAP,
EAAT2, Caspase-3, Bcl-2, and Bax in normal and glutamate-treated astrocytes for
24 h (n = 3). *p
Then, co-culturing was used to detect the capacity of OECs to metabolize
glutamate and the effects on astrocytes in the glutamate-induced AC apoptosis
model. In the OECs group, the process of astrocytes retracted and cell body size
increased, suggesting the activation of astrocytes. However, the morphology of
astrocytes was more integral and only a few apoptotic cells were observed
compared control group (Fig. 5A). Co-culturing with OECs upregulated the
expressions of GFAP, GS, and EAAT2 (Fig. 5D, GS: p
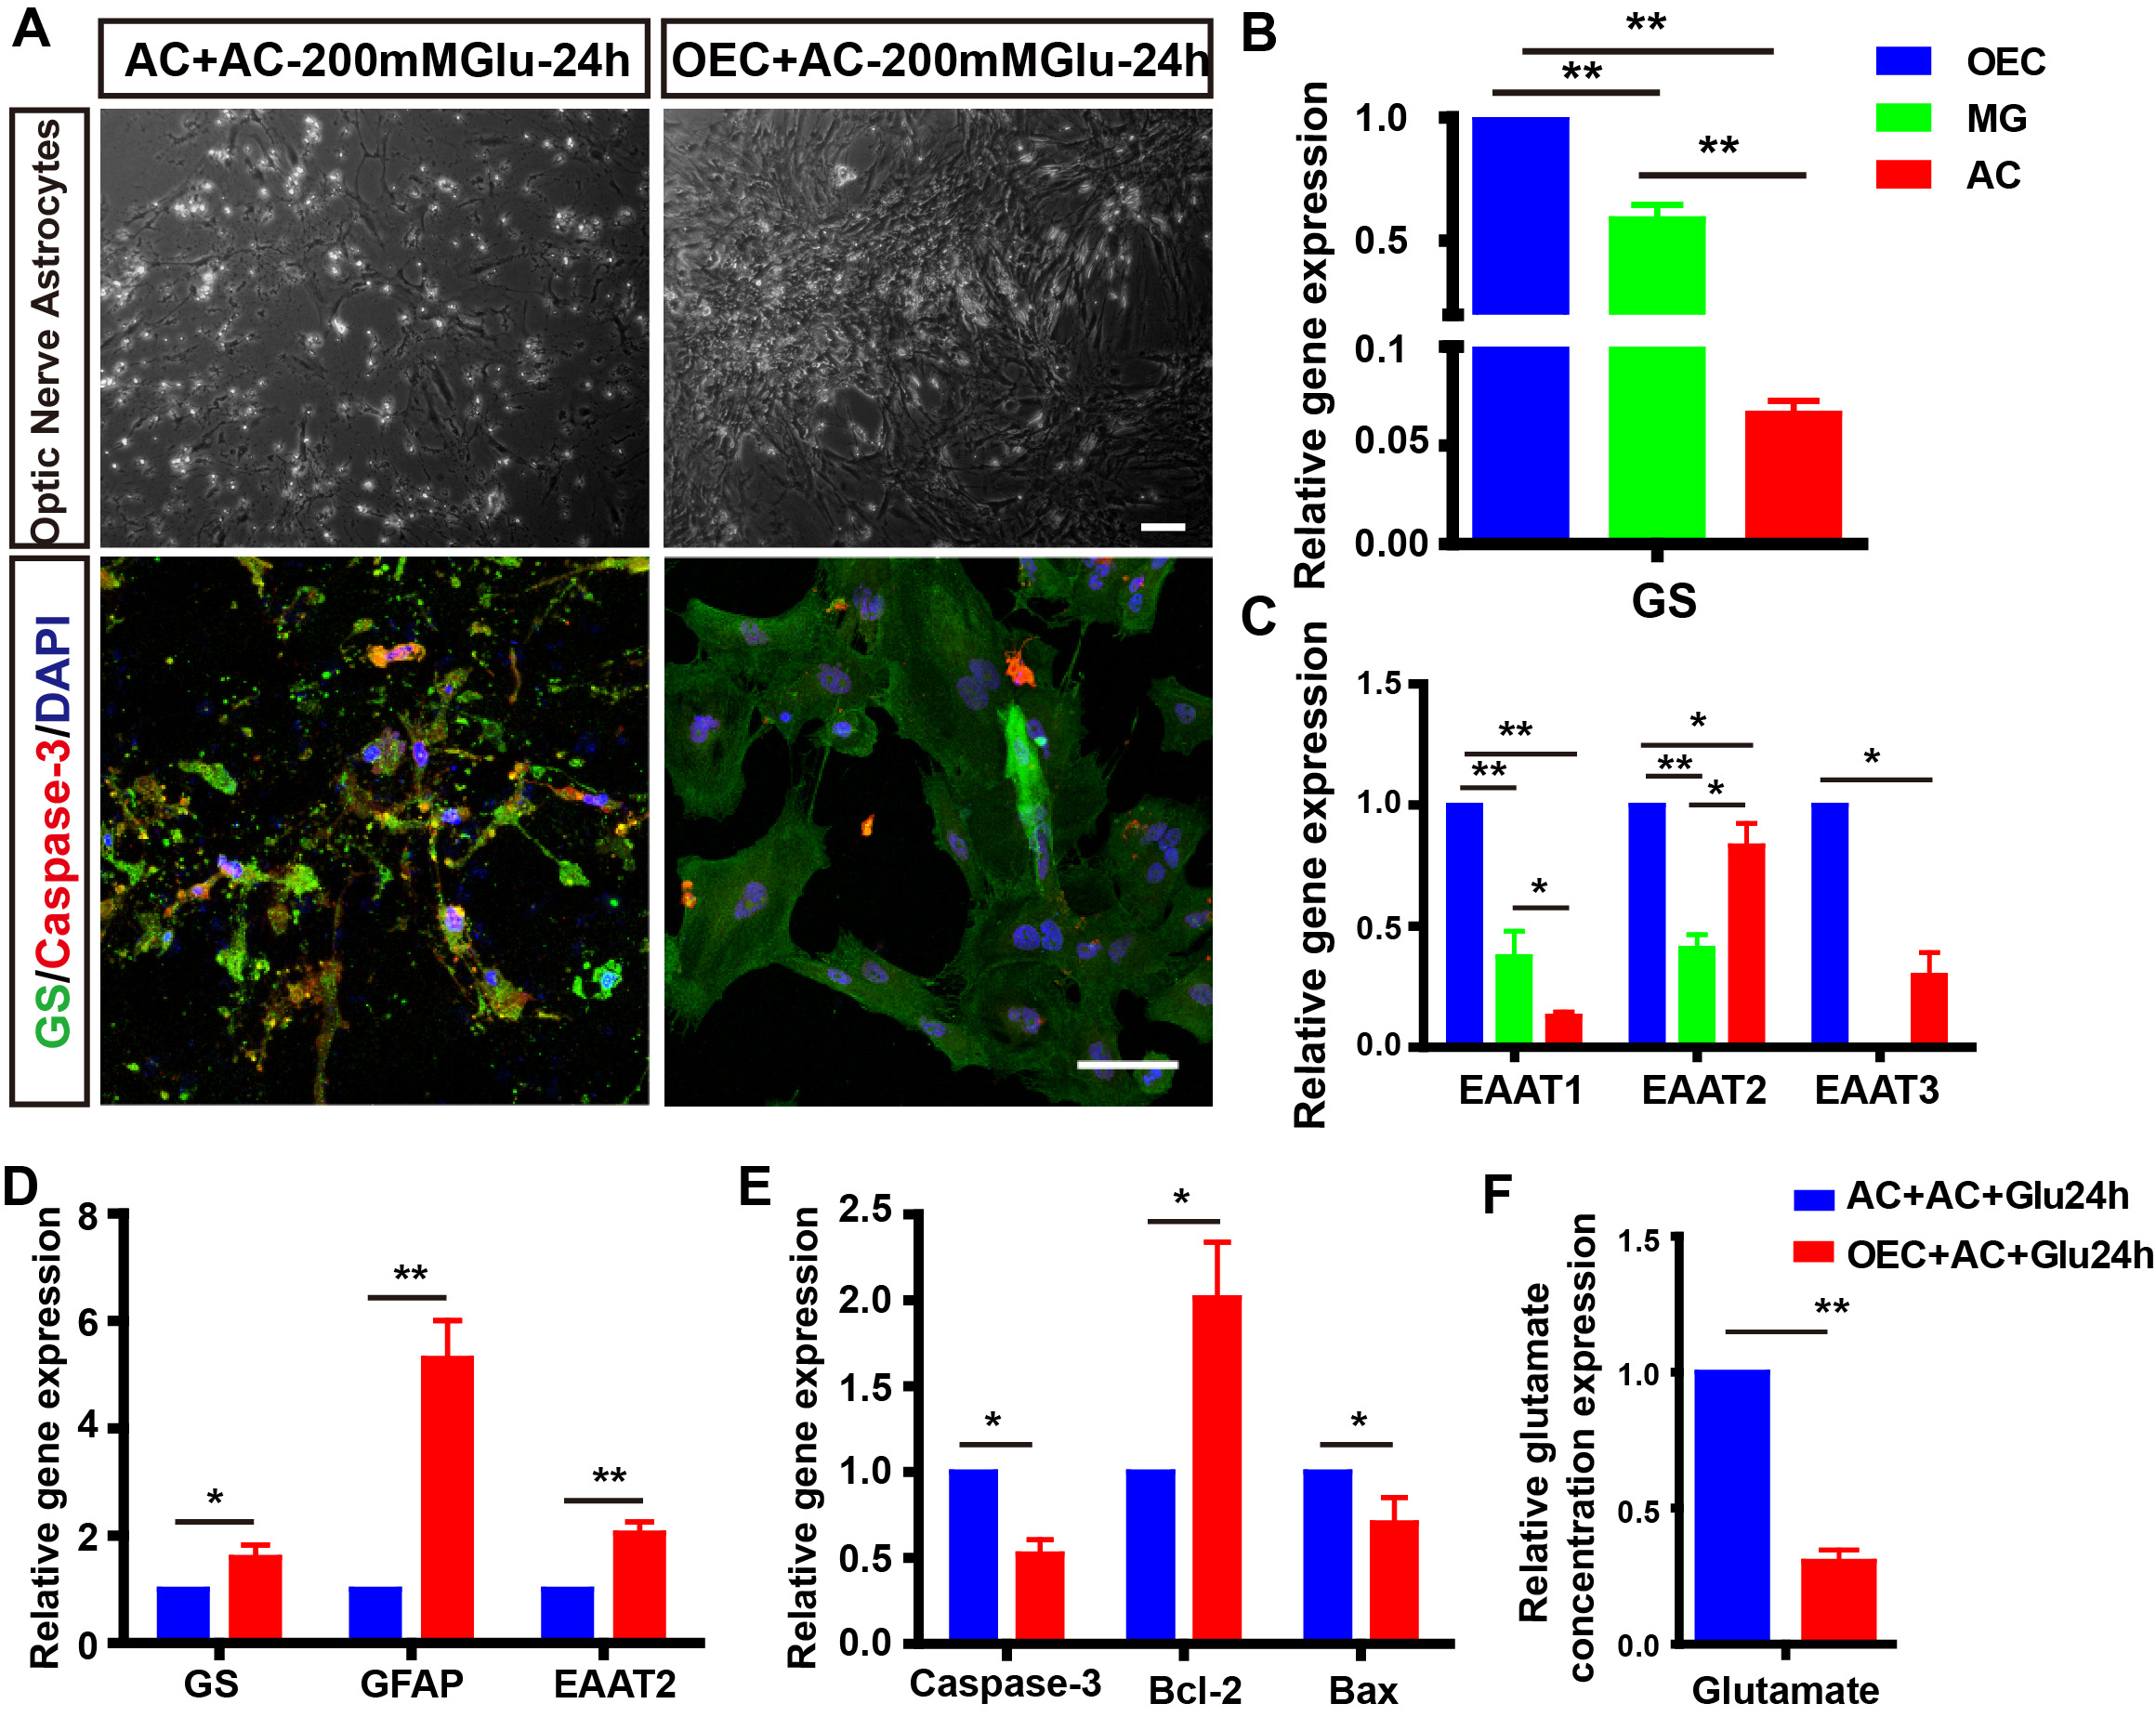 Fig. 5.
Co-culturing with OECs alleviated the glutamate-induced
astrocytes apoptosis and dysfunction. (A) The morphology and Caspase-3 staining
of astrocytes co-cultured with/without OECs for 24 h. (B,C) Relative
mRNA level of GS, EAAT1, EAAT2, EAAT3 in primary OECs, Müller glia, and
astrocytes (n = 3). (D,E) Relative mRNA expression of GS, GFAP, EAAT2,
Caspase-3, Bcl-2, and Bax in astrocytes co-cultured with/without OECs for 24 h (n
= 3). (F) Co-culturing with OECs for 24 h decreased relative glutamate
concentration in the medium (n = 3). *p
To explore the effect of OECs transplantation on glutamate metabolism in the
optic nerve, we first clarified the expression of a gene associated with
glutamate metabolism in the optic nerve and retina of normal rats. Although GFAP
expression in the optic nerve was higher than in the retina, the level of GS and
three glutamate transporters EAAT1, EAAT2, and EAAT3 in the optic nerve were
lower than retina (Fig. 6A,B, GFAP, GS, EAAT1, and EAAT2: p
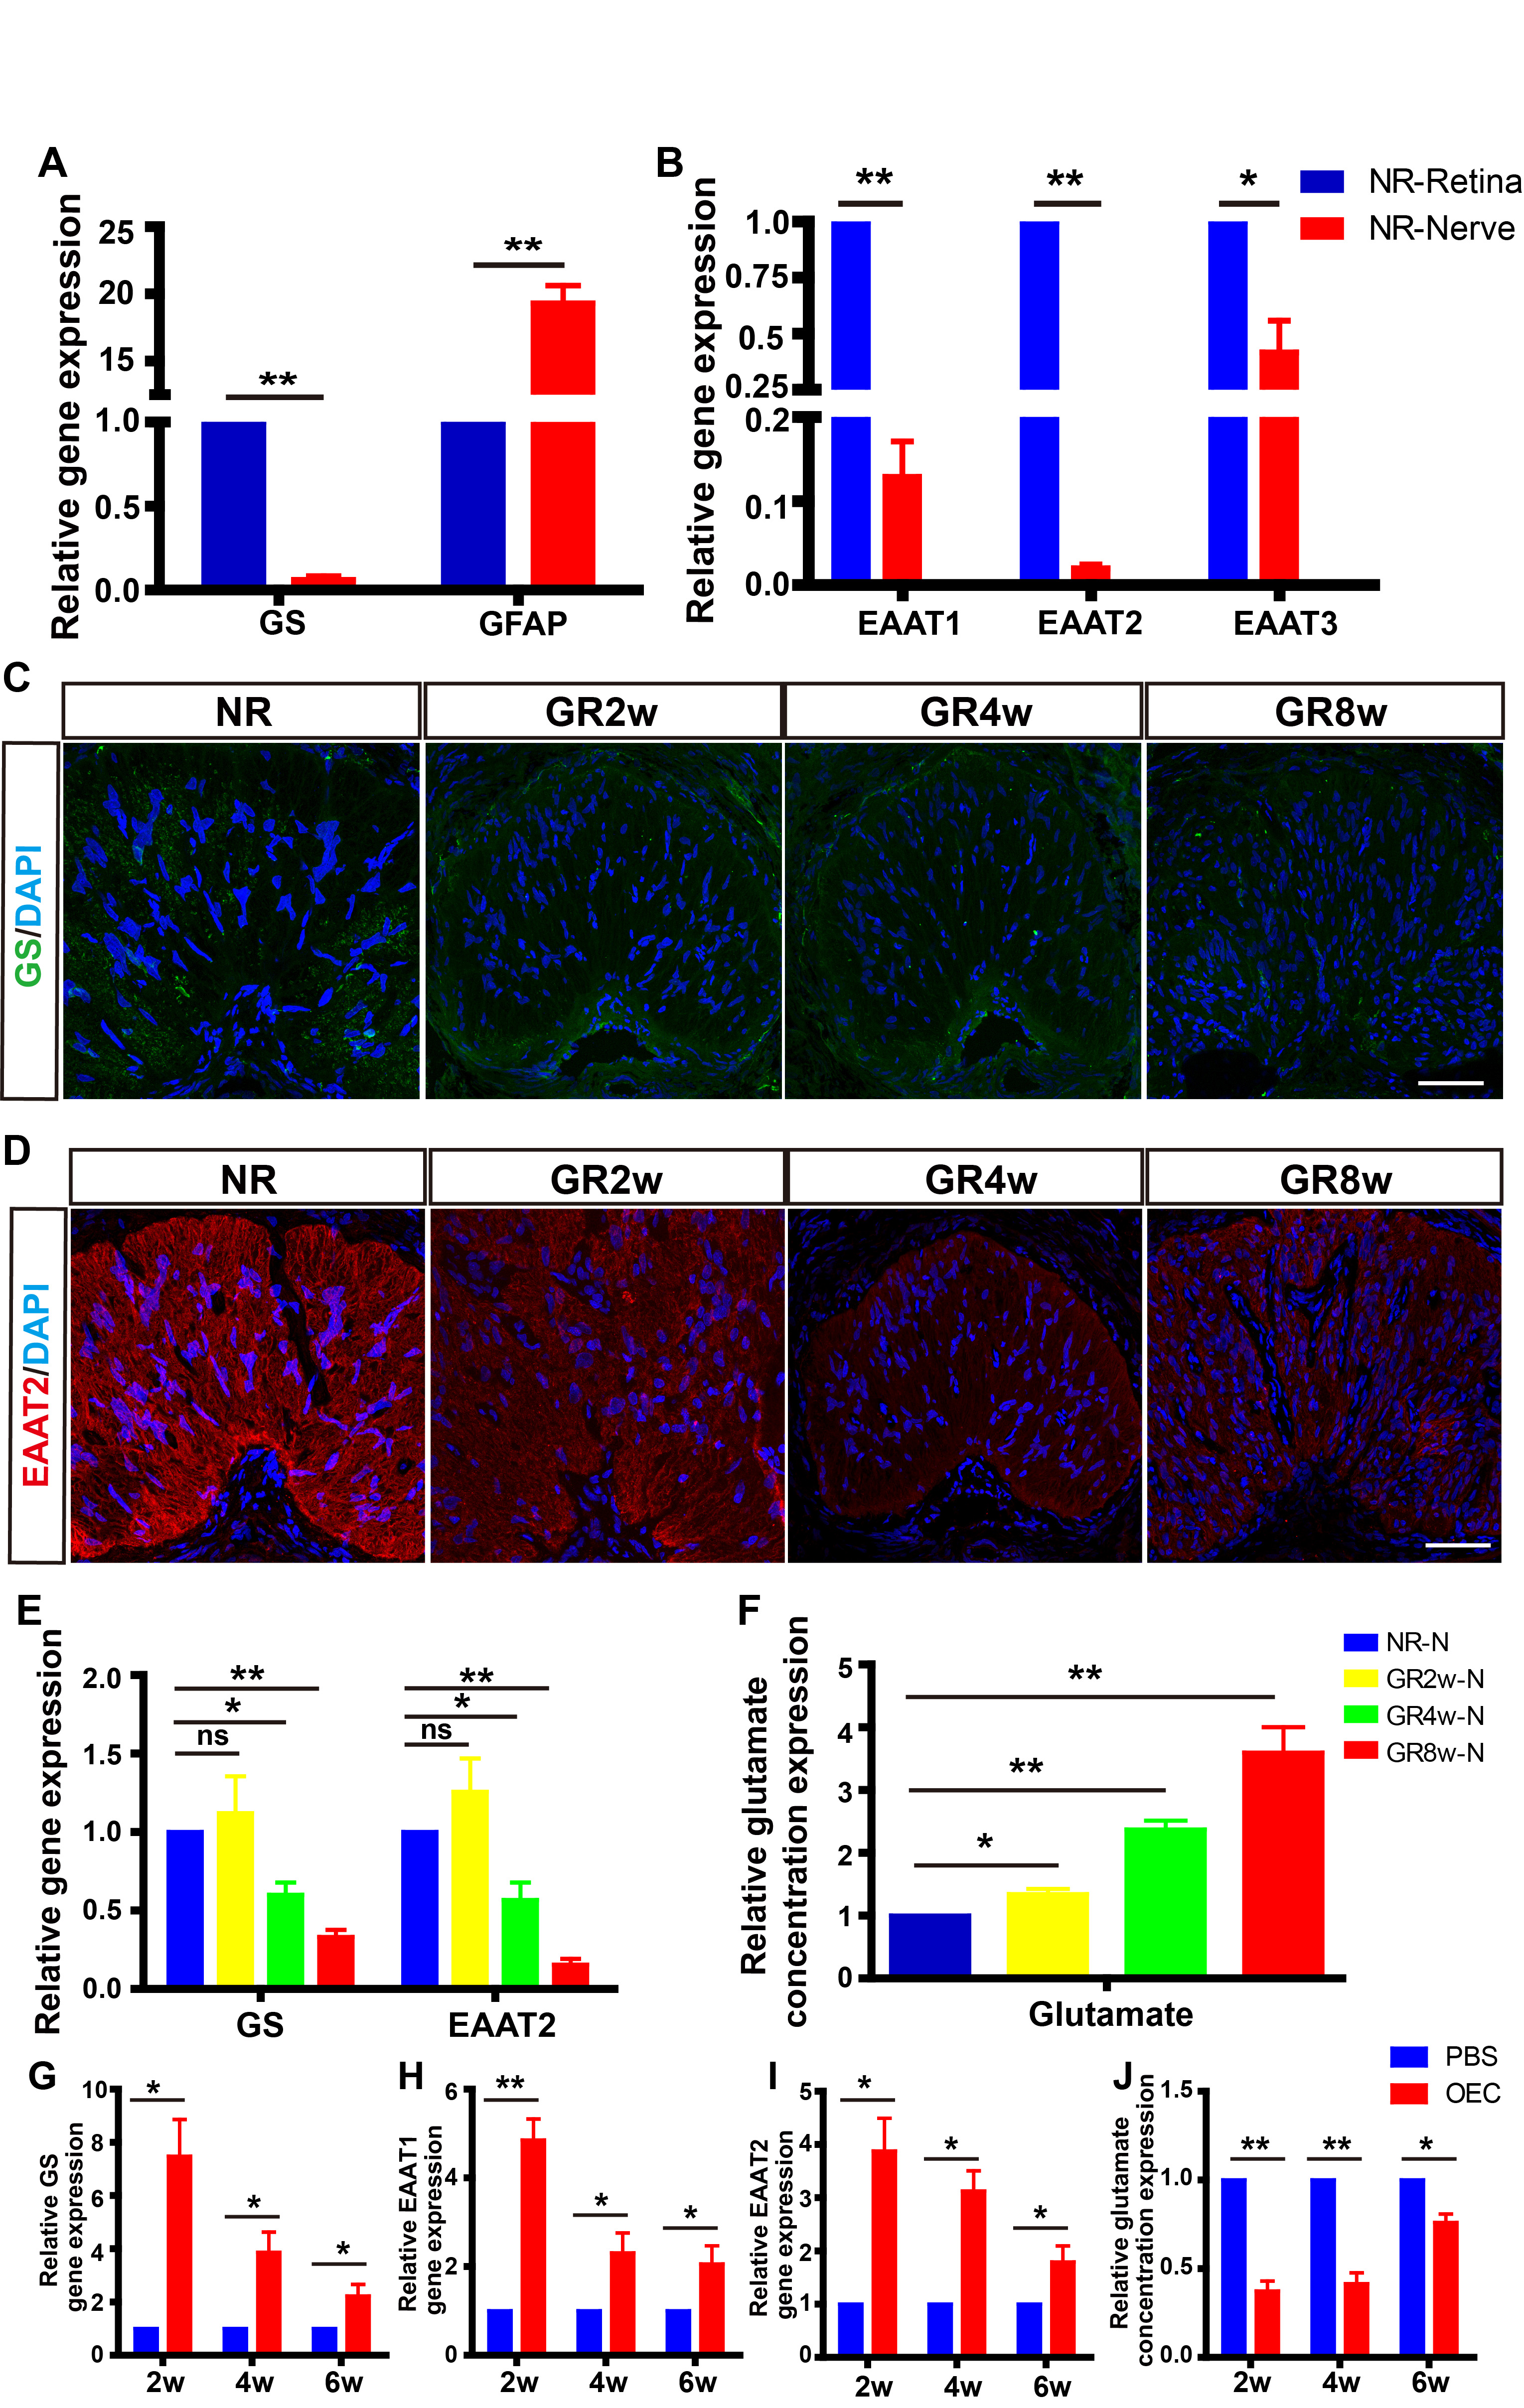 Fig. 6.
 Grafted OECs improved the capacity for glutamate metabolism in
the glaucoma model. (A,B) Relative gene expression of GS, EAAT1, EAAT2, EAAT3 in
the retina and optic nerve of normal rats (n = 9). (C,D) Representative
images of GS and EAAT2 staining in normal and glaucoma model rats at different
timepoints. (E) Relative gene expression of GS, EAAT2 in optic nerve of
normal and glaucoma model rats at different timepoints (n = 9). (F)
Relative glutamate concentration in the optic nerve of normal and glaucoma model
rats at different timepoints (n = 9). (G–I) Relative gene expression of
GS, EAAT1, EAAT2 in optic nerve of PBS and OECs groups at different timepoints (n
= 9). (J) Relative glutamate concentration in the optic nerve of PBS and
OECs groups at different timepoints (n = 9). *p
Following OECs transplantation, the expressions of GS, EAAT1, and EAAT2 in the
optic nerve of glaucoma rats increased significantly compared with the PBS group
at 2 wpt (GS: p
OECs Transplantation is a promising treatment for retinal neurodegenerative diseases, especially for axon injuries like glaucoma [26]. The dysfunction of AC and glutamate-induced neurotoxicity were recognized as the vital causative factors during the pathogenesis of glaucoma [8, 9]. Here, we reported that OECs transplantation improved the glutamate microenvironment, reduced the glutamate-induced damage of AC and RGCs axons, and significantly preserved the visual function of glaucoma model rats at least 8W. Therefore, OEC transplantation is a potential therapeutic strategy for glaucoma.
Establishing a stable, controllable, and easy-to-operate model is necessary for revealing the pathogenesis mechanisms and seeking therapy for glaucoma. In the field of glaucoma research, rats were widely applied for glaucoma model establishment, due to the similarities in anatomy and aqueous humor system to humans [27]. Moreover, the astrocyte gliosis and dysfunction, axon apoptosis, and RGCs apoptosis were similar to pathological features in humans during glaucoma [28]. Injection of magnetic microspheres to block the trabecular meshwork led to a constant IOP increase, which could simulate elevated IOP glaucoma [23]. In the present study, magnetic microspheres suspension was injected into the anterior chamber of rats to establish glaucoma. IOP increased on the first day after the injection, reached a peak value at 1 wpi, decreased slowly from 2 wpi to 6 wpi, and returned to the normal level at 7 wpi. The damage to the axon and gliotic responses were observed from 2 wpi, and the apoptosis of most axons occurred in the optic nerve at 4 and 8 wpi. It showed that the injection of magnetic microspheres could effectively establish an elevated IOP glaucoma model.
Considering that IOP reached peak value and neural injury was initiated at 1 wpi, then axon injury was observed at 2 wpi, we transplanted OECs into the subretinal space of glaucoma rats at 2 wpi. First, we used an optokinetic response test to evaluate the visual acuity of glaucoma after OECs transplantation. Results showed the visual acuity at 4 wpi in the OECs group is equivalent to that at 2 wpi in the PBS group, suggesting that OECs transplantation resulted in the increased visual acuity of glaucoma rats during the critical period of optic neuropathy significantly. Then, PERG was used to detect the functional changes of RGCs. P-ERG consisting of P1 and N2 wave mainly originating from retinal ganglion cells was induced by the stimulation of a checkerboard, grid, or other patterns, which was considered the sensitive indicators for glaucoma diagnosis [29]. The amplitudes of P1 and N2 waves declined constantly in glaucoma rats, and OECs transplantation caused the increased amplitudes of P1 and N2 waves compared with the PBS group, indicating that OECs retarded the aggravation of visual function significantly.
Previous research showed that excessive glutamate led to the activation of astrocytes at the early stage and damage of astrocytes characterized by process retracting, and cytoskeleton depolymerization at the late stage [30, 31]. The astrocyte damage resulted in the exposure, nutrient deprivation, and apoptosis of optic nerve axons [9]. We found that AC wrapping the axon was well-textured and expressed low levels of GFAP, providing nutritional support for the axon of RGCs. The cell body of AC was gradually hypertrophied and the processes were thickened during the progression of glaucoma. The expression of GFAP increased significantly at 4 wpi and decreased at 8 wpi compared with 4 wpi, which was coincident with previous reports [32]. OECs transplantation alleviated the gliotic reactivity of astrocytes by the staining of GFAP. Coherently, the damage to the optic nerve axon was reduced in the OECs group. Hence, OECs transplantation could protect optic nerve axons and AC in glaucoma rats.
Plenty of clinical and preclinical evidence indicated that glutamate-induced neurotoxicity was of the important causes of axon and RGC damage [7, 33]. And regulating glutamate metabolism and suppressing glutamate-induced excitotoxicity contributed to preventing RGC death and retarding the progression of glutamate [6, 33, 34]. It was reported that axons in the optic disc and lamina cribrosa released glutamate in the form of vesicles and activated glutamate receptors in the glaucoma model [6]. However, with the progression of glaucoma, the ability of activated AC to metabolize glutamate decreased due to the weak ability of glutamate metabolism in the optic nerve, and the local glutamate concentration increased. This caused a series of morphological changes and dysfunction in AC, which in turn led to glial and axonal apoptosis [7, 8]. Here, we first treated AC with glutamate to mimic the glutamate-induced AC damage and apoptosis in glaucoma. Following being treated with 200 mM glutamate for 24 h, AC showed, irregular nuclear morphology, a large amount of apoptosis, and genes associated with glutamate metabolisms like GS and EAAT2 were reduced. However, co-culturing with OECs reversed the glutamate-induced excitotoxicity on AC and reduced the relative glutamate concentration partly. According to reports, the high concentration of extracellular glutamate impeded the transporter function, thereby over-activating glutamate receptors, leading to the large influx of calcium, and eventually causing irreversible cell damage [8, 35]. Metabolizing excessive glutamate to reduce glutamate-induced excitotoxicity may be one of the critical mechanisms by which OECs rescued AC. Coherently, we found that OECs possessed the strongest capacity to metabolize glutamate among OECs. Müller glia and AC. Meanwhile, the ability of glutamate metabolism increased, and the glutamate microenvironment was improved in the optic nerve in glaucoma rats after OECs transplantation Interestingly, OECs were applied for the treatment of lots of neurodegenerative disorders, such as spinal cord injury, stroke, Parkinson’s disease that were accompanied by the glutamate-induced excitotoxicity [36, 37]. Our results suggested that the regulation of OECs on glutamate metabolism may play an important role in treating these disorders.
In summary, we demonstrated that OECs could improve the glutamate microenvironment to reduce the excitotoxicity of AC and RGCs axons. And the reduced excitotoxicity on AC rescued the dysfunction and apoptosis of AC, which further contributed to the survival of RGCs axons to protect visual function in glaucoma model rats.
Our results demonstrate that excitotoxicity for RGCs and astrocytes induced by elevated glutamate level is the important pathogenesis of glaucoma. Furthermore, as the pivotal regulator for homeostasis and glutamate metabolism in the optic nerve, the dysfunction of astrocytes will further aggravate the damage to the optic nerve. Account for the outstanding capacity to metabolize glutamate, OECs contribute to the homeostasis of the glutamate microenvironment against the excitotoxicity of glutamate for RGCs. Consequently, OECs transplantation promotes the recovery of visual functions in the glaucoma model. Thus, the strategy of OECs transplantation is promising for glaucoma therapy.
All the data and materials are availability in the main text.
HG carried out the data analysis and wrote the manuscript. SC and LA collected and assembled the data. ZQY conceived and designed the study. JX carried out the data analysis, was responsible for the financial support, interpreted the data. HX conceived and designed the study, carried out the data analysis, interpreted the data, and wrote the final version of the manuscript. All authors contributed to editorial changes in the manuscript. All authors read and approved the final manuscript. All authors have participated sufficiently in the work and agreed to be accountable for all aspects of the work.
All experimental procedures were approved by the Ethics Committee of Southwest Hospital, Army Medical University, in compliance with the statement for the use of animals from the Association for Research in Vision and Ophthalmology (AMUWEC2020610).
Not applicable.
This study is supported by the National Natural Science Foundation of China (NO. 82000921), Natural Science Foundation of Chongqing (NO. cstc2020jcyj-msxmX0981), and Youth Cultivation Project of Army Medical University (NO. 2019XQN09).
The authors declare no conflict of interest.
Publisher’s Note: IMR Press stays neutral with regard to jurisdictional claims in published maps and institutional affiliations.