


 , Jianbo Li 1,*
1 Department of Forensic Medicine, Chongqing Medical University, 400010 Chongqing, China
2 Faculty of Medical Technology, Chongqing Medical and Pharmaceutical College, 401331 Chongqing, China
3 Chongqing Engineering Research Center of Pharmaceutical Sciences, 401331 Chongqing, China
†These authors contributed equally.
Academic Editor: Kuei-Sen Hsu
Abstract
Background: Epilepsy is a disease caused by paroxysmal abnormal
supersynchronous electrical activity of brain neurons, and it is also one of the
most common illnesses in neurology. Among the causes, hippocampal sclerosis may
be one of the main causes of temporal lobe epilepsy. However, the pathogenesis of
hippocampal sclerosis in epilepsy remains unclear. Methods: We
established an epilepsy model by intraperitoneal injection of pentetrazol (PTZ)
into Sprague-Dawley rats, and applied isobaric tags for relative and absolute quantitation (iTRAQ) technology to identify differentially
expressed proteins (DEPs) in the hippocampus. We quantified a total of 3782
proteins. DEPs were defined as proteins with a fold change
Keywords
- epilepsy
- hippocampus
- proteomic
- iTRAQ
- PRM
Epilepsy is a neurological disorder characterized by recurrent and spontaneous seizures due to abnormally excessive or synchronized neuronal activity in the brain [1]. According to the WHO, nearly 50 million people around the world suffer from epilepsy, and the quality of life of these patients is severely affected [2, 3, 4]. Compared to the general population, people with epilepsy are at greater risk of death, and the most common cause of epilepsy-associated deaths is sudden unexpected death in epilepsy (SUDEP) or status epilepticus [5]. Although numerous studies related to epilepsy have been conducted, the pathophysiological mechanism of SUDEP is still unclear [6]. The aetiology of epilepsy is complex and varied, often caused by a combination of predisposing factors, developmental disorders, and external influences [7]. According to some reports, the pathological processes of epilepsy include apoptosis, proliferation, inflammation and the immune response, the pathogenesis of epilepsy has not been fully defined [8, 9]. A misdiagnosis of epilepsy is usually the result of an inadequate medical history and an abnormal EEG, and the lack of the correct treatment often leads to severe clinical outcomes for patients [10]. With the development of reproductive biology techniques over the past few years, the search for reliable biomarkers of epilepsy has become a social concern, and some progress has been made thus far.
The hippocampus is the simplest cortical structure, divided into the CA1, CA2, CA3 and CA4 regions [11]. It is currently believed that the function of the hippocampus is related to memory, and damage to the hippocampus mainly leads to memory impairment, especially short-term memory and spatial memory impairment [12]. According to previous studies, temporal lobe epilepsy (TLE) is generally associated with hippocampal characteristic neuronal degeneration and astrocytosis [13]. James Allebone’s group observed hippocampal atrophy in psychosis of epilepsy [14, 15]. The most common pathological feature of medial temporal lobe epilepsy (MTLE) is hippocampal sclerosis, which has always been a research hotspot in the field of epilepsy [16, 17].
At present, the pathogenesis of epilepsy related to HS is still unclear. In recent years, with the rapid development of molecular biology techniques, isobaric tags for relative and absolute quantitation (iTRAQ) has been developed and is now a mature technique. iTRAQ has become a high-throughput screening technology widely used in quantitative proteomics [18]. We used iTRAQ in this study to confirm differentially expressed proteins (DEPs) in hippocampal tissues of epileptic rat models. Bioinformatics analysis based on the proteomics results of iTRAQ was used to identify proteins involved in the pathogenic mechanism of hippocampal lesions in epilepsy. Four selected altered proteins were verified by parallel reaction monitoring (PRM). The findings will enable us to better understand hippocampal lesions at the after seizures molecular level, and they may provide potential targets for the early clinical diagnosis and treatment of epilepsy, which in turn helps reduce the incidence of SUDEP [19].
Male Sprague-Dawley rats (Specific Pathogen Free, N = 20, 200–250 g) were purchased from the Animal Care and Use Committee of Chongqing Medical University. The animal experiment was approved by the Animal Care and Use Committee of Chongqing Medical University. The animals were randomly divided into epilepsy group and control group, with 10 animals in each group. The epilepsy group received pentatetrazole injections (70 mg/kg, intraperitoneal injection) once every 2 days, a total of 3 times [20]. The control group received the same amount of normal saline. One hour after each injection, two independent experimenters observed and recorded the seizure latency and severity score. The intensity of seizures was assessed by Racine scoring method [21]. During the establishment of the model, all animals in the epilepsy group had three generalized tonic-clonic seizures. All animals were killed one day after the modeling was completed.
The electroencephalogram (EEG) of all rats (N = 20, 10 in each group) was carried out by RM6240C multichannel physiological signal acquisition and processing system (Chengdu Instrument Factory, Chengdu, Sichuan, China), and the results were analyzed [22, 23].
All animals were anaesthetized with pentobarbital (1%, 10 mL/100 g, intraperitoneal injection). After achieving anaesthesia, the animals were sacrificed by cervical dislocation, their cranial cavities were opened and the whole brains were quickly collected. At the same time, the brains were rinsed with normal saline. Then, the hippocampal tissues were rapidly isolated (the whole process was operated on ice), the 6 hippocampal samples in each group were stored at –80 °C for subsequent protein extraction, and the remaining hippocampal samples were fixed for subsequent histopathological studies to assess hippocampal morphology.
The fixed hippocampus samples (N = 8, 4 in each group) were sliced into 4
The hippocampal samples (N = 6, 3 in each group) were ground in liquid nitrogen
and incubated in lysis buffer for 5 minutes. Then, 10 mM DL-Dithiothreitol (DTT) was added to each
sample, sonicated on ice for 10 minutes, and then centrifuged at 4 °C, 13000 rpm
for 20 minutes. 4 volumes of pre-cooled acetone were added to the supernatant and
placed at –20 °C for 2 hours. The mixture was then centrifuged, air-dried and
resuspended in 8 M urea/100 mM Tetraethylammonium bromide (TEAB) (pH 8.0). The protein samples were added with
10 mM DTT at 56 °C and placed for 30 min, and then added with 50 mM iodoacetamide
and stood in the dark for 30 min at room temperature. Pre-cooled acetone was
added for washing and then suspended again. Then, Bradford method is applied to
measure the total protein concentration. Next, 100
Samples were labeled according to the manufacturer’s instructions (AB Sciex, Framingham, MA, USA) prior to detection, and all labelled samples were mixed equally. Then the labeled samples were fractionated at high pH using high performance liquid chromatography (HPLC) system (Thermo DINOEX Ultimate 3000 BioRS, AB SCIEX, Framingham, MA, USA). The collected fractions were vacuum-dried and centrifuged. Finally, the polypeptide samples were analyzed by TripleTOF 5600plus mass spectrometer coupled with the Eksigent nanoLC System (AB SCIEX, Framingham, MA, USA).
The Proteomics data were obtained by Analyst QS 1.1 software (MDS Sciex,
Toronto, Ontario, Canada). ABI ProteinPilot 4.0 software (AB SCIEX, Framingham, MA, USA) was used for
protein identification and quantification [24, 25]. The relative protein
expression of epilepsy group and control group was compared, and the fold changes
(FCs) of the two groups were calculated. Among them, proteins with an FC
To further verify the expression of the DEPs, we further quantified the expression levels of the 4 selected proteins by PRM analysis using the remaining cryopreserved hippocampus samples (N = 6, 3 in each group). The method of protein extraction and trypsin digestion was the same as iTRAQ experiment, then peptide samples were analyzed using TripleTOF 5600+ mass spectrometry combined with Eksigent microLC system (AB SCIEX, Framingham, MA, USA). The obtained MS/MS data were processed using ProteinpilotTM V4.5 search engine, then processed with Skyline software to obtain PRM spectrum files and the quantitative information of proteins.
The proteomic data based on iTRAQ analysis were obtained using the Analyst QS
1.1 software system (AB SCIEX, Framingham, MA, USA). The identification and quantitative information of protein
was obtained using ProteinPilot 4.0 software system, which used the Paragon
database for peptide identification. The mass spectrometry proteomics data have
been deposited to the ProteomeXchange Consortium via the PRIDE [29] partner
repository with the dataset identifier PXD035226. Quantitative data were compared
between the two groups by student’s t-test, and Q value
(p-adjusted)
HE staining showed that in the epilepsy group, the pyramidal cells in the hippocampus were reduced in number and disordered, the morphology was fusiform, the cell bodies were obviously constricted, and the staining was deep. In contrast, in the control group hippocampi, pyramidal cells and their apical dendrites were arranged neatly and densely, the nuclei were large and round, the nucleoli were clear, the cells were arranged regularly, and the structures were complete (Fig. 1).
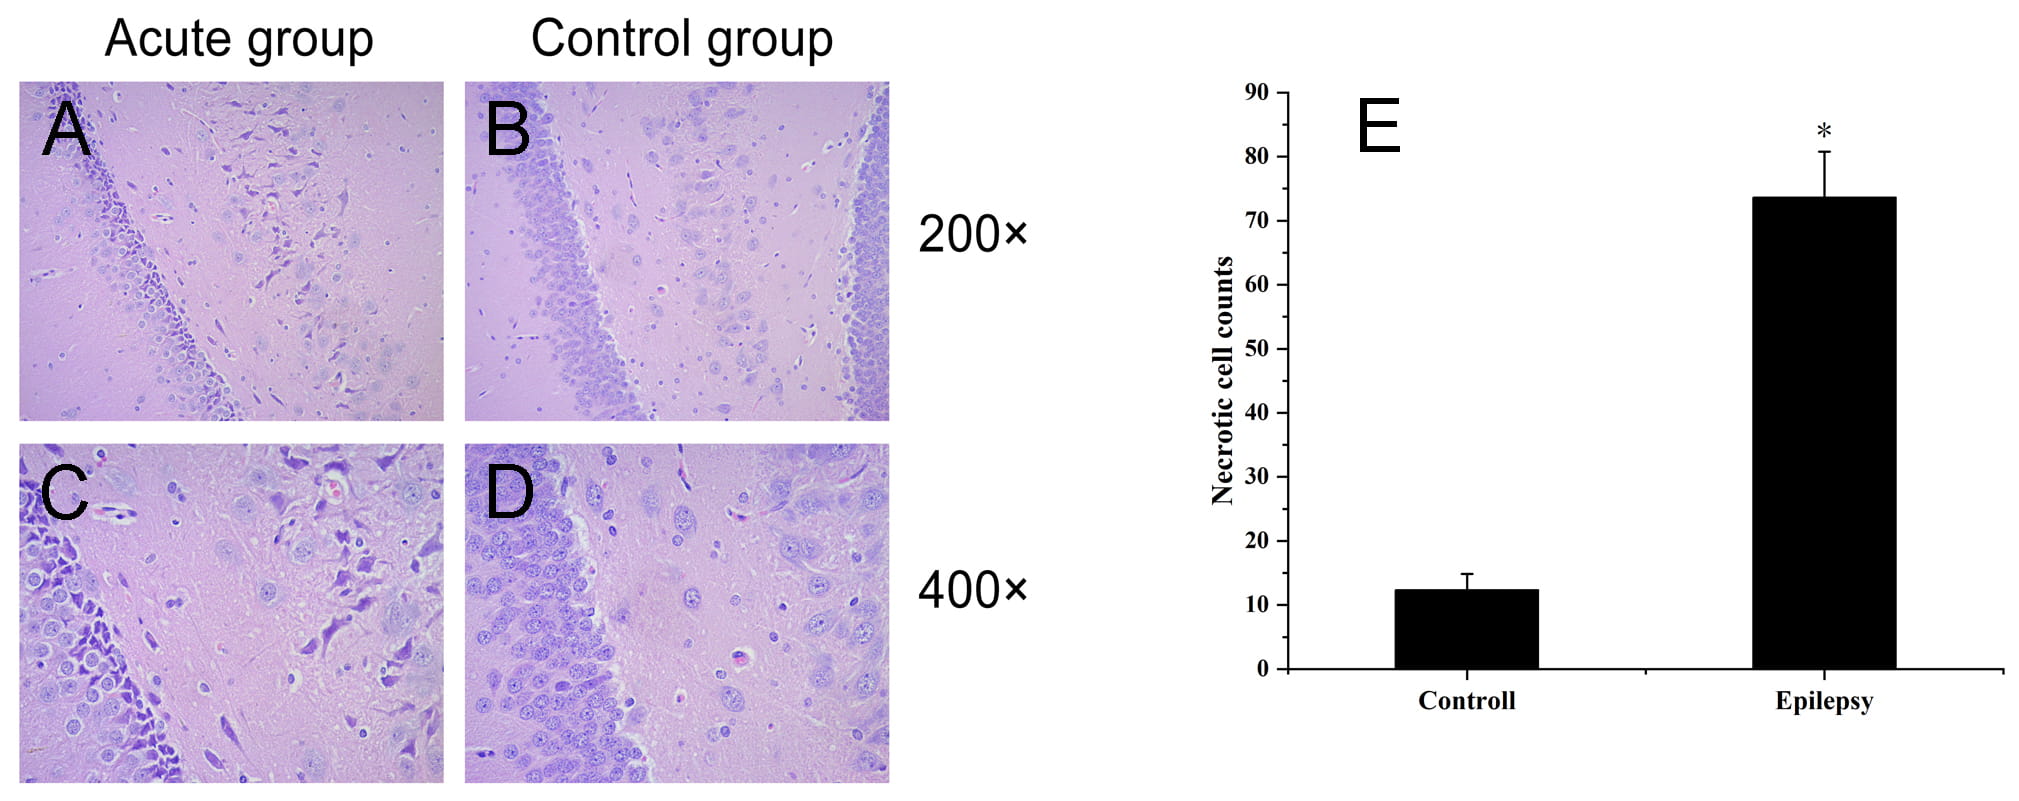 Fig. 1.
Histopathological observation of hippocampal tissue in
epilepsy group and control group. (A,C) Epilepsy group; (B,D) control group.
Morphological changes in hippocampal neurons were observed by HE staining. (A,C)
Hippocampal neuronal necrosis and glial cell hyperplasia in the epilepsy group.
(B,D) Normal hippocampal tissue in the control group. (E) The number of necrotic
cells was counted, “*” indicates p
The EEG results indicated that all animals in the epilepsy groups had
epileptiform discharges and obvious paroxysmal rhythms; that the wave amplitude
gradually increased; and that the epileptic waves included significant paroxysmal
spikes, sharp waves, sharp slow complex waves, and spike slow complex waves. and
No EEG epileptic activity was recorded in the controls. The EEG readings of
normal rats exhibited mainly alpha waves with a frequency of 7–9 Hz and an
amplitude of
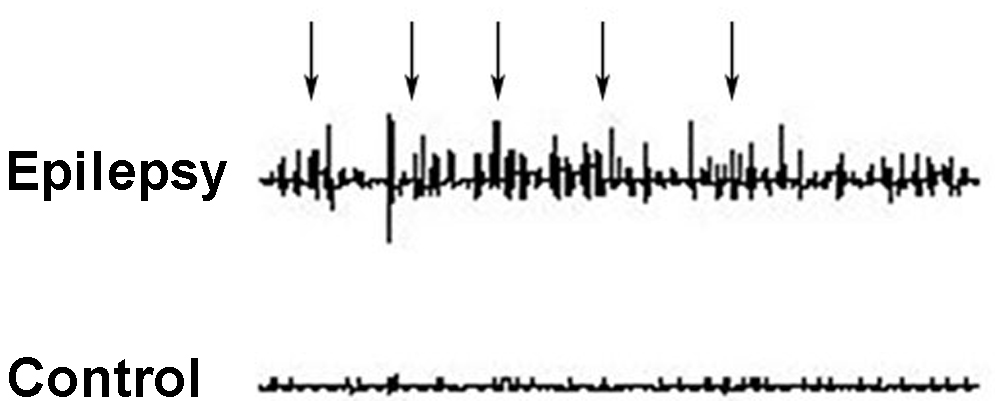 Fig. 2.
Representative EEG recordings from the prefrontal cortices of rats in the epilepsy and control groups. Epileptic waves were recorded in the epilepsy group (arrows), while no abnormal waveform was observed in the control group.
Three hippocampal samples from each group were randomly selected for iTRAQ-based
proteomics analysis to obtain differentially expressed proteins. In total, 3782
proteins were quantified. The detailed data were provided in the supplementary material. For each comparison, the proteins with FC
 Fig. 3.
PPI networks of DEPs in hippocampal tissues. The colour and size of the node represent its contribution to the network (a larger node indicates a stronger contribution to the network), and the colour and thickness of the edge represent the type and intensity of the node interaction (a thicker edge indicates a stronger interaction between nodes). Subsequently validated proteins were shown in bold font.
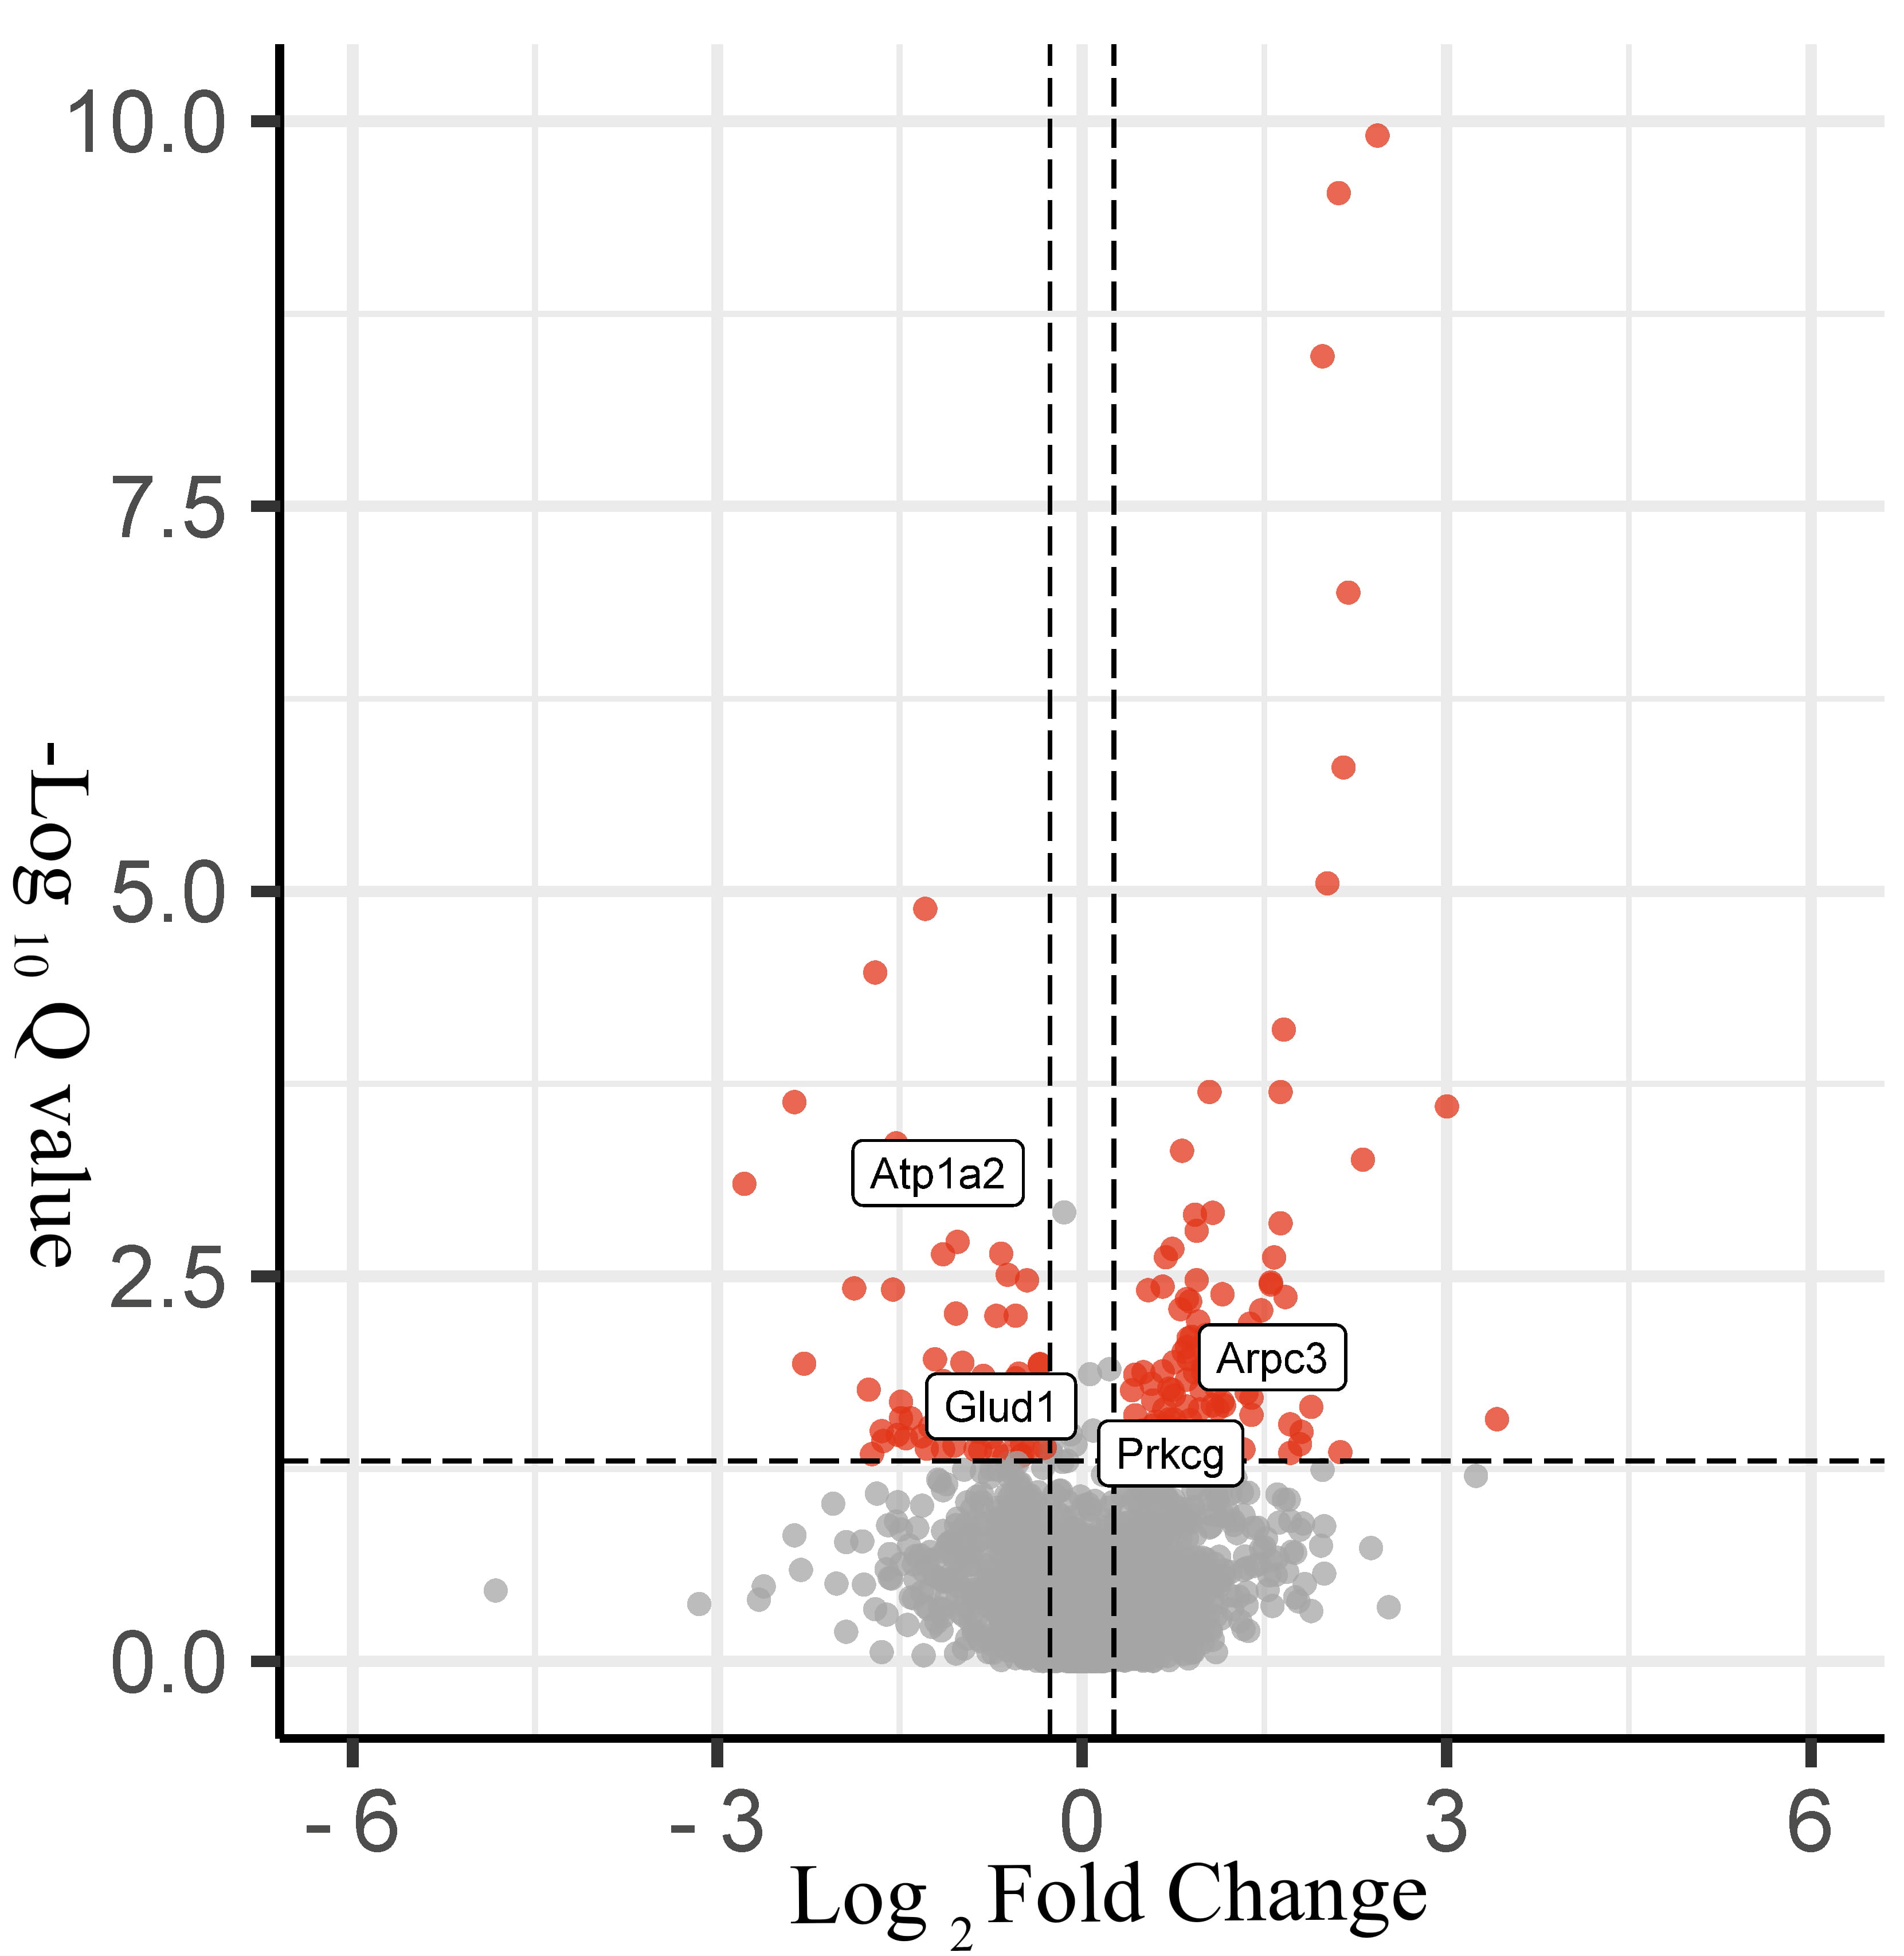 Fig. 4.
Volcano plot of protein changes in hippocampal tissues in the epilepsy and control groups. Black represents nondifferentiated proteins, DEPs are represented in red (170 proteins).
The screened DEPs were subjected to GO functional annotation using the DAVID
(https://david.ncifcrf.gov) website. Based on the criterion of a corrected
Q value
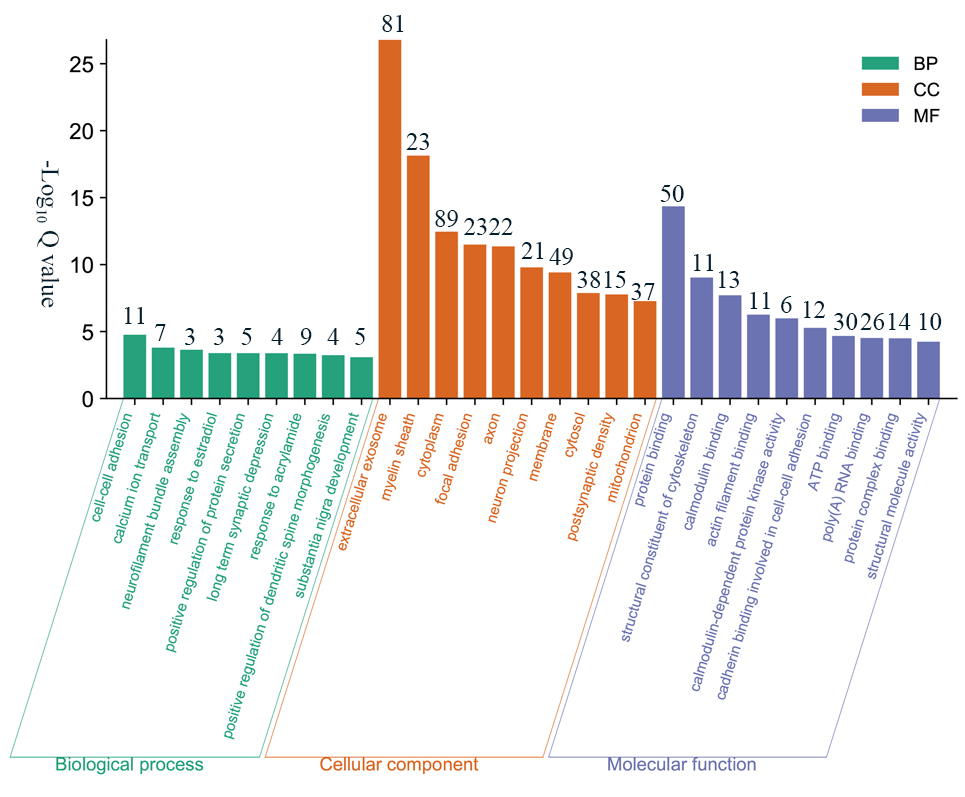 Fig. 5.
GO analysis of 170 DEPs. The figure including biological process, cellular component and molecular function terms, shown in green, orange and purple, respectively. The numbers above the histogram represent the number of genes it contains.
KEGG pathway enrichment analysis of the DEPs with Fisher’s exact test revealed that DEPs were involved in important pathways, such as gastric acid secretion, long-term potentiation, the calcium signalling pathway, the oxytocin signalling pathway, aldosterone synthesis and secretion, carbon metabolism, dopaminergic synapse-related pathways, and biosynthesis of antibiotics (Fig. 6). These pathways were mostly closely related to nerve conduction, energy metabolism, immunity and stress.
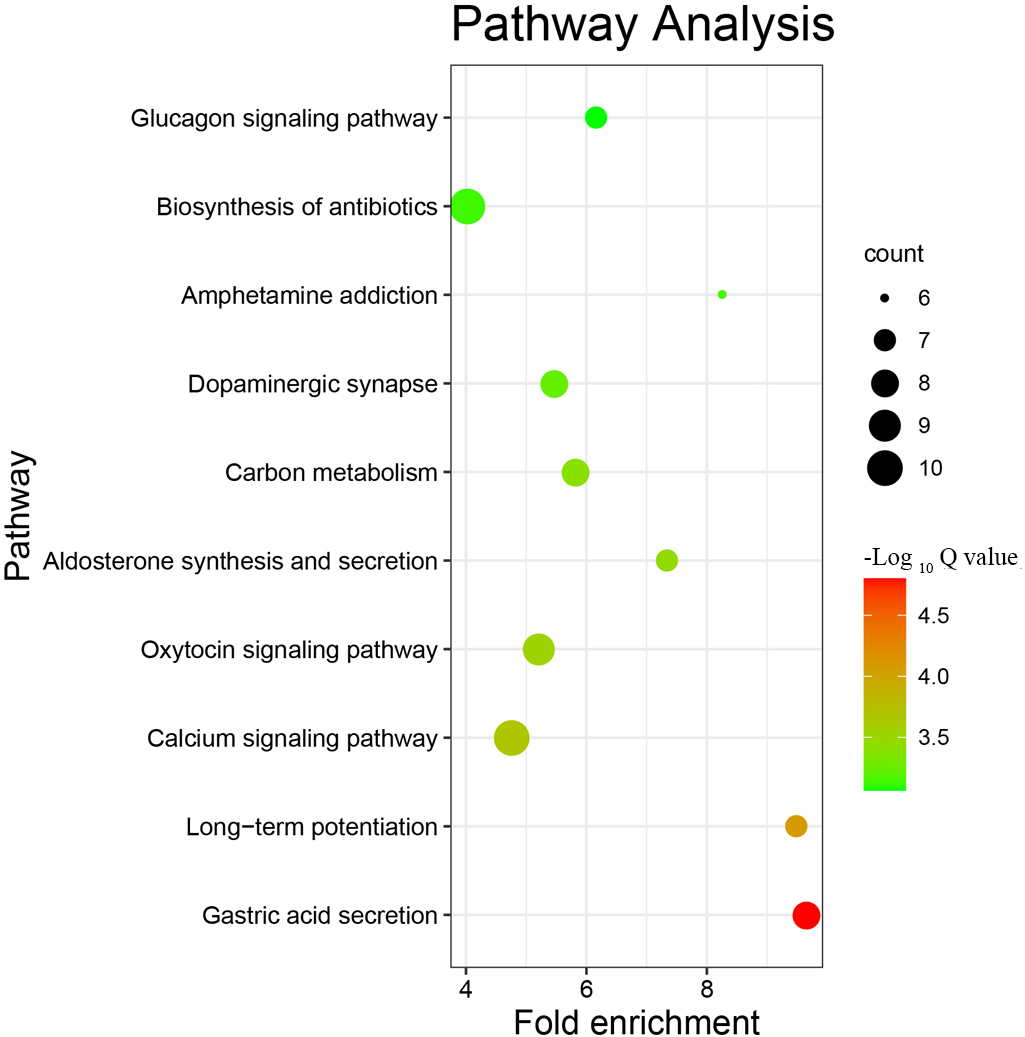 Fig. 6.
The top 10 KEGG pathways with the most differentially expressed proteins. The ordinate is the name of the pathway in which the DEPs participate, the abscissa is the folding enrichment of the pathway, the color of the dot represents -log10(Q value), and the size represents the number of DEPs involved in the pathway.
We selected 4 proteins associated with epilepsy for PRM analysis, including Glud1, Atp1a2, Prkcg and Arpc3. In this study, two groups of hippocampal samples were quantitatively analyzed by PRM (three each for the epilepsy group and the control group). The results showed that in the epilepsy group, Glud1 and Atp1a2 levels were downregulated, while Prkcg and Arpc3 levels were upregulated, which were consistent with the results of proteomics (Fig. 7). The function of Glud1 is similar to that of Atp1a2, which might be associated with energy metabolism. Prkcg and Arpc3 are related to the excitement of hippocampal neurons.
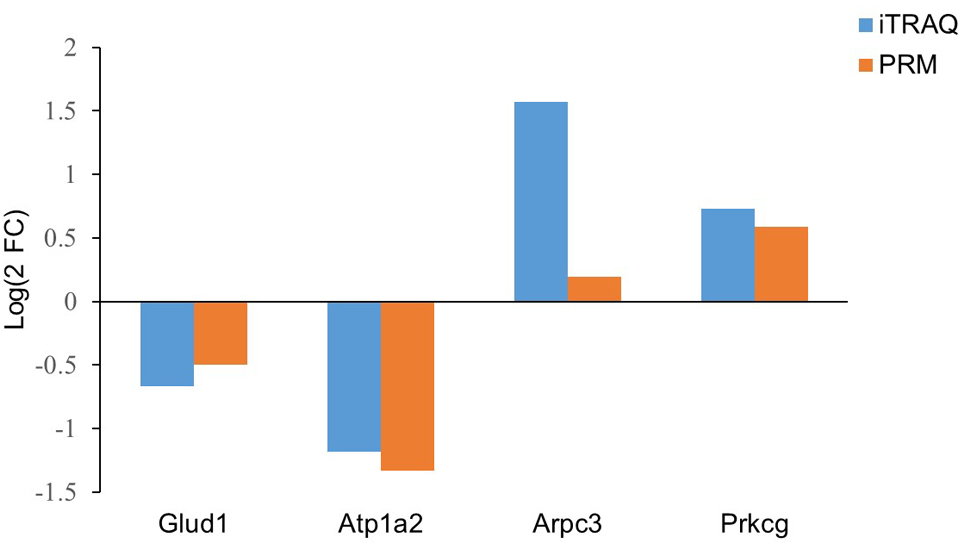 Fig. 7.
Comparison of protein expression by iTRAQ and PRM.
Epilepsy is a neurological disease involving limb twitching or nonconvulsive seizures triggered by abnormal firing of neurons in the brain. Many studies have shown that hippocampal plasticity is related to temporal lobe epilepsy [30, 31]. Therefore, the hippocampus has been considered to be the most important region in the pathogenesis of temporal lobe epilepsy for many years. At present, the potential molecular mechanisms and biological pathways involved in hippocampal damage in epilepsy are still elusive. In this study, the electrophysiological changes and hippocampal histopathological characteristics of epilepsy were analyzed, and all the proteins expressed in the hippocampal tissues of animals with epilepsy and their characteristics were systematically studied from the perspective of proteomics. Differential proteins were screened and verified by PRM, the results of which lay an experimental basis for the study of patients with clinical epilepsy.
Histopathological findings confirmed hippocampal damage in epileptic rats, which is consistent with previously reported studies [32]. The results showed that degeneration and necrosis of hippocampal neurons are the basic histopathological changes that occurs with seizures.
In this study, iTRAQ was used to identify DEPs responsible for hippocampal injury in epilepsy. 3782 proteins were quantified in the hippocampus using this technique. Among them, a total of 170 DEPs were screened out. Four proteins were screened according to their biological functions in the process of hippocampal damage in epilepsy, then the four selected proteins were successfully verified by PRM in frozen hippocampal tissue samples.
The expression level of Glud1 in hippocampus of epilepsy group was significantly lower than that of control group. Glud1 is localized in mitochondria and can provide energy and promote cell metabolism and proliferation by regulating the metabolic level of glutamine. Moreover, Glud1 may participate in learning and memory reactions by increasing the turnover of the excitatory neurotransmitter glutamate. Recent studies have shown that reduced levels of Glud1 in epileptic nerve cells affect glutamate metabolism, which in turn leads to seizures. Therefore, the decreased expression of Glud1 may be attributable to hippocampal ischaemia/hypoxia caused by recurrent seizures. Furthermore, we performed KEGG pathway enrichment for down-regulated proteins and found that Glud1 is involved in the regulation of bicarbonate reabsorption in the proximal tubule, which is consistent with previous reports [33]. These findings also highlight the role of Glud1 in the pathogenesis of epilepsy through a variety of pathways.
Studies have confirmed that Atp1a2 mutations are closely related to the onset of
epileptic encephalopathy [34]. The Atp1a2 gene encodes the
Another protein verified in this study was Prkcg, whose expression level in epileptic hippocampus was relatively higher than that in the control group. Prkcg plays diverse roles in neuronal cells and eye tissues, and and regulates synaptic transmission in the hippocampus. A previous study showed that Prkcg plays an important role in seizures by enhancing excitatory synaptic transmission and increasing the excitability of postsynaptic neurons [36].
Arpc3 is a component of the Arp 2/3 complex, which is involved in the construction of the cellular actin skeleton and in physiological processes such as endocytosis, migration and invasion of cells. In our study, Arpc3 was significantly upregulated in the hippocampus in the epilepsy model, causing actin polymerization to extend nerve synapses. It has been shown that the neuronal Wiskott-Aldrich syndrome protein (N-WASP) is a key regulator of actin cytoskeleton. As a downstream product of N-WASP, ARP2/3 is significantly expressed in the brain tissues of epileptic patients, which is consistent with the results of this study [37].
In conclusion, proteomic methods were used to screen for differentially expressed proteins associated with epileptic hippocampal injury in the hippocampal tissues of epileptic rats. A total of 170 DEPs were identified, and four significantly changed proteins (Glud1, Atp1a2, Prkcg, and Arpc3) were verified by PRM. Our results confirm the difference in protein expression between epilepsy and normal hippocampal tissues and initially explain the molecular functions and action networks of major proteins. In addition, further studies and clinical trials are needed to confirm our proteomic data in order to establish a more definitive molecular mechanism of hippocampal injury in epilepsy.
CZ and JL conceived and designed the experiment, collected all data and wrote the manuscript. CZ, ZZ and SZ contributed to the establishment of animal models and analyzed the data. LZ, PZ, HX, YL and YZ contributed to the pathology diagnosis and its photographic material. MZ supervised the conception, analysis, design of the work and manuscript drafting. All authors critically revised the manuscript for important intellectual content, provided approval of the final version and agreed to be accountable for all aspects of the work, ensuring that questions related to the accuracy or integrity of all parts of the work are appropriately investigated and resolved.
All animal procedures for this study were performed in accordance with the Guide for the Care and Use of Laboratory Animals and approved by the Animal Care and Use Committee of Chong Qing Medical University. Date Approved: October 20, 2020.
The authors wish to thank Chongqing Medical University for providing animals and experimental platforms.
The research was funded by the Basic and Frontier Technological Research Program of Chongqing (cstc2019jcyj-msxmX0455), the Scientific and Technological Research Program of Chongqing Municipal Education Commission (KJQN201902804; KJQN201902805), the Scientific and Technological Research Program of Chongqing Medical and Pharmaceutical College (ygz2018103), the Innovative Research Groups of Chongqing Medical and Pharmaceutical College (YGZ2019402), postdoctoral Science Fund Project of Chongqing Natural Science Foundation (cstc2019jcyj-bshX0128), the National Natural Science Foundation of China (81901922).
The authors declare no conflict of interest.
References
Publisher’s Note: IMR Press stays neutral with regard to jurisdictional claims in published maps and institutional affiliations.