
Academic Editor: Masaru Tanaka
Background: Some evidence about the role of the androgen receptor (AR) in pathogenesis of glioblastoma have been reported, but no study has focused on measuring the activity of the AR in GB. Therefore, the aim of this work is to study the role of AR and its activity as prognostic biomarkers in glioblastoma (GB). Methods: Molecular and clinical data from The Cancer Genome Atlas database were used. The AR-expression at protein-level was obtained from reversed phase protein array (RPPA) assays. The AR-activity was determined by calculating the AR-score, an index calculated by using the expression (at RNA-level) of 13 androgen-responsive-genes. Univariate and multivariate Cox-regression analyses were performed. Finally, a correlation analysis was conducted between protein expression data and the AR-score. Results: Two-hundred and thirty-three patients were included. RPPA data showed a mean AR abundance of 0.027(Statistical Deviation = 0.38) in GB. The univariate Cox-regression analysis showed that the AR-Score was associated with a worse prognosis (Hazard Ratio (HR) = 1.070) while the AR-expression did not show any relationship with survival (HR = 0.869). The association of the AR-score with worse overall survival (OS) was still significant in the multivariate analysis (HR = 1.054). The highest correlation coefficients between the AR-score and RPPA were identified in a group of proteins involved in apoptotic process regulation. Conclusions: GB patients with a high AR-activity present a worse prognosis in terms of OS. Thus, the activity of the AR may have a pathogenic role in GB. In this regard, the activation of the AR in GB may be associated with a dysregulation of apoptosis.
Glioblastoma (GB) is the most common primary brain tumor in adults, with an incidence of approximately 4 cases/100,000 inhabitants/year [1, 2]. It is the central nervous system tumor with the worst prognosis (mean overall survival of 12–15 months) [1, 2, 3]. The mean average age of patients diagnosed with GB is 60 years of age and is less frequent in patients under 30 years of age. It has a higher incidence in men than in women (3:2) [2]. Most cases of GB appear without any prior clinical or histological evidence of a lower grade precursor (primary GB), but a small percentage of GB results from a lower histological grade astrocytoma progression (secondary GB). Surgical resection followed by adjuvant radio-chemotherapy (Stupp Scheme) is the standard treatment for GB patients [4]. However, despite this treatment, only 5% of patients survive for 5 years after diagnosis [2]. Since the integration of the Stupp scheme in 2005, a few therapeutic alternatives have led to a mild improvement in GB prognosis [5, 6]. In this regard, the study of new possible therapeutic targets in GB is essential.
In the last decade, the development of new prognostic and therapeutic biomarkers in glioblastoma have contributed to a better understanding of this disease [7]. They have also reinforced the heterogenicity as the one of the main features of GB. Molecular biomarkers are the most common and some of them are part of the routine clinical interrogation (e.g., MGMT methylation, IDH1 & 2 mutation, 1p19q codeletion) because they are used for tumor classification [8]. However, no biomarker related to steroid receptors is routinely used despite its putative role in GB pathogenesis [9].
Sex steroids, including androgens, regulate important functions in the central nervous system. They are involved in neural differentiation and brain masculinization [10], learning and memory processes, as well as emotional states, impulsivity and aggressive behaviors [11, 12]. In addition, androgen levels are essential for the modulation of synaptic plasticity mechanisms [13]. In this respect, androgens, especially testosterone and dihydrotestosterone, are considered neuroprotective factors with actions mediated, generally, by the androgen receptor [14]. The activated androgen receptor (AR) acts as a transcription factor, binding to DNA and regulating the expression of certain genes (called androgen responsive genes (ARGs)). Activation of the AR receptor in a tumor context may contribute to the onset, development and progression of certain cancers, among which prostate cancer stands out. The activation of the AR in prostate cancer leads to increased proliferation, migration capacity and invasion of tumor cells [15, 16]. This is also observed in some breast cancers expressing high levels of AR [17]. Over the last 30 years there have been especially relevant changes in the diagnostic-therapeutic management related to the AR of these two highly-prevalent cancers [18, 19]. In fact, nowadays, in both cancer types, the determination of AR expression is a mandatory clinical practice [9].
Androgens and their receptor activation could also have a pathogenic role in GB.
Indeed, higher AR expression has been demonstrated in GB biopsies compared to
normal brain probes levels [20, 21]. This difference is confirmed in various
databases included in the Oncomine
Therefore, there is enough evidence in the literature to justify the link between androgens and GB, although there are many issues that need to be elucidated. On the one hand, although many studies have reported an overexpression of AR in GB, the prognostic implication of its expression should be analyzed in depth. On the other hand, not only the AR expression, but also its activation should be studied in GB. This issue may be even more important than the AR expression measure, because it would give a more realistic view of the androgen’s implication in GB biology. The main interest of delving deeper into this subject lies in the future possibility of using the androgenic pathway as a therapeutic target in GB management.
Therefore, the aim of the present work is to study the role of AR expression and AR activity as prognostic biomarkers in primary glioblastoma. The expression of AR (at protein level) and the expression of confirmed ARGs (at mRNA level) were analyzed in a cohort of patients from The Cancer Genome Atlas (TCGA) project.
Two hundred and forty-four patients (94 females; mean age 59.5 years (SD = 14.29)) were included from the TCGA database (only patients with, at least, reversed phase protein array [RPPA] data). To specifically select those patients with primary glioblastoma, the presence of isocitrate dehydrogenase 1 (IDH1) and/or isocitrate dehydrogenase 2 (IDH2) mutations were discarded. The mutational annotation for both genes was analyzed and those patients with any kind of mutation in those genes were excluded (1 patient with IDH1 mutation and no patients with IDH2 mutation). Furthermore, those patients whose probes came from a previously treated glioblastoma or this information was not available were also excluded (n = 10). Therefore, a cohort of 233 patients (92 females; mean age 59.7 (SD = 14.18)) formed the definitive database for further analysis. Clinical and molecular features of the patients included in the study are shown in Table 1.
| Age | 59.72 (SD = 14.2) | |
| Gender (female:male) | 92:141 | |
| Karnofsky Performance Score |
60 (33.9%) | |
| Treatment (Radiotherapy + Temozolomide) | 155 (66.8%) | |
| Use of Bevacizumab | 48 (20.6%) | |
| Use of other treatment | 91 (39.1%) | |
| MGMT promoter methylation | 80 (40.4%) | |
| Molecular subtype (n = 127) | ||
| Classic | 27 (21.3%) | |
| Mesenchymal | 30 (23.6%) | |
| Proneural | 30 (23.6%) | |
| Neural | 40 (31.5%) | |
| Fraction genome altered |
0.21 (SD = 0.1) | |
| Aneuploidy score | 8.21 (SD = 5.5) | |
| Mutation count | 82.25 (SD = 460.0) | |
| AR copy number variation | ||
| Deletion | - | |
| Amplification | 1 (0.5%) | |
| AR mutations | - | |
| AR protein expresión | 0.03 (SD = 0.4) | |
| AR-score (n = 127) | –0.02 (SD = 5.75) | |
| Overall survival (months) | 14.73 (13.0–16.4) | |
| AR, Androgen Receptor; MGMT, O | ||
Data from TCGA was downloaded from Firebrowse (http://firebrowse.org/) (TCGA data version 2016_01-28). As mentioned above, only patients with RPPA data available were included in the study. Apart from RPPA data, clinical, mutational, copy number variations, RNA expression and methylation data (for determination the O6-methylguanine-DNA-methyltransferase (MGMT)) from the selected patients were also downloaded and included in the database. It should be noted that this information was not available for all patients. Details of this data generation are described elsewhere [24, 25].
Methylation probes were available for 198 patients from the cohort of TCGA patients that were included in the present study. In 102 of these patients, the methylation status was tested using the HumanMethylation27 (HM27) platform and in 112 patients with the HumanMethylation450 (HM450) platform. Two patients (0.9%) presented data from both platforms. To combine the data from both platforms, the absence of significant differences was first confirmed between those samples on the two Infinium platforms by calculating the p-value using a student-t test [25]. Afterwards, data was merged by averaging the beta-values of the CpG probes of interest.
The methylation status of MGMT was determined as explained in other works [26]. In brief, the beta values were transformed in M-values using this formula:
# M = log2 (Beta/(1-Beta))
Then we calculated the logit (y) using the model proposed by Bady et al. [26], where only the M-value of two MGMT CpG islands are considered (cg12434587 and cg12981137):
# logit (y) = 4.215 + 0.5271
As proposed by Bady et al. [26] a probability cutoff of 0.358 was used which empirically maximized the sum of sensitivity and specificity.
AR expression data were extracted as explained above and were analyzed as
described elsewhere [27]. These data showed a normal distribution
(Kolmogorov-Smirnov; p = 0.093), and, thus, was included in the
univariate Cox regression analysis (see below). Furthermore, AR expression was
also dichotomized (using the median) and this variable was used to compare groups
of low (
Apart from AR expression, the rest of the RPPA data was also included in the database to identify those proteins which showed a positive or negative correlation with AR activity (see below).
The RNAseq data was available for 127 patients (54.5% of the selected cohort of patients). These data were used for two approaches. Firstly, the expression profiles of a selected set of genes were also extracted to perform a molecular classification. As has been widely described in previous works, there are differences in gene expression in glioblastoma that allow their classification in proneural, neural, classical and mesenchymal transcriptomic subtypes [24, 28]. Using the list of input genes that are highly expressed in each subtype (http://tcga-data.nci.nih.gov/docs/publications/gbm_exp/), an unsupervised hierarchical cluster analysis (MORPHEUS, Broad Institute, http://software.broadinstitute.org/morpheus/) was performed and each patient was assigned to a molecular subgroup by cutting the resulted dendrogram (Supplementary Fig. 1).
Secondly, in order to infer the activity of the AR, the expression profile of
previously validated androgen response genes (ARGs) was included in the database
[29]. Specifically, a list of 13 genes that are induced by the activation of AR
in both HPr-1AR (normal prostate cell line) and LNCaP (prostate cancer cell line)
cells [29] were included (Supplementary Table 1). The activity of the AR
was defined by the quantification of the composite expression of this 13-gene
signature in each sample. As in other works [30], a Z-score was computed for the
expression of each gene in each sample by subtracting the pooled mean from the
RNAseq expression values and dividing the result by the pooled standard
deviation. The AR putative activity (called here AR-score) for each sample was
then computed as the sum of the Z-scores of the ARGs signature. The AR-score
showed a normal distribution (Kolmogorov-Smirnov; p = 0.866) and was
included in the univariate Cox regression analysis (see below). Furthermore, the
AR-score expression was also dichotomized (using the median) and this variable
was used to compare groups of low (
Copy number variation (CNV) and mutation annotation files were downloaded as described above and analyzed as described elsewhere [27]. After excluding those patients whose RPPA data was not available, the ten-most-common cancer related genes showing copy number alteration (CNA) and/or mutation were studied. Those genes (Supplementary Tables 2,3) were identified from the whole TCGA glioblastoma cohort whose analysis can be found in cBioPortal (https://www.cbioportal.org/). Comparative analysis of the distribution of these genetic events between the two groups of AR expression and AR-score was performed. Furthermore, CNVs and mutations of the AR were also analyzed.
Statistics has been performed as described in previous reports [27]. In brief,
nonparametric statistical tests were used (Mann-Whitney U for continuous
variables and the Chi-Square/Fisher exact test for discrete variables) to
identify differences between low and high AR expression groups, as well as
between low and high AR-score groups. Statistical significance was considered
when the p-value
Univariate and multivariate Cox regression analysis were performed. Clinical and
molecular variables were included in the univariate analysis and those with a
p-value
Finally, a correlation analysis between RPPA data and the AR-score of each sample was performed. The 5 proteins with the highest (positive or negative) correlation coefficient were studied. The genes that encoded these proteins were surveyed by shared Gene Ontology (GO) Biological Process data using the g: Profiler (http://biit.cs.ut.ee/gprofiler/gost).
Reversed Phase Protein Analysis (RPPA) data showed a mean AR abundance of 0.027
(SD = 0.38) in the probes of glioblastoma. As expected, a significant positive
but moderate correlation between AR at the protein and mRNA levels was found
(Spearman’s Rho; Correlation Coefficient (CC) = 0.557; p
| Low AR | High AR | p-value | ||
| (n = 116) | (n = 115) | |||
| Age | 58.63 (SD = 14.0) | 60.83 (SD = 14.4) | 0.210 | |
| Gender (female:male) | 44:74 | 48:67 | 0.505 | |
| Karnofsky Performance Score |
32 (34%) | 28 (33.7%) | 1.000 | |
| Treatment (RT + TMZ) | 74 (62.7%) | 81 (71.1%) | 0.210 | |
| Use of Bevacizumab | 24 (20.3%) | 24 (20.9%) | 1.000 | |
| Use of other treatment | 45 (38.1%) | 46 (40.0%) | 0.790 | |
| MGMT promoter methylation | 32 (33.0%) | 48 (47.5%) | 0.043 | |
| Molecular subtype (n = 127) | 0.058 | |||
| Classic | 10 (14.7%) | 17 (28.8%) | ||
| Mesenchymal | 13 (19.1%) | 17 (28.8%) | ||
| Proneural | 19 (27.9%) | 11 (18.6%) | ||
| Neural | 26 (38.2%) | 14 (23.7%) | ||
| Fraction genome altered | 0.21 (SD = 0.1) | 0.21 (SD = 0.1) | 0.741 | |
| Aneuploidy score | 9.02 (SD = 5.5) | 8.39 (SD = 5.5) | 0.564 | |
| Mutation count | 114.52 (SD = 650.8) | 50.27 (SD = 36.7) | 0.695 | |
| AR copy number variation | 1.000 | |||
| Deletion | - | - | ||
| Amplification | - | 1 (0.9%) | ||
| AR mutations | - | - | - | |
| AR-score (n = 127) | 0.10 (SD = 6.17) | –0.16 (SD = 5.27) | 0.678 | |
| Overall survival (months) | 13.47 (11.2–15.7) | 15.43 (13.7–17.2) | 0.124 | |
| Abreviations: AR, Androgen Receptor; MGMT, O | ||||
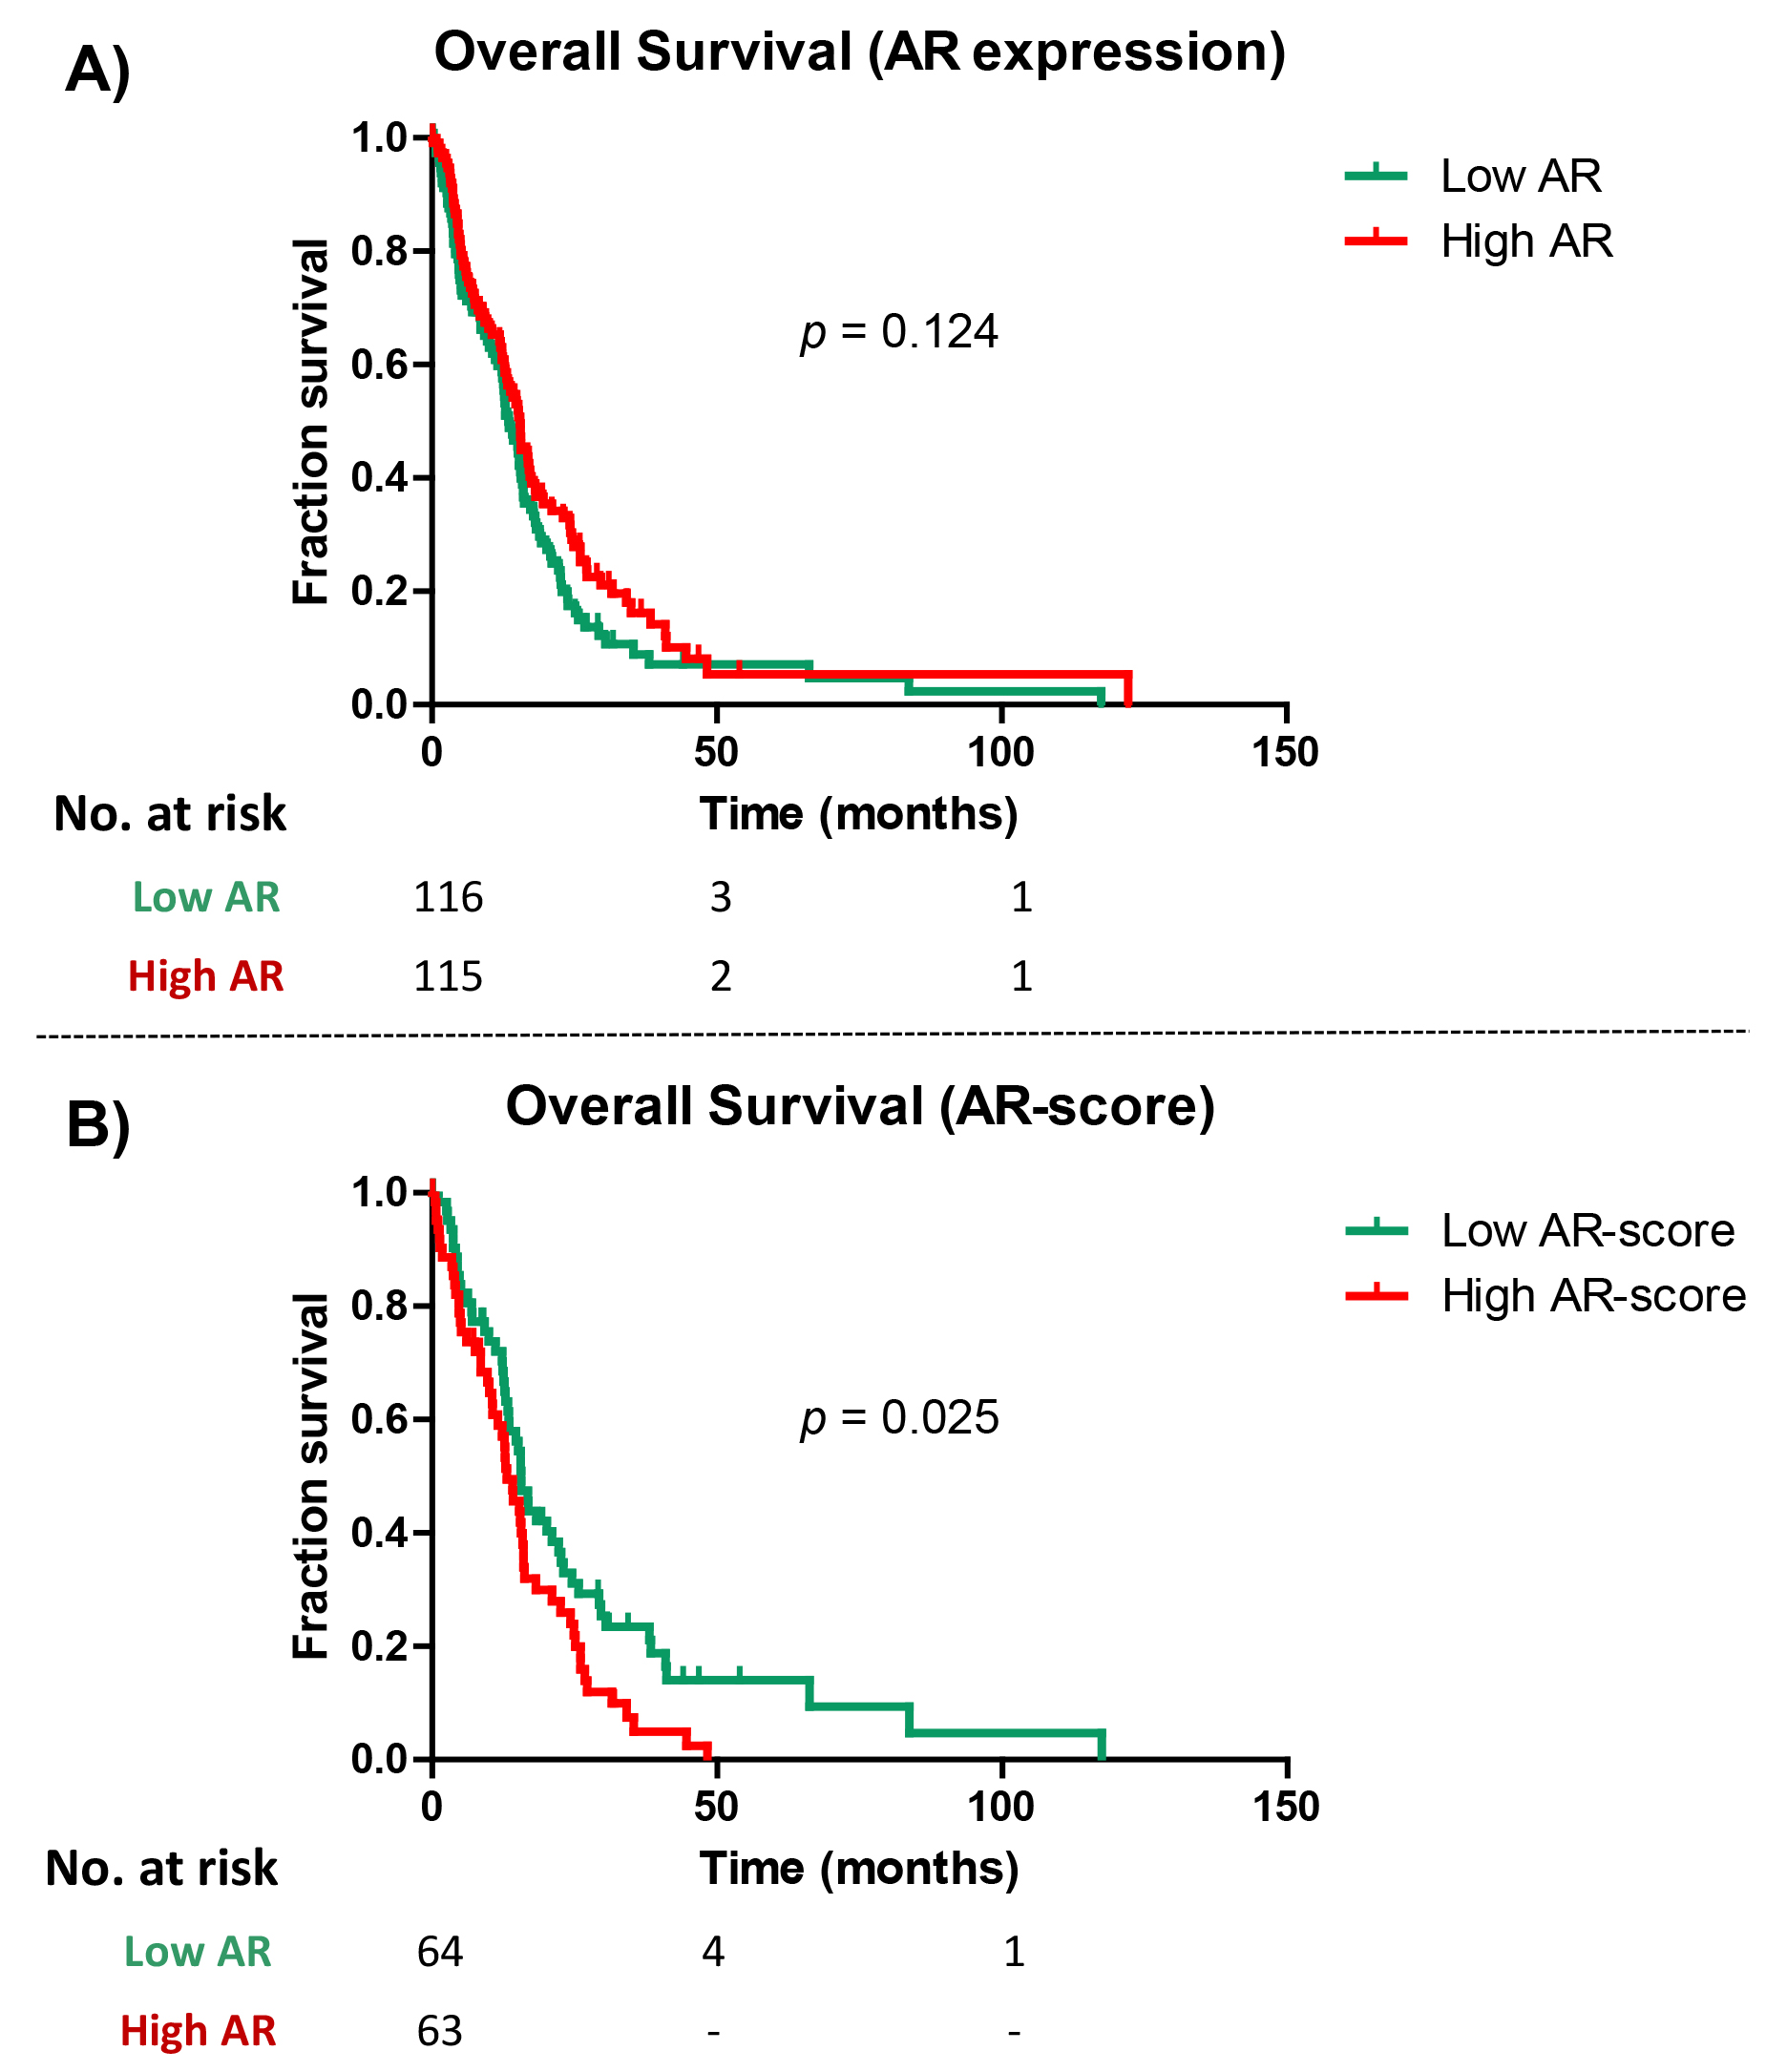 Fig. 1.
Survival analysis in Androgen Receptor (AR) and AR-score groups. (A) Kaplan-Meier curve for overall survival in patients with high and low AR expression groups (using the 50 percentile as cutoff). (B) Kaplan-Meier curve for overall survival in patients with high and low AR expression groups (using the 50 percentile as cutoff).
As regards the broad molecular information available in the TCGA patients, additional comparisons between low and high AR expression groups were performed. These comparisons were focused on DNA copy-number variation (CNV) and DNA mutations. Determination of the frequency of chromosomal gains or losses (Supplementary Table 4), analysis of focal amplifications and deletions in the top-10 glioblastoma cancer-related genes with focal CNVs (Supplementary Table 5), and the mutational signature in the top-10 glioblastoma cancer related genes (Supplementary Table 6) in both AR expression groups were all performed. No significant difference in all these molecular data between groups were identified, even when considering a non-corrected p-value (Supplementary Tables 4–6).
The mRNA expression of 13 validated androgen response genes (ARGs) were used to create an index which putatively reflects the activity of the AR (called AR-score) (see Methods, Supplementary Table 1). The mean AR-score in the studied cohort of patients (127 patients) was -0.024 (SD = 5.74). No correlation between the AR-score and AR at protein level expression was identified (Spearman’s Rho; CC = 0.060; p = 0.500), or between AR-score and AR expression at RNA level (Spearman’s Rho; CC = –0.007 p = 0.934). Males presented a higher mean AR-score (0.14, SD = 5.89) than females (–0.32, SD = 5.53), but this difference did not reach statistical significance (p = 0.850).
Using the median of AR-score (p50 = 0.05), a comparative analysis between
patients with a low AR-score (
| Low AR-Score | High AR-Score | p-value | ||
| (n = 64) | (n = 63) | |||
| Age | 56.39 (SD = 15.9) | 60.56 (SD = 14.8) | 0.132 | |
| Gender (female:male) | 42:22 | 41:23 | 1.000 | |
| Karnofsky Performance Score |
17 (31.5%) | 19 (36.5%) | 0.683 | |
| Treatment (RT + TMZ) | 44 (68.8%) | 38 (59.4%) | 0.357 | |
| Use of Bevacizumab | 12 (18.8%) | 10 (15.6%) | 0.815 | |
| Use of other treatment | 36 (56.2%) | 30 (46.9%) | 0.377 | |
| MGMT promoter methylation | 22 (47.8%) | 17 (36.2%) | 0.297 | |
| Molecular subtype (n = 127) | 0.081 | |||
| Classic | 17 (26.6%) | 10 (15.9%) | ||
| Mesenchymal | 12 (18.8%) | 18 (28.6%) | ||
| Proneural | 19 (29.7%) | 11 (17.5%) | ||
| Neural | 16 (25.0%) | 24 (38.1%) | ||
| Fraction genome altered | 0.23 (SD = 0.1) | 0.21 (SD = 0.1) | 0.891 | |
| Aneuploidy score | 8.35 (SD = 6.1) | 8.13 (SD = 5.7) | 0.686 | |
| Mutation count | 58.37 (SD = 80.1) | 49.15 (SD = 49.9) | 0.937 | |
| AR copy number variation | 1.000 | |||
| Deletion | - | - | ||
| Amplification | - | 1 (1.7%) | ||
| AR mutations | - | - | - | |
| AR expression (RPPA) | 0.02 (SD = 0.5) | –0.01 (SD = 0.3) | 0.924 | |
| Overall survival (months) | 15.6 (13.4–17.8) | 13.1 (10.1–16.1) | 0.025 | |
| Abreviations: AR, Androgen Receptor; MGMT, O | ||||
Finally, in the survival analysis, patients with a high AR-Score showed a significantly worse OS than low AR-Score patients (13.1 vs. 15.6 months; Log-Rank; p = 0.025) (Table 3, Fig. 1).
Univariate Cox regression analysis was performed to analyze the value of AR
protein expression and AR-score as prognostic factors. The AR protein expression
did not show any association with OS (HR = 0.868; 95% Confident Interval (C.I.)
(0.600–1.255); p = 0.452) (Table 4). The AR-score was associated with a
worse prognosis in OS (HR = 1.070, 95% C.I. (1.033–1.108); p =
0.000177). The univariate Cox regression analysis also included other variables
that have previously been associated with the prognosis of GB (Table 4). The
association of AR-score with a worse OS was still significant in the multivariate
analysis (HR = 1.054, 95% C.I. (1.008–1.103); p = 0.020), where
variables that showed statistical significance in the univariate Cox regression
analysis (p
| UNIVARIATE COX REGRESSION | ||||
| Variable | Hazard Ratio | 95% C.I. | p-value | |
| Age | 1.039 | 1.026–1.051 | 0.000 | |
| Gender | 0.051 | |||
| Female | 0.733 | 0.537–1.002 | ||
| Male | 1.364 | 0.998–1.863 | ||
| Karnofsky performance status |
1.765 | 1.229–2.535 | 0.002 | |
| Treatment (RT + TMZ) | 0.476 | 0.348–0.653 | 0.000 | |
| Use of Bevacizumab | 0.591 | 0.402–0.870 | 0.008 | |
| MGMT promoter methylation | 0.692 | 0.487–0.982 | 0.039 | |
| Molecular classification | 0.134 | |||
| Classic | 0.858 | 0.538–1.370 | ||
| Mesenchymal | 1.349 | 0.904–2.015 | ||
| Proneural | 0.655 | 0.428–1.002 | ||
| Neural | 0.978 | 0.651–1.468 | ||
| AR expression (RPPA) | 0.868 | 0.600–1.255 | 0.452 | |
| AR-Score | 1.070 | 1.033–1.108 | 0.000 | |
| MULTIVARIATE COX REGRESSION | ||||
| Variable | Hazard Ratio | 95% C.I. | p-value | |
| Age | 1.023 | 0.999–1.048 | 0.059 | |
| Karnofsky performance status |
1.117 | 0.558–2.235 | 0.755 | |
| Treatment (RT + TMZ) | 0.536 | 0.285–1.011 | 0.054 | |
| Use of Bevacizumab | 0.790 | 0.406–1.539 | 0.489 | |
| MGMT promoter methylation | 0.827 | 0.438–1.539 | 0.559 | |
| AR-Score | 1.054 | 1.008–1.103 | 0.020 | |
Correlation analysis between AR-Score and RPPA data was performed. The aim of this approach was to identify positive and negative significant relationships between AR activity and other cancer related proteins included in the RPPA data from the TCGA. Among the five proteins with the highest correlation coefficients, four had a positive relationship with the AR-score (Fig. 2): PAI-1 (CC: 0.51), followed by Caveoline-1 (CC = 0.43), phosphorylated NDRG1 (NDRG1 pT346) (CC = 0.42) and Caspase-8 (CC = 0.38). The other selected protein was phosphorylated (CDK1 pY15) and its expression had a negative correlation with the AR-score (CC = –0.39) (Fig. 2).
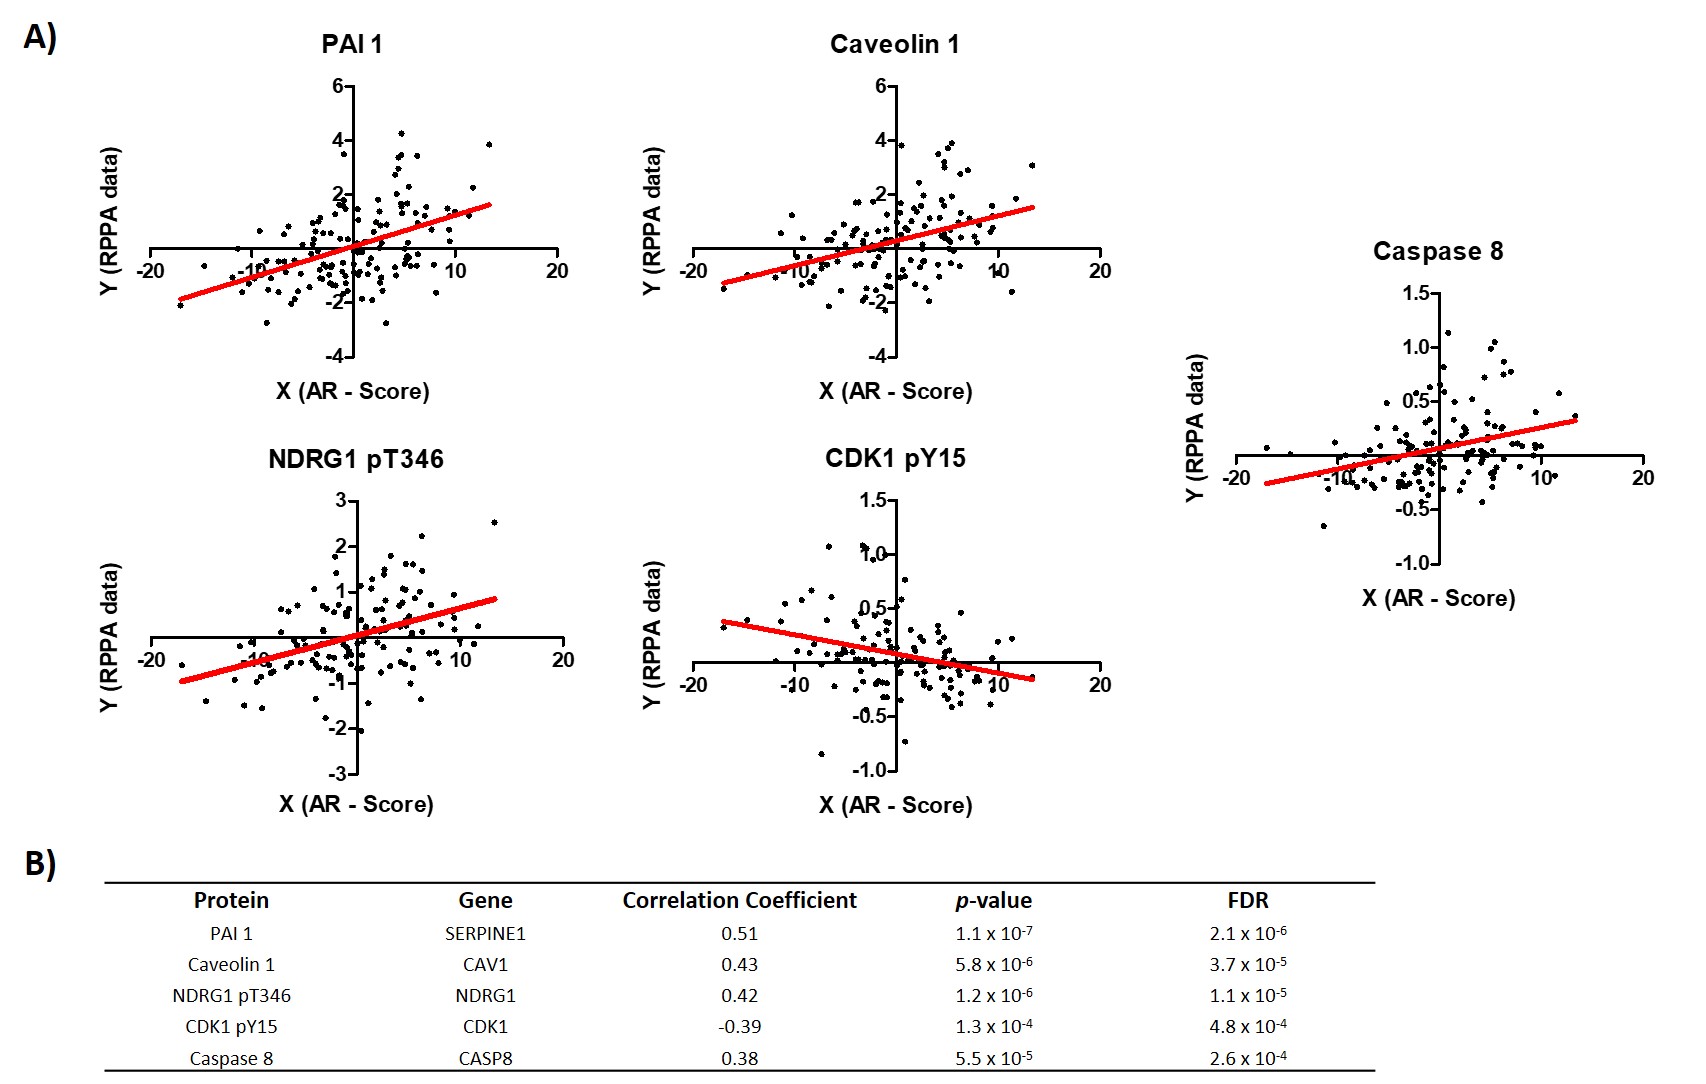 Fig. 2.
Correlation analysis between AR-Score and the top-5 correlation coefficient proteins in the RPPA from TCGA data. (A) Plots showing the relationship between the AR-score and each selected protein expression. (B) Table showing the information from the correlation analysis plotted in A.
In order to infer biological processes regulated by these proteins, the genes that encoded these 5 selected proteins were surveyed by Gene Ontology (GO) Biological Processes data. This analysis showed that these proteins are mainly associated with the regulation of apoptotic process (adjusted p = 0.0007).
This work studies the prognostic role of the AR expression and its activity (AR-Score) in patients with primary glioblastoma. Although the AR expression does not seem to be associated with prognosis, a significantly lower OS has been identified in the group of patients with a higher AR-Score. Furthermore, the AR activation may be associated with the expression of other genes that are mainly related to the process of cellular apoptosis. All these findings are discussed below.
As stated in the introduction section, many studies have reported a high
expression of AR at mRNA [23] and protein levels [20, 22] in glioblastomas.
Furthermore, the expression of the AR in gliomas has been related to the tumor
grade, thus its expression increases as the tumor grade increases [22] and the
activation of the AR seems to have a promoting effect in GB [20, 21, 23]. In this
respect, Yu X et al. [20] reported that promoting the TGF
The present work tries to determine AR activity by calculating the AR-Score, an index calculated by using the expression of 13 androgen responsive genes (ARGs), which has been previously validated for prostate cancer. According to the results of previous studies, higher activation of the AR (here a higher AR-Score) was associated with a worse prognosis (Tables 3,4; Fig. 1). The difference in prognosis does not seem to be associated with other molecular or clinical variables and the worse prognosis of higher AR-Score was maintained in multivariate analysis. Furthermore, a recent study has described an implication of the androgenic pathway activation in the immune response against GB, facilitating the infiltration of regulatory T-cells which are immunosuppressive T-cells [31]. Therefore, one can assume the importance of considering the AR activation when studying its pathogenic role in GB, not only the AR expression at the mRNA and/or protein level.
A correlation analysis was performed between the AR-Score and RPPA data with the aim of identifying the relationship between the AR activity and proteins that have a recognized role in oncogenesis. Among the 5 proteins with the highest correlation with the AR-Score, four had a positive correlation (PAI-1, Caveoline-1, NDRG1 and caspase-8) and one of them had a negative correlation (phosphorylated CDK1).
PAI-1 (plasminogen activator inhibitor 1) is a glycoprotein which is synthesized
by endothelial and tumor cells, among others. It belongs to the Serpin
superfamily and acts as a protease inhibitor [32]. High levels of PAI-1 have been
associated with tumor growth, necrosis development, micro-thrombosis and,
consequently, with a lower OS in malignant brain tumors [33]. The expression of
PAI-1 is regulated by the TGF
The expression of Caveolin-1 (Cav-1) also showed a positive correlation with the AR activity. Cav-1 is a protein responsible for the formation of caveolae, which are complex plasma membrane structures involved in the signal transduction process, cell-cycle regulation and cell migration [35]. The relationship between Cav-1 expression and AR activity in GB has not been established until now, but studies have analyzed this relationship in prostate cancer. In this regard, Cav-1 seems to act as a coactivator of the AR, increasing the androgen/AR signaling [36, 37]. Although the association of Cav-1 expression and AR activity has not been previously studied until now, the role of Cav-1 in gliomas has already been analyzed. Firstly, higher Cav-1 expression in GB versus normal brain tissue has been reported [38, 39]. Secondly, the expression of Cav-1 in gliomas seems to increase proportionally with the tumor grade [35]. Finally, Cav-1 participates in multiple processes that promote GB development and facilitate tumor cells invasion [39].
As explained for PAI-1 and Cav-1, the positive relationship between the
expression of NDRG1 and Caspase-8 with AR activity described in the present work
are also supported by the literature. On the one hand, NDRG1 (N-Myc Downstream
Regulated 1), is associated with an unfavorable prognosis in gliomas and prostate
cancer [40]. NDRG1 expression in GB cells was mainly described in those cells
exposed to hypoxia [40, 41]. Furthermore, NDRG1 overexpression in GB may inhibit
the TFG-
Finally, a negative correlation between the CDK1 (activated by phosphorylation, CDK1 pY15) and the AR activity was identified. CDK1 plays a fundamental role in the cell cycle by modulating mitosis onset [46, 47]. Phosphorylated CDK1 leads to a phosphorylation of the AR in prostate cancer (phosphorylation in Ser-308) and this modification of the AR has been associated with a decrease in its transcriptional activity [48, 49] and with a longer OS [50]. Although these previous reports in prostate cancer may explain the findings of the present work (i.e., a negative relationship between AR-Score and phosphorylated CDK1), no evidence about the phosphorylation status of the AR and its relationship with AR activity and/or prognosis in GB have been reported.
Overall, the relationship between the selected proteins and the AR activity is supported by previous reports on GB and other tumors (mainly in prostate cancer). However, more studies are needed to specifically analyze the interaction of these proteins and AR in the context of GB.
Some limitations should be considered in the present work. Firstly, AR activity has been determined by using the expression of an ARGs set that was previously validated in prostate cancer cells and normal prostate cells, but not in glioma cells. In this respect, new studies, using Chip-Seq methods, focusing on specific ARGs in gliomas are required. In any case, the ARGs used in this work should also be validated in primary GB cultures exposed to androgens.
Secondly, using the AR-Score as a measure of AR activity, one cannot infer whether the activation of the AR is ligand dependent or independent. Bearing this in mind, a recent work has reported an activation of the AR by ligand-independent signaling through EGFR [51]. Thus, future works should also be focused on this issue, both in vitro and in vivo, measuring blood androgen levels and evaluating the effect on tumor growth or recurrence.
As a conclusion, the activation of the AR (estimated by the AR-Score) is associated with a worse prognosis in patients with primary glioblastoma. The expression of the AR may not be as important as its activity, which seems to be associated with the expression of a set of proteins that, individually, have been demonstrated to play a pathogenic role in the biology of GB. This finding opens the possibility to modulate the AR pathway to improve the prognosis of GB patients. It might be hypothesized that blocking the AR or the production of androgens (as in prostate cancer patients) GB cells (including glioma stem cells, which consistently expressed the AR [52]) will be more sensible to adjuvant therapies, mainly the radiotherapy. Of course, this hypothesis should be tested in a clinical trial.
HFJ and JPB had conceived the project. HFJ, AdV and LM had collected all the data. HFJ, AdV, LM and JPB had performed the statistics. All authors had drafted the manuscript.
Not applicable.
The results published here are in part based upon data generated by the TCGA Research Network: https://www.cancer.gov/tcga.
Part of this work has been supported by a grant from Fundación Canaria Instituto de Investigación Sanitaria de Canarias (FIISC) (Funding number: PIFIISC19/31).
The authors declare no conflict of interest.