
Pattern recognition algorithms decode emotional brain states by using functional connectivity measures which are extracted from EEG signals as input to the statistical classifiers. An open-access EEG dataset for emotional state analysis is used to classify two dominant emotional models, based on valence and arousal. To calculate the functional connectivity between all available pairs of EEG electrodes four different measures, including Pearson’s correlation coefficient, phase-locking value, mutual information, and magnitude square coherence estimation, were used. Three kinds of classifiers were applied to categorize single trials into two emotional states in each emotional model (high/low arousal, high/low valence). This procedure resulted in decoding performance of 68.30% and 60.33% for valence and arousal respectively in test trials which were significantly higher than chance (≈ 50%, t-test, and significance level of 0.05). The results obtained using a phase-locking value approach were significantly better than previous findings on the same data set. These results illustrate that functional connectivity between distinct neural populations can be considered as a neural coding mechanism for intrinsic emotional states.
Emotion is defined as a pleasant or unpleasant experience related to a special pattern of physiological activity in the brain. In an attempt to develop tools and algorithms for emotional state decoding, it is possible to report the intrinsic emotional state of the brain based on electrophysiological signals without requiring any other resources as an input (Jenke et al., 2014). Why is it important to design such a system? The reason is that some kinds of defects in emotion recognition have been reported in some diseases. For example, some schizophrenic patients suffer from various problems in emotion interactions (see Barkhof et al., 2015). There are different ways to analyze the emotional states such as the electrocardiogram (ECG), skin conductance (SC), respiration, as well as electroencephalograph (EEG), electrocorticography (ECoG), and functional magnetic resonance imaging (fMRI) and either facial expressions or speech (see Wang et al., 2014).
Electroencephalograph is a noninvasive and portable method of recording brain activity with a high temporal resolution which is a suitable tool that provides an overall and simultaneous view of brain activity. Due to the numerous advantages of EEG, especially in humans, relative to other methods of brain study, EEG signals from a multimodal dataset, which has been provided by Koelstra et al. (2012) are used here to evaluate the efficacies of proposed methods of analysis. There are different strategies for stimulating emotions such as presentation of images as visual stimulus (Zhang and Lee, 2010), playing music for audio stimulus (Naji et al., 2015; Yang and Chen, 2011), spraying perfumes for odor stimulus (Lorig and Schwartz, 1988), etc. The multimedia or music video stimulations are the most effective stimulation way for emotion. Therefore, this approach has been considered as the most popular method in emotion classification. It is widely accepted that DEAP (a Dataset for Emotion Analysis using Physiological signals) dataset, which has used such multimedia stimulation, has all of required factors for emotion recognition (see Bahari and Janghorbani, 2013; Chung and Yoon, 2012; Naser and Saha, 2013; Torres-Valencia et al., 2014; Zhuang et al., 2014).
The main results on DEAP dataset (Koelstra et al., 2012) in previous works demonstrated that EEG information about arousal and valence could be extracted with a maximum accuracy of 62% and 57.60% respectively via spectral power for each electrode and spectral power asymmetry between pairs of EEG electrode and with naïve Bayesian classifier which used leave one out (LOO) cross-validation, respectively.
Another algorithm for recognition of emotional states on the DEAP dataset was implemented by Naser and Saha (2013). They proposed a system that estimated emotional states using the SVM classifier based on the dual-tree complex wavelet packet transform (DT-CWPT) features and singular value decomposition feature selection. They reported an average accuracy of 66.20%, 64.30% for arousal and valence.
Bahari and Janghorbani (2013) showed that the emotion recognition rate using a support vector machine (SVM) reached an accuracy of 64.56 % and 58.05% for arousal and valence. Torres-Valencia et al. (2014) reported an average accuracy of 55.00%, 58.75% by using SVM as a classifier to characterize EEG signals into two emotional states using hidden Markov models (HMM). This was an overview of the results of all previous works on the DEAP dataset with the purpose of emotional state classification. Most of the previous studies have only focused on extracting classifier inputs from single electrodes.
Khosrowabadi et al. (2014) proposed a system that estimated coherence between each pair of electrodes using neural networks to categorize emotional states based on EEG signals. They reported an average accuracy range of 62.50% to 68.57% for each of the two emotional states by the ERNN dataset. Except this study which has used coherence in frequency domain as input feature to an emotion recognition system, no other study has focused on functional connectivity between EEG electrodes for this aim. Here four types of functional connectivity-based features in frequency and time domain were considered. At the best condition, a decoding performance of 68.30% and 60.33% for valence and arousal respectively using phase-locking value (PLV) as the classifier input was obtained which was significantly better than previous findings on the same data set.
One of the most important problems in designing statistical algorithms for emotion classification is extracting efficient features from electrophysiological signals so that it can discriminate observations from different emotional states. Undoubtedly, there are different types of emotions, but Davidson (1979) divided emotional models into two dimensions (to use multiple dimensions to categorize emotions). Davidson (1979) model allow for two classes for each dimension (high/low arousal, high/low valence) where valence is considered on the horizontal axis and arousal in the vertical axis (see Davidson, 1979). The focus of this study is on functional connectivity between EEG signals from different electrodes as the recognition model input. The question of whether higher decoding accuracy could be achieved for emotion classification via functional connectivity features relative to previous findings on the same dataset. If so then the idea is to know which functional connectivity measure is the best and which frequency band is more informative for emotion categorization.
DEAP dataset obtained by Koelstra et al. (2012) contains data from 32 subjects (16 females and 16 males), the mean age of the healthy subjects was 26.9, ranging from 19-37 (https://www.eecs.qmul.ac.uk/mmv/datasets/deap/). Before the dataset collection, 120 music videos had been placed on (https://www.last.fm) with affective tags and then 40 music videos in arousal, valence, like/dislike, dominance, and familiarity levels selected as stimulants via poll. The EEG signals of the DEAP dataset were used here to apply functional connectivity methods as the principal procedure. It should be noted that they have recorded 32 electrodes of EEG signals by 32 active AgCl electrodes using the Biosemi system (Koelstra et al. ,2012) at a sampling rate of 512 Hz by the international 10-20 system. Participants rated self-assessment manikins (SAM) from 1 to 9 for valence, arousal, dominance, and liking (1 to 5) after watching each music video.
In the field of emotion analysis, valence, and arousal are the main domain of interest as the most important factors of emotion assessment (see Kensinger, 2004; Sourina and Liu, 2011). Hence, the other emotional conditions (like/dislike, dominance) were ignored. Accordingly, in the DEAP dataset, the label of affective task can be divided into two dimensions and four parts as high valence (HV) /arousal (HA) level (> 5) and low valence (LV)/arousal (LA) level (< 5).
The concept of connectivity in the brain can be divided into 3 categories: anatomical connectivity, functional connectivity, and effective connectivity. Anatomical connectivity refers to a set of synaptic connections. To depict this connectivity, using Diffusion Tensor Imaging (DTI) to estimate the number of water molecules within neuronal fibers. Functional connectivity is defined as the statistical dependence between the activity patterns of neurons in two distinct brain networks (Anzellotti and Cautanche, 2018). Effective connectivity is a measure based on the causality principle that helps us to detect which nervous system drives other ones along with the mathematical complexity, although this connectivity gives more comprehensive information (see Bastos and Schoffelen, 2016). Here the focus is on functional connectivity to detect the emotional condition of the brain based on time and frequency domain in EEG signals. These methods have been described in the following subsections.
2.2.1 Pearson's correlation connectivity
Pearson's correlation is one of the oldest and most well-known measurements to estimate linear correlation in the time domain between two signals of
$x\left(t\right)$ and $y(t)$ at zero lag (Bravais, 1844; Galton, 1886; Pearson, 1895). The range of linear correlation is $-1\leq{}R_{xy}\leq{}1$, which -1 indicates a complete inverse linear correlation between the signals, 0 means no linear interdependence and 1 is evidence of a complete direct linear correlation between two time-series (cf., Niso et al., 2013). Pearson's correlation is calculated as the following equation:
where $x\left(k\right)$ and $y(k)$ are time series which here represent the recorded EEG signals from two distinct electrodes, and N is the total number of samples in time.
2.2.2 Mutual information connectivity
The mutual dependence of two variables (information about one variable that is accessible by having the other variable) is calculated by mutual information (Cover and Thomas, 1991; Shannon and Weaver, 1998). Relative to methods such as Pearson correlation in which just linear dependence between real values is evaluated, mutual information can detect (if any) high order correlations even between non-real variables. Mutual information is defined as the following equation (Niso et al., 2013) :
where $x$ and $y$ are time series (EEG signals) of two EEG electrodes, $p\left(x\right)\ and\ p(y)$ are individual probability distributions relate to EEG time series and $p\left(x,y\right)\ $ quantifies the cross probability of these two variables. According to Eqn. 2, mutual information based on information theory is a measure that quantifies the information of a discrete random variable, $y$, and combination of ($x$,$y$).
Mutual information quantifies shared information between two signals based on probability distributions. Probability distributions are calculated by considering 100 bins for a total range of the data magnitude and then computing the probability of the occurrence of signal samples in each bin. Range of mutual information is $0\leq{}{MI}_{xy}\leq{}\infty{}$. 0 indicates that $x$ and $y$ are independent and any value above 0 shows that $x$ and $y$ have some value of dependency (see Bastos and Schoffelen, 2016).
2.2.3 Magnitude square coherence estimation
Magnitude squared coherence is referred to as correlation in the frequency domain based on the power spectrum between two signals $x\left(t\right)$ and $y(t)$ (Bendat and Piersol, 2011). Range of magnitude square coherence is
$0\leq{}{coh}_{xy}\leq{}1$, in which 0 means no linear dependence between $x\left(t\right)$ and $y(t)$ at the frequency domain while 1 indicates correspondence between $x\left(t\right)$ and $y(t)$ at frequency (f). Magnitude squared coherence is calculated as follows (Niso et al., 2013) :
where $S_{xx}\left(f\right){\ and\ \ S}_{yy}\left(f\right)$ are individual power spectral densities of time series of $x$ and $y$ (EEG signals from two electrodes) that $S_{xx}\left(f\right)={\left\vert{}\hat{x}(f)\right\vert{}}^2$(
$\hat{x}(f)$ is Fourier transform of $x(t)$) and $S_{xy}\left(f\right)$ is cross power spectral density (Fourier transform of cross-correlation between
$x$, $y$).
2.2.4 Phase locking Value Connectivity
Phase locking value is a tool for measuring synchronization between sources of activity. It estimates the relative phase distributed over the unit circle. This quantity is calculated by (Tass et al., 1998):
where $\Delta\phi_{rel}\left(t\right)$ is instantaneous phase difference at time t between two EEG time series of
$x$ and $y$ and $\left\langle . \right\rangle$ indicates time average. Range of phase-locking value is $\ 0\leq{}PLV\leq{}1$. 0 means that likely, the relative distribution of phase-difference between two electrodes is uniformly distributed, while one is achieved if and only if the condition of strict phase locking is obeyed: phase difference is constant, and thus, complete phase synchronization is being detected (see Niso et al., 2013).
To find the relationship between the functional connectivity of brain signals and intrinsic emotional states, at first, noise-free EEG signals (already preprocessed data (Koelstra et al., 2012) were filtered in four frequency bands, namely: Theta (3-7 Hz), Alpha (8-13 Hz), Beta (14-30), Gamma (30-47) using Butterworth bandpass filters of order 4. The range of 1-47 Hz was also evaluated as a wide-band condition. Preprocessing had been performed by downsampling the recorded 512 Hz EEG signal to 256 Hz (Koelstra et al., 2012).Then we extracted functional connectivity features from all frequency bands and all possible pairs of 32 electrodes for each subject. As a result, we have a 32 × 32 matrix (with 1024 components) with the value of connectivity for each electrode pair and each subject. Fig. 1 illustrates a sample matrix of functional connectivity measured using the PLV method. The colors in Fig. 1 show the values of PLV. As the functional connectivity measures are symmetric, we have used only the values of upper triangle of this matrix to remove repetitive features. So, we have totally 496 features for each subject (after removing diagonal elements).
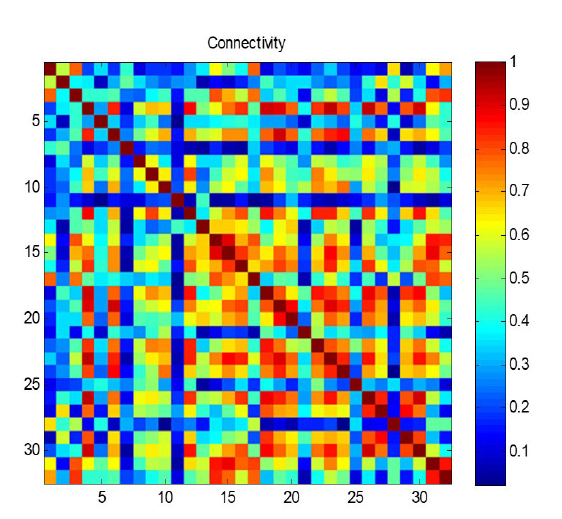 Figure 1.
A sample matrix of connectivity between all 32 × 32 electrode pairs, which is measured based on the PLV method. In this figure, colors illustrate the magnitude of functional connectivity. The connectivity (PLV) in this example, matrix ranges between 0 and 1, where dark blue is zero, and dark red indicates the value of 1.
The classification using four kinds of functional connectivity measures, namely, Pearson’s correlation coefficient (Corr), Phase locking value (PLV), mutual information (MI) and Magnitude square coherence estimation (MSCE). Three types of classifiers, namely naïve Bayesian, KNN, and linear SVM, were considered here. Each classifier was evaluated using leave-one-out cross-validation on the DEAP database to ide.pngy subject’s emotional level in valence and arousal dimensions. The procedure was repeated 100 times by randomly subsampling from all trials of two considered classes such that there was the same number of trials in each class. After calculating the main classification performances, to evaluate the significance of the obtained values, the distribution of those performances was compared with a chance distribution. Chance performance was calculated by randomly shuffling the labels. As the performances follow a normal distribution, then the t-test as a statistical test was used to check whether the main performance distribution is significantly distinct from the chance one (significance levels of 0.05 and 0.01). To be sure about the error of true accuracy relative to the estimated one, which was calculated by statistical classifiers, 95% confidence interval of true error was evaluated too by approximating a normal distribution of error around the true error rate, for the used sample size of DEAP dataset.
Classification accuracies and error rates of emotion recognition on valence and arousal for phase-locking value, magnitude squared coherence, Mutual information, and Pearson’s correlation connectivity features in different frequency bands have been calculated. These values are obtained by averaging error rates of all 32 subjects and then calculating the range of 95% confidence interval of true error based on those estimated error rates. For all conditions, the error rate was lower when features from a wide-band group of feature space were used. So, in Fig. 2, a comparable view of accuracies is illustrated for different connectivity measures and different classifiers for wide-band space of features.
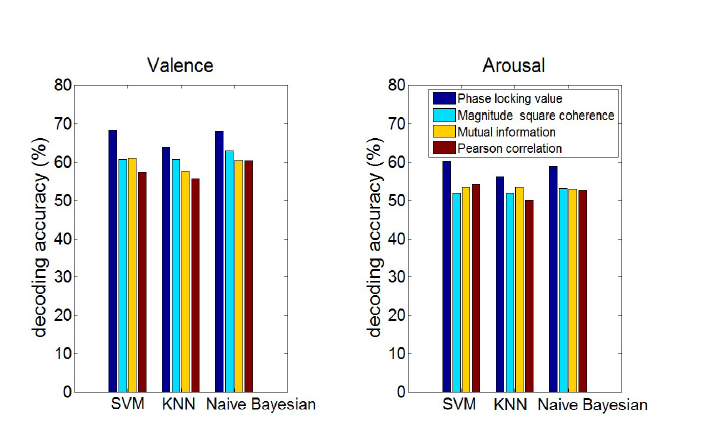 Figure 2.
Decoding accuracies for valence and arousal using different connectivity measures and classifiers when wide-band filtered signals were used for calculation of feature space, colors show decoding accuracy for different input features to the classifiers (which are calculated based on various connectivity measures), dark blue is decoding accuracy for phase-locking value as feature space, cyan for magnitude square coherence, yellow for mutual information and brown for Pearson correlation.
We evaluated the statistical significance of the results by student’s t-test. Errors (accuracies) with ρ < 0.05 (or ρ < 0.01) were considered to be significantly higher than chance level. This significance level was considered in comparison with earlier results, that considered threshold for t-test analysis in (Zhuang et al., 2014) was (ρ < 0.05), in (Torres-Valencia et al., 2014) was (ρ < 0.01) and in Bahari and Janghorbani (2013) was (ρ < 0.01).
Overall, the results show the accuracy of 68.30% (true error with a 95% confidence interval of 28.9-34.5%) for valence and 60.33% (true error with a 95% confidence interval of 36.7- 42.6%) for arousal for wide-band with linear SVM classifier as the best decoding accuracies. In this condition, PLV has higher accuracy than the other features for both valence and arousal states. To be sure, the proportion of true classified single trials for both high and low conditions in each emotional state was checked in the relevant confusion matrix. For example, in one of the best conditions of classification for valence state, 67.9% of high valence and 68.6% of low valence single trials were classified correctly. This indicates that there is no bias to one condition in classification procedure and decoding accuracies are reliable.
For valence, after PLV, MI (wide-band), Corr (beta band), COH (wide-band) have the best accuracies, respectively. On the other hand, COH (wide-band), Corr (wide-band), MI (theta band) demonstrated higher decoding performances respectively for arousal. With naïve Bayesian classifier, decoding accuracy of 68.03% (true error with a 95% confidence interval of 29.1- 34.8%) for valence and 59.94% (true error with a 95% confidence interval of 37.1- 43.1%) for arousal were obtained by using wide-band and beta band features respectively. PLV provided the highest accuracies in compared to the other features for both conditions. After PLV, COH (wide-band), MI (wide-band), Corr (wide-band) for valence and Corr (gamma band), MI (theta band), COH (wide-band) for arousal led to higher accuracies, respectively.
By using KNN classifier, accuracies of 65.41% (true error with a 95% confidence interval of 31.7 - 37.5%) for valence at the beta band and 56.56% (true error with a 95% confidence interval of 40.4 - 46.4%) at alpha band for arousal were achieved for PLV as the best input features. After PLV, COH (wide-band), MI (wide-band), Corr (beta band) for valence, and MI (alpha band) Corr (alpha band), COH (gamma band), for arousal have the best accuracies respectively.
Emotion recognition to (decode emotional states based on the activity of different brain regions) can help assess the neural basis of emotional computations in brain circuits. In particular, the role of between region functional connectivity in the brain for emotion processing. Our results indicated better decoding accuracies compared with Koelstra et al. (2012) which is the main reference for the current dataset. For the valence emotional state, our approach obtained an accuracy of 66.47% compared to Koelstra et al. (2012) which obtained 57.60% with similar method of classification (LOO cross-validation, naïve Bayesian classifier) using different input features. Our results indicate a more accurate outcome compared to Bahari and Janghorbani (2013) for valence emotional state (e.g., 65.41% compared to 58.05%) with similar methods (LOO cross-validation, KNN classifier) except in feature extraction. In other words, most of the previous results are unanimous on the fact that this method of feature extraction improves decoding accuracy of emotional classification (cf., Bahari and Janghorbani, 2013; Chung and Yoon, 2012; Naser and Saha, 2013; Torres-Valencia et al., 2014; Zhuang et al., 2014).
The proposed methods resulted in higher decoding accuracies than accuracies in Torres-Valencia et al. (2014) for both valence and arousal emotional states based on hidden Markov models to classify physiological signals on valence/arousal space, by using only EEG signals. They obtained an accuracy of 55% for arousal and 58.75% for valence. Both of these accuracies were improved by using functional connectivity as input to statistical classifiers. Our results also indicate the possibility of decoding valence emotional information with higher accuracy relative to all other previous works on this dataset using functional connectivity. So, our results demonstrate these kinds of features have a relation to the emotional states of the subjects, meaning that based on pair-electrode-connectivity, one can extract emotional information of EEG signals in single trials.
Consequently, we conclude that functional connectivity plays a major role in emotion processing, such that each emotional state is represented in the brain by a certain pattern of connectivity between different regions. We demonstrated this by machine learning methods which can ide.pngy the amount of information content about some items in its input signals. Different patterns of connectivity for different states of emotion maybe become evident in the strength of connection in a certain network or the situation of engaged networks. This ambiguity about the nature of emotion coding in the pattern of connectivity is recommended to be cleared in future studies, although we found that emotional states are decoded from brain signals with the highest accuracy using PLV. This indicates that phase locking between distinct regions is a highly efficient mechanism of information coding in addition to being a mechanism of information transfer between distinct regions. This is true about the other algorithms of connectivity measurement, although algorithms that measure linear interaction demonstrated less power for information decoding. Many other methods are introduced yet to quantify the amount of connectivity between electrophysiological signals, which are developed to resolve some limitations and deficiencies of traditional methods. Here we evaluated the efficiency of some widely used and less unreliable measurements to introduce a general effect of emotional decoding via connection.
The authors would like to thank the School of Cognitive Sciences of Institute for Research in Fundamental Sciences (IPM) and the Cognitive Sciences and Technologies Council of Iran.
The authors declare no conflict of interest.