

 , Chuan Hu 1,*
1 School of Business Administration, Division of Business administration, Zhongnan University of Economics and Law, 430073 Wuhan, Hubei, China
2 Department of Information Management, School of Management, Wuhan College, 430212 Wuhan, Hubei, China
Abstract
This study investigates how resource orchestration mechanisms shape green technology innovation (GTI) in emerging markets. Drawing on data from 308 manufacturing companies in high-tech zones in China, we employ fuzzy-set qualitative comparative analysis (fsQCA) to uncover the complex configurations of resources, capabilities, and contextual forces that jointly influence GTI. The empirical strategy includes fuzzy-set calibration, necessary condition analysis, truth table construction, and sufficiency assessment of multiple configurations. The results identify five minimized configurations associated with high GTI and four configurations associated with non-high GTI. The high-GTI configurations show that theoretically relevant antecedents are not indispensable in every successful path, whereas the non-high-GTI configurations reveal resource–capability mismatches, including weak resource configuration despite learning or green capability, resource configuration without effective leveraging, and GTL without sufficient learning and green capability. These findings highlight the contingent nature of resource orchestration in emerging markets and offer policy implications for enhancing firms’ green transformations.
Keywords
- green technology innovation (GTI)
- resource orchestration theory (ROT)
- emerging markets
- learning capability
- pathways
Under the imperatives of carbon reduction and global sustainable development, green technology innovation (GTI) has emerged as a strategic approach for emerging markets to address environmental pressures and navigate institutional complexities in the pursuit of sustainable development (Van Trung et al., 2025). However, the GTI entails high investment requirements, technical barriers and considerable uncertainty. The GTI remains restricted by structural obstacles unique to emerging markets, including limited resources and inadequate capabilities (Yang et al., 2024; Abdullah et al., 2016).
Scholars have mainly explored the driving mechanisms of corporate green innovation from two perspectives. Some studies emphasize external drivers, such as institutional tools, environmental supervision, policy incentives, carbon trading mechanisms, and green credit, which exert pressure on enterprises through legitimacy or incentives (Yi et al., 2020; Zhang et al., 2024; Wang et al., 2022). Others focus on internal capacity, such as organizational learning, cross-border cooperation, and leadership in the innovation process (Albort-Morant et al., 2018; Tu and Wu, 2021; Tang et al., 2025; Hameed et al., 2023). However, the realization of the GTI in emerging markets is far from being driven by a single factor. The literature rarely reveals the interactive mechanism between environmental pressure and resource capacity and ignores the diversity, stage, and structural characteristics of corporate green innovation.
Resource orchestration theory (ROT) emphasizes that a corporation’s competitive advantage depends on managers’ ability to acquire, integrate, and leverage resources in specific situations. This differs from the resource-based view (RBV), which focuses on static resource endowments, and the dynamic capabilities view (DCV), which highlights the evolution of these capabilities. Some studies have focused on the action of a single resource element or leadership behavior, such as green knowledge and leadership (Xiao et al., 2024; Arici and Uysal, 2022). Others have explored the path to achieving GTI in enterprises at multiple levels (El Baz et al., 2022; Maihaiti et al., 2025). However, these studies often stop at describing elements or processes and have not yet revealed the dynamic and causal complexity inherent in the resource scheduling.
To address these theoretical gaps, we constructed a GTI multi-path analysis framework with ROT and used the causal research tool fuzzy-set qualitative comparative analysis (fsQCA). We aim to answer the following questions: What key factors influence the realization of corporate GTI? How do multiple differentiated paths lead to the GTI? How do these paths reflect the diversity of resource allocation and management behaviors?
We have broken through the previous analytical paradigm that uses resource capabilities as isolated explanatory variables. By revealing the mechanisms of enterprises in the process of resource construction, we expanded the explanatory boundaries of ROT for complex goal-oriented organizational management behaviors.
Green technology innovation (GTI) generally refers to innovative activities in which enterprises integrate environmental goals into products or management processes and realize economic value by reducing pollution or developing alternative green technologies (Liu et al., 2024). This concept emphasizes technological change and encompasses dimensions such as green product design, clean production, resource recovery, and green supply chain management. It can be further divided into two categories: incremental and disruptive, corresponding to the optimization of existing processes and the establishment of new paradigms. We define GTI as a technological innovation that adapts to the environmental needs of emerging economies in terms of product design, production processes, and organizational systems. This highlights the heterogeneity and nonlinearity of its development path, which stems from the interaction between technological, regulatory, and organizational factors.
Early research focused on enterprises’ passive responses to environmental pressures, emphasizing the role of institutional factors, such as environmental regulations, green subsidies, and carbon trading, in stimulating innovation (Cui et al., 2022; Yang et al., 2023; Lyu et al., 2022). As research deepens, scholars have begun to focus on the internal capabilities of enterprises, attempting to explain the endogeneity of green innovation behavior through organizational culture, employee participation, R&D capabilities, and organizational learning (Imran et al., 2021; Surono et al., 2024; Ma and Wang, 2024; Abdelfattah et al., 2025). However, most studies still use variable-centered methods (such as regression analysis), focusing on the marginal effects of a single driving factor, which makes it difficult to reveal the formation mechanism of multiple innovation paths under complex conditions.
Following ROT, resource orchestration consists of structuring, bundling, and leveraging. Building on this, we operationalize resource orchestration as two practice-oriented dimensions: resource configuration (RC) and resource leveraging (RL), which correspond to the reorganizing and deploying activities emphasized in ROT (Sirmon et al., 2007; Sirmon et al., 2011). The GTI is widely considered to have a multi-dimensional structure. Many studies use the GTI to reflect technological achievements or emphasize its role in organizational change and capacity transformation (Horbach, 2008; Chen, 2008; Li et al., 2017; Xie et al., 2019). Furthermore, the GTI is a key indicator of improved environmental performance, such as emission reduction and energy efficiency improvements (Li et al., 2023). Given the diversity of variables within the GTI, we used RC and RL as the core dimensions of resource orchestration to construct the green innovation framework. First, RC and RL are parts of ROT that reflect an enterprise’s dynamic adjustment capabilities under resource-constrained conditions. Second, corresponding to the green innovation process, they represent green knowledge reorganization and green technology deployment, serving as the causal mechanisms of green innovation output. Finally, RC and RL have mature scale foundations in terms of conceptual differentiation and quantifiable measurement, enabling them to reflect firms’ resource behavior (Kelliher et al., 2020). In contrast, resource bundling is often related to resource integration, and the distinction between the two is not obvious, which may lead to repeated measurement (Zobel, 2017).
However, Helfat and Peteraf (2015) pointed out that the effectiveness of resource organization is dependent on the context, and the results vary in different institutional environments. In emerging markets, institutional uncertainty and market opacity are likely to increase the cost of acquiring key green technology resources. In addition, managers’ cognitive path dependence may weaken their ability to continuously reorganize resources. Without considering these boundary conditions, the linear relationship between resources and performance in advanced economies may be difficult to generalize to emerging markets. This implies that RC and RL may produce effects that deviate from the classic ROT predictions. Conversely, their impact on innovation may depend more on the availability of alternative capabilities to compensate for resource disadvantages (such as absorption capacity or green production capacity). Therefore, the research hypotheses proposed in this study adopt a conditional interpretation rather than assuming universal and linear effects.
The RC is the starting point of the ROT. This is a dynamic process. During this process, organizations acquire, accumulate, and integrate the key resources. The goal is to build capabilities and support strategic objectives. This process focuses on resource availability and how an organization combines dispersed resources into a valuable capability portfolio. The cognitive capabilities behind resource integration determine how resources are restructured as part of an organizational strategy. The positive impact of resource acquisition on green performance is significant when an organization possesses a high degree of integration capability (Zameer et al., 2022). Studies have emphasized that RC is a crucial link in transforming potential resources into innovative outcomes. On the one hand, empirical research based on ROT shows that intelligent transformation significantly improves the innovation quality of manufacturing enterprises by optimizing the allocation of key resources, such as capital and information (Liu et al., 2025a). However, for big data and digital capabilities to create added value for green innovation, it also depends on the effective integration and allocation of human, technological, and organizational resources by enterprises (Kalyar et al., 2024). This indicates that RC may affect the commercialization of green technologies. In emerging markets, firms are more likely to restructure their internal resources to compensate for environmental constraints and support innovation. Based on the above, we propose the following research hypothesis:
H1a: In emerging markets, firms with stronger, green-oriented resource allocation are more likely to achieve GTI, if they possess sufficient organizational capabilities.
RL refers to a firm’s ability to maximize resource utility by coordinating its resource base to translate its strategic performance. In this study, RL emphasizes resource deployment within green strategies, including cross-sectoral collaboration and rapid response. Multiple studies have shown that cross-sectoral resource collaboration facilitates the integration and reallocation of green knowledge and technologies, thereby enhancing green product innovation performance (Dong et al., 2025; Chen and Chang, 2013; Albort-Morant et al., 2016). This indicates that in green innovation, the role of RL lies in placing the knowledge elements in the right positions. Kalyar et al. (2024) emphasized that when RL mechanisms are sufficiently flexible, green knowledge can be transformed into product and process innovations more quickly. Aboelmaged and Hashem (2019) further stressed that absorptive capacity plays a key enabling role in the adoption of green innovations. Higher absorptive and transformation capabilities can enhance the likelihood of resource flows and reorganizations induced by the RL being transformed into the GTI. Based on this, we propose the following research hypothesis:
H1b: Given a certain level of resources and capabilities, a stronger RL capability is more likely to facilitate a company’s GTI.
Notably, in emerging market scenarios with a lack of complementary assets and insufficient organizational capacity, the direct promoting effect of RL on innovation may be weaker than that in mature economies (Helfat and Peteraf, 2015). Therefore, in this study, H1b is designed as a conditional expectation, a conditional association proposed based on the resource constraints of emerging markets.
Environmental pressure refers to the external institutional constraints that firms face (Zhu and Sarkis, 2004; Delmas and Toffel, 2008). This concept includes two types of pressure: one type is mandatory pressure, such as institutional regulations, environmental laws and regulations, pollution emission standards, and carbon emission limits. The other type is normative pressure, such as market demand for green consumption, social expectations, industry ethical standards, and media oversight (DiMaggio and Powell, 2000). Wang et al. (2023) and Liu et al. (2025b), through their analysis of global soybean trade networks, found that firms’ GTI behavior is embedded in multi-layered institutional and network structures. For example, changes in network centrality, community structure, and trade dependence can systematically reshape the transmission patterns of environmental risks across regions and alter the distribution of sustainability pressures borne by firms. Chen et al. (2024) pointed out that financial infrastructure (such as financial inclusion) can drive GTI by alleviating financing constraints. These studies indicate that GTI is not merely a result of a firm’s capabilities but is embedded within a broader structural framework. However, ROT points out that a firm’s resource behavior is not isolated but embedded within its environmental and organizational cognitive. External pressures alone are insufficient to trigger significant green innovation, and firms should be combined with a firm’s internal capability.
Green transformational leadership (GTL) is considered a key organizational mechanism for explaining the differences in corporate green innovation. It refers to how leaders guide employees to enhance their environmental responsibility awareness and actively engage in green innovation activities by shaping a green vision, strengthening their identification with environmental values, and inspiring their intrinsic motivation (Robertson and Barling, 2013; Mittal and Dhar, 2016). ROT emphasizes that external pressure alone does not automatically trigger green innovation; it requires management’s interpretation, integration, and internal mobilization of these signals to translate them into action plans for resource structuring and capacity building. In other words, leaders are both “contextual signal interpreters” and “organizational action activators”: on the one hand, GTL can transform vague institutional pressures into clear strategic directions, enabling employees to understand the necessity of green innovation; on the other hand, leaders transform external expectations into actionable capacity-building pathways within the organization through cross-departmental coordination, knowledge-sharing systems, and the cultivation of a green culture. Several studies have shown that GTL is positively correlated with green product development, clean process adoption and green patent output (Awan et al., 2023; Niazi et al., 2023; Begum et al., 2022). In emerging markets, leaders’ green values and behavioral orientations are considered to compensate for institutional deficiencies and stimulate endogenous willingness to change (Mabkhot, 2024). Teams with a green change orientation are more likely to proactively allocate resources, promote cross-departmental green collaboration, and adjust performance goals, thereby improving the GTI. Based on the above analysis, we propose the following research hypotheses:
H2: In emerging markets, firms with stronger green transformational leadership are more likely to achieve GTI.
Organizational learning capability (OLC) refers to an enterprise’s ability to identify, acquire, integrate, and apply new knowledge in a constantly changing environment (Fiol and Lyles, 1985). ROT posits that resources cannot be directly transformed into competitive advantages and that the potential value of resources can only be realized through the construction of organizational capabilities (Heavey et al., 2015). In this study, OLC is defined as the ability of enterprises to perceive, absorb, transform, and utilize external green knowledge, such as environmental protection policies, green production standards, and low-carbon technologies. Studies have found that OLC can help enterprises capture institutional signals and technological trends of green transformation and improve the efficiency of green knowledge diffusion within the organization (Cohen and Levinthal, 1990; Dangelico and Pujari, 2010). In summary, we propose the following hypothesis:
H3: Enterprises with higher organizational learning capabilities are more likely to achieve GTI.
Green capability (GCAP) focuses on environmental performance and sustainable innovation, including green product design, process reconstruction, and technology research and development (R&D). GCAP helps improve the integration efficiency of green products, process development, and strengthens technology absorption and diffusion (Al-Ali and O’Mahony, 2025; Mellett et al., 2018). Companies with strong GCAP are more likely to establish cross-functional green collaboration mechanisms, thereby accelerating the transformation of their green projects. Combined with ROT, GCAP is an organizational capability formed by creating green strategies, reorganizing resources, and matching multilevel elements. Research highlights the multidimensional mechanisms underlying GCAP. In the manufacturing industry, Borah et al. (2025) found that the synergy between green operations, transactions, and technology development capabilities can significantly promote green product innovation. Aboelmaged (2018) showed that GCAP was positively correlated with green value co-creation and green innovation based on a study of emerging market companies, emphasizing the mediating role of GCAP in improving green performance. In summary, we propose the following hypothesis:
H4: Firms with higher green capabilities are more likely to achieve GTI.
We constructed an integrated analytical framework based on ROT, which revealed that enterprises achieve GTI through multiple paths, as shown in Fig. 1. This framework reflects the synergistic effects of multiple paths, such as resource behavior, capability building, environmental factors, and leadership factors, in promoting the GTI performance of enterprises.
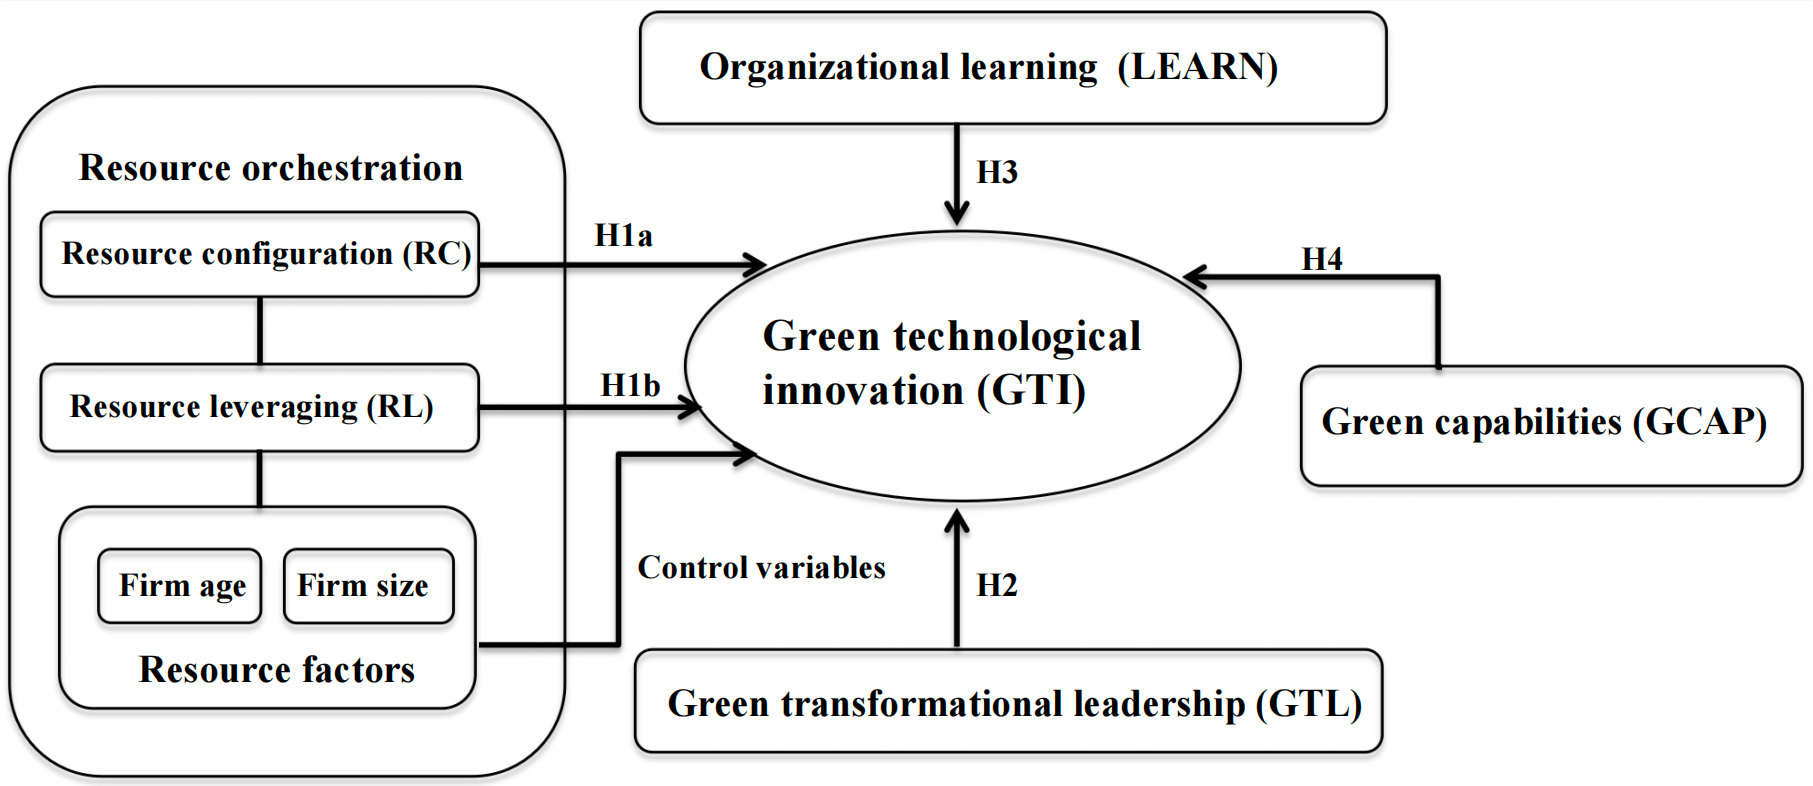 Fig. 1.
Framework of multi-path mechanisms for green technology innovation.
Since fsQCA is well suited to the theoretical causal structure of this study, capable of capturing complex causality, equifinality, and causal asymmetry (Ragin, 2008; Fiss, 2011; Schneider and Wagemann, 2012), and because these features are consistent with the configurational logic emphasized in Resource Orchestration Theory (Sirmon et al., 2007; Fiss, 2007), we employ fuzzy-set qualitative comparative analysis to examine how combinations of RC, RL, GTL, LEARN, and GCAP jointly lead to high GTI. Accordingly, the configurational model is expressed as:
where
FsQCA was performed using R version 4.3.2 (R Foundation for Statistical Computing, Vienna, Austria) and the Qualitative Comparative Analysis (QCA) package version 3.23, an R package available from the Comprehensive R Archive Network (CRAN). Following Ragin (2008) and Schneider and Wagemann (2012), all constructs were calibrated using the direct method. RC, RL, GTL, LEARN, GCAP, and GTI (originally measured on 5-point Likert scales) were transformed into fuzzy sets using 1-3-5 anchors corresponding to full non-membership, the crossover point, and full membership. Firm age and firm size were calibrated as ordinal fuzzy sets to ensure comparability across organizational characteristics. After calibration, a truth table was generated to represent all the logically possible combinations of the five causal conditions. In line with best practices for medium-to-large samples, the frequency threshold was set to 1, ensuring that empirically relevant but infrequent configurations were retained. For the sufficiency assessment of a high GTI, the consistency threshold was set at 0.80, the widely accepted minimum for establishing a reliable subset relationship. A more conservative threshold of 0.85 was applied to the non-high GTI outcome to minimize the risk of false-positive results. These settings strengthened the reliability of the configuration detection. We conducted a necessity analysis using the 0.90 benchmark proposed by Schneider and Wagemann (2012) to evaluate whether any single condition was an indispensable prerequisite for the GTI. Boolean minimization was applied to derive intermediate and parsimonious solutions that represent sufficient configurations for both high and non-high GTI.
First, we collected data on manufacturing enterprises located in the national high-tech industrial development zones in China. According to the “2024 Evaluation Results of National High-tech Industrial Development Zones” released by the Ministry of Industry and Information Technology (MIIT), the comprehensive strength of the 178 national high-tech industrial development zones across China is mainly concentrated in key national development areas, such as the Beijing-Tianjin-Hebei region, Yangtze River Delta region, Guangdong-Hong Kong-Macao Greater Bay Area, Chengdu-Chongqing region, central region, and northeastern region. These areas are in located in key of the national and regional strategic layouts (MIIT, 2024). Therefore, the six regional divisions used in this study are consistent with the national strategy and have a clear policy basis.
Second, to ensure the sample structure reflects the actual composition of high-tech manufacturing in emerging markets, we adopted a stratified sampling strategy by region and industry. We selected 12 high-tech parks in six major economic regions. These parks are home to a group of mid-to high-end manufacturing enterprises with independent R&D capabilities and a willingness to transform into green enterprises. They represent the differences in the spatial economic development levels and institutions of the high-tech manufacturing industry in China. Specifically, the eastern region (the Yangtze River Delta and the Guangdong-Hong Kong-Macao Greater Bay Area) has a strong economic foundation, concentrated innovation resources, and an earlier start to green technology transformation. Enterprises are more advanced in terms of green R&D investment and resource integration efficiency. The central region (the Rise of Central China) has developed rapidly in recent years under the support of policies and the impetus of industrial transfer, and its green transformation capabilities have gradually improved, but it is still in the growth stage of development. The western and northeastern regions (the Chengdu-Chongqing and Northeast Revitalization Belt) have relatively lagged economic foundations and green innovation capabilities. Enterprises face constraints such as limited access to resources and insufficient institutional support. The diversity of the sample structure ensures that this study can appropriately capture the typical institutional and capability heterogeneity in emerging markets.
Third, within each region, we selected five categories of enterprises: environmental protection equipment, new materials, new energy, energy-saving products, and high-efficiency manufacturing equipment. We considered that the sample allocation for each industry was even to avoid excessive concentration in any single field.
We obtained the email addresses of manufacturing companies through recommendations from local science and technology bureaus, high-tech industrial park management departments, and business partners, focusing primarily on corporate public mailboxes and business contact email addresses. As it was not possible to verify the recipients’ positions or their background in green innovation, the cover email and questionnaire explicitly stated that the survey was intended for middle- and senior-level managers familiar with green innovation practices and resource allocation. Respondents who were unable to complete the questionnaire were asked to forward it to a more suitable colleague.
In total, 620 questionnaires were distributed and 392 were returned, yielding a response rate of 63.23 %. We then applied transparent and objective data-cleaning criteria. We excluded: (1) questionnaires with substantial missing values; (2) straight-line responses where all items had the same score (e.g., all “3”), indicating perfunctory answering; and (3) responses with logically inconsistent information (for example, a firm reported as “small” but simultaneously indicating a very large number of green patents and extremely high R&D intensity). After this procedure, 308 valid questionnaires were retained, corresponding to an effective response rate of 49.68%. This falls within the range of acceptable organizational-level response rates (30%–50%) suggested by Rogelberg and Stanton (2007). Taken together, the stratified sampling design, balanced regional-sectoral distribution and rigorous data-cleaning rules enhance the scientific basis and representativeness of the sample. Table 1 summarizes the demographic characteristics of the final sample.
| Characteristics | Items | Frequency | Percentage (%) |
| Firm age | 1–5 years | 77 | 25.00 |
| 6–10 years | 92 | 29.87 | |
| 11–20 years | 93 | 30.19 | |
| 46 | 14.94 | ||
| Ownership type | State-owned | 62 | 20.13 |
| Private | 154 | 50.00 | |
| Foreign invested | 46 | 14.94 | |
| Joint venture | 46 | 14.94 | |
| Firm size | Small ( |
92 | 29.87 |
| Medium (50–500 employees) | 123 | 39.94 | |
| Large ( |
93 | 30.19 | |
| Industry | Environmental equipment | 62 | 20.13 |
| New materials | 62 | 20.13 | |
| New energy | 62 | 20.13 | |
| Energy-saving products | 61 | 19.81 | |
| High-efficiency manufacturing equipment | 61 | 19.81 | |
| Region | Beijing-Tianjin-Hebei | 62 | 20.13 |
| Guangdong-Hong Kong-Macao Greater Bay Area | 62 | 20.13 | |
| Chengdu-Chongqing Economic Circle | 46 | 14.94 | |
| Yangtze River Delta | 62 | 20.13 | |
| Northeast Revitalization Belt | 46 | 14.94 | |
| Central China Rising Belt | 30 | 9.74 |
Source: Author’s work. Note: All participants were informed of the academic nature of this study before completing the questionnaire. Although we contacted some corporate managers by email in the early stages of the survey to distribute questionnaires or send reminders, this contact information was only used for the recruitment process and was not recorded, stored, or associated with any data. This study was an anonymous, non-intrusive social science questionnaire survey and no personally identifiable information was collected.
We used validated scales adapted to the context of GTI in China’s high-tech manufacturing sector. All constructs were measured on a five-point Likert scale ranging from 1 (“completely disagree”) to 5 (“completely agree”). Table 2 presents the theoretical definitions and sources of the scales.
| Variable | Definition | References |
| Resource configuration (RC) | The extent to which firms acquire, integrate, and recombine key resources to support green technological development. | Sirmon et al. (2007); Kelliher et al. (2020) |
| Resource leveraging (RL) | The firm’s ability to deploy and mobilize green-related resources across units to accelerate product and process innovation. | Hitt et al. (2011); Albort-Morant et al. (2016) |
| Green transformational leadership (GTL) | Leadership behaviors that interpret external environmental expectations, articulate a green vision, and motivate employees to engage in green-oriented innovation. | Robertson and Barling (2013); Mittal and Dhar (2016) |
| Organizational learning capability (LEARN) | The firm’s ability to acquire, share, and internalize green knowledge for innovation. | Jerez-Gómez et al. (2005) |
| Green capabilities (GCAP) | The firm’s capability to apply, integrate, and upgrade green technologies to enhance environmental performance. | Chen (2008) |
| Green technology innovation (GTI) | The extent to which firms develop new green products/processes and achieve measurable improvements in environmental performance. | Horbach (2008); Xie et al. (2019); Li et al. (2017) |
Source: Author’s work. Note: To control for the potential confounding effects of
organizational characteristics on GTI, two control variables, firm age (1–5
years, 6–10 years, 11–20 years,
RC was measured using five items adapted from Sirmon et al. (2007), Kelliher et al. (2020), and related ROT-based studies. These items capture the extent to which firms acquire, integrate, and reconfigure key resources to support green technological development. RL was assessed using five items adapted from Hitt et al. (2011) and Albort-Morant et al. (2016), reflecting firms’ ability to deploy and mobilize green-related resources across units to accelerate product and process innovation. GTL was measured using items adapted from the studies of Robertson and Barling (2013) and Mittal and Dhar (2016). In this study, GTL incorporates leaders’ efforts to interpret external environmental expectations and transform them into actionable organizational guidance, including articulating a green vision, modelling pro-environmental behaviors, motivating employees, and mobilizing cross-departmental collaboration for green innovation. LEARN was measured using five items adapted from Jerez-Gómez et al. (2005), representing a firm’s ability to acquire, share, interpret, and internalize green knowledge. GCAP was measured using items based on Chen (2008) to assess firms’ ability to apply, integrate, and upgrade green technologies to improve environmental performance. GTI was measured using five items adapted from Horbach (2008), Xie et al. (2019), and Li et al. (2017), including green product innovation, green process innovation, and measurable improvements in environmental outcomes such as energy efficiency and emission reduction.
We conducted two rounds of expert reviews to ensure content validity. First, three academic experts in strategic management and green innovation examined the conceptual coverage of the items. Second, five managers from high-tech manufacturing firms evaluated the item clarity and contextual relevance. Based on their feedback, we refined the item wording and removed redundancies while preserving the underlying meaning of the validated scales. A pilot test with 30 managers from two high-tech zones was then conducted to assess item distribution, detect ambiguous wording, and determine completion time; only minor revisions were necessary.
Two firm-level characteristics, firm age (1–5 years, 6–10 years, 11–20 years,
and
We screened the data to ensure data quality and reliability. First, we removed questionnaires with more than 20% missing values to avoid bias due to insufficient information (Hair et al., 2018). Second, we used individual response variance (IRV) and the internal standard deviation of respondents to identify linear or low-effort responses; cases with IRV = 0 or standard deviation below 0.20 were removed because these patterns indicated a lack of meaningful cognitive processing (Huang et al., 2011). Third, we applied a long-string analysis and excluded responses containing more than 12 consecutive identical answers, indicating mechanical or careless responses (Krosnick, 1999). Fourth, we performed logical consistency checks and eliminated cases with unreasonable or contradictory information. For example, some companies reported extremely small sizes but simultaneously claimed an unusually high number of green patents or R&D intensity (Podsakoff et al., 2003). After cleaning, 308 valid questionnaires were obtained, with an effective response rate of 49.68 %, which is within the acceptable range for organizational surveys (Rogelberg and Stanton, 2007).
We conducted multiple tests using the common method bias (CMB). First, following
Podsakoff et al. (2003; 2012), we ensured anonymity and confidentiality for
the respondents to minimize their concerns about the evaluation results.
Predictors and outcome variables were placed in different sections of the
questionnaire, and the order of items was randomized to reduce patterned
responses and prevent respondents from inferring the hypothetical relationships.
Furthermore, we used neutral, unleading language throughout the questionnaire to
reduce social desirability bias. Second, we conducted three statistical
assessments of the CMB. (1) Harman’s single-factor test showed that the first
unrotated factor accounted for 37 % of the total variance, which is below the 50
% threshold typically associated with serious CMB (Podsakoff et al., 2003).
(2) A single-factor CFA model in which all 30 items loaded onto a single latent
construct exhibited extremely poor model fit (
Before conducting reliability and validity analyses, we examined the suitability
of the data for factor analysis, as shown in Table 3. The Kaiser-Meyer-Olkin
(KMO) sampling adequacy measure was 0.938, which was much higher than the
recommended threshold of 0.60 (Kaiser, 1974), indicating that the sample data
were suitable for the factor analysis. The Bartlett’s sphericity test result was
significant (
| Item | Value |
| Bartlett Chi-square | 8170.251 |
| Bartlett p-value | 0.000 |
| KMO Overall | 0.938 |
| RC1 | 0.942 |
| RC2 | 0.941 |
| RC3 | 0.947 |
| RC4 | 0.944 |
| RC5 | 0.958 |
| RL1 | 0.932 |
| RL2 | 0.949 |
| RL3 | 0.928 |
| RL4 | 0.945 |
| RL5 | 0.945 |
| GTL 1 | 0.950 |
| GTL 2 | 0.950 |
| GTL 3 | 0.945 |
| GTL 4 | 0.940 |
| GTL 5 | 0.934 |
| LEARN1 | 0.947 |
| LEARN2 | 0.925 |
| LEARN3 | 0.938 |
| LEARN4 | 0.943 |
| LEARN5 | 0.954 |
| GCAP1 | 0.956 |
| GCAP2 | 0.949 |
| GCAP3 | 0.946 |
| GCAP4 | 0.944 |
| GCAP5 | 0.946 |
| GTI1 | 0.879 |
| GTI2 | 0.935 |
| GTI3 | 0.875 |
| GTI4 | 0.908 |
| GTI5 | 0.892 |
Source: Author’s work. Notes: RC, resource configuration; RL, resource
leveraging; GTL, green transformational leadership; LEARN, organizational
learning capability; GCAP, green capability; GTI, green technology innovation.
Overall KMO = 0.938; Bartlett’s Test of Sphericity
As shown in Table 4, the standardized factor loadings of the scale were all
between 0.691 and 0.932, most of which were higher than 0.70, and the corrected
item-total correlation (CITC) was all higher than 0.64. Cronbach’s
| Variables/Items | Standardized factor loadings | CITC | Cronbach’s |
Cronbach’s |
CR | AVE |
| RC (RC1) | 0.812 | 0.763 | 0.876 | |||
| RC (RC2) | 0.849 | 0.795 | 0.869 | |||
| RC (RC3) | 0.799 | 0.747 | 0.879 | |||
| RC (RC4) | 0.829 | 0.780 | 0.872 | |||
| RC (RC5) | 0.727 | 0.677 | 0.894 | |||
| RC | 0.900 | 0.901 | 0.647 | |||
| RL (RL1) | 0.773 | 0.709 | 0.833 | |||
| RL (RL2) | 0.774 | 0.698 | 0.835 | |||
| RL (RL3) | 0.706 | 0.659 | 0.845 | |||
| RL (RL4) | 0.796 | 0.720 | 0.829 | |||
| RL (RL5) | 0.702 | 0.651 | 0.847 | |||
| RL | 0.866 | 0.866 | 0.564 | |||
| GTL (GTL 1) | 0.905 | 0.883 | 0.951 | |||
| GTL (GTL 2) | 0.895 | 0.872 | 0.953 | |||
| GTL (GTL 3) | 0.908 | 0.882 | 0.951 | |||
| GTL (GTL 4) | 0.911 | 0.890 | 0.949 | |||
| GTL (GTL 5) | 0.929 | 0.905 | 0.947 | |||
| GTL | 0.960 | 0.960 | 0.827 | |||
| LEARN (LEARN1) | 0.903 | 0.878 | 0.946 | |||
| LEARN (LEARN2) | 0.907 | 0.880 | 0.946 | |||
| LEARN (LEARN3) | 0.923 | 0.896 | 0.943 | |||
| LEARN (LEARN4) | 0.903 | 0.880 | 0.946 | |||
| LEARN (LEARN5) | 0.879 | 0.859 | 0.950 | |||
| LEARN | 0.957 | 0.957 | 0.816 | |||
| GCAP (GCAP1) | 0.810 | 0.742 | 0.856 | |||
| GCAP (GCAP2) | 0.782 | 0.730 | 0.859 | |||
| GCAP (GCAP3) | 0.815 | 0.756 | 0.853 | |||
| GCAP (GCAP4) | 0.804 | 0.749 | 0.855 | |||
| GCAP (GCAP5) | 0.691 | 0.642 | 0.879 | |||
| GCAP | 0.885 | 0.887 | 0.611 | |||
| GTI (GTI1) | 0.932 | 0.910 | 0.952 | |||
| GTI (GTI2) | 0.892 | 0.874 | 0.958 | |||
| GTI (GTI3) | 0.904 | 0.884 | 0.956 | |||
| GTI (GTI4) | 0.925 | 0.903 | 0.953 | |||
| GTI (GTI5) | 0.929 | 0.907 | 0.953 | |||
| GTI | 0.963 | 0.963 | 0.840 |
Source: Author’s work. Notes. RC, resource configuration; RL, resource leveraging; GTL, green transformational leadership; LEARN, organizational learning capability; GCAP, green capability; GTI, green technology innovation.
To verify the validity of the six-factor measurement model, we conducted a confirmatory factor analysis (CFA) on all 30 items and compared them with various models. The results are shown in Table 5.
| Model | df | RMSEA | TLI | CFI | ||
| Measurement model | 420.291 | 390 | 1.08 | 0.016 | 0.996 | 0.996 |
| Five-factor model 1 | 781.364 | 395 | 1.98 | 0.056 | 0.947 | 0.952 |
| Five-factor model 2 | 1817.993 | 395 | 4.60 | 0.108 | 0.806 | 0.823 |
| Five-factor model 3 | 2239.925 | 395 | 5.67 | 0.123 | 0.748 | 0.771 |
| Five-factor model 4 | 1109.213 | 395 | 2.81 | 0.077 | 0.902 | 0.911 |
| Five-factor model 5 | 2240.423 | 395 | 5.67 | 0.123 | 0.748 | 0.771 |
| Five-factor model 6 | 842.013 | 395 | 2.13 | 0.061 | 0.939 | 0.945 |
| One-factor model | 5142.981 | 405 | 12.7 | 0.195 | 0.369 | 0.412 |
Source: Author’s work. Note: RMSEA, root mean square error of approximation; TLI, Tucker–Lewis index; CFI, comparative fit index.
The six-factor model fit well:
In contrast, the alternative five-factor models obtained by merging latent
constructs showed a clear deterioration in model fit, with RMSEA ranging from
0.056 to 0.123, partially exceeding the recommended threshold of 0.08, TLI
ranging from 0.784 to 0.947 and CFI ranging from 0.771 to 0.952, with some values
falling below the commonly accepted cutoff of 0.90 (Bentler, 1990). The
The single-factor model had a very poor fit,
Table 6 reports the descriptive statistics and fixed calibration thresholds used in the main fsQCA analysis. The means of the six core variables ranged from 3.116 to 3.534, all above the midpoint of the five-point scale. RC (M = 3.529) and RL (M = 3.534) recorded the highest means, whereas GTI (M = 3.116) was relatively lower, showing that the sampled firms reported stronger resource-orchestration practices than green innovation outcomes.
| Variables | Mean | SD | Min | Max | Full non-membership | Crossover | Full membership |
| RC | 3.529 | 0.722 | 1.200 | 4.800 | 1.000 | 3.000 | 5.000 |
| RL | 3.534 | 0.676 | 1.800 | 5.000 | 1.000 | 3.000 | 5.000 |
| GTL | 3.297 | 1.006 | 1.000 | 5.000 | 1.000 | 3.000 | 5.000 |
| LEARN | 3.408 | 0.952 | 1.000 | 5.000 | 1.000 | 3.000 | 5.000 |
| GCAP | 3.344 | 0.730 | 1.400 | 4.800 | 1.000 | 3.000 | 5.000 |
| GTI | 3.116 | 1.017 | 1.000 | 5.000 | 1.000 | 3.000 | 5.000 |
Source: Author’s work. Notes: SD, standard deviation; RC, resource configuration; RL, resource leveraging; GTL, green transformational leadership; LEARN, organizational learning capability; GCAP, green capability; GTI, green technology innovation. Full non-membership, crossover, and full membership refer to the fixed Likert-scale calibration thresholds used in the main fsQCA analysis.
The standard deviations ranged from 0.676 to 1.017. GTL (SD = 1.006) and GTI (SD = 1.017) showed the largest variation, reflecting heterogeneity in leadership practices and green innovation outcomes across firms. GCAP showed the smallest variation (SD = 0.730), indicating a relatively more consistent level of green capability development. The minimum and maximum values are close to the endpoints of the five-point scale, indicating that the variables cover a sufficiently broad range and provide adequate dispersion for calibration (Ragin, 2008).
The calibration adopts the “endpoint + midpoint” principle of Ragin (2008): the lowest scale value (1) and the highest scale value (5) are set as full non-membership and full membership, respectively, while the scale midpoint (3) is used as the crossover point to reflect moderate membership. This method combines theoretically defined scale boundaries with the observed distribution of the construct scores and is in line with the best practices of QCA (Schneider and Wagemann, 2012). The above results verify the distributional adequacy of the construct scores and provide a reliable data basis for subsequent configurational analyses.
Next, with GTI as the outcome variable, a truth table containing five conditional variables (RC, RL, GTL, LEARN, and GCAP) was constructed, all logically possible conditional combinations were listed, and their consistency values were calculated. After setting the consistency threshold to 0.800, the combination paths that met the conditions were screened. Subsequently, the Boolean algebra parsimony rule was used to extract the minimum causal combination, identify the typical path that can achieve high GTI performance, and reveal the synergistic mechanism of conditions such as resources, capabilities, and external pressure (Fiss, 2011).
To verify the robustness of the analysis results, we conducted an independent
fsQCA on non-high GTI performance and reported the path structure of non-high
performance. Simultaneously, combined with the necessary condition analysis, we
tested whether there was a single key condition that was true in all
high-performance cases. The results were judged using consistency (
To assess whether a single condition is indispensable for achieving a high GTI level, this study conducted a fuzzy set necessity test. In set theory logic, a condition can only be considered necessary if its membership degree is consistently greater than or equal to the outcome’s membership degree (Ragin, 2008). Following methodological norms, we adopted 0.90 consistency as the theoretical benchmark for judging necessary conditions; this threshold has been widely used to ensure that necessity relations are substantial and methodologically robust. In addition, we employed two complementary methods for necessity testing: a fuzzy-set necessity test based on fuzzy membership, and a crisp-set necessity test based on a 0.50 cutoff point. This dual validation avoids results depending on a single calibration path and improves the robustness of necessity judgments (Schneider and Wagemann, 2012). Both metrics are listed in Table 7.
| Variables | High GTI | Non-High GTI | ||
| Consistency | Coverage | Consistency | Coverage | |
| RC | 0.833 (0.808) | 0.682 (0.590) | 0.846 (0.810) | 0.599 (0.410) |
| RL | 0.829 (0.797) | 0.676 (0.580) | 0.856 (0.833) | 0.603 (0.420) |
| GTL | 0.739 (0.665) | 0.681 (0.582) | 0.764 (0.690) | 0.608 (0.418) |
| LEARN | 0.770 (0.747) | 0.673 (0.613) | 0.793 (0.683) | 0.599 (0.387) |
| GCAP | 0.778 (0.698) | 0.694 (0.575) | 0.810 (0.746) | 0.624 (0.425) |
| Firm age | 0.606 (0.489) | 0.714 (0.640) | 0.585 (0.397) | 0.595 (0.360) |
| Firm size | 0.598 (0.681) | 0.639 (0.574) | 0.644 (0.730) | 0.596 (0.426) |
Source: Author’s work. Note: RC, resource configuration; RL, resource leveraging; GTL, green transformational leadership; LEARN, organizational learning capability; GCAP, green capability; GTI, green technology innovation. Outside values correspond to fuzzy-set necessity consistency and coverage, whereas values in parentheses report crisp-set necessity results obtained using a 0.50 membership cut-off.
As shown in Table 7, the consistency between RC and RL was highest in the high GTI group (0.833 and 0.829, respectively); however, neither reached the necessity threshold of 0.90. The consistency of LEARN, GCAP, and GTL was also moderate (0.739–0.778), failing to cross the threshold. A similar pattern emerged in the non-high GTI scenario: although the consistency between RC and RL was relatively high, the necessity requirement was not met. Therefore, regardless of whether it is a high or non-high GTI, no single condition constitutes a prerequisite, indicating that green technology innovation is not driven by a single isolated factor but rather is a typical combinational causal outcome.
To explore how firms can achieve high GTI levels through different configurations of factors, we minimized the truth table and extracted relevant configurations. Table 8 lists
the five configurations associated with a high GTI (Paths 1–5). In these configurations, “●” and “
| Causal_conditions | Path 1 | Path 2 | Path 3 | Path 4 | Path 5 |
| RC | |||||
| RL | |||||
| GTL | |||||
| LEARN | |||||
| GCAP | |||||
| Firm age | |||||
| Firm size | |||||
| Consistency | 0.793 | 0.805 | 0.738 | 0.752 | 0.779 |
| Raw coverage | 0.510 | 0.513 | 0.574 | 0.542 | 0.579 |
| Unique coverage | 0.009 | 0.011 | 0.048 | 0.032 | 0.020 |
| Overall solution consistency | 0.695 | 0.695 | 0.695 | 0.695 | 0.695 |
| Overall solution coverage | 0.760 | 0.760 | 0.760 | 0.760 | 0.760 |
Source: Author’s work. Note: Path 1 = ~RC; Path 2 =
~RL; Path 3 = ~GTL; Path 4 =
~LEARN; Path 5 = ~GCAP. RC, resource
configuration; RL, resource leveraging; GTL, green transformational leadership;
LEARN, organizational learning capability; GCAP, green capability; GTI, green technology innovation. “
The consistency values of the five individual paths ranged from 0.738 to 0.805, with raw coverage ranging from 0.510 to 0.579. The overall solution consistency and the overall solution coverage were 0.695 and 0.760, respectively.
We further conducted a sufficiency analysis of the results of the non-high GTI. Table 9 shows the four configuration paths (Paths 6–9) that lead to a non-high GTI. Path 6
= (~RC
| Causal_conditions | Path 6 | Path 7 | Path 8 | Path 9 |
| RC | ● | |||
| RL | ||||
| GTL | ● | |||
| LEARN | ● | |||
| GCAP | ● | |||
| Firm age | ||||
| Firm size | ||||
| Consistency | 0.809 | 0.817 | 0.787 | 0.824 |
| Raw coverage | 0.473 | 0.492 | 0.497 | 0.392 |
| Unique coverage | 0.013 | 0.013 | 0.054 | 0.025 |
| Overall solution consistency | 0.741 | 0.741 | 0.741 | 0.741 |
| Overall solution coverage | 0.623 | 0.623 | 0.623 | 0.623 |
Source: Author’s work. Note: Path 6 = ~RCLEARN; Path 7 =
~RCGCAP; Path 8 = RC~RL; Path 9 =
GTL~LEARN*~GCAP. RC, resource configuration; RL,
resource leveraging; GTL, green transformational leadership; LEARN,
organizational learning capability; GCAP, green capability; GTI, green technology innovation. “●” indicates the presence of a condition,
“
As shown in Table 9, the consistency of the four paths ranged from 0.787 to 0.824, the overall solution consistency was 0.741, and the overall solution coverage was 0.623. These results show that the identified configurations are associated with a non-high GTI in the sample and provide a basis for interpreting the resource-capability mismatches discussed below.
To assess whether the fsQCA results were sensitive to the choice of frequency
and consistency thresholds in the truth table, we conducted a series of threshold
sensitivity tests. For the high-GTI models, the main analysis used a consistency
threshold of 0.80, and a frequency threshold of 1. We then re-estimated the truth
table under alternative specifications by varying the consistency threshold
between 0.78 and 0.82, and the frequency threshold between 1 and 2. Across all
these combinations, the solution for high GTI remained identical: the same
configuration was obtained in each run, and the overall solution consistency
(0.695) and coverage (0.760) did not change. For the non-high GTI models, the
main analysis adopted a consistency threshold of 0.85, and a frequency threshold
of 1. We varied the consistency threshold within a narrow range (0.83–0.85) and
the frequency threshold between 1 and 2. In all these alternative specifications,
the core causal conditions (RC, RL, GTL, LEARN, GCAP) continued to appear in the
sufficient configurations, and the overall solution consistency and coverage
remained within a comparable range (consistency
To verify the robustness of the fsQCA analysis results, this study further uses necessary condition analysis (NCA) for supplementary testing. NCA can identify whether there are bottleneck conditions in the process of achieving a high level of outcome variables (such as the GTI); that is, certain conditions must be achieved to a minimum degree before the outcome is achieved (Dul, 2016). By drawing a ceiling line, this method can not only quantify the strength of the necessity of the conditional variable but also determine its significance. We used two ceiling estimation methods, ceiling envelopment–free disposal hull (CE-FDH) and ceiling regression–free disposal hull (CR-FDH), to improve the robustness of the conclusions, as shown in Table 10.
| Condition | Method | Accuracy | Ceiling zone | Range | Effect size d | p value |
| RC | CE-FDH | 100% | 1.360 | 14.400 | 0.094 | 0.555 |
| CR-FDH | 99.40% | 1.135 | 14.400 | 0.079 | 0.489 | |
| RL | CE-FDH | 100% | 0.880 | 12.800 | 0.069 | 0.401 |
| CR-FDH | 98.40% | 0.961 | 12.800 | 0.075 | 0.241 | |
| CONTEXT/GTL | CE-FDH | 100% | 0.240 | 16.000 | 0.015 | 0.871 |
| CR-FDH | 100% | 0.120 | 16.000 | 0.007 | 0.861 | |
| LEARN | CE-FDH | 100% | 1.200 | 16.000 | 0.075 | 0.111 |
| CR-FDH | 98.40% | 1.031 | 16.000 | 0.064 | 0.129 | |
| GCAP | CE-FDH | 100% | 0.800 | 13.600 | 0.059 | 0.468 |
| CR-FDH | 99.40% | 0.600 | 13.600 | 0.044 | 0.448 | |
| Firm Size | CE-FDH | 100% | 0.000 | 8.000 | 0.000 | 1.000 |
| CR-FDH | 100% | 0.000 | 8.000 | 0.000 | 1.000 | |
| Firm Age | CE-FDH | 100% | 0.000 | 12.000 | 0.000 | 1.000 |
| CR-FDH | 100% | 0.000 | 12.000 | 0.000 | 1.000 |
Source: Author’s work. Note: RC, resource configuration; RL, resource leveraging; GTL, green transformational leadership; LEARN, organizational learning capability; GCAP, green capability; CE-FDH, ceiling envelopment–free disposal hull; CR-FDH, ceiling regression–free disposal hull.
The results of the NCA based on the CE-FDH and CR-FDH methods show that the effect size d of all conditions is less than 0.1 (the highest value being 0.094). The effect size in NCA is divided into three levels: 0–0.1 is a negligible effect, 0.1–0.3 is a medium effect, and 0.3–0.5 is a large effect (Dul, 2016). The results indicated negligible effects.
The permutation test p-values for all conditions were greater than
0.05. According to Dul et al. (2020), when p
Comparing parsimonious, intermediate, and conservative solutions is an established robustness procedure in fsQCA. As noted by Schneider and Wagemann (2012), solution robustness is demonstrated when the core causal structure remains stable across the different treatments of logical remainders. Fiss (2011) similarly argues that researchers should examine whether core conditions persist across solution types to ensure that the results are not artifacts of assumptions regarding unused configurations. In this study, the core conditions remained unchanged across all three solution sets, indicating that the configurational results were robust.
To examine whether the configuration results depend on the chosen calibration
scheme, we used percentile-based alternative calibration methods (5th/50th/95th
percentiles) for robustness testing. The same five core conditions (RC, RL, GTL,
LEARN, and GCAP) consistently appeared in both the high and non-high GTI full
configurations. For non-high-GTI, the percentile-based calibration scheme yielded
a solution with high overall consistency (
We explored how high-tech manufacturing in emerging markets achieves GTI through various resource orchestration strategies. Based on the fsQCA of 308 manufacturing enterprises in China’s high-tech zones, we identified five configurations associated with high GTI (Paths 1–5) and four configurations associated with non-high GTI (Paths 6–9).
We identified five configuration paths associated with a high GTI (Paths 1–5). As shown in Table 8, the minimized expressions of these paths are characterized by the absence of one focal condition: Path 1 = ~RC, Path 2 = ~RL, Path 3 = ~GTL, Path 4 = ~LEARN, and Path 5 = ~GCAP. The high-GTI configurations reveal three boundary-oriented mechanisms: (1) resource-orchestration boundary paths, (2) capability-boundary paths, and (3) environmental context-oriented leadership boundary paths. These mechanisms provide new empirical evidence for the conditional applicability of the ROT in emerging markets.
Category 1: Resource-orchestration absence paths (Path 1 and Path 2)
Paths 1 and 2 relate to resource orchestration. Path 1 shows that firms with weak RC may be associated with high green innovation. This does not imply that resource configuration inhibits the GTI. Instead, it qualifies the assumption that a high GTI must always begin with a strong resource configuration. Resource acquisition, integration, and recombination are important for converting green-related resources into innovative outcomes (Sirmon et al., 2007; Sirmon et al., 2011). However, Table 8 shows that the RC is not indispensable in every high-GTI path. Thus, Path 1 supports and provides a boundary condition for H1a.
Path 2 presents a similar boundary for the RL. The absence of RL in this path means that strong resource leveraging is not a necessary condition for every high-GTI configuration. Prior studies have shown that resource mobilization and cross-functional coordination facilitate the recombination of green knowledge and accelerate innovation (Albort-Morant et al., 2018; Kalyar et al., 2024). The present results suggest that RL contributes to GTI conditionally rather than functioning as an independent or universal driver.
Interestingly, H1b is not directly supported by high-GTI configurations. Among the five paths associated with high GTI, RL appears in its negated form in Path 2 and does not appear as a key condition in Paths 1, 3, 4, and 5. This indicates that in emerging markets, resource leveraging alone is not sufficient to explain the high GTI. As Sirmon et al. (2011) noted, the contribution of resource orchestration depends on the context in which resources are structured, bundled or leveraged. Compared to mature markets, emerging market firms may treat resource leveraging as a supporting process rather than an independent trigger of green innovation (Barney, 1991; Helfat and Peteraf, 2003). Thus, the role of RL in this study is best understood as being context-dependent and conditional.
Category 2: Capability absence paths (Path 4 and Path 5)
Paths 4 and 5 are related to the formation of capabilities. Prior studies on absorptive capacity and green innovation emphasize that LEARN and GCAP play important roles in GTI because they help firms absorb, disseminate, and apply green knowledge (Cohen and Levinthal, 1990; Dangelico and Pujari, 2010). Path 4, however, contains ~LEARN. This implies that high-GTI configurations do not require organizational learning capabilities to appear in every successful path. This result places a boundary on H3 and shows that learning capability should not be treated as universally indispensable across all high-GTI configurations.
Path 5 contains ~GCAP. This means that mature green capability is not retained as a necessary component in every high-GTI path. Previous research has shown that GCAP can stimulate environmental performance and green innovation by strengthening firms’ ability to apply and upgrade green technologies (Borah et al., 2025; Chen, 2008). However, Path 5 supports and refines H4 by showing that GCAP is not a universal condition for a high GTI.
Paths 4 and 5 both revise the capability-dominated interpretation of the original discussion. Capabilities remain central to the theoretical explanation of how resources generate value (Helfat and Peteraf, 2003), but the high-GTI results show that capability formation should be understood as being contingent. In other words, LEARN and GCAP may enhance GTI in some configurations, but a high GTI is not reducible to the prior possession of strong organizational learning capability or mature green capability.
Category 3: Leadership absence path (Path 3)
Path 3 supports H2 and narrows the scope of H2 by showing that GTL should be understood as a contingent, rather than a universally indispensable, antecedent of GTI. Prior studies have shown that Strong GTL may facilitate GTI in some contexts because external pressure alone does not automatically generate organizational change; it must be interpreted and enacted internally (DiMaggio and Powell, 2000). GTL can articulate green visions, mobilize employees, and guide firms toward sustainable initiatives (Robertson and Barling, 2013; Mittal and Dhar, 2016). However, Path 3 shows that a high GTI is not confined to firms in which green transformation is primarily leader-driven. This finding is consistent with the asymmetric logic of fsQCA: a condition that is theoretically beneficial when present does not necessarily become a barrier when absent. GTL remains an important managerial mechanism in ROT, but its contribution to GTI depends on the broader resource and capability context in which it operates (Sirmon et al., 2007; Wang et al., 2023; Chen et al., 2024).
From an economic perspective, the 1–5 boundary reflect the structural heterogeneity of China’s high-tech manufacturing sector. Firms differ in terms of regional policy support, technological intensity, resource access, and organizational maturity. Such heterogeneity implies that a high GTI may not follow a single dominant recipe. Firms in more supportive regions or technology-intensive industries may have different starting points than those in less developed regions. Therefore, the configurational patterns observed in this study are consistent with regional policy heterogeneity and industry-level technological intensity, while also confirming that the role of each antecedent depends on its configuration.
Category 1: Insufficient resources and mismatched capabilities (Path 6, Path 7)
The four configurations associated with a non-high GTI reflect different structural breakdowns. Path 6 involves a weak RC combined with the presence of LEARN. Although firms may absorb green knowledge, they lack a structural foundation to convert this knowledge into GTI results. This reveals a boundary condition for both H1a and H3. LEARN capability cannot be translated into green innovation without a minimum level of RC. Path 7 contains a weak RC but a strong GCAP. Firms possess technical proficiency in green development but cannot mobilize or sustain the resources necessary. This configuration supports prior claims that capabilities require structural support for effective performance outcomes (Zameer et al., 2022). This indicates that H4 is only conditionally valid and depends on the presence of an adequate RC.
Category 2: Lack of capability and failure of environmental drive (Path 8, Path 9)
Path 8 consists of a strong RC but weak RL. Firms accumulate resources but fail to redeploy them effectively because of insufficient coordination and cross-functional integration. Albort-Morant et al. (2018) argued that a lack of resource mobility weakens innovation potential. This configuration reinforces the idea that H1a is insufficient for achieving green innovation unless complemented by stronger RL abilities, thereby providing further insights into the conditional nature of H1b. Path 9 features GTL without LEARN capability or a GCAP. Although leadership articulates environmental expectations, firms lack the ability to absorb or operationalize these expectations. This configuration demonstrates that H2 depends on the presence of internal capabilities in firms. Without such capabilities, leaders cannot translate external and internal pressures into innovative outcomes. Collectively, the non-high pathways do not directly contradict the hypotheses but reveal the structural and capability conditions necessary for the hypotheses to hold.
This study examined how firms in emerging markets achieve GTI through configurations of resources, leadership, and capability conditions. Drawing on ROT and applying fsQCA, we identified five configurations associated with high GTI and four configurations associated with non-high GTI. The high-GTI configurations delineate the conditions under which RC, RL, GTL, LEARN, and GCAP are not universally indispensable, whereas the non-high-GTI configurations reveal how partial strengths may fail to translate into green innovation when resource configuration, leveraging, and capabilities misalignment occurs. Complementary NCA results further show that no single factor functions as a deterministic bottleneck for GTI, reinforcing the view that green innovation arises from configurational conditions rather than isolated variables.
This study makes several contributions to the ROT and green innovation literature. First, it shows that the GTI in emerging markets does not follow a linear or universal pattern. Rather than treating RC, RL, GTL, LEARN, or GCAP as universal drivers, the findings show that their roles vary across configuration contexts. This extends ROT by shifting attention from whether individual antecedents matter in isolation to how their relevance changes under different combinations of resources, leadership, and capability conditions. Second, this study distinguishes between the boundary conditions for high GTI and the mismatch mechanisms for non-high GTI. The high-GTI configurations show that the absence of one focal antecedent can be accommodated in some successful paths. In contrast, non-high-GTI configurations reveal more explicit resource–capability mismatches, such as learning or green capability without sufficient resource configuration, resource configuration without effective resource leveraging, and GTL without adequate learning and green capabilities. This contrast enriches ROT by showing that isolated strengths do not automatically generate green innovation unless they are aligned with complementary resources and capability conditions. Third, the findings clarify the role of GTL in green innovation in emerging market countries. GTL may facilitate GTI by translating environmental expectations into organizational action; however, it should not be treated as a standalone or universally necessary antecedent. Its effect depends on the surrounding configuration of resources, learning capability, and green capability. This challenges simple linear assumptions about leadership or external pressure and deepens the theoretical understanding of the leadership–resource–capability interaction.
Methodologically, the integration of fsQCA and NCA provides a multi-angle framework for analyzing complex causal patterns. FsQCA identifies configurational patterns associated with high and non-high GTI, whereas NCA confirms the absence of necessary bottleneck conditions, jointly offering a more comprehensive explanation of GTI mechanisms than linear models. The construction of an original dataset of 308 firms across diverse high-tech zones also enriches the empirical evidence on green innovation in emerging markets.
Practically, the results indicate that firms do not need to excel in all dimensions simultaneously to achieve a high GTI. However, the non-high-GTI configurations warn that isolated strengths may not translate into green innovation when they are not supported by complementary resource and capability conditions. Managers should therefore pay particular attention to the alignment between resource configuration, resource leveraging, learning capability, and green capability. For policymakers, the findings highlight the need for regionally tailored support policies that enhance firms’ green absorptive capacity, capability development, and resource coordination. Future research should examine how GTL, internal governance, and capability-building processes evolve over time to further illuminate the dynamic mechanisms behind the orchestration of resources.
ROT, resource orchestration theory; GTI, green technology innovation; fsQCA, fuzzy set qualitative comparative analysis; RC, resource configuration; RL, resource leveraging; GTL, Green transformational leadership; LEARN, organizational learning capability; GCAP, green capabilities.
All relevant data and materials are within the manuscript.
QZ contributed to the conceptualization, methodology, data collection, formal analysis, and drafting of the original manuscript. CH contributed to supervision, validation, interpretation of the results, and critical revision of the manuscript for important intellectual content. Both authors read and approved the final manuscript and agreed to be accountable for all aspects of the work.
Not applicable.
This work was supported by the Zhongnan University of Economics and Law “Scientific Research Innovation Platform Capacity Building” project (Grant No. 31513110812/108, 2023).
The authors declare no conflict of interest.
References
Publisher’s Note: IMR Press stays neutral with regard to jurisdictional claims in published maps and institutional affiliations.