


 , Lin Zhang 2, Ying Yang 2, Yongling Ye 3,*
 , Feimei Liao 2
1 School of Digital Economics and Trade, Guangzhou Maritime University, 510725 Guangzhou, Guangdong, China
2 School of Economics and Management, Jiangxi Normal University, 330022 Nanchang, Jiangxi, China
3 School of Business, Hechi University, 546399 Guangxi Zhuang Autonomous Region, Guangxi, China
Abstract
In the context of rapid digital technology development and the pursuit of “dual carbon” goals, examining whether digital trade enhances corporate green investment efficiency is of critical importance. This study uses the implementation of China’s Comprehensive Pilot Zone for Cross-Border E-Commerce policy as a quasi-natural experiment. Using panel data from A-share listed firms in heavily polluting industries and employing a staggered difference-in-differences approach, the study investigates the effect of digital trade on green investment efficiency. The empirical findings demonstrate that digital trade significantly improves firms’ green investment efficiency. This positive effect operates primarily by increasing research and development (R&D) expenditure, promoting industrial structure upgrading, and strengthening digital platform development. Furthermore, the effect is more pronounced among firms with high media visibility and superior environmental performance. The study offers important policy implications for enhancing green investment efficiency and advancing high-quality economic development.
Keywords
- digital trade
- green investment efficiency
- cross-border e-commerce
- R&D investment
- industrial structure upgrading
- digital platforms development
In recent decades, China’s rapid economic growth has been accompanied by severe challenges, including environmental pollution and resource depletion, with environmental degradation emerging as particularly acute (Duanmu et al., 2018; Deng et al., 2024). According to Yale University’s 2020 Global Environmental Performance Index Report, China ranked 120th among 180 countries, with a score of 37.3, underscoring the urgency of strengthening environmental governance. In response, the Chinese government has actively promoted corporate green transformation to improve environmental quality. However, such transformation demands substantial investment (Tian et al., 2024; Wu et al., 2024). Guiding firms to undertake effective green investment and expand existing investment has therefore become a crucial strategy for addressing environmental challenges and advancing sustainable transition (Tian et al., 2020; Chen and Ma, 2021). Yet, merely expanding the absolute scale of green investment does not necessarily yield proportional environmental benefits. Some firms engage in green projects primarily to avoid penalties or enhance corporate image, which may result in inefficient outcomes (Tian et al., 2024). Moreover, using investment scale as an absolute indicator overlooks heterogeneity in firm size, thereby introducing measurement bias (Liu et al., 2022b). By contrast, green investment efficiency—which captures the environmental improvements achieved per unit of input—offers a more reliable benchmark for evaluating the effectiveness and sustainability of green transformation (Liu et al., 2022b; Li et al., 2023b). Given China’s late start in pursuing green development and relatively lagging environmental governance, the tension between economic growth and environmental sustainability has intensified. Consequently, enhancing corporate green investment efficiency has become an indispensable pathway for achieving China’s green economic transition.
Nonetheless, improving green investment efficiency remains a formidable challenge. Under traditional frameworks, information asymmetry, financing constraints, technological barriers, and managerial inefficiencies often undermine the precision and effectiveness of green investment (Li et al., 2020; De Haas et al., 2025). Identifying new drivers that can systematically optimize resource allocation and alleviate these efficiency bottlenecks is therefore of critical importance. The rapid advancement of digital technologies and their integration with trade have fostered a new paradigm of commerce characterized by internet-based platforms, digital technologies, digital services, and digital delivery (Ma et al., 2019). Digital technologies have deeply penetrated the trade sector, reshaping traditional models, reducing transaction costs, expanding market boundaries, and accelerating China’s integration into the global economy (Power and Singh, 2007; Zhao et al., 2023). According to the 2023 Digital Trade Development and Cooperation Report, China’s cross-border digital services trade reached USD 371.08 billion in 2022, ranking third worldwide. In addition, digital trade has been increasingly recognized as a vital component of the green economic transition (Li et al., 2024). By optimizing production and transaction processes, easing financing constraints, and enhancing trade efficiency, digital trade contributes to green development (Zhang et al., 2022; Wang et al., 2023). Furthermore, digital technologies help reduce energy consumption and carbon emissions, promote ecological civilization, and accelerate sustainable development (Li et al., 2024).
Improving green investment efficiency represents the central bottleneck and an urgent priority in advancing green transformation. In light of the significant potential of digital trade to enhance economic efficiency and promote sustainable growth, several critical questions arise. Within the context of China’s promotion of digital trade and pursuit of the “dual carbon” goals, can digital trade serve as an effective pathway to improve firms’ green investment efficiency? Through which mechanisms can it occur? Do these effects vary across different institutional environments? A systematic examination of the relationship between digital trade and green investment efficiency is essential not only to elucidate the mechanisms through which digital trade influences firms’ green practices but also to provide robust empirical evidence and policy guidance for developing countries seeking to formulate targeted digital trade policies to advance green and high-quality development.
Research on green investment has evolved into a relatively systematic theoretical framework. Scholars have generally conceptualized it as a professional expression of corporate social responsibility that integrates environmental, economic, and social dimensions to create multidimensional value (Chen and Ma, 2021). The existing literature has primarily focused on the determinants of green investment, including economic growth and financial systems (Eyraud et al., 2013; Mnif et al., 2024), stakeholder pressures (Schaltenbrand et al., 2018); corporate Environmental, Social and Governance (ESG) strategies (Villabruna et al., 2024); the trends, paradigms, and structures of green investment (Eyraud et al., 2013; Magalhaes, 2021); and investor responses to green initiatives (Martin and Moser, 2016; Rizvi et al., 2022). However, this body of research has largely concentrated on the scale of investment, without adequately addressing the effectiveness of resource allocation.
In the domain of green investment efficiency, the academic focus has gradually shifted from macro-level analyses to micro-level measurement and methodological innovation. Direct research on green investment efficiency remains limited though. Existing studies have developed efficiency evaluation models (Kim et al., 2015; Fan et al., 2022; Li et al., 2022) and investigated the regulatory roles of financial instruments and environmental policies, such as the marketization effects of green bonds (Shi et al., 2023), the optimization of resource allocation through green credit (Li et al., 2023b; Tian et al., 2024), the efficiency-enhancing “forced mechanism” of environmental regulations (Chen et al., 2023), the influence of managerial green awareness and green human resource practices (Moraes et al., 2019; Munawar et al., 2022), and the role of digital empowerment in enhancing corporate green efficiency (Liao et al., 2023). Despite policy guidance and fiscal support intended to mitigate their underinvestment in green projects (Owen et al., 2018), companies continue to face a fundamental trade-off between financial performance and sustainability-oriented investment (Narayanan et al., 2021).
Digital trade, as an emerging area of inquiry, has gained increasing attention for its implications for environmental sustainability. The literature has predominantly examined its environmental (Chen and Feng, 2019; Zhang et al., 2022) and economic effects (Danish et al., 2023; Herman and Oliver, 2023). Evidence indicates that digital trade contributes to green transformation by reducing carbon emissions (Wang et al., 2023; Ashraf et al., 2024; Li et al., 2024; Wang et al., 2024b) and fostering technological innovation (Wen et al., 2023; Xiao et al., 2023). Moreover, digital trade positively influences green total factor productivity (Dai et al., 2025). Yet, most of these studies remain at the macro level and provide little insight into the micro-level mechanisms by which digital trade affects firms’ green investment efficiency. In particular, they fail to illuminate the specific pathways through which digital trade alleviates efficiency constraints in green investment.
Although research has addressed green investment, efficiency measurement, and digital trade from diverse perspectives, several gaps persist. First, the green investment literature emphasizes investment scale and its determinants but overlooks the intrinsic issue of resource allocation efficiency. Second, studies on green investment efficiency, despite methodological progress, tend to rely on macro-level policy or financial instruments and have not sufficiently uncovered the micro-level mechanisms underlying efficiency improvements. Third, research on digital trade has concentrated on its macroeconomic and environmental effects, without establishing a direct theoretical linkage to firms’ green investment efficiency. It also lacks systematic analysis of the role of digital technologies in addressing efficiency challenges in green investment. This study addresses these gaps by developing a micro-level analytical framework linking digital trade to firms’ green investment efficiency and empirically testing its mechanisms and channels of influence. In doing so, this work not only advances the literature by integrating micro-level mechanisms with cross-domain perspectives but also provides theoretical foundations and practical implications for firms seeking to optimize green resource allocation and for policymakers aiming to design effective green development strategies.
With the exogenous shocks provided by the comprehensive cross-border e-commerce pilot zone, this study empirically investigates the relationship between digital trade and green investment efficiency using the staggered difference-in-differences model. We find that digital trade exerts a positive driving effect on corporate green investment efficiency, demonstrating its significant potential as a policy instrument. This positive effect operates primarily through increasing internal Research and Development (R&D) investment, promoting industrial structure upgrading, and strengthening digital platforms development. Further analysis reveals that this positive effect is significant among enterprises with high media attention, high environmental quality, those located in eastern and central regions, and those operating on a larger scale.
This study enriches the literature in three ways. First, based on an efficiency perspective, we explore the utility of digital trade in green investment, enriching the research on the effects of digital trade and green investment efficiency. The existing literature on green investment efficiency has primarily concentrated on evaluation (Kim et al., 2015; Fan et al., 2022; Li et al., 2022) and on the effects of green credit (Li et al., 2023b; Tian et al., 2024) and digital empowerment (Liao et al., 2023), neglecting exploration of green investment efficiency from the digital trade perspective. Similarly, the existing literature on digital trade effects has focused on environmental sustainability (Chen and Feng, 2019; Zhang et al., 2022), economic performance (Danish et al., 2023; Herman and Oliver, 2023), technological innovation (Wen et al., 2023; Xiao et al., 2023), and carbon emissions (Wang et al., 2023; Li et al., 2024; Wang et al., 2024b), neglecting green efficiency considerations. We find that digital trade accelerates enterprises’ green investment efficiency, thus providing direct empirical evidence of its contribution.
Second, R&D investment, industrial structure upgrading, and digital platform development constitute important channels for revealing the underlying mechanisms through which digital trade affects firms’ green investment efficiency, thereby deepening the understanding of the critical issue of how digital trade empowers firms’ high-quality development. Although the existing literature has focuses on the relationship between digital trade, green innovation, and carbon emissions, we find that digital trade enhances green investment efficiency by increasing R&D investment, promoting industrial structure upgrading, and strengthening digital platform development. Therefore, we uncover the fundamental drivers behind this empowerment.
Finally, based on the multiple heterogeneous factors, such as media and environmental quality, we explore the varying effects of digital trade on green investment efficiency. The results show that the efficiency gains empowered by digital trade are more significant among enterprises with high media attention, high environmental quality, and those located in eastern and central regions, and those operation on a large scale. These findings provide empirical evidence for promoting digital trade openness, developing green health, and providing valuable references for policymakers and regulators in the precise implementation of digital trade strategies.
Digital trade is closely linked to green and low-carbon development goals, providing impetus for enhancing green investment efficiency. Through digital trade, enterprises can strengthen connections with stakeholders, reduce the negative benefits of information asymmetry, and increase their inclination to undertake green investments and implement green projects, thereby improving the green investment efficiency.
From the perspective of green project decision making, digital trade is instrumental in optimizing investment choices. First, traditional trade through physical transactions often has difficulty in tracking, measuring, and monitoring the environmental and social information of enterprises (Sivaraman et al., 2007). Digital trade enables low-cost, cross-border information dissemination through digital technology, which helps dismantle the “information silo” and enhances responsible governance of enterprises and trade activities by stakeholders and the public (Ma et al., 2019). It consequently boosts enterprises’ willingness to invest green investment projects and provides powerful support for increasing their green investment efficiency. Second, the rise and expansion of digital trade foster upgrading of consumption structures (Wang et al., 2023), creating green demand. To cater to this demand from stakeholders and the public, enterprises reinforce green strategies and increase R&D in green technologies, thereby providing technological impetus for the clean energy industry (Lin and Zhu, 2019; Li et al., 2022). Finally, digital trade expedites the collection, processing, analysis, and circulation of data through digital technology, helping enterprises transform their green decision making from “satisfaction” to “wisdom” (Jafari-Sadeghi et al., 2023). According to attention-based theory, when enterprises concentrate on green projects, they can optimize resource allocation, reduce resource mismatch, and lower energy consumption, thereby enhancing environmental governance and green investment efficiency (Liao et al., 2023).
From an implementation perspective, the widespread adoption of digital technology within the trade sector has significantly transformed traditional organizational paradigms and operational mechanisms, thereby improving trade efficiency, reducing energy consumption, and supporting green investment. First, concerning production mode, digital trade enhances flexible production and intelligent manufacturing through information technology and advanced analytics. It then enables high-turnover production processes, reduces unnecessary material consumption, and promotes green transformation (Wang et al., 2024a). Second, concerning marketing model, digital trade integrates products and end consumers within a unified digital ecosystem, breaking down the obstacles between supply and demand. This precise matching curtails energy consumption and lowers product storage costs during transactions, and further enhancing green investment efficiency (Li et al., 2024). Finally, concerning product transportation, digital trade leverages technologies such as blockchain, Internet of Things, and intelligent devices to improve the intelligence and automation level of the logistics system, increase the accuracy and efficiency of transportation, reduce energy consumption in traditional logistics, optimize the resource allocation, and further enhance green investment efficiency (Ishida, 2015). This discussion leads us to propose the following:
Hypothesis 1: Digital trade can significantly improve corporate green investment efficiency.
Digital trade stimulates enterprises’ R&D investment through the innovation and transformation effect, which further promotes green technology innovation and green investment efficiency. First, digital technology has emerged as a crucial force in shaping the core competitiveness of digital trade that is closely linked to organizational paradigms and production modes of enterprises. Second, digital trade development makes trade convenient and liberalized, accelerates the inter-regional flow of resources, intensifies the competition, and speeds up the embedding of international standards (Wen et al., 2023; Xiao et al., 2023). These dynamics require enterprises to increase green R&D investment to comply with international environmental standards. Finally, digital trade development changes the social consumption structure, prompting the rise of green demand (Wang et al., 2023). To meet this demand, enterprises engage in collaborative green initiatives with other innovation entities, strengthen knowledge spillover, and circulate innovative elements, thus improving green innovation capacity and efficiency. Furthermore, digital trade accelerates the R&D investment of enterprises through the innovation and transformation effect; fosters the agglomeration of capital, talent, and other factors of production; speeds up the integration of innovation resources, improves innovation efficiency (Li et al., 2024), and promotes green production technology upgrading, thereby improving the green investment efficiency. From the perspective of enterprise investment decision making, managers do not favor green investment projects because of their long-term nature, high inputs, and uncertain returns. Enterprises cannot obtain returns in the short term. However, the technological upgrading and knowledge increment generated through R&D investment can increase energy utilization and reduce return uncertainty, thereby increasing managers’ attention to green investment.
Based on resource-based view, enterprises’ core competitiveness originates from their ability to acquire and utilize resources effectively. R&D investment is considered a strategic resource for enterprises’ green investment, providing technical support and knowledge accumulation for innovation. Through increasing R&D investment, developing green energy technology, optimizing production processes, and accumulating green knowledge stock, enterprises can secure critical resources, raise investment levels, and improve resource allocation and investment efficiency (Liu and Zhen, 2022a). From a green investment decision-making perspective, R&D investment provides an innovative driving force for green technology development, enabling enterprises to overcome the technological bottlenecks that often hinder traditional green investment projects. The technological upgrading and knowledge learning brought by continuous investment in R&D enhances corporate resource utilization efficiency and mitigates risks associated with the long-term and uncertain nature of green investment projects (Wen et al., 2023). Through the integration and optimization of technology and knowledge resources, enterprises can allocate green resources efficiently, thereby boosting green investment efficiency and fostering a balance between environmental protection and economic benefits (Zhang et al., 2019a). Therefore, we develop the second hypothesis:
Hypothesis 2: Digital trade can stimulate enterprises to increase R&D investment, thereby contributing to their green investment efficiency.
The rapid development of digital trade facilitates industrial structural upgrading, promoting both industrial rationalization and advancement. Firstly, empowered by digital technology, digital trade accelerates the process of industrial digitalization and stimulates the growth of information services and electronic industries such as computing and communications. Secondly, digital trade enhances the circulation, processing, and efficient allocation of data elements through digital technologies. It reshapes the structure of social supply and demand, mitigates imbalances in industrial supply and demand, and thereby promotes industrial structural upgrading (Wang and Li, 2024c). Finally, digital trade encourages industrial scaling, generates agglomeration effects, improves synergy within industrial chains, and reduces costs associated with irrational industrial structures (Li et al., 2024), ultimately optimizing the industrial framework. Furthermore, digital trade accelerates industrial upgrading, driving the gradual phase-out of high-energy-consumption and high-pollution industries while facilitating the transition of enterprises toward low-energy-consumption and low-carbon alternatives. This transformation enhances energy utilization efficiency, optimizes resource allocation, and contributes to improved green investment efficiency (Sun et al., 2024).
Based on the “technology-economy” paradigm theory, enterprises can reshape production modes and cost structures through technological progress (Tang and Lan, 2024). Specifically, in the context of digital trade, the application of digital technologies enables firms to transform traditional high-energy-consumption and high-pollution industries into green industries, thereby providing additional capital reserves and technical support for green investment. Moreover, enterprises can utilize renewable resources more efficiently through green technologies, reduce resource waste, and enhance green investment efficiency alongside industrial upgrading. Additionally, technological revolution has reshaped corporate ecosystems. With the advancement of digital trade, collaboration and integration between upstream and downstream industries become more seamless, accelerating the formation of green industrial chains (Du et al., 2021). Within this ecosystem, resource sharing and the dissemination of green technologies through collaborative innovation can more effectively promote the implementation of green investment projects. From the perspective of corporate investment decision-making, industrial structural upgrading increases firms’ willingness to invest in green projects. According to attention-based theory, when enterprises prioritize low-energy-consumption and low-carbon transition projects, increase investments in green initiatives, and optimize the allocation of green resources, the public can better supervise corporate environmental responsibilities, thereby enhancing green investment efficiency. Therefore, we propose the following hypothesis:
Hypothesis 3: Digital trade enhances green investment efficiency by promoting industrial structure upgrading.
Digital platform development constitutes an indispensable intermediary channel through which digital trade affects firms’ green investment efficiency. As a key vehicle of institutional innovation, digital trade policies provide strong support and development momentum for the construction of digital platform infrastructure. The implementation of policies such as the Cross-border E-commerce Comprehensive Pilot Zone (CEPZ) has promoted the establishment and improvement of online integrated service platforms, such as “single window” systems. These policies substantially reduce the institutional transaction costs for firms to access platforms and engage in digital collaboration (Wang et al., 2025). This platform-based development not only enhances trade facilitation but, more importantly, provides the necessary infrastructural conditions for firms’ green transformation.
Digital platforms influence firms’ green investment efficiency through three interrelated mechanisms. First, by aggregating global green technologies and solutions, digital platforms create efficient technology search and matching mechanisms, significantly reducing firms’ information and trial-and-error costs for acquiring energy-saving and emission-reduction technologies (Shen and Zhang, 2024). Second, the use of digital platforms enables traceability across the entire supply chain, making product carbon footprints and energy consumption information visible and manageable. This transparency, in turn, pressures supply chain partners to jointly implement emission reduction measures through market mechanisms (Zhang et al., 2024). Third, platforms integrate information, logistics, and capital flows in trade processes, providing data support for the precise pricing and delivery of green financial products, effectively alleviating financing constraints for green investment (Li et al., 2023a).
External conditions may moderate the mediating effect of digital platforms. The quality of the institutional environment, the level of market development, and the state of technological infrastructure can influence the magnitude and direction of platform effects (Pardo and Tayi, 2007; Bonina et al., 2021). In particular, in regions with well-developed institutional environments, digital platforms are likely to realize their resource integration and information transmission functions, enhancing green investment efficiency. Therefore, we propose the following hypothesis:
Hypothesis 4: Digital trade enhances green investment efficiency by promoting digital platform development.
This study is based on a sample of China’s A-share listed companies in heavy polluting industries from 2010 to 2020. The rationale for this research design is threefold. First, China’s unique CEPZ policy provides a quasi-natural experimental setting. Its phased pilot implementation enables a credible identification of the causal impact of digital trade on green investment efficiency. Comparable policy frameworks are largely absent in other countries. Moreover, as the largest developing country facing severe environmental challenges, China’s transformation dilemmas and policy-driven approach hold strong representativeness for other emerging economies. Second, heavily polluting industries constitute the primary sources of resource depletion and environmental degradation and face the most stringent pressures of green transformation and compliance costs. Their persistent inefficiency in green investment makes them a critical testing ground for examining whether digital trade can alleviate the “economy–environment” trade-off. Third, A-share listed companies are subject to mandatory disclosure requirements, thereby providing continuous, standardized, and comparable financial and environmental data. The superior quality and comparability of such data, relative to non-listed firms, allow for precise measurement of “green investment efficiency” and mitigate scale-related biases. Accordingly, selecting A-share listed firms in heavily polluting industries ensures that the sample serves as the most effective and reliable foundation for addressing the core research question. Given that the Ministry of Environmental Protection (MEP) issued the Guideline on Environmental Information Disclosure of Listed Companies in 2010, the number of heavily polluting companies making social responsibility disclosures has increased. Thus, 2010 was selected as the starting year of the sample period. We obtained green investments date manually from the annual reports of listed companies, and other data from the China Stock Market & Accounting Research (CSMAR) database, the China Research Data Services (CNRDS) digital library, official government websites, and the China Statistical Yearbook. To fulfill the research purpose, we eliminated the following variables: (1) listed companies with ST and *ST designations, (2) companies in the financial industry, and (3) observations with missing values in the main variables. To limit extreme values, we applied the 1% upper and lower trimming treatment to all continuous variables. Finally, we obtained 1846 observations.
To promote the sustainable, healthy, and rapid development of cross-border e-commerce; address the obstacles and challenges arising in its expansion; and provide enterprises with tangible facilitation measures, China’s State Council approved the establishment of the first CEPZ in Hangzhou in 2015. Subsequently, to disseminate the mature practices and experiences of the Hangzhou pilot, the State Council successively approved the second to the seventh batches of CEPZs between 2016 and 2022. Following these expansions, 165 cities have established comprehensive CEPZs. Unlike traditional free trade zones, which primarily emphasize tariff reductions, the core value of the CEPZ lies in constructing a novel regulatory framework tailored to the development of digital trade. Its reform measures essentially serve to reduce the institutional costs of digital transactions. Moreover, according to the General Administration of Customs Announcement No. 26 (2016), enterprises within the CEPZ must process relevant operations through the digital cross-border e-commerce clearance service platform, making the use of digital tools a prerequisite for enjoying policy benefits. This inherent reliance on digital interfaces renders the CEPZ not merely a policy package but also an integrated vehicle of technological and institutional empowerment in digital trade. As the first nationwide, systematic institutional innovation for digital trade, the CEPZ provides an ideal quasi-natural experimental setting for applying a staggered difference-in-differences approach to assess its effect on green investment efficiency. We set up the following model:
Where dependent variable
The explanatory variable in this study is green investment efficiency. Drawing on Richardson (2006) and Liu et al. (2022b), we estimated this variable in Model (2).
Where GI is the firm’s green investment. Following Liu et al. (2022b), GI = log (greening fee, sewage fee, and environmental protection-related expenditures in the management fee/operating income). IO represents investment plan, measured by net profit divided by owner’s equity. Cash represents cash flow, measured by money funds divided by total assets. OR represents operating profit, measured by Earnings Before Interest and Taxes (EBIT) divided by total assets. Dpi denotes regional investment in industrial pollution prevention and treatment, measured by completed investment in industrial pollution prevention and treatment divided by industry value-added. Water denotes the Chemical Oxygen Demand (COD) and ammonia nitrogen emissions from industrial wastewater. Air denotes the SO2 and nitrogen oxide emissions from industrial waste gas. Table 1 lists other variables in Model (2). The residual value estimated by Model (2) represents the deviation of a firm’s actual green investment level from the optimal scale of green investment, indicating the inefficiency in corporate green investment. A negative residual signifies under-investment in green projects by the sample firm, while a positive residual suggests over-investment. Therefore, this study uses the absolute value of the estimated residual to measure corporate green investment efficiency (GIE). A larger absolute value indicates a greater deviation between the actual green investment and the optimal level, reflecting a higher degree of green investment inefficiency and, thus, lower green investment efficiency. Given that the measurement of green investment efficiency requires first-order lagged data (Liao et al., 2023), the data of green investment efficiency in this study spans from 2011 to 2020.
| Variable type | Variable | Symbol | Definition |
| Dependent variable | Green investment efficiency | GIE | Using model (2) to calculate the absolute value of the residuals represents |
| Independent variable | Digital trade | DID | If the firm’s city is approved as a pilot city in year t, with a value of 1, and 0 otherwise. |
| Control variables | Financial leverage | Lev | total liabilities/total assets |
| Total asset growth rate | Totassgrt | Growth rate of total assets | |
| Enterprise age | Age | ln (current year – listing year + 1) | |
| Profitability | ROE | net profit/net asset | |
| Size of firm | Size | Log (total assets) | |
| Occupy of funds by major shareholders | Occupy | Net other receivables/total assets | |
| Top shareholder ownership | Top1 | Number of shares held by largest shareholder/total number of shares | |
| Nature of ownership | SOE | State-owned enterprises take the value of 1, otherwise 0 | |
| Big four audit | Big4 | Firms audited by Big 4 take the value of 1, otherwise 0 | |
| Inventory ratio | Inv | Inventory/total assets |
Given the sample’s continuity, we selected a total of 105 comprehensive CEPZ cities in the first five batches (2015–2020) to represent digital trade (DID). According to the announcement time, some cities have less than one year during the year of announcement. Therefore, we counted the cities approved before June as the current year, and those approved after June are deferred to the next year for counting.
Following Liao et al. (2023), we selected a series of control variables. They are Financial leverage (Lev), Total asset growth rate (Totassgrt), Enterprise age (Age), Profitability (ROE), Firm size (Size), Occupancy of funds by major shareholders (Occupy), Top shareholder ownership (Top1), Nature of ownership (SOE), Big Four Audit (Big4), and Inventory ratio (Inv). Table 1 lists and defines the specific variables.
Table 2 presents the descriptive statistics for the main variables. The mean green investment efficiency (GIE) level is 0.591, with a variance of 0.719. The average green investment efficiency level among heavy-polluting firms in China is relatively low, and the variation among enterprises is significant. The mean digital trade (DID) level is 0.139, suggesting that approximately 13.9% of the companies are covered by the CEPZ.
| Variables | N (Number) | Mean | SD (Standard Deviation) | Min | Med | Max |
| GIE | 1846 | 0.591 | 0.719 | 0 | 0.379 | 7.584 |
| DID | 1846 | 0.139 | 0.346 | 0 | 0 | 1 |
| Lev | 1846 | 0.444 | 0.195 | 0.032 | 0.447 | 0.895 |
| Totassgrt | 1846 | 0.131 | 0.293 | –0.339 | 0.074 | 5.116 |
| Age | 1846 | 2.363 | 0.686 | 0.693 | 2.565 | 3.332 |
| ROE | 1846 | 0.062 | 0.106 | –0.526 | 0.059 | 0.419 |
| Size | 1846 | 22.610 | 1.243 | 19.770 | 22.460 | 26.250 |
| Occupy | 1846 | 0.010 | 0.018 | 0 | 0.005 | 0.168 |
| Top1 | 1846 | 0.376 | 0.148 | 0.083 | 0.361 | 0.758 |
| SOE | 1846 | 0.528 | 0.499 | 0 | 1 | 1 |
| Big4 | 1846 | 0.058 | 0.234 | 0 | 0 | 1 |
| Inv | 1846 | 0.122 | 0.099 | 0.001 | 0.097 | 0.650 |
Table 3 examines the effect of digital trade on enterprises’ green investment efficiency. Column (1) considers only the independent variable, showing that digital trade (DID) is –0.172 and significantly negatively correlated with green investment efficiency at the 5% level. Column (2) includes control variables, where digital trade (DID) is –0.19 and significantly negative at the 1% level. After the implementation of the digital trade policy, the green investment efficiency of firms in pilot regions increased significantly by 19%. Moreover, after controlling for firm-specific characteristics, the “net effect” of the digital trade policy on enhancing green investment efficiency becomes pronounced and robust, supporting Hypothesis 1.
| Variables | (1) | (2) |
| GIE | GIE | |
| DID | –0.172** | –0.185*** |
| (–2.471) | (–2.669) | |
| Lev | –0.350** | |
| (–2.531) | ||
| Totassgrt | 0.142** | |
| (2.401) | ||
| Age | 0.068* | |
| (1.738) | ||
| ROE | 0.124 | |
| (0.667) | ||
| Size | –0.008 | |
| (–0.345) | ||
| Occupy | 3.089*** | |
| (3.098) | ||
| Top1 | 0.000 | |
| (0.108) | ||
| SOE | –0.031 | |
| (–0.529) | ||
| Big4 | –0.179* | |
| (–1.817) | ||
| Inv | –0.544** | |
| (–2.275) | ||
| Constant | 0.614*** | 0.830* |
| (33.016) | (1.637) | |
| Observations | 1846 | 1846 |
| R-squared | 0.182 | 0.201 |
| City | Yes | Yes |
| Year | Yes | Yes |
Note:
The validity of the difference-in-differences model is that the assumption of parallel trends must be met. That is, the trend of changes in the green investment efficiency for pilot and non-pilot cities should be parallel before the policy’s implementation. Therefore, we construct the following model for testing:
In Model (3),
As shown in Fig. 1, before the implementation of the policy in 2015, the estimated coefficient was not statistically significant, indicating that the green investment efficiency of enterprises in the experimental and control groups was consistent before the policy took effect. Following policy implementation, the estimated coefficient became significantly negative, demonstrating a marked improvement in green investment efficiency among enterprises in the experimental group. This observation satisfies the parallel trends assumption.
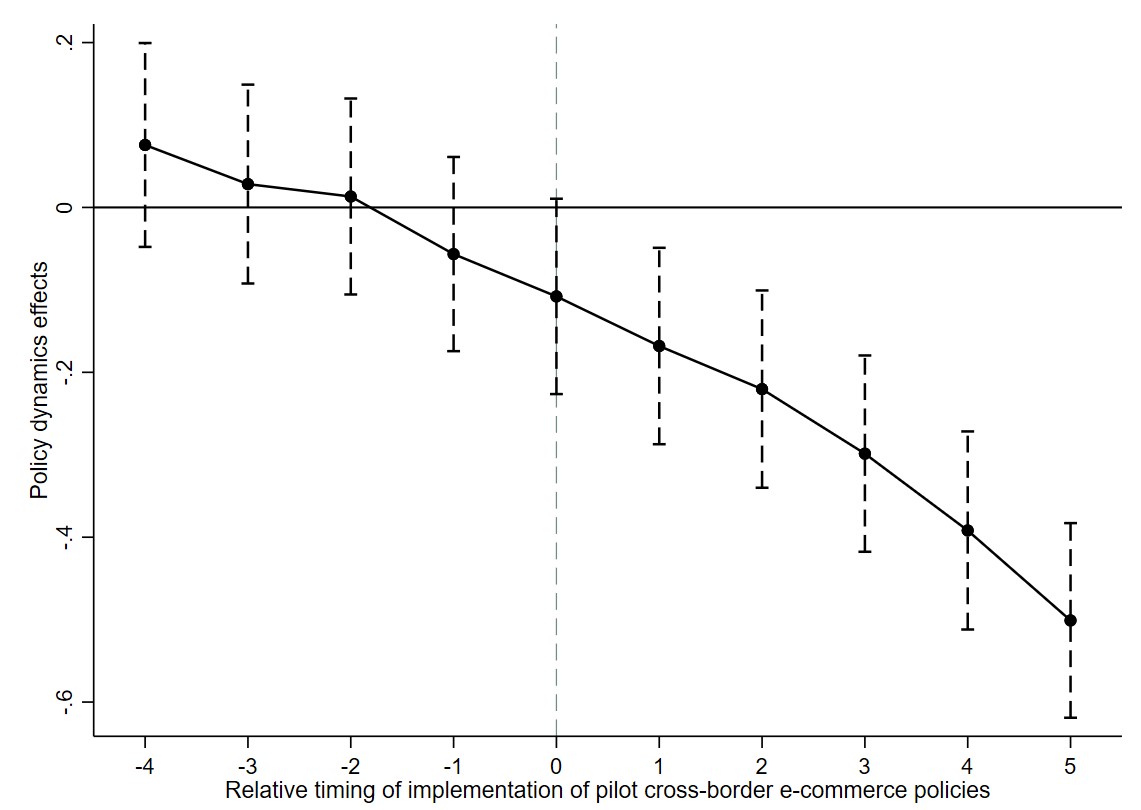 Fig. 1.
Parallel trend test result.
To exclude the influence of other unobservable factors on the results, we drew on Liu and Lu (2015) to conduct a placebo test. It randomly generates an experimental group and randomly assigns it a policy time, constructs a new interaction term and replaces the one in Model (1) to re-estimate the regression. The above process is repeated 500 times.
Fig. 2 indicates that the coefficients of digital trade (DID) follow a normal distribution centered around zero and do not intersect with the true estimated coefficient (–0.19). Thus, excluding the effect of other unobservable factors on the benchmark regression results proves that digital trade enhances green investment efficiency.
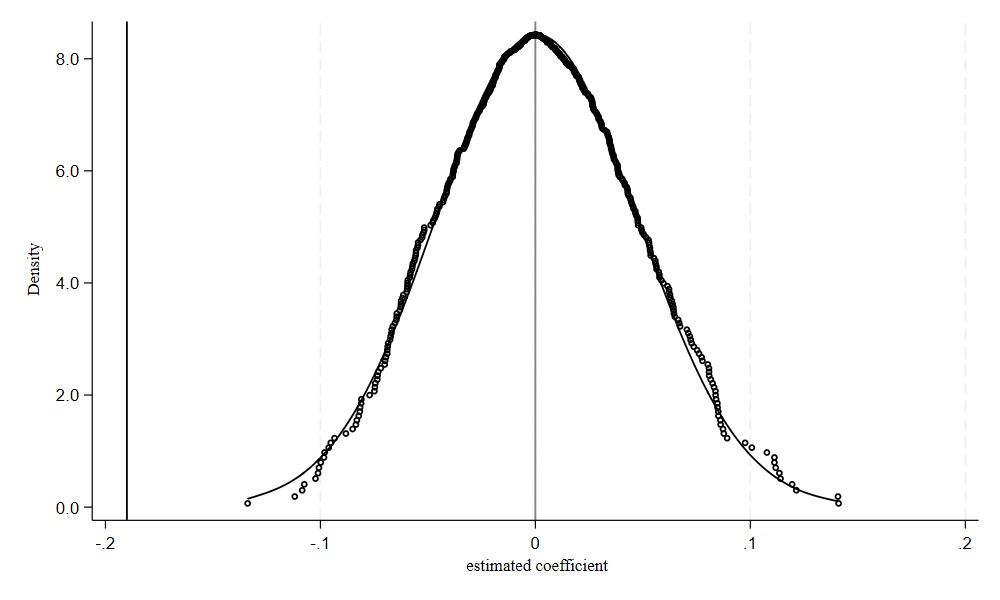 Fig. 2.
Placebo test result.
To eliminate the influence of anticipated effects on the regression results, we manually advanced the policy implementation time by one, two, and three years; created new interaction terms; and added them in Model (1).
Table 4 shows that the newly added variables are statistically insignificant, whereas the digital trade (DID) is not significantly changed. Therefore, the results are valid.
| Variables | (1) | (2) | (3) |
| GIE | GIE | GIE | |
| DID | –0.171** | –0.184*** | –0.160** |
| (–2.419) | (–2.653) | (–2.238) | |
| Treat |
–0.079 | ||
| (–0.956) | |||
| Treat |
0.054 | ||
| (0.642) | |||
| Treat |
0.121 | ||
| (1.392) | |||
| Lev | –0.356** | –0.342** | –0.328** |
| (–2.568) | (–2.459) | (–2.355) | |
| Totassgrt | 0.142** | 0.142** | 0.140** |
| (2.397) | (2.408) | (2.372) | |
| Age | 0.068* | 0.067* | 0.066* |
| (1.729) | (1.722) | (1.682) | |
| ROE | 0.123 | 0.124 | 0.120 |
| (0.661) | (0.666) | (0.645) | |
| Size | –0.008 | –0.009 | –0.009 |
| (–0.328) | (–0.348) | (–0.363) | |
| Occupy | 3.074*** | 3.076*** | 3.074*** |
| (3.082) | (3.084) | (3.083) | |
| Top1 | 0.023 | 0.015 | 0.012 |
| (0.136) | (0.091) | (0.072) | |
| SOE | –0.030 | –0.032 | –0.033 |
| (–0.506) | (–0.542) | (–0.567) | |
| Big4 | –0.182* | –0.177* | –0.173* |
| (–1.845) | (–1.790) | (–1.758) | |
| Inv | –0.541** | –0.544** | –0.543** |
| (–2.266) | (–2.277) | (–2.272) | |
| Constant | 0.843* | 0.809 | 0.776 |
| (1.662) | (1.593) | (1.526) | |
| Observations | 1846 | 1846 | 1846 |
| R-squared | 0.201 | 0.201 | 0.202 |
| City | Yes | Yes | Yes |
| Year | Yes | Yes | Yes |
To avoid other policies affecting green investment efficiency during the research period, we conducted an exhaustive search and categorization of pilot policies potentially impacting green investment efficiency during the research period. We found that the Low Carbon City Pilot and Broadband China may affect green investment efficiency. We controlled for these policies in Model (1), where LC represents whether the enterprise’s city belongs to the low-carbon city pilot in the current year, with a value of 1 if yes, and 0 otherwise. BBC represents whether the enterprise’s city is a demonstration city for “Broadband China” in the current year, with a value of 1 if yes, and 0 otherwise.
Table 5 Column (1)–(3) shows that, after excluding the influence of other policies, the digital trade policy consistently increased firms’ green investment efficiency by approximately 18%–19%. Compared with the baseline regression, no significant changes are observed, confirming the robustness of the policy’s positive effect on optimizing green investment efficiency.
| Variables | Exclusion of policy effects | Exclude reverse causality | ||
| (1) | (2) | (3) | (4) | |
| GIE | GIE | GIE | GIE | |
| DID | –0.189*** | –0.179** | –0.184*** | –0.132** |
| (–2.705) | (–2.557) | (–2.602) | (–2.513) | |
| LC | 0.033 | 0.042 | ||
| (0.447) | (0.562) | |||
| BBC | –0.032 | –0.039 | ||
| (–0.508) | (–0.611) | |||
| Lev | –0.344** | –0.351** | –0.343** | –0.306** |
| (–2.470) | (–2.538) | (–2.465) | (–2.382) | |
| Totassgrt | 0.141** | 0.142** | 0.141** | 0.135** |
| (2.383) | (2.411) | (2.392) | (2.296) | |
| Age | 0.068* | 0.069* | 0.068* | 0.071* |
| (1.723) | (1.751) | (1.735) | (1.692) | |
| ROE | 0.122 | 0.123 | 0.120 | 0.115 |
| (0.656) | (0.661) | (0.645) | (0.612) | |
| Size | –0.009 | –0.008 | –0.008 | –0.009 |
| (–0.348) | (–0.342) | (–0.346) | (–0.318) | |
| Occupy | 3.077*** | 3.100*** | 3.087*** | 3.124*** |
| (3.084) | (3.108) | (3.093) | (2.987) | |
| Top1 | 0.015 | 0.019 | 0.016 | 0.019 |
| (0.089) | (0.115) | (0.093) | (0.089) | |
| SOE | –0.032 | –0.030 | –0.032 | –0.030 |
| (–0.548) | (–0.522) | (–0.544) | (–0.512) | |
| Big4 | –0.179* | –0.181* | –0.180* | –0.175* |
| (–1.811) | (–1.833) | (–1.829) | (–1.783) | |
| Inv | –0.539** | –0.546** | –0.541** | –0.528** |
| (–2.255) | (–2.284) | (–2.261) | (–2.195) | |
| Constant | 0.819 | 0.838* | 0.826 | 0.793 |
| (1.614) | (1.651) | (1.625) | (1.582) | |
| Observations | 1846 | 1846 | 1846 | 977 |
| R-squared | 0.201 | 0.201 | 0.201 | 0.189 |
| City | Yes | Yes | Yes | Yes |
| Year | Yes | Yes | Yes | Yes |
LC, low-carbon; BBC, Broadband China.
If firms with inherently high green efficiency are likely to relocate to CEPZ cities, the observed effect may be driven by such migration behavior rather than by the policy itself. To rule out the possibility of reverse causality, we used historical data on the registered addresses of listed companies from the CSMAR database. We excluded firms that relocated to pilot cities only after the implementation of the CEPZ policy, leaving only the “native” firms that were already present before the policy and did not move.
As shown in column (4) of Table 5, the coefficient for digital trade (DID) is –0.132, which remains significantly negative. Its absolute value of 0.132 is smaller than that of the baseline regression coefficient (0.19), indicating that by excluding migrating firms, we successfully removed the “selection effect” caused by the policy attracting high-efficiency firms. We retained only the “net treatment effect” reflecting the policy’s actual stimulation of local firms’ transformation. This improvement primarily arises from the policy genuinely promoting local firms’ green transformation and innovation activities, rather than from a selection bias because of attracting high-efficiency firms.
To further alleviate the endogeneity problem caused by sample selection bias, we used the PSM method to screen the sample. Specifically, we first selected control variables in the same year as the covariates for matching. Second, we used the nearest neighbor matching, radius matching, and kernel matching methods to match samples. Finally, we performed regression based on the matched samples. Table 6 reports the results. The digital trade (DID) is significantly negative at the 1% level, supporting the results of this study.
| Variables | (1) | (2) | (3) |
| nearest neighbor | radius | kernel | |
| DID | –0.205*** | –0.184*** | –0.184*** |
| (–2.600) | (–2.659) | (–2.659) | |
| Lev | –0.424*** | –0.351** | –0.351** |
| (–2.651) | (–2.532) | (–2.532) | |
| Totassgrt | 0.081 | 0.142** | 0.142** |
| (0.945) | (2.399) | (2.399) | |
| Age | 0.091** | 0.068* | 0.068* |
| (2.045) | (1.744) | (1.744) | |
| ROE | 0.168 | 0.121 | 0.121 |
| (0.783) | (0.651) | (0.651) | |
| Size | –0.004 | –0.008 | –0.008 |
| (–0.151) | (–0.344) | (–0.344) | |
| Occupy | 3.130** | 3.115*** | 3.115*** |
| (2.419) | (3.119) | (3.119) | |
| Top1 | 0.051 | 0.025 | 0.025 |
| (0.262) | (0.148) | (0.148) | |
| SOE | –0.088 | –0.031 | –0.031 |
| (–1.346) | (–0.524) | (–0.524) | |
| Big4 | –0.415** | –0.175* | –0.175* |
| (–2.340) | (–1.771) | (–1.771) | |
| Inv | –0.418 | –0.543** | –0.543** |
| (–1.552) | (–2.273) | (–2.273) | |
| Constant | 0.722 | 0.826 | 0.826 |
| (1.288) | (1.628) | (1.628) | |
| Observations | 1544 | 1844 | 1844 |
| R-squared | 0.210 | 0.201 | 0.201 |
| City | Yes | Yes | Yes |
| Year | Yes | Yes | Yes |
According to the previous theoretical analysis, digital trade may influence green investment efficiency by increasing R&D expenditure, promoting industrial structures upgrading, and strengthening digital platforms development. To test the effects of digital trade on green investment efficiency, we followed Jiang (2022) and formulated Model (4):
In Model (4),
Column (1) in Table 7 reports the results for the effect of R&D investment. Digital trade (DID) is significantly positive at the 1% level, indicating that each unit increase in digital trade promotes a 0.6% increase in firms’ R&D investment. The Sobel test yields a Z-statistic of -3.872, significant at the 1% level, with the mediation effect accounting for 32%, suggesting that R&D investment plays a partial mediating role. As previously discussed, R&D investment promotes green technological innovation, increases knowledge spillovers, optimizes resource allocation, and thus enhances green investment efficiency. Hypothesis 2 is verified. The possible reason is that the application of digital technology in trade enhances firms’ market competitiveness and stimulates their enthusiasm for R&D in green technology. Specifically, digital trade facilitates enterprises to carry out technological innovation, improves their ability to accurately predict market trends, shortens the innovation cycle, and intensifies the competition among enterprises. This competition prompts them to further invest energy and resources in green technology upgrading and digital knowledge reserves. After breaking through the technological dilemma faced by traditional green investment, enterprises can allocate green resources rationally, enhance the effectiveness of green resources, and mitigate the inherent challenges of long-term and uncertain returns associated with green investments.
| Variables | Current-period mediation model | One-period-lagged mediation model | ||||
| (1) | (2) | (3) | (4) | (5) | (6) | |
| Rd | IS | DP | Rd | IS | DP | |
| DID | 0.006*** | 0.076*** | 0.028*** | 0.009*** | 0.078*** | 0.026*** |
| (4.062) | (4.292) | (4.115) | (3.501) | (4.012) | (3.955) | |
| Lev | –0.010*** | –0.046 | –0.044 | –0.006*** | –0.049 | –0.041 |
| (–3.009) | (–1.327) | (–1.386) | (–5.123) | (–1.251) | (–1.320) | |
| Totassgrt | 0.003* | 0.006 | 1.042*** | 0.002 | 0.005 | 0.988*** |
| (1.906) | (0.381) | (4.387) | (1.432) | (0.348) | (4.251) | |
| Age | –0.007*** | 0.013 | 0.014 | –0.002 | 0.093** | 0.013 |
| (–7.870) | (1.328) | (1.392) | (–0.502) | (2.077) | (1.345) | |
| ROE | –0.002 | –0.101** | –0.016 | –0.003*** | –0.003 | –0.015 |
| (–0.478) | (–2.151) | (–1.058) | (–5.211) | (–0.077) | (–1.021) | |
| Size | –0.003*** | 0.006 | 0.006 | –0.016 | 0.968*** | 0.005 |
| (–5.378) | (0.953) | (0.987) | (–0.704) | (4.101) | (0.943) | |
| Occupy | –0.017 | 1.054*** | 0.005 | –0.009*** | 0.068 | 0.004 |
| (–0.726) | (4.269) | (0.397) | (–2.897) | (1.101) | (0.365) | |
| Top1 | –0.010*** | 0.025 | 0.024 | –0.002 | 0.023 | 0.022 |
| (–2.583) | (0.598) | (0.621) | (–1.553) | (0.163) | (0.585) | |
| SOE | –0.002 | –0.015 | –0.098** | –0.001 | –0.014** | –0.091** |
| (–1.481) | (–1.014) | (–2.236) | (–0.432) | (–1.992) | (–2.180) | |
| Big4 | –0.002 | –0.065*** | –0.067*** | –0.010* | –0.060** | –0.062*** |
| (–0.729) | (–2.677) | (–2.783) | (–1.951) | (–2.521) | (–2.645) | |
| Inv | –0.011** | 0.009 | 0.008 | 0.117*** | 0.008 | 0.007 |
| (–1.967) | (0.148) | (0.154) | (10.025) | (0.132) | (0.142) | |
| Constant | 0.118*** | 1.079*** | 1.015*** | –0.009*** | 1.035*** | 0.992*** |
| (10.157) | (8.320) | (7.093) | (–3.501) | (8.105) | (7.876) | |
| Observations | 1846 | 1846 | 1846 | 1641 | 1487 | 1641 |
| R-squared | 0.567 | 0.970 | 0.773 | 0.570 | 0.965 | 0.768 |
| City | Yes | Yes | Yes | Yes | Yes | Yes |
| Year | Yes | Yes | Yes | Yes | Yes | Yes |
| Sobel-Z | –3.872*** | –4.215*** | –3.956*** | –4.128*** | –4.382*** | –3.891*** |
| Proportion | 0.320 | 0.418 | 0.285 | 0.335 | 0.426 | 0.292 |
Rd, R&D investment; IS, industrial structure upgrading; DP, digital platform development.
Column (2) of Table 7 reports the results for the effect of industrial structure upgrading. Digital trade (DID) is significantly positive at the 1% level, indicating that each unit increase in digital trade raises the degree of industrial structure upgrading by 7.6%. The Sobel test yields a Z-statistic of –4.215, which is significant at the 1% level, with the mediation effect accounting for 41.8%, suggesting that industrial structure upgrading plays a partial mediating role. As noted above, digital trade encourages firms to undertake low-carbon transformation and increase environmental awareness, thereby enhancing green investment efficiency, confirming Hypothesis 3. Possible explanations are as follows. When digital trade shifts a city’s economic center of gravity toward the tertiary industry, it triggers a series of chain reactions: the agglomeration of high-end service industries brings richer green technology talent and specialized financial resources, thereby lowering the threshold and costs for enterprises to undertake green innovation (Liu et al., 2022c). Meanwhile, industrial upgrading is often accompanied by stricter environmental regulations and higher factor prices (Zhang et al., 2019b), which compel enterprises to improve resource utilization efficiency through both compliance pressure and market elimination mechanisms, ensuring that green investments are allocated strategically. Furthermore, an economy dominated by service industries tends to foster more environmentally conscious consumers and investors (Jiang et al., 2025), meaning that green products can achieve better market returns, thereby incentivizing enterprises from the revenue side to carry out more efficient and targeted green investments. In other words, the upgrading of a city’s industrial structure essentially creates a comprehensive external environment characterized by “low-cost innovation, high-pressure transformation, and high-return incentives” (Wang et al., 2018). Within this environment, improving the efficiency of green investment is no longer merely a policy response for enterprises, but rather an economically rational and volitional choice.
Column (3) of Table 7 presents the results of the mediation test for digital platform development. Digital trade (DID) is significantly positive at the 1% level, indicating that each unit increase in digital trade promotes a 2.8% increase in the degree of firms’ digital platform development. The Sobel test yields a Z-statistic of –3.956, significant at the 1% level, with the mediation effect accounting for 28.5%, suggesting that digital platform development plays a partial mediating role. As previously noted, digital trade policies indirectly enhance the precision and marginal benefits of firms’ green investment by promoting the construction of platform infrastructure, ultimately improving green investment efficiency. Specifically, digital platforms serve as hubs for green technology matching, aggregating global energy-saving and emission-reduction technologies and solutions, thereby substantially reducing technology search and trial-and-error costs. In addition, digital platforms enable transparency and collaboration across the supply chain, making product carbon footprint and energy consumption data visible and manageable. Upstream and downstream firms are then compelled to implement joint emission reduction measures. Moreover, digital platforms optimize the allocation of green factors by leveraging platform data flows to attract targeted green financial resources, alleviating firms’ financing constraints and enhancing green investment efficiency.
To mitigate potential reverse causality in the mediation tests, we conducted robustness checks using one-period-lagged mediating variables. The results, presented in columns (4)–(6) of Table 7, indicate that lagged R&D investment, industrial structure upgrading, and digital platform development exhibit significant mediating effects on the effect of lagged digital trade on green investment efficiency. Specifically, the mediating effect coefficient of lagged R&D investment is 0.009, higher than the contemporaneous mediating effect coefficient of 0.006, suggesting that R&D innovation exhibits certain accumulation and lag characteristics, serving as a long-term support factor for efficiency improvement. The Sobel test yields a Z-statistic of –4.128, significant at the 1% level, with the mediation effect accounting for 33.5%, indicating that lagged R&D investment plays a partial mediating role. The mediating effect of lagged industrial structure upgrading is the most pronounced, suggesting that digital trade primarily enhances green investment efficiency by promoting the structural shift of the economy toward green industries. This finding reflects the dominant role of macro-level resource allocation optimization. The Sobel test yields a Z-statistic of –4.382, significant at the 1% level, with the mediation effect accounting for 42.6%, indicating that lagged industrial structure upgrading plays a partial mediating role. The effect of lagged digital platform development remains stable, implying that efficiency improvements are achieved through mechanisms such as compliance with international green standards and expansion of financing channels via foreign exchange earnings. The Sobel test yields a Z-statistic of –3.891, significant at the 1% level, with the mediation effect accounting for 29.2%, indicating that lagged digital platform development plays a partial mediating role. These findings demonstrate that the causal pathway through which digital trade enhances green investment efficiency—by promoting R&D investment, industrial structure upgrading, and digital platform development—remains robust, thereby reinforcing the reliability of this study’s conclusions.
Given that firms present distinct characteristics in different environments, we examined the heterogeneity of digital trade on green investment efficiency by conducting segmentation tests in four dimensions. They are media attention, environmental quality, geographic location, and firm size.
In the era of digital trade, the media serves an essential function in environmental information dissemination and public opinion supervision, and exerts a certain influence on enterprises’ environmental and production behaviors (Ren et al., 2023). The high level of media attention promoted the transparency of information, which drives enterprises to focus on environmental responsibility and carry out green technology innovation and production activities (Yan, 2023; Sun et al., 2024).
Following Liao et al. (2023), we measured the media attention index by the frequency of firms’ appearances in headlines and categorized into high and low groups at median. Columns (1) and (2) of Table 8 present the results regarding media attention. Under conditions of high media attention, the absolute value of digital trade (DID) is 0.217, significantly negative at the 5% level, which to some extent raises is above the national average. Under low media attention, the absolute value of digital trade (DID) is 0.073 and not significant, which is consistent with our expectations. In other words, in an environment with high media attention, digital trade can more effectively enhance firms’ green investment efficiency. In an environment with low media attention, the policy fails primarily because external supervision is lacking. The Fisher combination test of inter-group coefficient differences yields significant results. The effect of digital trade on green investment efficiency varies significantly across firm samples with different levels of media attention, making comparative analysis feasible.
| Variables | (1) | (2) | (3) | (4) |
| Higher media attention | Lower media attention | Higher environmental quality | Lower environmental quality | |
| DID | –0.217** | –0.073 | –0.314*** | –0.091 |
| (–2.199) | (–0.668) | (–3.032) | (–0.916) | |
| Lev | –0.377** | –0.302 | –0.566*** | –0.290 |
| (–2.077) | (–1.194) | (–2.765) | (–1.426) | |
| Totassgrt | 0.136 | 0.248*** | 0.043 | 0.255*** |
| (1.430) | (2.729) | (0.473) | (3.098) | |
| Age | 0.080 | –0.010 | 0.133** | 0.035 |
| (1.567) | (–0.143) | (2.376) | (0.600) | |
| ROE | –0.033 | 0.376 | –0.156 | 0.509* |
| (–0.139) | (0.988) | (–0.634) | (1.698) | |
| Size | –0.032 | 0.009 | 0.011 | –0.030 |
| (–1.020) | (0.199) | (0.322) | (–0.815) | |
| Occupy | 2.840** | 3.521* | 0.637 | 4.612*** |
| (2.333) | (1.820) | (0.436) | (3.282) | |
| Top1 | 0.118 | –0.304 | –0.290 | 0.231 |
| (0.544) | (–0.999) | (–1.165) | (0.971) | |
| SOE | –0.074 | 0.039 | 0.064 | –0.072 |
| (–0.947) | (0.358) | (0.789) | (–0.822) | |
| Big4 | –0.086 | –0.011 | –0.170 | –0.205 |
| (–0.684) | (–0.056) | (–1.388) | (–1.255) | |
| Inv | –0.257 | –0.704 | –0.973*** | –0.281 |
| (–0.858) | (–1.532) | (–2.925) | (–0.797) | |
| Constant | 1.318** | 0.640 | 0.509 | 1.233 |
| (1.988) | (0.668) | (0.745) | (1.609) | |
| Observations | 1135 | 711 | 896 | 950 |
| R-squared | 0.247 | 0.296 | 0.247 | 0.259 |
| City | Yes | Yes | Yes | Yes |
| Year | Yes | Yes | Yes | Yes |
| Fisher’s Permutation test | 0.178*** | 0.366*** | ||
In areas with high environmental quality, the environmental protection concept is deeply rooted in people’s hearts. Implementing green environmental protection strategy not only fulfils enterprises’ environmental responsibilities but also meet the public’s expectations for a better environment in the future. It also shapes their green image, obtains the support of stakeholders, and improves their environmental performance, making enterprises inclined to invest green projects (Derchi et al., 2021). Therefore, in areas with higher environmental quality, enterprises better utilize digital trade to meet the public’s expectation of a better environment, thereby enhancing green investment efficiency.
We used the entropy weight method for three waste emissions to calculate the regional comprehensive environmental quality index for each province and categorized firms into high and low groups at median for regression. Columns (3) and (4) of Table 8 report the results regarding environmental quality. In regions with high environmental quality, the absolute value of digital trade (DID) is 0.314, significantly negative at the 1% level, which notably is above the national average. In regions with low environmental quality, the absolute value of digital trade (DID) is 0.091 and not significant. This result aligns with expectations. Firms in regions with higher environmental quality can better leverage the effects of digital trade to improve their green investment efficiency. In regions with low environmental quality, policy failure is mainly attributable to insufficient institutional foundations. The Fisher combination test of inter-group coefficient differences yields significant results. The effect of digital trade on firms’ green investment efficiency varies significantly across firm samples in regions with different environmental quality, making comparative analysis feasible.
In the context of the rapid of digital technology and the pursuit of the “dual carbon” goals, this study empirically investigates the effect of digital trade on green investment efficiency based on China’s A-share-listed companies in heavy polluting industries. Taking the exogenous conditions provided by the pilot work of comprehensive cross-border e-commerce, we used the staggered difference-in-differences model. The findings indicate that digital trade accelerates firms’ green investment efficiency. This acceleration effect enhances corporate green investment efficiency through three channels: increasing R&D expenditure, promoting industrial structure upgrading, and strengthening digital platform development. Further analysis reveals that this accelerating effect is pronounced in the conditions of high media attention and excellent environmental quality.
The findings of this study yield significant policy implications for advancing China’s digital trade strategy and achieving high-quality development. First, expanding the construction of digital trade pilot zones while reinforcing their green-oriented mandate is essential. Expansion of CEPZ should be pursued, with explicit policy emphasis on sustainable development. Governments are encouraged to support digital trade platforms in establishing green supplier databases and dedicated low-carbon product sections, thereby facilitating precise matchmaking of green technologies and solutions between domestic and international firms. Such measures can convert the traffic advantages of digital trade into tangible momentum for corporate green transformation.
Second, a comprehensive policy support framework should be developed around the core mechanisms. This framework includes: (i) strengthening R&D incentives by implementing policies such as additional R&D expense deductions and tariff reductions for green technology imports, thereby lowering firms’ green innovation costs and stimulating autonomous innovation in green technologies; (ii) promoting firms’ green transformation and upgrading by supporting the development of green supply chain management systems through digital trade, enhancing resource utilization efficiency and environmental performance; and (iii) accelerating digital platform development by encouraging the establishment of industry-level green and low-carbon digital platforms, facilitating environmental data sharing, green technology transactions, and coordinated carbon reduction across the industrial chain.
Third, collaborative mechanisms for environmental information disclosure and public supervision should be established and institutionalized. We recommend that environmental protection and commerce authorities jointly launch an information-sharing and disclosure platform on firms’ “digital trade and environmental performance”, with regular updates on compliance and green trade practices. At the same time, involvement of news media, securities analysts, and the public should be encouraged to create sustained external pressure. The pressure can incentivize firms to allocate more of their digital trade gains toward green and low-carbon development.
Fourth, differentiated regional strategies should be implemented to optimize the enabling environment for green growth. A strong environmental foundation is a prerequisite for policy effectiveness. In regions with favorable environmental endowments, innovative mechanisms integrating digital trade with green standards and carbon market development should be prioritized. Conversely, in regions with weaker environmental conditions, emphasis should be placed on strengthening regulatory enforcement and expanding green digital infrastructure. Doing so addresses structural deficiencies and creates the necessary preconditions for harnessing the green dividends of digital trade.
Despite these contributions, this study is not without limitations. Due to sample representativeness and data availability, it focuses on A-share listed companies in high-pollution industries, which may impose certain limitations on the generalizability of its conclusions. Lightly polluting and unlisted firms may also face challenges such as substantial green investment outlays with limited returns—or, in some cases, minimal or even absent green investment activities. Whether digital trade enhances green investment efficiency in these contexts remains an open question, as do the commonalities and differences in the underlying mechanisms compared with heavy-polluting sectors. Given the growing importance of digital trade in green investment, future research should seek to incorporate recent and comprehensive data. Additionally, subsequent studies can adopt case study approaches to investigate green investment efficiency across diverse industries and regions. They can test the robustness of this study’s findings and further elaborate the mechanisms through which digital trade promotes green investment efficiency.
All data reported in this paper will be shared by the corresponding author upon reasonable request.
SY designed the research study and acquired funding. LZ designed methodology. YYang analyzed the data. Author SY, LZ and YYe wrote the manuscript. YYang critically revised the interpretation of findings and discussion section. FL critically revised the methodology and procedures. YYe contributed to study conceptualization and data collection oversight. FL conducted a research and investigation process. All authors contributed to editorial changes in the manuscript. All authors read and approved the final manuscript. All authors have participated sufficiently in the work and agreed to be accountable for all aspects of the work.
Not applicable.
This research was funded by National Social Science Foundation of China, grant number 22BJY035 and Jiangxi Provincial Department of Education general project (GJJ2200341).
The authors declare no conflict of interest.
References
Publisher’s Note: IMR Press stays neutral with regard to jurisdictional claims in published maps and institutional affiliations.