


 , Renyong Chi 1, Jianlin Lu 2,*
1 Business school, Zhejiang University of Technology, 310000 Hangzhou, Zhejiang, China
2 Business school, Qingdao University, 266000 Qingdao, Shandong, China
Abstract
Drawing on real options theory, this study examines the impact of firms’ climate policy uncertainty (CPU) perception on green investments. Unlike prior studies that treat CPU as a homogeneous macro-level factor, this paper conceptualizes it as an individualized firm-level perception and hypothesizes that rising CPU perception increases the value of the option to wait, thereby prompting firms to delay green investments. Using a sample of Chinese listed firms from 2012 to 2022, we employ the Bidirectional Encoder Representations from Transformers (BERT) model to capture firm-level CPU perception, and our findings reveal that if CPU perception increases by 1%, firms’ green investments would decrease by 0.123. Moderation analysis reveals that Confucian culture strengthens the adverse effect of CPU perception on green investments, whereas Western culture mitigates it. Additionally, the study shows that the impact of CPU perception on green investments exhibits a non-linear pattern with increasing marginal effects, such that the adverse effect is more pronounced at higher levels of CPU perception. Moreover, we observe an asymmetric impact, indicating that an increase in CPU perception significantly reduces green investments, whereas a decrease has no significant impact on green investments.
Keywords
- climate policy uncertainty perception
- green investments
- real option theory
- intuitional theory
In recent years, policymakers and scholars have increasingly acknowledged the risks associated with climate change and environmental degradation (Ren et al., 2022). This rising public concern places greater pressure on firms to reduce their ecological footprints and actively participate in sustainability efforts, such as increasing green investments. In the meantime, governments worldwide have introduced various climate policies and resolutions to promote sustainable corporate practices (Liu et al., 2020; Su et al., 2025b). However, the literature suggests that many climate policies remain in the early stages and are subject to frequent and unpredictable changes, contributing to a high degree of climate policy uncertainty (CPU) (Bai et al., 2023; Ren et al., 2022). Given that government regulation is a primary driver of firms’ green investment behavior (Dangelico, 2016; Zhang et al., 2022), such uncertainty inevitably shapes corporate decision-making processes.
While a growing body of research has explored the impact of CPU on firms’ green investment activities (Bai et al., 2023; Huo et al., 2024; Niu et al., 2023; Pan et al., 2024; Song and Dong, 2024; Sun et al., 2024a), these studies generally treat CPU as an objective, macro-level determinant. However, a more nuanced perspective recognizes that corporate decision-making is shaped not only by the external environment but also by firms’ internal perceptions of that environment (McMullen and Shepherd, 2006; Meijer et al., 2007; Su et al., 2025a). As executives formulate strategies based on available information, their unique interpretations of the firm’s context often play a more critical role than the objective environment itself (Hambrick, 2007). In the context of a changing climate policy landscape, each firm’s CPU perception may generate heterogeneous effects on green activities. Therefore, the literature needs to extend its focus to incorporate firms’ CPU perception as a key determinant of green investment decisions.
In this study, we focus on the effect of CPU perception on firms’ green investment decisions. To fulfill this research objective, we draw on real option theory and institutional theory to explore the following questions: How does CPU perception affect executives’ green investment decisions? What is the role of regional culture in the relationship between CPU perception and green investments?
Based on real options theory, this study proposes that a high level of CPU perception enhances the attractiveness of delaying investment decisions, leading firms to postpone investment (Sun et al., 2024a). When executives experience high CPU perception, they must allocate a considerable amount of attention and resources to identify the negative impacts and opportunities brought about by environmental uncertainty (Milliken, 1987), which in turn diverts their attention from green investments. Therefore, firms may adopt a conservative strategy, postponing green investments in response to high policy uncertainty. To deepen the understanding of how firms respond to CPU perception, this study draws on institutional theory, which highlights that regional culture can influence firms’ investment decisions. Specifically, we examine Confucian culture and Western culture as key factors affecting firms’ responses to uncertainty. We propose that the relationship between CPU perception and green investments may vary in Confucian culture and Western culture.
To examine the relationship between corporate perception of the CPU and green investments, we use a sample of 1468 publicly listed firms in China from 2012 to 2022. China serves as an appropriate research context for mainly three reasons. First, China is currently undergoing a significant economic transformation, and the government has implemented various climate policies aimed at regulating and guiding corporate investments and operations (Chen et al., 2021; Yu et al., 2021). Second, the majority of these policies are still in their early stages and often undergo unpredictable changes (Bai et al., 2022; Ren et al., 2022). Third, the content of these policies is usually ambiguous, posing challenges for firms in interpreting and complying with regulations (Ahsan et al., 2021; Hu et al., 2023). Our analysis shows that firms are more likely to reduce spending in green activities when they experience a higher level of CPU perception. The moderating analysis reveals that Confucian culture may strengthen the relationship between CPU perception and green investments, while Western culture may weaken the link between CPU perception and green investments. Additionally, we examine the non-linear and asymmetric effects of CPU perception on green investments. The results show that as the level of perceived CPU rises, its adverse impact on green investments increases gradually. Additionally, an increase in CPU perception significantly reduces green investments, whereas a decrease has no significant impact on green investments.
This study makes several contributions to the literature. First, unlike prior studies that treat the economic consequences of CPU as exogenous shocks (Husain et al., 2022; Hong et al., 2024), this study draws on real options theory to conceptualize CPU as a subjective perception. In doing so, we fill a gap in the literature by identifying the negative effect of firms’ CPU perceptions on green investments. Specifically, we find that when managers perceive an increase in CPU, they tend to view green investment projects as high-risk commitments. As a result, managers are more likely to postpone investment decisions and adopt a “wait-and-see” approach, deferring resource allocation until more favorable conditions or clearer information emerge. This finding enhances our understanding of how CPU influences green investments at the firm level, underscoring the role of managerial perception in shaping investment behavior.
Second, this study contributes to the literature on the role of regional culture in shaping corporate responses to CPU by examining the moderating effects of Confucian and Western cultural. The results show that firms embedded in Confucian culture, which emphasizes hierarchical ethics and collectivism, tend to prioritize short-term objectives and organizational stability. Consequently, when firms perceive elevated CPU, they are more likely to treat green investments as long-term, high-risk decisions and choose to delay investment to mitigate potential risks. In contrast, firms influenced by Western culture exhibit higher tolerance for uncertainty and a greater propensity for risk-taking, making managers more willing to engage in high-risk green investment projects. In this cultural context, the option value of waiting diminishes, thereby mitigating the adverse effect of CPU perception on green investments. Overall, our findings advance the understanding of the boundary conditions governing corporate green investment decisions under rising CPU and illustrate how cultural factors shape firms’ behavior during periods of policy uncertainty.
Third, from a methodological perspective, existing studies examining the impact of CPU on corporate behavior have primarily relied on firm-level proxies constructed from textual information in annual reports or news articles (Dai and Zhang, 2023; Shao and Xu, 2024). While these approaches provide valuable insights, they are limited in their ability to capture the contextual meaning of words, leading to biased estimates of firms’ perceptions of policy uncertainty. To address this limitation, we introduce Bidirectional Encoder Representations from Transformers (BERT). This context-dependent language model can extract sentence-level semantic information and distinguish nuanced meanings in complex policy texts to generate a more accurate and reliable measure of corporate CPU perception.
As noted by Helper et al. (2021), public policy encompasses the deliberate choices as well as the omissions of legislative and administrative actors in addressing issues of salient importance to state functionality and public welfare. Nevertheless, the development and enactment of public policy is unpredictable. Accordingly, increasing scholarly and managerial attention has been directed toward examining how uncertainties generated by regulatory ambiguity and inconsistent policy enforcement affect firms’ behavior. For instance, Julio and Yook (2012) demonstrate that firms significantly reduce investments under uncertain conditions. Hu et al. (2023) explain that high policy uncertainty prompts firms to prioritize bargaining with enforcement authorities over investing in green initiatives. Chen et al. (2023) observe that, in response to increasingly stringent environmental regulations, some firms relocate to regions with more lenient ecological policies to cope with rising compliance costs. In contrast, Fan (2025) finds that other firms actively engage with national environmental policy by formulating green development strategies, viewing such uncertainty as a strategic opportunity for sustainable transformation. Additionally, Schmitt et al. (2018) and Barnett et al. (2020) highlight that corporate behavior is often constrained by risk perceptions, leading to a “wait-and-see” approach under uncertain policy environments.
Collectively, existing studies have underscored the role of policy changes on firms’ behavior. However, researchers have paid little attention to how public policy uncertainty shapes firms’ green investment decisions. To address this gap, we refer to a more extensive body of literature to pinpoint pertinent studies.
Recent studies explore the influence of policy uncertainty on green investments, primarily focusing on macro-level uncertainties arising from changes in climate policies or political events. For example, Gavriilidis (2021) constructs a newspaper-based index of CPU using data from eight major U.S. newspapers. Building on this approach, Li et al. (2024a) provide evidence that heightened CPU accelerates R&D investments in energy production technologies. Huo et al. (2024) investigate that increased policy uncertainty drives firms to enhance their green innovation efforts. Likewise, Ma et al. (2023) create a national-level Chinese CPU index employing deep learning algorithms. Cheng et al. (2024) extend this research by showing that Chinese firms respond to rising CPU by increasing investments in environmental, social, and governance initiatives. In contrast, Zhong et al. (2025) argue that rising CPU leads energy firms to scale back their investments. Supporting this view, Li et al. (2022) use government turnover elections as a proxy for CPU and find that firms tend to postpone investment decisions in uncertain environments. Similarly, Chaudhry and Veld (2023) report a decline in environmental investment expenditures during election years. These mixed findings may result from the varied methods used to measure CPU. Some studies construct a CPU index using media coverage, while others use exogenous shocks, such as government turnovers, to proxy policy uncertainty. Bloom (2014) notes that these measures typically capture uncertainty at the national or industry level, failing to account for firms’ individual perceptions of uncertainty. When firm-level variation is overlooked, empirical analyses may miss the true relationship between CPU and green investment decisions. To better understand how policy uncertainty affects firm green investments, it is essential to develop firm-level CPU measures that capture heterogeneous perceptions of uncertainty.
The real options theory views firms’ future investment plans as a series of options (Denison et al., 2012). According to this theory, the value of the option to defer investments increases when firms perceive a high level of uncertainty (Bernanke, 1983; Dixit and Pindyck, 1994). Therefore, managers prefer to delay their investment decisions and wait for better investment opportunities in such cases (Dai et al., 2024). Green investment projects are typically long-term and irreversible. Meanwhile, the large amount of capital required for green investments increases firms’ exposure to investment risk. General investment research suggests that when firms perceive a high level of policy uncertainty, they are less able to accurately assess the prospects of green investment projects (Bloom, 2009; Panousi and Papanikolaou, 2012; Gulen and Ion, 2016; Su et al., 2024b). In such cases, the value of deferring investment decisions increases, causing managers to adopt a conservative approach instead of committing to uncertain green investment projects (Trigeorgis and Reuer, 2017). Accordingly, we expect that an elevated perception of CPU may induce a decline in corporate green investment activities.
Additionally, we anticipate that firms experiencing higher levels of perceived uncertainty will allocate more time and resources to environmental scanning and information gathering to understand how environmental changes impact their investment decisions (Milliken, 1987). Firms find it more challenging to promptly commit the critical resources in line with their sustainable development goals in this case (Teeter and Sandberg, 2017). Accordingly, we anticipate that CPU perception will foster a wait-and-see attitude among corporate decision-makers regarding green projects, thereby encouraging a more cautious investment approach. Hence, we propose the following hypothesis:
H1: CPU perception negatively affects firm green investments.
Institutional theory suggests that firms are shaped by the local value systems and cultural environments in which they operate (Malik, 2021). By defining values and expectations, culture influences how businesses structure their operations, make strategic decisions, and engage with stakeholders (Aggarwal et al., 2016). This study focuses on examining the impact of two informal institutions, including traditional Confucian culture and imported Western culture, on corporate behavior and practices.
Confucian culture, with its emphasis on the “Three Cardinal Guides”, promotes hierarchical ethics and deference to seniority, which are characteristic of a high power distance culture (Li and Yao, 2025). In such cultural contexts, managers often experience weaker oversight from the board of directors, leading to a greater inclination to pursue short-term objectives over long-term goals, such as environmental sustainability (Bai and Elyasiani, 2013). Against this backdrop, when firms are under a high level of CPU perception, they are more likely to perceive green investments as long-term, high-risk practices. Consequently, they may choose to defer such investment to avoid risk. Furthermore, Confucianism emphasizes collectivism, advocating for an individual’s contribution to the family, firm, or larger community over individualistic pursuits (Li and Zahra, 2012). Within a collectivist culture, firms and their managers tend to be group-oriented, prioritizing organizational stability and short-term collective goals, such as financial security or maintaining a strong market position. Thus, when confronted with heightened CPU perception, firms exhibit an inherent preference for caution to preserve collective stability and short-term security. This cautious stance makes a “wait-and-see” strategy (i.e., delaying investment) particularly appealing, thereby reinforcing the tendency to postpone green investments. Therefore, we put forward the following hypotheses:
H2: Confucian culture has a positive moderating effect on the relationship between CPU perception and green investments.
Indulgence is a key dimension of Western culture, contrasting sharply with the restraint emphasized in Chinese Confucian culture (Hofstede, 1980). Individuals from Western countries, such as the United States, tend to exhibit higher tolerance for uncertainty, display more risk-seeking behaviors, and are more willing to engage in innovative activities (Shane, 1993). For example, Zhang et al. (2023) find that returnee executives are more willing to take risks and allocate effort to long-term, irreversible projects such as R&D. Therefore, when firm members or executives possess a Western cultural background, they are more likely to maintain a proactive stance toward green investments in the face of risks induced by policy uncertainty. This heightened willingness to invest effectively reduces the “option value” of delaying investment, thereby mitigating the negative impact of CPU perception on corporate green investments.
Furthermore, Western culture emphasizes individualism and personal value, in contrast to the collectivism inherent in Confucian culture. Efrat (2014) finds that firms in individualistic societies allocate more resources to high-risk projects. Gao et al. (2023) further demonstrate that CEOs influenced by individualistic values are key drivers of corporate innovation. Li and Yao (2025) suggest that the stronger the influence of Western culture on Chinese firms, the more intensive their R&D activities become. These findings suggest that executives with Western cultural backgrounds are more likely to pursue long-term, uncertain projects, such as green investments, even when policy uncertainty is high, thereby mitigating the adverse effect of CPU perception on green investments. Taken together, the indulgence and individualistic features of Western culture increase executives’ tolerance for risk and strengthen their commitment to long-term, high-risk projects. Hence, we propose the following hypotheses:
H3: Western culture has an adverse moderating effect on the relationship between CPU perception and green investments.
The panel dataset comprises all firms listed on the A-share markets from 2012 to 2022. The selection of 2012 as the starting point is because the 18th National Congress of the Communist Party of China formally included the construction of an ecological civilization in the national Five-Year Integrated Plan that year. Since then, governments at all levels have implemented a series of policies and regulations aimed at promoting the green transition of various societal actors. Consistent with prior research (Li and Su, 2024b; Pan et al., 2023; Qin et al., 2024; Zhong and Ren, 2023), we process the data in the following manner: (1) financial institutions are excluded given their distinct accounting standards; (2) firms that contain a substantial proportion of missing data are removed; (3) all continuous variables are subjected to winsorization at the 1st and 99th percentiles to diminish the effect of outliers. After these steps, the final sample comprises 26,177 firm-year observations from 1468 firms.
The dataset comes from several authoritative sources. Specifically, we construct the CPU perception using information extracted from the Management Discussion and Analysis (MD&A) sections of firm reports. These reports are obtained through Wingodata.com, a platform that specializes in collecting and processing financial disclosures from listed firms on the Chinese A-share market. Data on green investments are retrieved from firms’ social responsibility reports, which are disclosed on the Cninfo Network. Other firm-level financial and operational variables are sourced from the China Security Market and Accounting Research (CSMAR) database and the Chinese Research Data Services Platform (CNRDS).
CPU perception refers to the subjective cognition and differential interpretations formed by corporate executives in response to an evolving climate policy environment (Shao and Xu, 2024). While some executives may view the shifting regulations as a source of risk, others may regard them as an opportunity for growth and development. This study focuses on managerial concern and anxiety stemming from the continuous fluctuations in climate policy. Previous research has primarily relied on text analysis to measure managerial perceptions of CPU (Sun et al., 2024b; Zhang and Sun, 2025; Zhou et al., 2023). However, this method has a significant limitation. While text analysis can capture discussions related to CPU perception, it may also capture irrelevant mentions, which can result in measurement noise. To overcome this shortcoming, we utilize BERT to identify managerial perceptions of CPU more accurately. We chose BERT for our text classification task due to its bidirectional encoding mechanism, which captures the full sentence context and improves semantic understanding. Other large language models (LLMs), including GPT and DeepSeek, similarly provide powerful feature extraction capabilities. However, we find GPT is primarily a generative model. While DeepSeek can extract semantic features, it doesn’t match BERT’s strength in leveraging bidirectional context, which is a key requirement for our task. To ensure the robustness of our results, we re-estimate CPU perception using GPT and DeepSeek as alternative proxies.
According to Devlin et al. (2019), the Bidirectional Encoder Representations from Transformers (BERT) methodology is fundamentally structured around two pivotal stages, including pre-training and fine-tuning. Within the pre-training phase, BERT identifies the complex contextual interdependencies among words by considering the contexts of words that precede and follow each target word within extensive volumes of unlabeled data. Considering that BERT is an English language model that was trained on a vast array of general texts, such as Wikipedia and BookCorpus, our initial step is to pretrain the BERT model on a diverse set of financial narratives derived from Chinese publicly listed companies. This process leads to a corpus comprising approximately 1.8 billion tokens. We then follow Devlin et al. (2019) by employing a masked language model and a sentence prediction task to address the unidirectionality constraint and enhance the model’s understanding of sentence-level relationships.
During fine-tuning, the BERT model adjusts the parameters learned during pre-training to better align with CPU perception-related tasks. Specifically, we invite three researchers with extensive expertise in climate research and policy uncertainty to manually read texts and determine whether they relate to CPU perception. We label a sentence as CPU perception-related when all three researchers independently classify it as such. The fine-tuned model undergoes training using a dataset that comprises 5300 labeled sentences, consisting of 592 examples related to CPU perception and 4708 examples unrelated to CPU perception. We then randomly partition the labelled data into three subsets: 81% for training, 9% for validation, and 10% for testing. The training set is used to optimize model parameters, the validation set for hyperparameter tuning and monitoring training loss, and the test set for evaluating final performance. The output of our BERT model represents the predicted probability that a given sentence is related to CPU perception. In line with conventional practices in deep learning classification tasks, we utilize a threshold value of 0.5. We label the sentence as CPU perception-related if the probability is 0.5 or higher. Testing results show that the BERT model delivers outstanding performance, with 99.62% accuracy, 96.61% recall, and an F1-score of 98.28%. Following existing research Bardos et al. (2025), we calculate CPU perception (CPUP) as the frequency of words with negative climate change sentiment minus that of words with positive sentiment, normalized by the total word count in the MD&A.
In line with the definition of green investments established in prior research (Patten, 2005), this study manually collects firm-specific green investment data from the “construction in progress” and “management fees” sections in the annual reports of listed firms. Green investments under the “construction in progress” category include capital expenditures for adopting clean and renewable energy sources, energy-efficient or innovative materials, and cleaner production technologies. It also covers investments in energy-saving technologies and green initiatives such as sewage treatment and waste management. In contrast, green investments under “management fees” include expenditures on pollution discharge charges, environmental greening projects, cleaning services, environmental protection costs, and other related expenses. We aggregate all relevant expenditures from both categories to measure firms’ green investments and employ the natural logarithm of green investments (denoted as GI) to ensure the robustness of the empirical analysis.
4.2.3.1 Confucian Culture
Culture is transmitted across generations through repeated education and the instillation of the same set of values (North, 1978). During the Ming and Qing dynasties, Confucian culture formed the official curriculum of the imperial examination, making the scholars who passed these exams the primary inheritors and disseminators of Confucian culture (Li and Yao, 2025). The number of jinshi, which is the highest academic degree holders in ancient China, reflects regional differences in the spread and accumulation of Confucian culture (Chen et al., 2020). Moreover, in terms of data quality, jinshi records are more complete and encompass larger sample sizes compared with other historical sources, such as Confucian temples and academies, which may have suffered damage over time. Therefore, this study uses the number of jinshi in each prefecture-level city (denoted as Confu) as a measure of Confucian cultural.
4.2.3.2 Western Culture
The consumption of Starbucks coffee reflects interactions between Chinese society and Western culture, making the density of Starbucks outlets a suitable proxy for the influence of Western culture. As an American brand, Starbucks symbolizes a modern Western lifestyle, and customers who frequent its stores often demonstrate a preference for Western cultural values (Curtin and Gaither, 2007; Han and Zhang, 2009). The expansion of Starbucks outlets in a given region signals sustained local demand for both coffee and Western culture, thereby indicating the diffusion of Western values within that area. To quantify the influence of Western culture, this study employs the geographical distribution of Starbucks outlets in China between 2012 and 2022. Specifically, we use the number of Starbucks outlets (Stabck) located within a 50 km radius of a company’s headquarters as a proxy variable. Our data are derived from the official Starbucks website and the National Enterprise Credit Information Publicity System.
Based on prior literature (Atkin et al., 2012; Cui et al., 2022; Ding et al., 2023; Huang et al., 2022; Ma et al., 2021), this study includes a set of control variables. We quantify firm size (Size) using the natural logarithm of the firms’ employee count. Financial leverage (Lev) is measured as liabilities divided by total assets. Firm financial performance (Tobin) is measured as the ratio of a firm’s market value to its total assets. Return on equity (ROE) is measured as net profit divided by equity. Equity concentration (Concen) is measured as the shareholding ratio of the largest shareholder in the firm. Cash flow (Cashflow) is measured as cash equivalents divided by total assets. Inventory (Inv) is calculated as the ratio of inventory to total assets. Firm fixed assets (Fixed) is measured as the ratio of fixed assets to total assets. Growth capability (Growth) is calculated by the change in year-to-year total sales over the last year’s value. CEO duality (dualrole) is a binary indicator that equals 1 if the same individual holds the roles of chairman and CEO, and 0 otherwise.
To test the aforementioned hypothesis, we construct the following econometric models. We first use a benchmark regression model controlling for year and firm fixed effects to examine how CPU perception influences green investments. The specific formula is as follows:
To validate the moderating roles of Confucian culture and Western culture, we
introduce
Where
Table 1 presents the descriptive statistics for the key variables used in our baseline analysis. The dependent variable, GI, has a mean of 4.891 and a standard deviation of 4.786, indicating considerable variation across firms. The independent variable, CPU perception, exhibits a mean of 1.054 and a standard deviation of 0.783, indicating that there are also substantial differences in the perception of CPU among firms. Given this, it becomes essential to investigate how varying levels of CPU perception influence green investment decisions.
| Variable | N (Number) | Mean | SD (Standard Deviation) | Min | p25 | p50 | p75 | Max |
| GI | 26,177 | 4.891 | 4.786 | 0.030 | 2.160 | 3.790 | 5.750 | 28.321 |
| CPUP | 26,177 | 1.054 | 0.783 | 0.124 | 0.533 | 0.839 | 1.319 | 4.415 |
| Confu | 26,177 | 2.709 | 0.720 | 0.000 | 1.032 | 2.773 | 3.385 | 4.007 |
| Stabck | 26,177 | 2.739 | 2.321 | 0.000 | 1.356 | 2.640 | 4.719 | 6.442 |
| Size | 26,177 | 22.232 | 1.258 | 20.133 | 21.311 | 22.023 | 22.932 | 26.212 |
| Lev | 26,177 | 0.400 | 0.195 | 0.0558 | 0.242 | 0.391 | 0.543 | 0.869 |
| Tobin | 26,177 | 0.0461 | 0.064 | –0.206 | 0.016 | 0.044 | 0.079 | 0.229 |
| ROE | 26,177 | 0.070 | 0.119 | –0.523 | 0.032 | 0.076 | 0.126 | 0.355 |
| Concern | 26,177 | 0.652 | 0.394 | 0.114 | 0.398 | 0.568 | 0.798 | 2.438 |
| Cashflow | 26,177 | 0.052 | 0.064 | –0.128 | 0.014 | 0.049 | 0.089 | 0.239 |
| Inv | 26,177 | 0.128 | 0.093 | 0.001 | 0.064 | 0.111 | 0.170 | 0.480 |
| Fixed | 26,177 | 0.211 | 0.141 | 0.008 | 0.102 | 0.185 | 0.291 | 0.652 |
| Growth | 26,177 | 0.160 | 0.335 | –0.466 | –0.018 | 0.109 | 0.261 | 1.928 |
| dualrole | 26,177 | 0.128 | 0.334 | 0.000 | 0.000 | 0.000 | 0.000 | 1.000 |
GI, green investments; CPUP, CPU perception; Confu, Confucian culture; Stabck, Starbucks outlets; Size, firm size; Lev, Financial leverage; Tobin, Firm financial performance; ROE, Return on equity; Concern, Equity concentration; Inv, Inventory; Fixed, Firm fixed assets; Growth, Growth capability; dualrole, CEO duality.
Table 2 reports the Pearson correlations among the variables. We observe that the correlation between CPU perception and green investments is negative (–0.162), which provides preliminary support that firms are likely to reduce spending in green activities when they experience greater CPU perception. Additionally, all correlation coefficients between all control variables are less than 0.5, indicating that multicollinearity is unlikely to pose a substantial issue in our analysis.
| Variables | GI | CPUP | Confu | Stabck | Size | Lev | Tobin | ROE | Concern | Cashflow | Inv | Fixed | Growth | dualrole |
| GI | 1 | |||||||||||||
| CPUP | –0.162 | 1 | ||||||||||||
| Confu | 0.105 | –0.100 | 1 | |||||||||||
| Stabck | –0.113 | 0.072 | –0.056 | 1 | ||||||||||
| Size | –0.231 | 0.271 | –0.257 | 0.202 | 1 | |||||||||
| Lev | –0.291 | 0.231 | –0.144 | 0.162 | 0.362 | 1 | ||||||||
| Tobin | –0.025 | –0.090 | 0.017 | –0.094 | –0.044 | –0.397 | 1 | |||||||
| ROE | –0.073 | –0.032 | –0.012 | –0.066 | 0.070 | –0.234 | 0.442 | 1 | ||||||
| Concern | –0.305 | –0.047 | –0.025 | 0.026 | 0.102 | 0.175 | 0.203 | 0.244 | 1 | |||||
| Cashflow | –0.089 | –0.041 | –0.026 | 0.028 | 0.072 | –0.163 | 0.454 | 0.383 | 0.152 | 1 | ||||
| Inv | –0.121 | –0.058 | 0.013 | 0.014 | 0.015 | 0.209 | –0.059 | 0.005 | 0.200 | –0.179 | 1 | |||
| Fixed | –0.249 | 0.159 | –0.116 | 0.046 | 0.125 | 0.139 | –0.123 | –0.104 | 0.010 | 0.187 | –0.169 | 1 | ||
| Growth | –0.025 | –0.011 | 0.009 | –0.069 | 0.042 | 0.022 | 0.298 | 0.311 | 0.154 | 0.044 | 0.021 | –0.056 | 1 | |
| dualrole | 0.055 | 0.012 | 0.022 | 0.078 | –0.029 | 0.201 | –0.372 | –0.404 | –0.119 | –0.201 | –0.009 | 0.072 | –0.151 | 1 |
Figs. 1,2 present the annual mean of CPU perception in firms across different industries and sizes. As seen in Fig. 1, firms in sectors such as electricity, heat, gas, and water production and supply, water conservancy, environmental and public utilities management, and mining experience higher levels of CPU perception. The higher perception in these industries arises because they are directly affected by environmental factors, which necessitates careful management and strict compliance with regulations (Chung et al., 2025; Feng et al., 2024; He et al., 2025; Song et al., 2025; Xu et al., 2025). Consequently, their boards may be more sensitive to changes in climate policies, increasing their vulnerability to the uncertainty unleashed through climate policy changes. In contrast, firms in industries such as information transmission, software and information technology services, and health and social work exhibit the lowest levels of CPU perception. The lower perception in these sectors stems from their greater reliance on non-energy resources, rendering them less impacted by environmental regulations (Imran et al., 2024; Liu et al., 2024). Consequently, their boards pay comparatively less attention to the uncertainties posed by changes in climate policies.
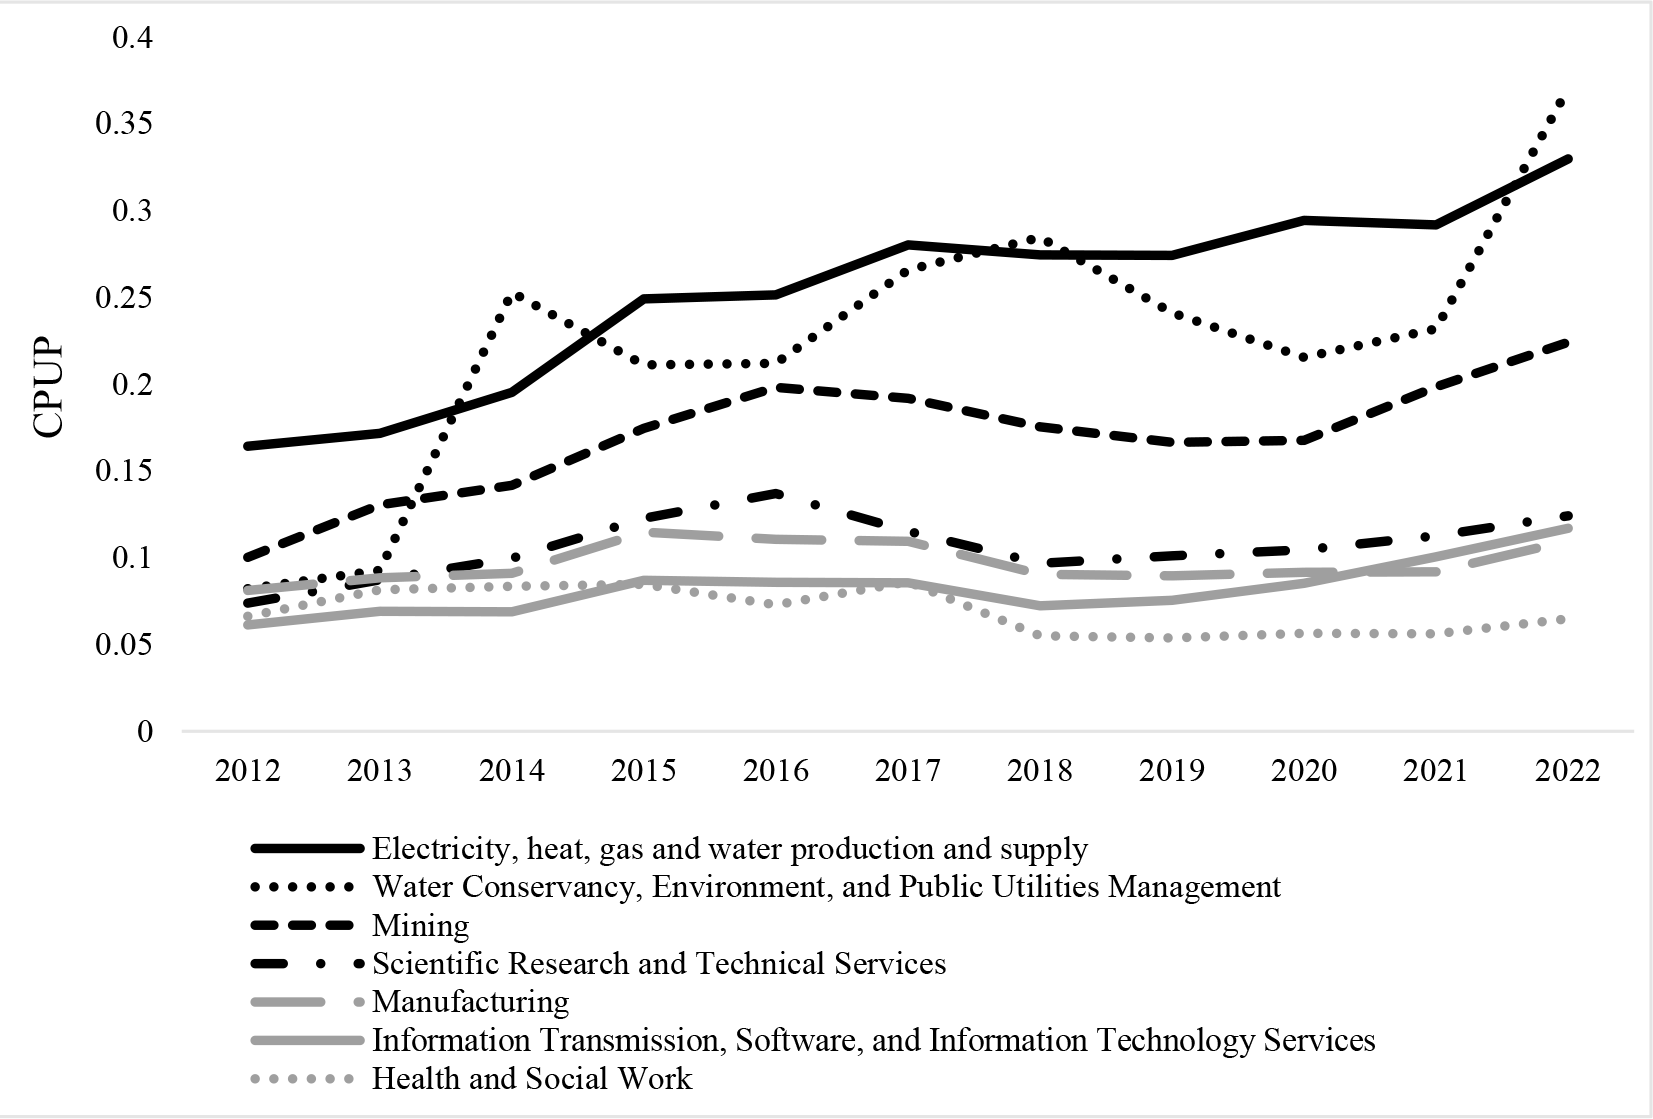 Fig. 1.
Industry heterogeneity of CPU perception. CPU, climate policy uncertainty; CPUP, CPU perception.
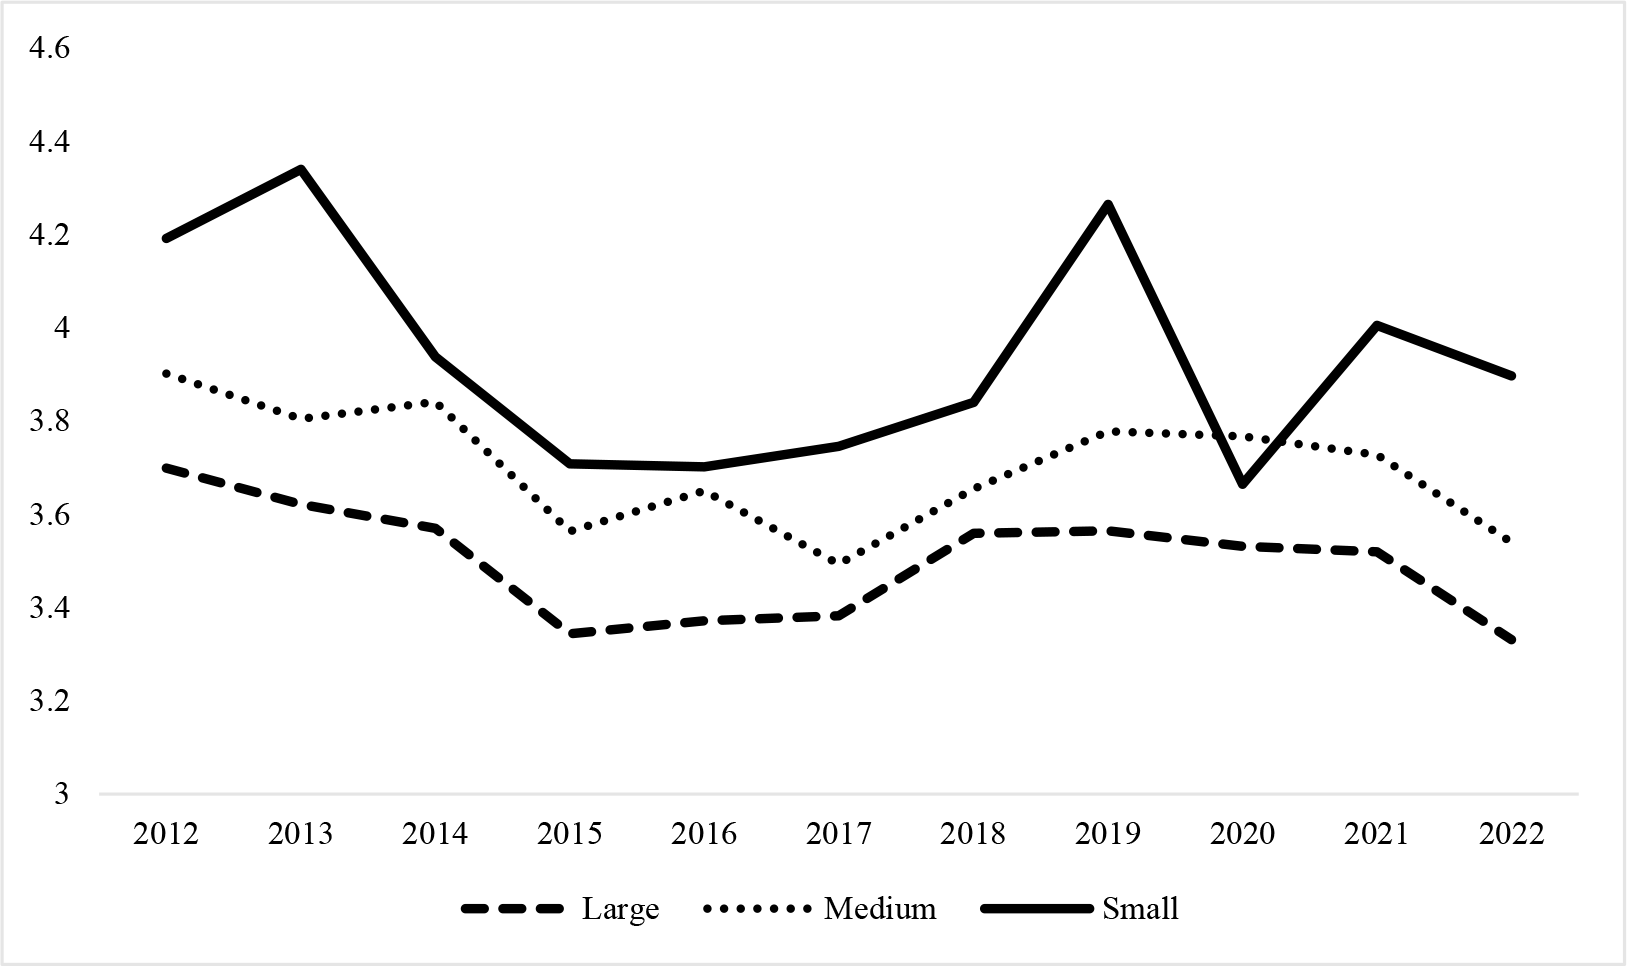 Fig. 2.
Size heterogeneity of CPU perception.
Fig. 2 shows that firms of different sizes have varying perceptions of CPU. Specifically, the level of uncertainty perception is higher among small enterprises compared to large enterprises. One possible reason is that smaller firms typically have fewer resources and limited access to information, which in turn renders them more susceptible to changes in public policies. In contrast, larger firms usually possess more substantial resources and have access to a broader range of information, which enhances their capability to navigate and mitigate the risks associated with changing policies. Overall, the preceding analysis highlights substantial variation in CPU perception among different companies. Therefore, it is necessary to measure the firm-specific perception of climate policy uncertainty.
This study primarily employs a two-way fixed effects model to examine the impact of CPU perception on green investments. For robustness checking, we also present the results from ordinary least squares and a random effects model for comparison. Columns (1), (3), and (5) in Table 3 report the baseline results without control variables, while Columns (2), (4), and (6) report the results with control variables included. The findings outlined in Table 3 indicate that the coefficient of perception of firms’ CPU is always significantly negative. For instance, Column (6) of Table 3 suggests that if CPU perception increases by 1%, firms’ green investments will decrease by 0.123 after including the control variables. This finding suggests that when firms perceive a high level of CPU, they tend to delay green investment decisions, opting to wait for a more stable environment. Therefore, H1 is supported.
| (1) | (2) | (3) | (4) | (5) | (6) | |
| OLS | OLS | RE | RE | FE | FE | |
| CPUP | –0.997*** | –0.556*** | –0.061** | –0.155*** | –0.110*** | –0.123*** |
| (–26.541) | (–15.665) | (–2.103) | (–5.548) | (–3.598) | (–4.223) | |
| Size | –0.221*** | 0.206*** | –0.016 | |||
| (–8.494) | (7.578) | (–0.423) | ||||
| Lev | –4.938*** | –2.882*** | –2.167*** | |||
| (–25.471) | (–19.091) | (–14.175) | ||||
| Tobin | –9.986*** | –12.470*** | –10.782*** | |||
| (–8.033) | (–17.352) | (–15.208) | ||||
| ROE | 2.362*** | 2.942*** | 2.695*** | |||
| (3.766) | (8.643) | (8.089) | ||||
| Concern | –2.848*** | –2.057*** | –1.737*** | |||
| (–38.933) | (–27.303) | (–21.894) | ||||
| Cashflow | –1.055** | –0.365 | –0.721*** | |||
| (–2.137) | (–1.415) | (–2.821) | ||||
| Inv | –4.340*** | 0.342 | 0.778*** | |||
| (–14.105) | (1.189) | (2.629) | ||||
| Fixed | –7.461*** | –1.560*** | 0.353* | |||
| (–37.180) | (–8.066) | (1.743) | ||||
| Growth | 0.508*** | –0.455*** | –0.549*** | |||
| (6.047) | (–10.627) | (–12.810) | ||||
| dualrole | 0.636*** | 0.359*** | 0.229*** | |||
| (6.391) | (7.106) | (4.657) | ||||
| Constant | 5.942*** | 16.527*** | 5.492*** | 4.147*** | 4.392*** | 7.067*** |
| (120.520) | (30.330) | (64.225) | (6.931) | (75.937) | (8.616) | |
| Firm FE | YES | YES | YES | YES | YES | YES |
| Year FE | YES | YES | YES | YES | YES | YES |
| N | 26,177 | 26,177 | 26,177 | 26,177 | 26,177 | 26,177 |
| R2 | 0.027 | 0.225 | 0.027 | 0.112 | 0.037 | 0.138 |
Note: t statistics in parentheses, ***, **, and * represent significant at the 1%, 5% and 10% levels, respectively. OLS, Ordinary Least Squares; RE, Random Effects; FE, Fixed Effects; R2, Coefficient of Determination.
To ensure the robustness of our empirical results, we conduct a series of robustness checks. First, we employ alternative measures for corporate green investments. Specifically, we standardize corporate green investment using total assets and operating income (denoted as GI_TA and GI_OI, respectively) to create new proxies for this variable (Chen et al., 2023; Ding et al., 2023). Besides, we re-estimate CPU perception using other LLMs such as ChatGPT and DeepSeek (denoted as CPUP_gpt and CPUP_deepseek). The regression results presented in Columns (1–4) of Table 4 show that CPU perception has a negative correlation with green investments, confirming that our baseline findings are robust. Second, we alter the measurement of CPU perception. We use the ratio of the number of uncertainty words to the total number of words in the MD&A (CPUP_word) and the total number of sentences related to CPU perception (CPUP_num) as alternative proxies (Sun et al., 2024a; Xu et al., 2025). As reported in columns (5) and (6) of Table 4, the effect of CPU perception on corporate green investments remains negative at the 1% confidence level. Therefore, these tests confirm that our main findings are reliable and robust.
| (1) | (2) | (3) | (4) | (5) | (6) | |
| GI | GI | GI | GI | GI_TA | GI_OI | |
| CPUP_num | –0.747*** | |||||
| (–4.291) | ||||||
| CPUP_word | –0.158** | |||||
| (–2.045) | ||||||
| CPUP_gpt | –0.230*** | |||||
| (–3.894) | ||||||
| CPUP_deepseek | –0.188*** | |||||
| (–3.180) | ||||||
| CPUP | –0.122*** | –0.062*** | ||||
| (–4.045) | (–4.741) | |||||
| Size | –0.047 | –0.017 | –0.025 | 0.050 | –0.139*** | –0.083*** |
| (–1.228) | (–0.440) | (–0.662) | (1.134) | (–3.456) | (–4.812) | |
| Lev | –2.264*** | –2.168*** | –1.995*** | –2.151*** | 2.239*** | 0.551*** |
| (–14.708) | (–14.179) | (–12.548) | (–14.041) | (13.771) | (7.972) | |
| Tobin | –10.671*** | –10.740*** | –10.881*** | –10.720*** | 38.520*** | –90.701*** |
| (–14.931) | (–15.147) | (–15.327) | (–15.069) | (48.563) | (–280.899) | |
| ROE | 2.732*** | 2.686*** | 2.763*** | 2.637*** | –125.592*** | –4.457*** |
| (8.141) | (8.059) | (8.275) | (7.881) | (–319.986) | (–29.367) | |
| Concern | –1.704*** | –1.736*** | –1.724*** | –1.725*** | 1.818*** | 0.656*** |
| (–21.110) | (–21.875) | (–21.719) | (–21.637) | (21.895) | (18.289) | |
| Cashflow | –0.719*** | –0.721*** | –0.725*** | –0.697*** | 1.539*** | 0.202* |
| (–2.811) | (–2.820) | (–2.837) | (–2.721) | (5.774) | (1.750) | |
| Inv | 1.062*** | 0.784*** | 0.852*** | 0.806*** | –1.076*** | –1.171*** |
| (3.518) | (2.646) | (2.877) | (2.716) | (–3.510) | (–8.870) | |
| Fixed | –0.197 | 0.330 | 0.429** | 0.338* | –2.262*** | –1.666*** |
| (–0.865) | (1.629) | (2.096) | (1.661) | (–10.767) | (–18.355) | |
| Growth | –0.548*** | –0.548*** | –0.538*** | –0.546*** | 0.313*** | 0.265*** |
| (–12.722) | (–12.783) | (–12.548) | (–12.730) | (6.991) | (13.668) | |
| dualrole | 0.233*** | 0.231*** | 0.234*** | 0.248*** | 0.468*** | 0.272*** |
| (4.729) | (4.688) | (4.754) | (5.012) | (9.210) | (12.346) | |
| Constant | 8.196*** | 7.012*** | –0.025 | 0.050 | 37.139*** | 23.185*** |
| (9.694) | (8.518) | (–0.662) | (1.134) | (42.970) | (62.361) | |
| Firm FE | YES | YES | YES | YES | YES | YES |
| Year FE | YES | YES | YES | YES | YES | YES |
| N | 26,177 | 26,177 | 26,177 | 26,177 | 26,177 | 26,177 |
| R2 | 0.139 | 0.137 | 0.138 | 0.138 | 0.162 | 0.168 |
Note: t statistics in parentheses, ***, **, and * represent significant at the 1%, 5% and 10% levels, respectively.
To address the concern that our baseline results might be driven by omitted variables correlated with firms’ environmental actions, we incorporate a set of control variables. At the firm level, prior studies suggest that well-governed and innovative firms are more willing to invest in green initiatives, thereby achieving better sustainability performance (Ioannou and Serafeim, 2015; Jain and Jamali, 2016). We therefore add corporate governance (FirmGov) and R&D expenditure (FirmRD) as additional controls. At the industry and regional levels, to account for potential peer effects, we incorporate the average green investment at the industry (IndGI) and province (RegGI) levels. At the national level, we control for the institutional environment by including the Rule of Law index (Natlaw) and the Press Freedom index (Natmedia). Jia and Li (2020) posit that in countries with stronger legal frameworks and greater freedom of speech, stakeholders are more empowered and better informed, which encourages firms to allocate more resources to green activities. All data come from CSMAR and CNRDS.
After incorporating these additional controls, we re-estimate the panel regressions, and the results are reported in Table 5. As expected, R&D expenditure and corporate governance are positively associated with firms’ green investments. The positive coefficients of IndGI and RegGI suggest that corporate green investment can be shaped by peer effects at the industry or regional level. While the World Press Freedom Index appears to be unrelated to firms’ green investments, national-level control of corruption and the rule of law remain significantly linked to more substantial green investments. Importantly, the results are consistent with those reported in Table 3, suggesting that our main findings remain robust after the addition of more control variables.
| (1) | (2) | (3) | (4) | |
| GI | GI | GI | GI | |
| CPUP | –0.065** | –0.128*** | –0.121*** | –0.123*** |
| (–2.002) | (–4.290) | (–4.177) | (–4.226) | |
| Size | –0.251*** | –0.001 | –0.110*** | –0.018 |
| (–4.919) | (–0.007) | (–2.766) | (–0.477) | |
| Lev | –1.708*** | –2.285*** | –2.127*** | –2.166*** |
| (–9.560) | (–14.445) | (–13.896) | (–14.166) | |
| Tobin | –11.879*** | –11.038*** | –10.939*** | –10.782*** |
| (–15.361) | (–15.141) | (–15.417) | (–15.208) | |
| ROE | 3.142*** | 2.833*** | 2.645*** | 2.696*** |
| (8.619) | (8.177) | (7.935) | (8.091) | |
| Concern | –1.867*** | –1.747*** | –1.813*** | –1.737*** |
| (–19.607) | (–21.109) | (–22.686) | (–21.891) | |
| Cashflow | –0.807*** | –0.635** | –0.783*** | –0.721*** |
| (–2.940) | (–2.412) | (–3.063) | (–2.821) | |
| Inv | 0.720** | 1.017*** | 0.740** | 0.771*** |
| (2.141) | (3.328) | (2.496) | (2.600) | |
| Fixed | 0.407* | 0.381* | 0.356* | 0.352* |
| (1.698) | (1.821) | (1.752) | (1.734) | |
| Growth | –0.559*** | –0.523*** | –0.524*** | –0.548*** |
| (–12.219) | (–11.846) | (–12.180) | (–12.779) | |
| dualrole | 0.206*** | 0.246*** | 0.233*** | 0.230*** |
| (3.977) | (4.827) | (4.726) | (4.669) | |
| FirmGov | 0.107*** | |||
| (3.595) | ||||
| FirmRD | 0.576*** | |||
| (13.454) | ||||
| IndGI | 0.062** | |||
| (2.248) | ||||
| RegGI | 0.305*** | |||
| (7.790) | ||||
| Natlaw | –0.006 | |||
| (–0.003) | ||||
| Natmedia | 0.434 | |||
| (0.512) | ||||
| Constant | 11.181*** | 6.775*** | 4.595*** | 6.907*** |
| (8.529) | (7.851) | (5.205) | (7.833) | |
| Firm FE | YES | YES | YES | YES |
| Year FE | YES | YES | YES | YES |
| N | 26,177 | 26,177 | 26,177 | 26,177 |
| R2 | 0.163 | 0.146 | 0.140 | 0.138 |
Note: t statistics in parentheses, ***, **, and * represent significant at the 1%, 5% and 10% levels, respectively.
In the previous analysis, our findings suggest that firms are more likely to reduce their green investments when they face a high level of CPU. However, the results may be affected by reverse causality. As Xu et al. (2025) note, the more involved a firm is in green investments, the more likely its board of directors is to give specific attention to CPU perception. To mitigate the potential impact of reverse causality in our regression analysis, we employ a Two-Stage Least Squares Regression (2SLS) with two instrumental variables. First, referring to the work of Li et al. (2024a), we apply a one-period lag to the independent variable, CPU perception (CPUP_lag), as the first instrumental variable. Second, we employ national-level climate policy uncertainty (nation_CPU) indices as the second instrumental variable. Drawing on the research of Peng et al. (2023), this index is calculated based on the frequency of articles related to climate and policy uncertainty in 10 leading Chinese newspapers. Table 6 presents the results of the instrumental variable approach. In the first-stage estimations reported in columns (1) and (3), the coefficient of the CPUP_lag and nation_CPU are both significantly positive at 1% confidence level, indicating that the instrumental variable meets the relevance criterion. Furthermore, the Kleibergen-Paap rk Wald F statistics are 45.238 and 47.289, respectively, which reject the null hypothesis of weak instruments. Additionally, the Hansen J test in the second stage suggests that we cannot reject the null hypothesis that the instrumental variable is uncorrelated with the second-stage residuals, confirming the exogeneity and validity of the instrument variables. The second-stage regression results in columns (2) and (4) report that the coefficient for CPUP remains significantly negative at the 1% significance level, consistent with the baseline findings. Thus, our results remain robust and unchanged.
| (1) | (2) | (3) | (4) | |
| CPUP | GI | CPUP | GI | |
| CPUP_lag | 0.107*** | |||
| (23.042) | ||||
| CPUP | –0.162*** | –0.565*** | ||
| (–31.507) | (–3.708) | |||
| nation_CPU | 0.242*** | |||
| (4.731) | ||||
| Size | 0.068*** | 0.825*** | 0.068*** | 0.825*** |
| (7.725) | (84.121) | (7.729) | (84.149) | |
| Lev | –0.017 | –0.442*** | –0.029 | –0.484*** |
| (–0.467) | (–11.243) | (–0.826) | (–11.833) | |
| Tobin | –0.307* | 0.238 | –0.135 | 0.272 |
| (–1.866) | (1.308) | (–0.802) | (1.494) | |
| ROE | 0.076 | –0.112 | 0.079 | –0.131 |
| (0.979) | (–1.314) | (1.025) | (–1.535) | |
| Concern | 0.001 | 0.463*** | –0.021 | 0.460*** |
| (0.056) | (22.719) | (–1.115) | (22.549) | |
| Cashflow | –0.011 | 0.182*** | 0.025 | 0.184*** |
| (–0.185) | (2.771) | (0.423) | (2.805) | |
| Inv | –0.238*** | 0.360*** | –0.246*** | 0.350*** |
| (–3.462) | (4.737) | (–3.587) | (4.616) | |
| Fixed | 0.286*** | 0.455*** | 0.274*** | 0.427*** |
| (6.076) | (8.743) | (5.807) | (8.121) | |
| Growth | –0.014 | –0.034*** | –0.012 | –0.037*** |
| (–1.367) | (–3.130) | (–1.158) | (–3.321) | |
| dualrole | –0.021* | 0.011 | –0.021* | 0.010 |
| (–1.875) | (0.864) | (–1.829) | (0.819) | |
| Constant | 3.273*** | 5.078*** | –0.608*** | –0.874*** |
| (10.400) | (14.590) | (–3.169) | (–4.127) | |
| Firm FE | YES | YES | YES | YES |
| Year FE | YES | YES | YES | YES |
| Kleibergen-Paap rk Wald F statistic | 45.238 | 47.289 | ||
| p-value for Hansen J statistic | 0.503 | 0.514 | ||
| N | 20,755 | 20,755 | 26,177 | 26,177 |
| R2 | 0.096 | 0.562 | 0.097 | 0.562 |
Note: t statistics in parentheses, *** and * represent significant at the 1% and 10% levels, respectively.
We next examine the moderating roles of Confucian culture and Western culture in
shaping the impact of CPU perception on green investments. To test these
mechanisms, we extend Eqn. 1 by introducing interaction terms between CPU
perception and Confucian culture (CPUP
| (1) | (2) | (3) | (4) | |
| GI | GI | GI | GI | |
| CPUP | –0.136*** | –0.135*** | –0.105*** | –0.106*** |
| (–4.618) | (–4.588) | (–3.640) | (–3.674) | |
| Confu | –0.018*** | –0.018*** | ||
| (–3.443) | (–3.378) | |||
| CPUP |
–0.101* | |||
| (–1.905) | ||||
| Stabck | 0.433*** | 0.431*** | ||
| (19.798) | (19.745) | |||
| CPUP |
0.021*** | |||
| (3.670) | ||||
| Size | –0.023 | –0.018 | –0.019 | –0.020 |
| (–0.587) | (–0.454) | (–0.514) | (–0.525) | |
| Lev | –2.025*** | –2.013*** | –1.929*** | –1.771*** |
| (–12.848) | (–12.757) | (–12.698) | (–11.211) | |
| Tobin | –9.236*** | –8.069*** | –13.841*** | –13.970*** |
| (–12.746) | (–8.501) | (–19.239) | (–19.401) | |
| ROE | 2.122*** | 2.160*** | 2.631*** | 2.707*** |
| (6.298) | (6.401) | (7.968) | (8.184) | |
| Concern | –1.693*** | –1.691*** | –1.344*** | –1.333*** |
| (–20.961) | (–20.936) | (–16.569) | (–16.426) | |
| Cashflow | –0.724*** | –0.702*** | –1.365*** | –1.371*** |
| (–2.760) | (–2.673) | (–5.347) | (–5.372) | |
| Inv | 0.510* | 0.516* | 0.948*** | 0.983*** |
| (1.696) | (1.718) | (3.229) | (3.349) | |
| Fixed | 0.194 | 0.212 | 0.573*** | 0.679*** |
| (0.930) | (1.012) | (2.847) | (3.340) | |
| Growth | –0.553*** | –0.544*** | –0.588*** | –0.580*** |
| (–12.684) | (–12.401) | (–13.841) | (–13.623) | |
| dualrole | 0.208*** | 0.219*** | 0.218*** | 0.220*** |
| (4.203) | (4.393) | (4.469) | (4.515) | |
| Constant | 7.160*** | 7.040*** | 5.629*** | 5.465*** |
| (8.573) | (8.406) | (6.898) | (6.688) | |
| Firm FE | YES | YES | YES | YES |
| Year FE | YES | YES | YES | YES |
| N | 26,177 | 26,177 | 26,177 | 26,177 |
| R2 | 0.129 | 0.162 | 0.153 | 0.154 |
Note: t statistics in parentheses, ***, and * represent significant at the 1% and 10% levels, respectively.
In contrast, Column (3) shows that the coefficient of Western culture is
significantly positive, indicating that firms influenced by Western culture
exhibit higher levels of green investment. Column (4) indicates that the
coefficient of CPUP
Given the dynamic and volatile nature of CPU perception, its impact on green investment may not be simply linear. Instead, the effect could be contingent on the level of perceived uncertainty, exhibiting stage-like or threshold characteristics. To investigate this possibility, we employ a threshold regression model, using CPU perception itself as the threshold variable to test for such a non-linear relationship empirically. The results in Column (1) of Table 8 indicate that when CPU perception is below the first threshold, its regression coefficient is significantly negative. As CPU perception falls between the first and second thresholds, the coefficient remains significantly negative, with a larger absolute value. When CPU perception exceeds the second threshold, the adverse effect on green investments further increases. These results indicate a marginal increasing effect of CPU perception, as the level of perceived CPU rises, its adverse impact on green investments increases gradually.
| (1) | (2) | |
| GI | GI | |
| CPUP |
–0.057** | |
| (–2.406) | ||
| 2.031 |
–0.094*** | |
| (–3.080) | ||
| CPUP |
–0.159*** | |
| (–6.617) | ||
| CPUP_Up | –0.018*** | |
| (–3.406) | ||
| CPUP_Down | 0.139 | |
| (1.402) | ||
| Size | –0.440*** | –0.031 |
| (–19.461) | (–0.809) | |
| Lev | –0.846*** | –2.026*** |
| (–6.211) | (–12.846) | |
| Tobin | 3.088*** | –9.187*** |
| (3.267) | (–12.674) | |
| ROE | –0.848** | 2.107*** |
| (–2.540) | (6.252) | |
| Concern | –0.797*** | –1.693*** |
| (–14.712) | (–20.953) | |
| Cashflow | –1.553*** | –0.719*** |
| (–4.374) | (–2.742) | |
| Inv | –0.889*** | 0.546* |
| (–5.676) | (1.819) | |
| Fixed | –1.368*** | 0.153 |
| (–12.132) | (0.731) | |
| Growth | 0.163*** | –0.551*** |
| (3.967) | (–12.626) | |
| dualrole | –0.252*** | 0.211*** |
| (–4.367) | (4.262) | |
| Constant | 11.969*** | –0.031 |
| (22.903) | (–0.809) | |
| Firm FE | YES | YES |
| Year FE | YES | YES |
| N | 26,177 | 20,755 |
| R2 | 0.078 | 0.129 |
Note: t statistics in parentheses, ***, **, and * represent significant at the 1%, 5% and 10% levels, respectively.
Following the approach of Peng et al. (2023), we employ a first-difference approach to decompose the change in CPU into up and down components, capturing scenarios of rising and falling CPU perception, respectively. We then incorporate these variables into an asymmetric regression model to estimate their differential impacts on green investments. The results in Column (2) of Table 8 reveal that a rising CPU perception significantly decreases green investments, whereas a decrease in CPU perception has no effect on green investments. This asymmetry may stem from the fact that heightened uncertainty exacerbates policy volatility and investment risk, thus deterring firms’ green investment initiatives. When firms postpone green investments, they often face significant challenges in reversing this decision due to the phenomenon of “downward rigidity” (Elsby, 2009). This rigidity in green investment decisions arises from factors such as high sunk costs, path dependence, and persistent market expectations, which collectively hinder the resumption of deferred investments.
This study investigates the impact of CPU perception on green investments. Drawing on real options theory, we develop a theoretical framework to explain why heightened CPU perception can discourage firms from undertaking environmentally sustainable initiatives. To test this relationship, the study employs a dataset of 26,177 firm-year observations from Chinese A-share listed companies. The results demonstrate that firms perceiving greater CPU will reduce their green investments, and this finding remains robust across a series of robust tests. Further moderation analysis reveals that Confucian culture strengthens the adverse effect of CPU perception on green investments, whereas Western culture mitigates it. We attribute this to the fact that the high power distance and collectivism inherent in Confucian culture prompt managers to adopt a risk-averse, “wait-and-see” strategy when faced with policy uncertainty. In contrast, the indulgence and individualism promoted by Western culture enhance managerial risk tolerance, making them more willing to invest in long-term projects such as green innovation. Further analysis reveals that the effect of CPU perception on green investment exhibits a non-linear pattern with increasing marginal effects. Moreover, the perception of climate policy uncertainty exhibits an asymmetric effect on green investments
This study makes three main contributions. First, we enrich the research on the determinants of green investments by focusing on the role of firm-level perception of CPU. Existing research suggests that in a volatile institutional environment, the guiding and regulatory effects of climate policy tools may be diminished (Fuss et al., 2009). Consequently, a growing body of literature has examined how CPU influences corporate R&D decisions (Bai et al., 2023; Fischer and Sterner, 2012; Sun et al., 2024a). However, most of these studies treat CPU as a macro-level and homogeneous variable, thereby overlooking the importance of managers’ subjective perceptions in the decision-making process. By contrast, our paper focuses on CPU perception as a subjective and firm-specific factor, an area that has been underexplored in the current research. Understanding how firms’ perceptions of CPU affect green investments is crucial, as the dynamic nature of the business environment and inter-firm differences lead to heterogeneity in how climate policy intentions are perceived, which in turn influences corporate decisions. Our findings indicate that heightened CPU perception prompts firms to adopt a more conservative strategy, thereby constraining green investments.
Second, departing from existing studies that rely on simple word frequency counts from annual reports and MD&A sections (Su et al., 2024a; Sun et al., 2024b), this paper employs the BERT model to measure CPU perception. This advanced deep learning method, which combines pre-training and fine-tuning, introduces context-aware semantic understanding to identify sentences related to CPU perception precisely. It overcomes the limitation of traditional lexicon-based methods, which often fail to distinguish between semantic relevance and contextual intent, thereby providing a more accurate and nuanced measure of corporate CPU perception.
Third, this study extends institutional theory by revealing the significant moderating role of cultural context in the relationship between CPU perception and corporate green investments. Differing from prior literature that directly examines the impact of formal institutional factors on green investments (Chu et al., 2018; Tina Dacin et al., 2002), our research incorporates Confucian and Western cultures as informal institutions and explores their moderating effects. The analysis reveals that Confucian culture amplifies the adverse impact of CPU perception on GI, while Western culture mitigates it. This finding not only sheds light on cultural variation in firms’ strategic responses under uncertainty but also deepens the theoretical understanding of the boundary conditions of institutional theory.
Despite its contributions, this study has several limitations. First, although we develop a micro-level measure of corporate CPU perception, we lack other available metrics for cross-validation. Future research could develop alternative and innovative measures to corroborate our findings. Second, due to data availability, our sample is limited to publicly listed companies, thus excluding small and medium-sized enterprises (SMEs) and startups. Given their lower resilience, these firms may exhibit greater sensitivity to climate policy changes, an issue that warrants further empirical exploration. Third, the variation of CPU across different economies may limit the generalizability of our results. Future research could extend the analysis to a cross-country setting to gain a more comprehensive understanding of the economic consequences of corporate CPU perception.
All data reported in this paper will be shared by the corresponding author upon reasonable request.
MF: Writing-original draft, Visualization, Software, Methodology, Investigation, Data curation. RC: Conception, Data curation. JL: Conception, Investigation, Methodology, Writing-review & editing. All authors contributed to editorial changes in the manuscript. All authors read and approved the final manuscript. All authors have participated sufficiently in the work and agreed to be accountable for all aspects of the work.
The authors are extremely grateful to the anonymous reviewer for invaluable comments and suggestions.
This research received no external funding.
The authors declare no conflict of interest.
During the preparation of this work the authors used ChatGPT-3.5 in order to check spelling and grammar. After using this tool, the authors reviewed and edited the content as needed and take full responsibility for the content of the publication.
References
Publisher’s Note: IMR Press stays neutral with regard to jurisdictional claims in published maps and institutional affiliations.