


 , Zoran Rakićević 1, Milica Maričić 2
1 Department for Production and Services Management, University of Belgrade, Faculty of Organizational Sciences, 11000 Belgrade, Serbia
2 Department of Operational Research and Statistics, University of Belgrade, Faculty of Organizational Sciences, 11000 Belgrade, Serbia
Abstract
This paper examines how the organizational environment for Corporate Entrepreneurship (CE) differs across organizational forms in the public and private sectors. The Corporate Entrepreneurship Assessment Instrument (CEAI) was administered to 682 respondents in the Republic of Serbia, which is institutionally and economically considered a valid representative of Southeastern European economies. The partial least squares structural equation modeling (PLS-SEM) was employed to assess how five dimensions—Management support, Rewards/Reinforcement, Work discretion/Autonomy, Time availability, and Organizational boundaries—affect the CE environment. Further, using a multi-group analysis algorithm, differences between models in the public and private sectors were explored. The results reveal significant differences in both the impact and values of the CEAI dimensions across organization types. These findings offer valuable insights for developing CE support strategies tailored to different organizations. The presented approach provides guidance to decision-makers seeking to avoid reliance on generic strategies largely shaped by private-sector experiences in developed countries.
Keywords
- corporate entrepreneurship
- internal environment
- public and private sectors
- corporate entrepreneurship assessment instrument (CEAI)
- structural equation modeling (SEM)
Entrepreneurship is often defined as “the process by which individuals pursue opportunities without regard to the resources they currently control” (Barringer and Ireland, 2010, p. 30). The study of entrepreneurship has evolved significantly and is now recognized as critical to economic growth, as it serves as a driver of technological, economic, financial, and social development (Antoncic and Hisrich, 2003; Leković and Berber, 2019; Zahra and Wright, 2016).
Entrepreneurs, who are predominantly perceived as external, recognize opportunities, i.e., they discover market needs and turn them into successful businesses by founding new companies (Longenecker et al., 2017). However, entrepreneurs can also be internal, i.e., individuals employed by established companies or organizations who engage in entrepreneurial behaviors, a practice commonly referred to as Intrapreneurship or Corporate Entrepreneurship (CE). These behaviors include taking initiatives, identifying and seizing opportunities, generating ideas for development and improvement, expanding market reach, innovating products, services, and processes, leading new product development, establishing subsidiaries, and engaging in acquisitions (Hernández-Perlines et al., 2022). CE is critical for organizations to maintain or enhance their competitive advantage, drive innovation (Djordjevic et al., 2021), and differentiate themselves from the competition by aligning organizational culture with entrepreneurial thinking (Kontić et al., 2017). Therefore, it is imperative for educators and researchers to continue exploring the latest concepts in CE to ensure that the next generation fully understands the importance of CE.
This paper aims to examine the differences in the internal environment for CE in public and private organizations in the Southeastern Europe (SEE) region, particularly in the Republic of Serbia, which is a characteristic SEE example of a developing country that has undergone a transition from a planned to a market economy, where entrepreneurial activity influences economic growth (Stefanović et al., 2018). According to the Global Entrepreneurship Monitor, a measurement tool of the level of entrepreneurial behavior and attitudes at the country level, in 2024, Serbia ranks favorably compared to the regional average (Global Entrepreneurship Monitor, 2025). Namely, it outperforms the regional average in terms of the perceived capabilities rate among the general population, the entrepreneurial intentions rate, and the perception of entrepreneurship as a good career choice. The official data confirms the above-mentioned. In 2023, Serbia had 248,906 registered entrepreneurs employing 265,900 individuals, who collectively capitalized 2.3 trillion dinars, equivalent to approximately 20 billion euros (Serbia Business, 2024). Therefore, we perceived Serbia and its entrepreneurial ecosystem as a good case study in the SEE region and suitable for our study.
Although previous research on CE determinants has been conducted in this geographical region (for example, Janićijević and Kontić, 2025), it has mainly focused on one sector, the private banking sector. Consequently, a research gap remains regarding the intrapreneurial differences between the public and private sectors, both in terms of stimulants and constraints, which have already been acknowledged (Sadler, 2000). Therefore, by assessing employees’ perceptions of key internal organizational factors, this paper aims to examine the conditions of internal environment antecedents for CE in private and public organizations. A thorough understanding of the internal environment conducive to the development of CE is an essential area of this research, which would then make it possible to recommend actions tailored to specific types of organizations that could improve the organizational climate and employees’ innovative activities, as well as identify opportunities and remove barriers to the implementation of intrapreneurship. For this reason, a survey based on the Corporate Entrepreneurship Assessment Instrument (CEAI) was conducted, while the specificities of the impact of organizational types on the CE were investigated using structural equation modeling (SEM), multi-group SEM, and parametric tests. The main contribution of this paper is the extended application of the CEAI to a transition economy and the public sector, testing its relevance in contexts for which it was not originally designed. In this way, the robustness of the established CE framework is demonstrated beyond conventional private sector and Western environments. Also, the paper strives to examine the level of development of the internal environment for entrepreneurship in the public and private sectors, i.e., public administration, institutions, and enterprises on the one hand, and private small and medium-sized enterprises (SMEs) and corporations on the other and explore the differences among them. It is expected that the insights gained from the advanced analysis and comparisons will advance the theoretical understanding of how the organizational environment shapes CE activities in different institutional contexts.
The rest of this paper is structured as follows. Following the introductory section, section 2 briefly defines CE, the key antecedents or important factors that contribute to an effective internal environment for CE, and the specificities of the public and private sector entrepreneurial environment. In addition, an approach to measuring the internal determinants of CE is discussed. This section also presents the theoretical framework on which the paper is built and the research hypotheses. The third section presents the methodology used in this paper, which relies on the survey method and SEM analysis. Sections 4 and 5 present the study’s results and discussion. We finalize the paper with the concluding remarks.
Intrapreneurship or CE, through extensive literature (Bosma et al., 2014; Carrier, 1996), is defined as a concept of formal or informal activities within the process of fostering entrepreneurship and new venture creation within established firms through product, process and business model innovation and market development aimed at increasing profitability, capital raising, organizational profitability and performance (Zahra, 1991) and competitive advantage (Antoncic and Hisrich, 2003), responding quickly to new business challenges or achieving socially or economically desirable outcomes and opportunities (Ireland et al., 2003). From the definition alone, it is clear that CE is a complex area that is studied from different angles and perspectives (Girma Aragaw et al., 2025), which is why it has been a constant subject of research in recent decades (Pirhadi and Feyzbakhsh, 2021). The process by which internal entrepreneurs emerge is already known as intrapreneurship, CE, strategic entrepreneurship, and organizational entrepreneurship.
A key aspect of CE is the creation of an environment that encourages innovation and entrepreneurial behavior (Kuratko et al., 2014; Yunis et al., 2018), which can lead to a faster and more effective response to disruptive innovation (Karimi and Walter, 2016), with research suggesting this as a viable approach to solving economic problems in emerging economies (Hassan, 2024). Similarly, according to Kreiser et al. (2021) and Shevchuk et al. (2021), CE is understood as an environment that actively encourages and cultivates the entrepreneurial mindset of individuals to drive initiatives that can lead to new products, services, and business models, strengthening and innovating organizational strategy (Rodríguez-Peña, 2025). CE is a tool which fosters creativity, innovation, and an entrepreneurial culture within an existing organization. According to Audretsch et al. (2019), such a culture can improve employee engagement, which is crucial for an organization. Furthermore, Kreiser et al. (2021) state that a good match between a company’s external environment and its CE strategy leads to better coherence and alignment of the company’s internal entrepreneurial initiatives.
The importance of CE in organizations is recognized by Ben Arfi and Hikkerova (2021), who point out that it creates opportunities for entry into new markets and exponential growth. According to Jancenelle et al. (2017), the characteristics commonly associated with CE, such as autonomy, innovativeness, and risk-taking, have been shown to have a positive impact on market performance. It is therefore extremely important to foster an appropriate CE climate in order to reap the benefits of the opportunities generated (Zahra, 2015).
Entrepreneurial thinking and action are increasingly recognized as important drivers of productivity growth (Kuratko and Audretsch, 2013), and their strategic integration into an organization improves its competitiveness in the marketplace (Baena-Luna et al., 2025). This is particularly significant, as a highly motivated and engaged workforce is a crucial asset for any organization. According to Kassa and Raju (2015), entrepreneurial thinking has the potential to address and positively influence the problem of low employee engagement. Kearney et al. (2009) emphasize that organizations of all sizes, whether operating in the public or private sector, should strive for an entrepreneurial approach.
As early as 35 years ago, CE was recognized as a mean that companies implement to improve, enhance, and promote their innovative capacity and create new entrepreneurial ventures (Kuratko et al., 1990; Zahra, 1991). Over the past four decades, CE has emerged as a tactic that enables organizations to innovate and adapt to the challenges of today’s global markets. However, organizations face many practical and theoretical challenges related to CE (Kuratko et al., 1990; Zahra, 1991). There is a need to assess the components that shape the environment in which CE thrives, examine the entrepreneurial process, and focus on the specific conditions that foster entrepreneurship (Agapie et al., 2018).
The presence of entrepreneurs or an entrepreneurial mindset in organizations is evident and persists despite numerous obstacles and challenges (Kreiser et al., 2021). When organizations pursue an entrepreneurial strategy, the entrepreneurial mindset of employees must be carefully nurtured (Kreiser et al., 2021), as the success of CE largely depends on the internal environment (Bhardwaj and Sushil, 2012).
The question, therefore, arises as to what the most important factors are that determine the quality of the internal organizational environment, i.e., what are the antecedents for fostering entrepreneurship in established organizations? Numerous researchers (Urbano et al., 2022) acknowledge the importance of internal organizational dimensions in fostering and supporting an environment for innovation and have identified elements such as strategy, autonomy, leadership, culture, risk-taking, appropriate use of rewards, management support, availability of resources, organizational structure, and work discretion as essential factors for CE. In their systematic literature review, Urbano et al. (2022) classify important antecedents into three groups of levels that influence CE: the individual, organizational and environmental levels. The organizational level is of particular interest for the study conducted in this paper, as this level directly addresses the influence of the internal organizational environment on CE capabilities. The above-mentioned authors identified four categories of organizational factors: organizational structure and characteristics, role of managers, resources and capabilities, and job-related factors.
Although there is no universally accepted approach to integrating CE into organizational culture (Kontić et al., 2017), the extent to which organizations create an environment that encourages entrepreneurial behavior determines the success of a CE strategy. Therefore, assessing the entrepreneurial environment and the organizations’ readiness for CE is crucial for implementing a successful CE strategy.
One of the tools used to assess this environment is the CEAI originally proposed by Hornsby et al. (2002), which serves as a tool to measure key internal organizational factors that influence a company’s entrepreneurial activities and outcomes, i.e., contribute to the development of an entrepreneurial culture within an organization (Kuratko et al., 2014). In their earlier work, Kuratko et al. (1990) identified three key factors: Top management support, Organizational structure, and Rewards as critical antecedents of entrepreneurial behavior. Extending this framework, Hornsby et al. (1999) introduced two additional determinants: Work discretion and Time availability, further enhancing the understanding of the factors that promote entrepreneurial behavior. Later, Hornsby et al. (2002) identified a set of five stable organizational factors to consider when promoting activities within an organization. The final version of the CEAI instrument presented in Appendix Table 10 combines five specific dimensions that are important determinants of an environment that enables entrepreneurship: Top management support, Work discretion/autonomy, Rewards/reinforcement, Time availability, and Organizational boundaries (Hornsby et al., 2002; Kuratko et al., 2014).
The first dimension, Top management support, measures the extent to which employees feel that management facilitates, supports, and encourages entrepreneurship and its spirit, including accepting innovative ideas and providing resources for their implementation. The second dimension, Work discretion/autonomy, refers to the extent to which employees believe that they have flexibility and autonomy in their workplace, that they are free to make decisions at a lower level, with tolerance for mistakes and without much supervision from their superiors. The third dimension, Rewards/reinforcement, indicates the extent to which an employee feels that the organization encourages and rewards entrepreneurial activities associated with innovation and risk-taking. Examples of these mechanisms are: financial bonuses and awards, relaxation and paid time off, or employee participation in equity. The fourth dimension, Time availability, indicates the extent to which an employee feels that they have sufficient time, within working hours, to develop innovative ideas, independently of regular business activities. The last dimension, Organizational boundaries, indicates the extent to which employees perceive the internal and external boundaries of the organization’s departments and divisions as flexible and structured, enabling and facilitating effective and efficient communication. The more fluid the boundaries are, the more opportunities employees have to exchange ideas and work together to implement them.
Each of the five dimensions of the CEAI instrument is measured by a group of statements presented in Kuratko et al. (2014). Responses to each statement are based on a five-point Likert scale (from 1—strongly disagree to 5—strongly agree). A Graphical representation of the CEAI dimensions is given in Fig. 1.
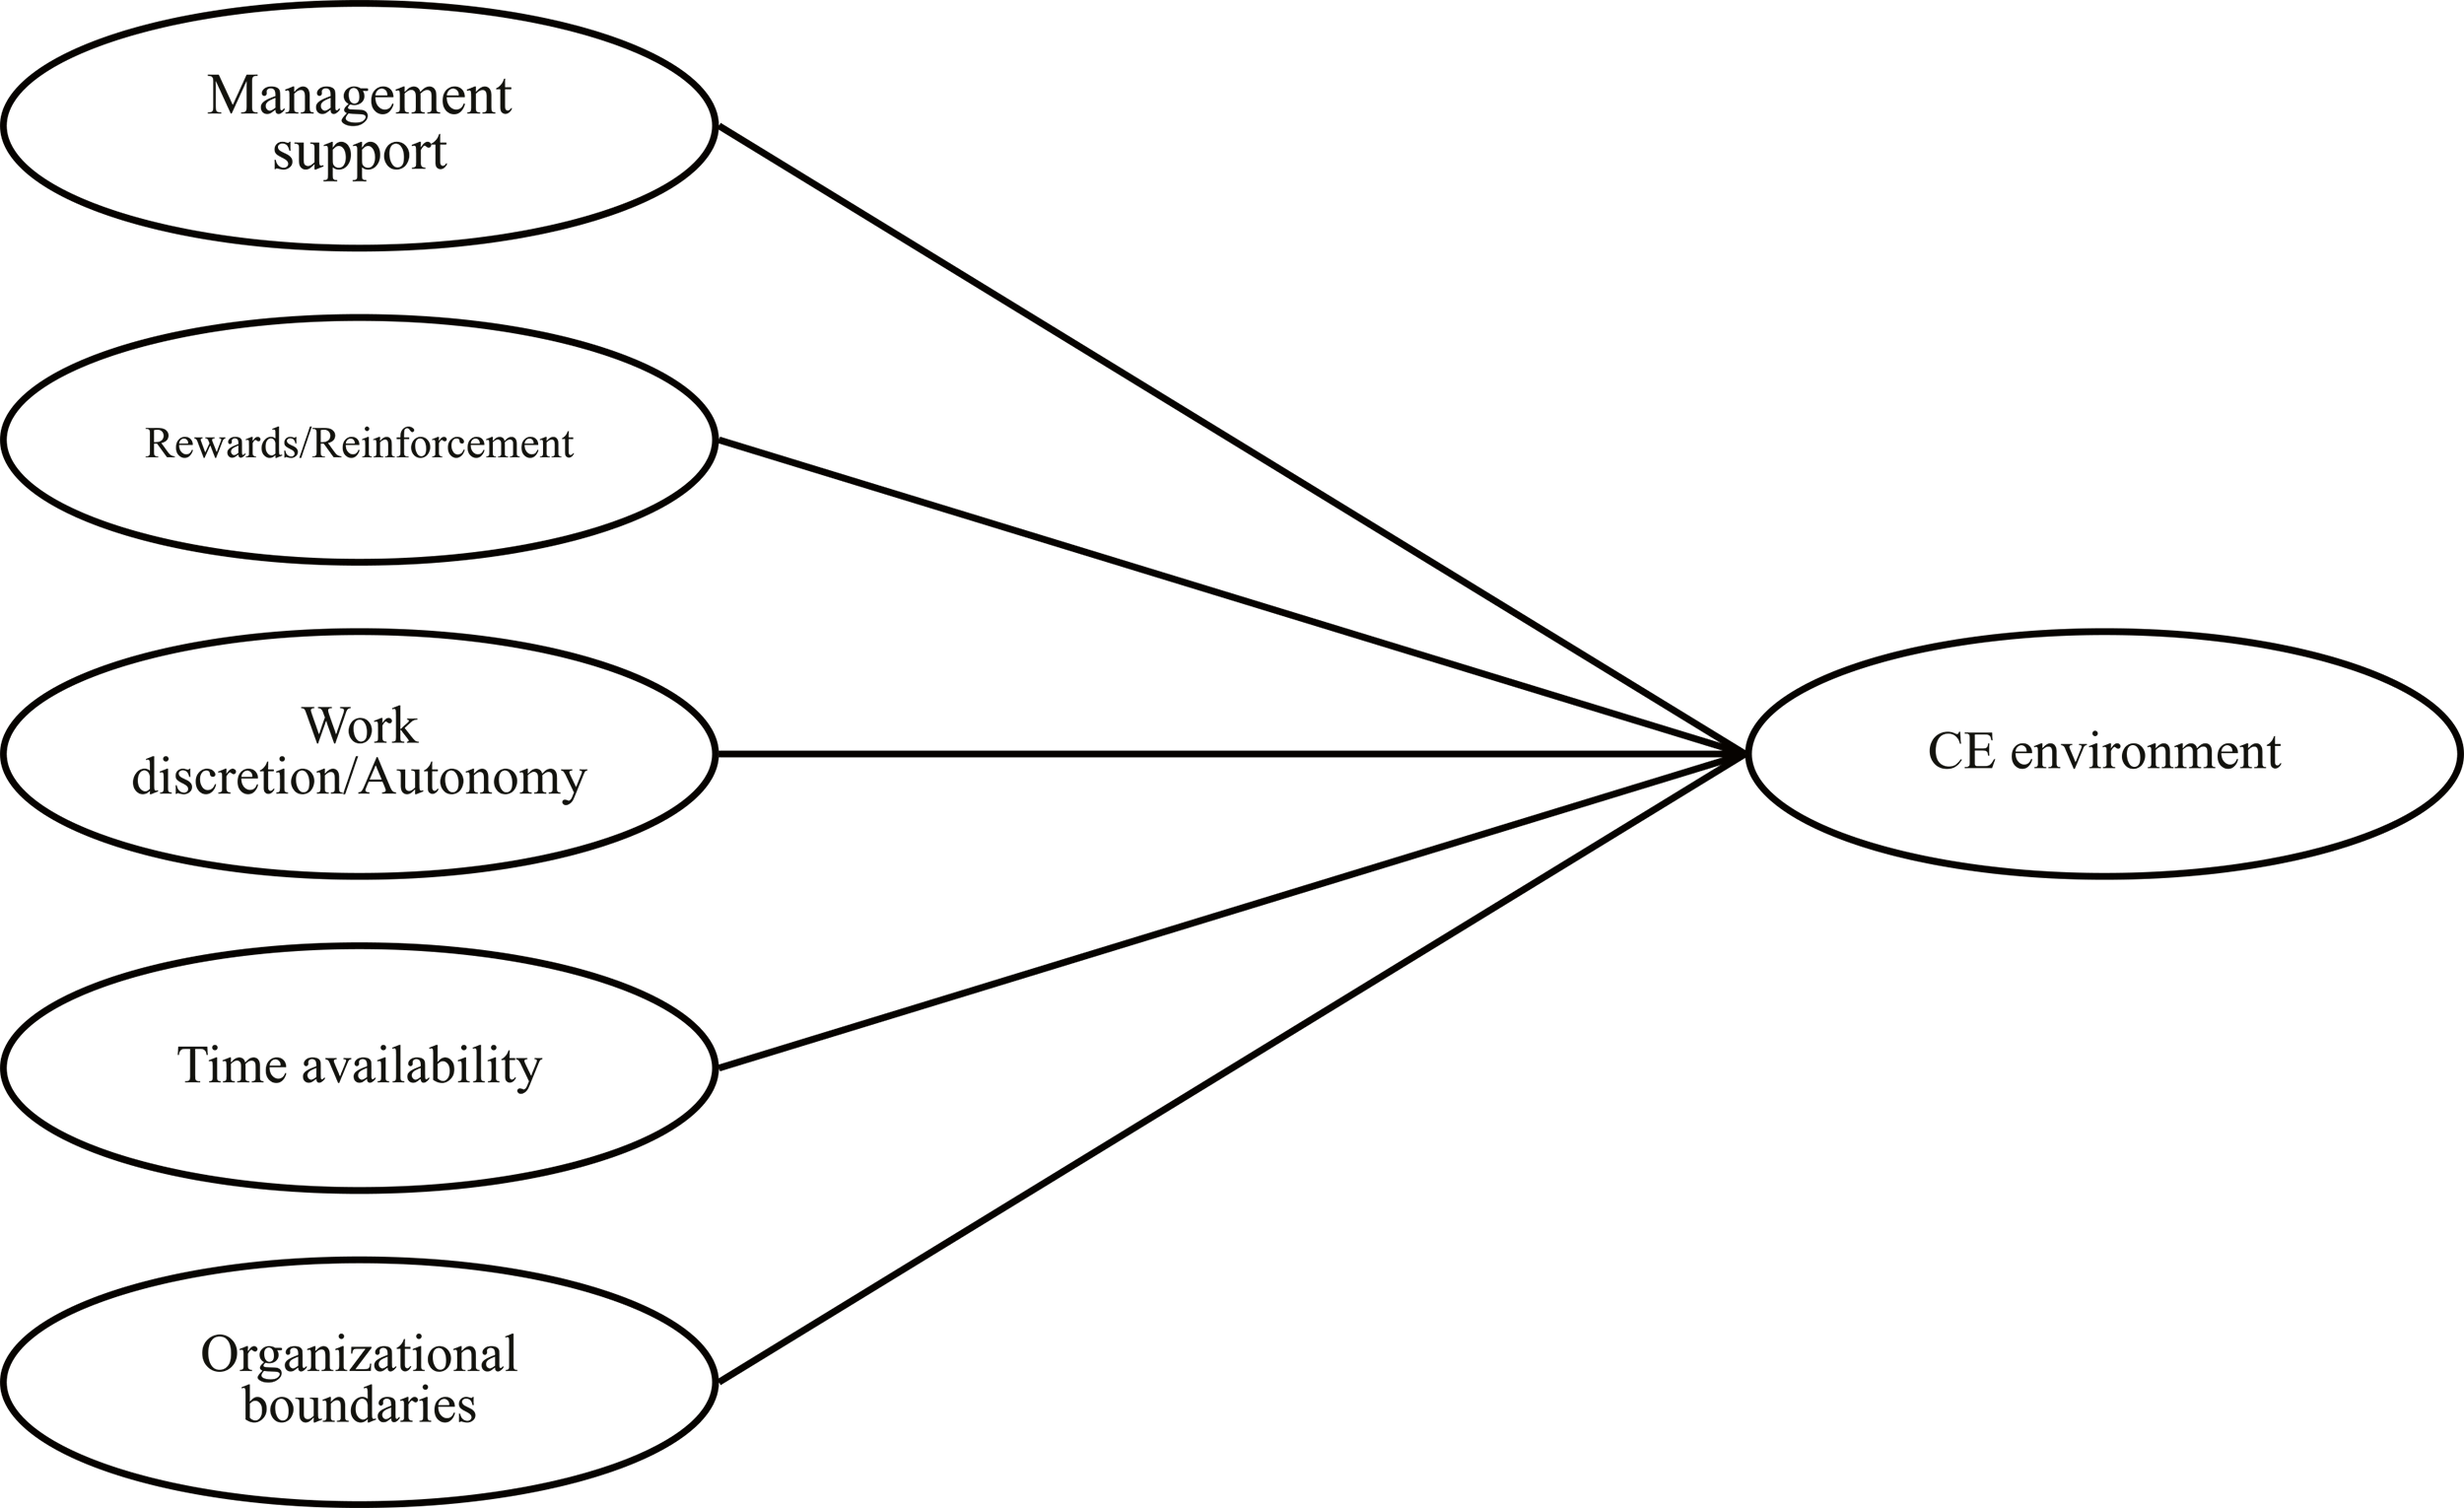 Fig. 1.
Graphical representation of the CEAI and its dimensions. CEAI, Corporate Entrepreneurship Assessment Instrument; CE, Corporate Entrepreneurship.
The authors of the CEAI (Hornsby et al., 2002; Kuratko et al., 2014) emphasize that the purpose of this instrument is to indicate how likely a company is to implement an innovative and successful CE strategy and to highlight areas in the internal work environment where ongoing development efforts should be directed. According to Kontić et al. (2017), the CEAI measures the antecedents of CE, is brief, and focuses on individual perceptions of CE, making it a promising tool for improving CE activities.
In addition to the applications already mentioned, other authors used the CEAI for various investigations. According to Bhardwaj and Sushil (2012), the CEAI can be used as an assessment tool to evaluate the training needs of companies to improve the CE climate in emerging markets. Tseng and Tseng (2019) discuss strategic approaches to increase innovation performance in companies by supporting and training employees in CE. They also emphasize the importance of innovation for sustainable business growth and highlight various techniques required for innovative businesses. Other works also underscore the importance of the top management team and its cultural intelligence in creating an environment that fosters entrepreneurship in organizations (Afshar Jahanshahi et al., 2018).
There is no one-size-fits-all approach to integrating CE into an organizational culture (Kontić et al., 2017). Different types of organizations, with varying goals and originating from regions with contrasting economic and cultural development (Orozco et al., 2024), exhibit various levels of CE. However, there is a dilemma as to whether private companies and traditional public sector organizations can have the same entrepreneurial culture (Valadares and Emmendoerfer, 2015), especially since, due to the significant differences between these sectors in terms of structure, management and organizational goals, entrepreneurship in the public sector remains somewhat nebulous (Moric Milovanovic et al., 2025).
According to Kearney et al. (2008), public sector entrepreneurship can be defined as the process by which individuals or groups within public organizations initiate, implement, and adopt changes and innovations aimed at improving the efficiency and effectiveness of public organizations. Public sector entrepreneurship is a form of CE that is characterized by its implementation in public enterprises, state and local governments and organizations of public institutions (Omerbegović-Bijelović et al., 2016). According to Dube and Danescu (2011), the public sector includes governments as well as all publicly controlled or publicly funded agencies, corporations and other organizations that provide public programs, goods, or services to the community. The concept of public sector entrepreneurship is recognized as an essential area that explores the creation of public value under challenging government conditions (Vivona et al., 2025). It emerged from the efforts of theorists attempting to identify mechanisms that foster creativity, opportunity-seeking, and innovative behavior in public enterprises and institutions, thereby adapting the principles of entrepreneurship to the public sector (Osborne and Brown, 2013). In the 2010s, it steadily gained popularity and generated considerable academic interest (Funko et al., 2023).
The rationale for examining the entrepreneurial differences between the public and private sectors arises from the structural and operational distinctions between them. For example, while managers in the private sector focus on innovation, reinforcement through rewards and motivation, managers in the public sector work within standardized rules and bureaucratic procedures, prioritizing time availability (Kontic et al., 2022). The complexity of public sector entrepreneurship arises from the inherent conflict between profit orientation and social responsibility, which is exacerbated by constraints such as limited flexibility in decision-making processes. This suggests that the specific organizational dynamics of the public sector need to be taken into account, while understanding that it is not per se less innovative than the private sector (Mazzucato, 2014). Furthermore, the financial incentives for innovation and improvement are comparatively lower in the public sector, making it even more difficult to promote entrepreneurial initiatives. This could be the reason why entrepreneurship in the public sector often occurs in response to crises, and its success depends on the quality of public sector leaders (Andrews et al., 2020). Kearney et al. (2008) have identified several key characteristics and unique aspects of CE in public sector organizations. One of these is that these organizations are often not-for-profit, but instead are dedicated to creating value for citizens by utilizing a combination of public and private resources. It is precisely for this reason that Funko et al. (2023) conduct a comprehensive literature review examining the concept of CE in the public sector. According to Rakićević et al. (2020), it is particularly demanding and challenging to promote CE in public sector organizations where, compared to the private sector, there is a greater variety of objectives to be met and a greater conflict between profit and social responsibility. In addition, the public sector has less flexibility in decision-making processes and much lower financial incentives for improvement, with Mazzucato (2014) suggesting that a clear balance between risk and reward could increase public sector revenues, embracing CE along the way. Therefore, it is of great interest to understand the prerequisites for the development of intrapreneurship and entrepreneurial models that can be implemented in public organizational systems.
Private companies are highly involved in entrepreneurial culture (Urbano et al., 2022). Although entrepreneurial culture is highly effective, the aforementioned characteristics of the public sector pose a significant challenge to convincing public and state-owned companies to adopt it. However, this does not mean that the public sector is inherently less entrepreneurial, as throughout history the state has made large capital investments in areas that were considered too risky by the private sector (Mazzucato, 2014). While the primary objective of public sector management is to improve the quality and accessibility of public services to meet the needs of citizens regardless of profitability considerations (Clarke and Clegg, 1999), the integration of entrepreneurial principles in the public sector has been shown to bring numerous benefits, including improved service quality, increased user satisfaction, improved internal processes, more effective reward systems, streamlined communication, and stronger relationships between management and employees (Kearney et al., 2008). However, public organizations use external strengths to initiate and implement internal change (Kearney et al., 2008), and to promote public innovation, public sector managers often take personal risks and capitalize on opportunities for strategic opportunism as they strive to overcome administrative obstacles and political barriers (Brown, 2010).
As a result, numerous researchers propose their model for the implementation, improvement and promotion of CE in the public sector, as the implementation of a tailor-made model offers several advantages over traditional entrepreneurship frameworks designed primarily for private sector entities (Kearney et al., 2008). Garner and Mann (2014) have proposed a model that describes four essential steps that public sector management must take to foster intrapreneurship in public sector organizations. These steps include cultivating the ability to change organizational culture, developing a comprehensive understanding of risk, collaborating with other sectors, and improving expertise in refining performance measurement practices. The authors Kearney et al. (2008) propose a conceptual model of entrepreneurship applicable to public sector organizations that combines internal dimensions—such as organizational structure, decision-making and control mechanisms, reward and motivation systems, cultural factors, risk acceptance and proactivity—with external environmental factors, including political dynamics, complexity, change and regulatory liberalness.
Even with these models, the unique characteristics and constraints of the public sector still make the implementation of CE a major challenge. The prevailing perception of the public sector is that its primary function is to facilitate private sector entrepreneurial activity and provide a safety net through market correction, rather than exerting direct influence through its own activities (Mazzucato, 2015; Mazzucato and Ryan-Collins, 2022). Bradley et al. (2021) even note that most interested parties expect the public sector to take on the role of promoting entrepreneurial activities through appropriate government policies, rather than direct engagement. In addition to the characteristics already mentioned, Borins (2006) identifies three categories of barriers that hinder the development and implementation of innovation in the public sector. The first category, stemming from bureaucratic organizations, includes skepticism, competence disputes, coordination problems, logistical challenges, resistance to new technologies, and opposition from unions and middle management. The second group of barriers, related to the political environment, includes insufficient funding, regulatory constraints and political resistance. The third group, related to the external environment, includes public skepticism, challenges in reaching the target audience, and resistance from private sector interests and companies competing on the basis of public sector innovation (Borins, 2006). While acknowledging the above obstacles, Tremml (2021) also points out that an organization’s board of supervisors can in itself be a major obstacle to entrepreneurial behavior.
The previous subsection provided an overview of CE in the public and private sectors. However, a more theoretical approach is also necessary. Therefore, in this section, we aim to formulate and connect our research questions to established theories and develop research hypotheses.
The first research question of the study is as follows:
RQ1: How do the dimensions of the internal organizational environment, as measured by the CEAI (Management support, Rewards/Reinforcement, Work discretion/Autonomy, Time availability, and Organizational boundaries), influence CE across different organizational forms in the public and private sectors?
Sections 2.2 and 2.3 presented an extensive literature review on CE measurement, antecedents of CE, and expected differences in CE between public and private organizations. Based on the work of Hornsby et al. (2002) and Kuratko et al. (2014), the following research hypotheses are derived:
H1: Management support is a statistically significant predictor of CE environment.
H2: Rewards/Reinforcement are a statistically significant predictor of CE environment.
H3: Work discretion/Autonomy is a statistically significant predictor of CE environment.
H4: Time Availability is a statistically significant predictor of CE environment.
H5: Organizational boundaries are a statistically significant predictor of CE environment.
The second research question we formulated was:
RQ2: Do these factors vary in strength and direction across organizational forms, and if so, what theoretical perspectives explain these differences?
Besides just observing how the dimensions of the internal organizational environment, measured using the CEAI, influence CE environment, we wanted to observe this relationship across different organization forms in the public and private sectors. The rationale for exploring the differences between the CE-related behaviors between public and private sector is grounded in the Institutional Theory (DiMaggio and Powell, 1983). According to this theory, public organizations face strict, mandatory legal and political requirements that limit the autonomy of individual employees, compelling them to conform to standardized procedures and policies, often leaving little room for personal discretion or innovation in decision-making. Private organizations, on the other hand, face market and performance pressures, and therefore turn to more flexible, efficiency-oriented, and innovative structures (Scott, 1995). For Management support, it is expected that in private firms, the management support reinforces entrepreneurial norms already embedded in the organizational culture, thus having a better CE environment, contrary to institutionalized (public) contexts, where hierarchical rigidity and procedures constraint innovation (Bruton et al., 2010). Public Rewards/Reinforcement systems are often standardized and rule-bound, lowering their motivational power. On the other hand, in private organizations, rewards are flexible and performance-based, reinforcing innovation, creativity and entrepreneurship ideas (Kostova and Roth, 2002). Similarly, for Work discretion/Autonomy, it is expected that public organizations operate under coercive institutional logics, representing strong hierarchical control, while that private organizations operate under market logics (Kuratko et al., 2014). Procedural rigidity present in public organizations might limit Time availability and how employees allocate time for non-core and innovative activities (Tina Dacin et al., 2002). Organizational boundaries are expected to lower the CE environment in both types of organizations, however, differences in the strength of the impact are expected (Greenwood and Hinings, 1996).
Based on this, the following research hypothesis and sub-hypotheses are derived accordingly:
H6: The impact of CE environment predictors is moderated by the organizational form.
H6.1: The impact of Management support on the CE environment is moderated by the organizational form.
H6.2: The impact of Rewards/Reinforcement on the CE environment is moderated by the organizational form.
H6.3: The impact of Work discretion/Autonomy on the CE environment is moderated by the organizational form.
H6.4: The impact of Time availability on the CE environment is moderated by the organizational form.
H6.5: The impact of Organizational boundaries on the CE environment is moderated by the organizational form.
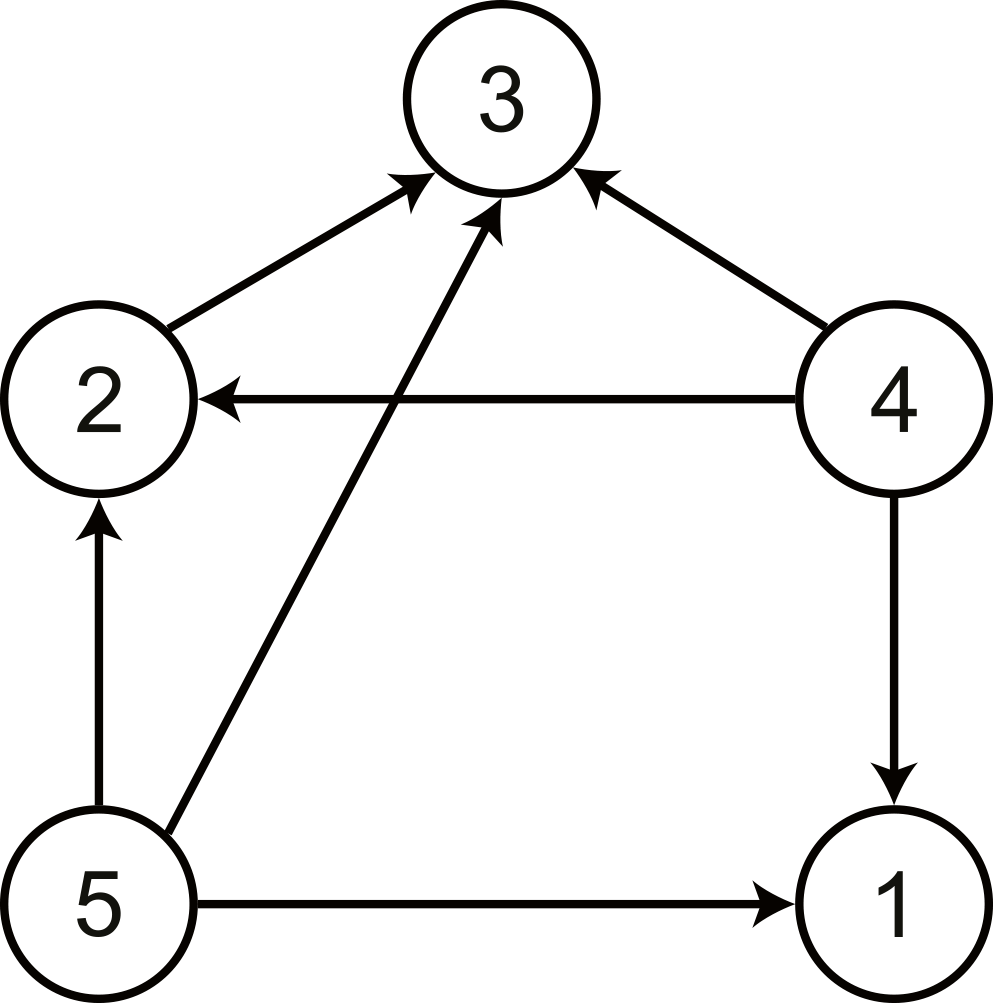
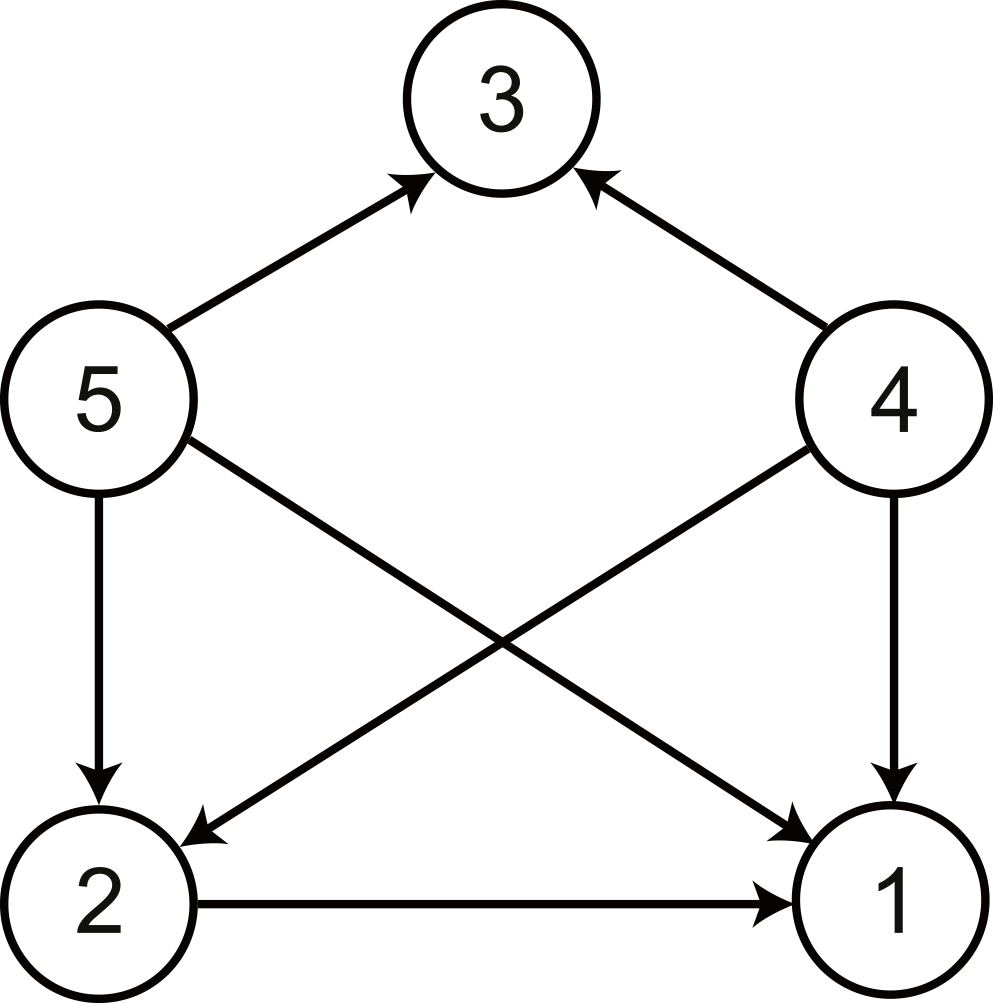
Fig. 2 gives a graphical representation of the ten proposed research hypotheses.
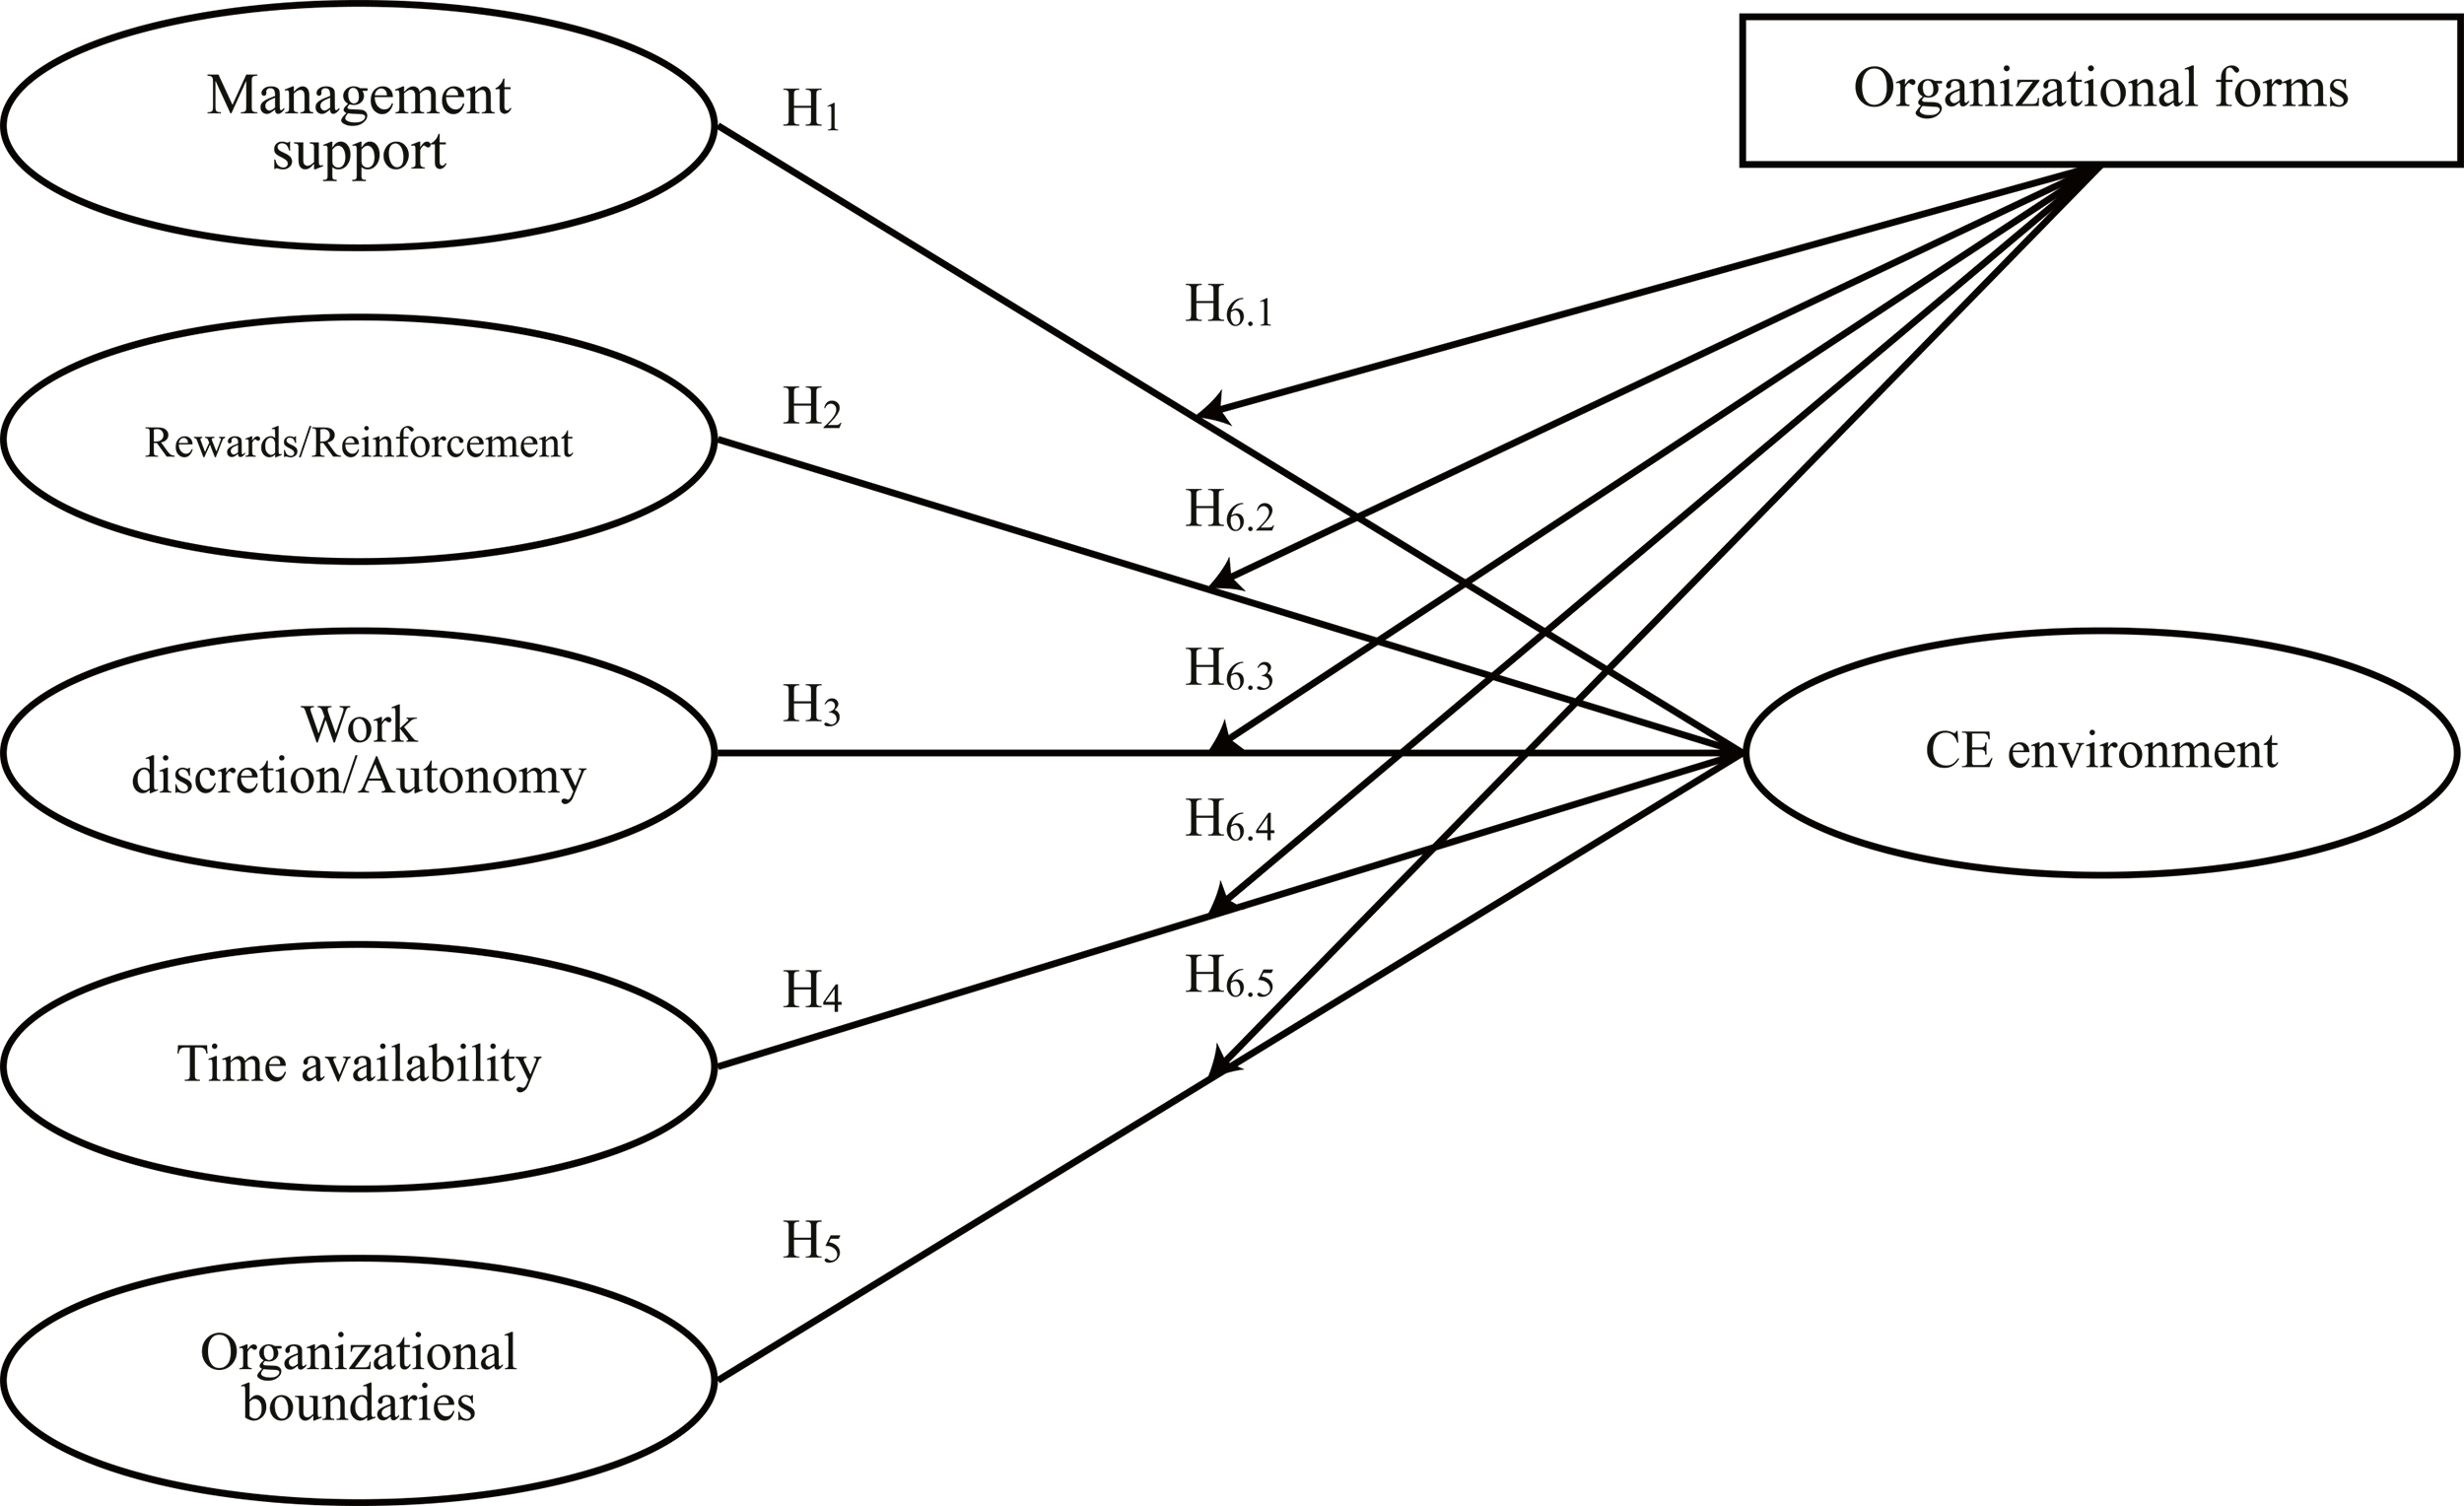 Fig. 2.
Graphical representation of the devised research hypotheses.
The purpose of this study is to examine the internal environment for corporate entrepreneurship using the CEAI, the differences in the strength of the relationship between each dimension and the overall CE environment, and the differences in dimension values between different types of organizations (public administration, public institutions, public enterprises, small and medium enterprises, and corporations) to propose strategies to improve the internal entrepreneurial environment for different types of organizations. The steps implemented to conduct this research are shown in Fig. 3.
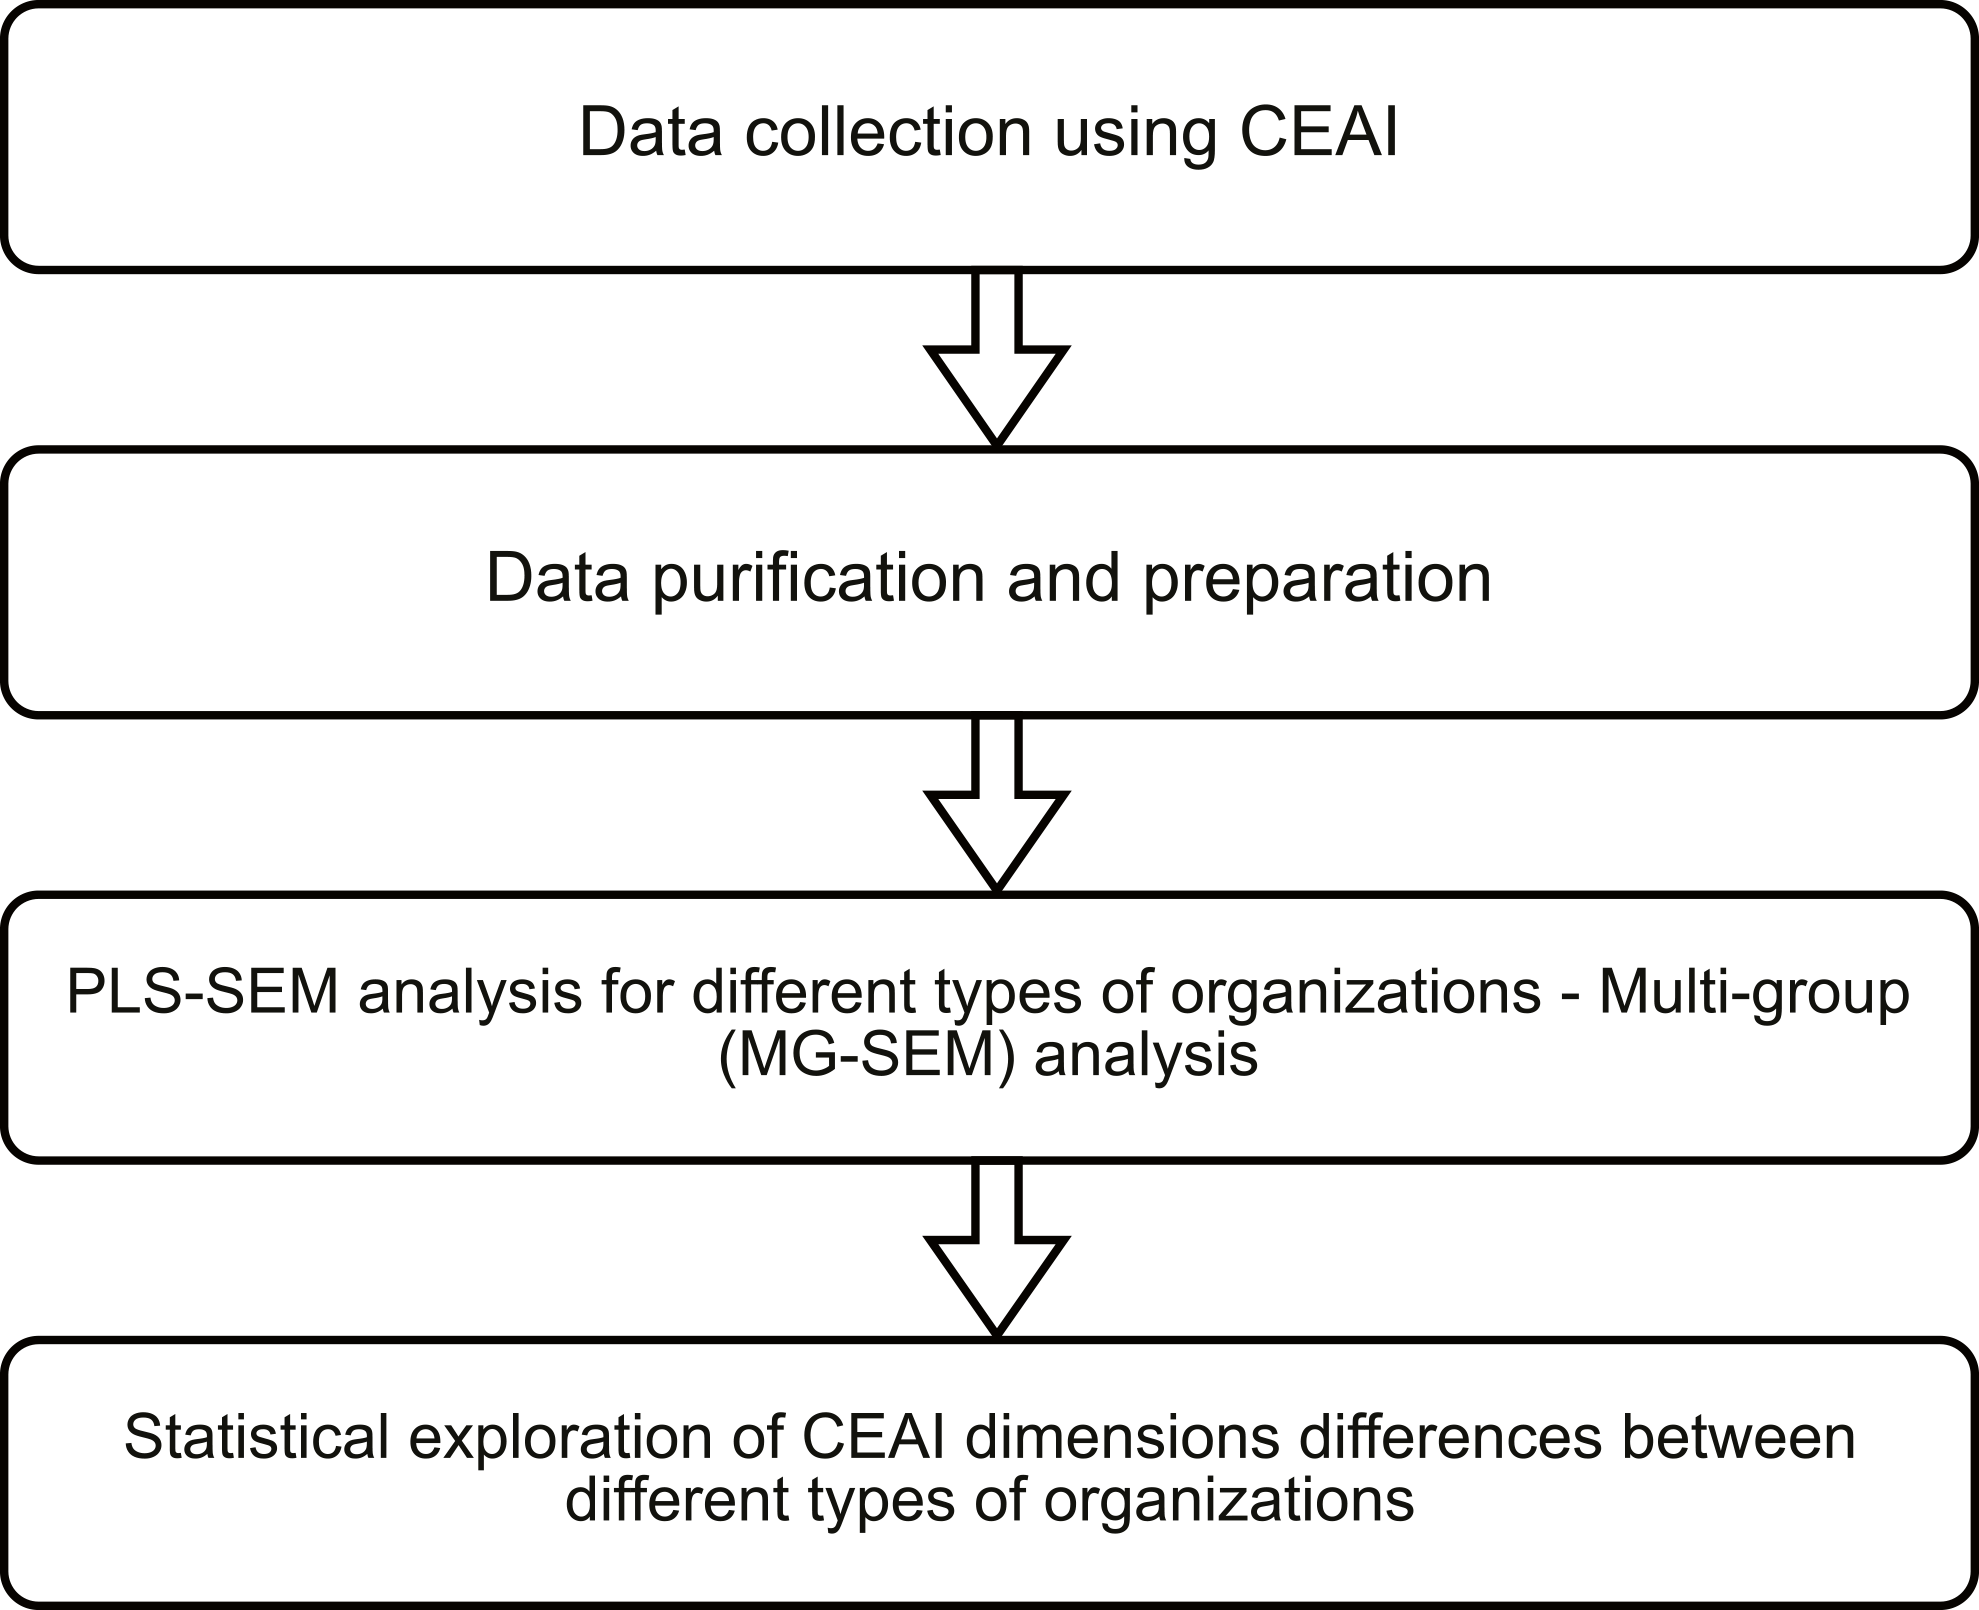 Fig. 3.
Research methodology. PLS-SEM, partial least squares structural equation modeling.
The primary research instrument used in this study is the CEAI. This questionnaire is used to collect data from employees from five different types of organizations: Public Administration, Public Institutions, Public Enterprises, Private SMEs, and Private Corporations. This division of the public sector was chosen on the basis of Kavran (2003), who states that the public sector of the Republic of Serbia includes the public administration, which is a system of state organizations and agencies that protect the public interest of citizens through the provision of services and activities of public importance; public enterprises, as state-owned companies and business entities that may operate in various sectors of strategic interest (energy, transport, telecommunications, banking, manufacturing); public institutions, as publicly supported organizations from the fields of health, education, culture, and sports. On the other hand, according to the European Commission (2016), private organizations include small and medium-sized enterprises that have fewer than 250 employees and whose annual turnover does not exceed 50 million euros or whose total assets (reported in the annual balance sheet) do not exceed 43 million euros, as well as large corporations.
During data cleansing and preparation, the first step was to address missing values by deleting incomplete entries to ensure the consistency of the dataset. In addition, the scales for relevant variables for which a lower numerical value indicates a more favorable result were handled accordingly. In the third step, the SEM and multi-group SEM analysis (MG-SEM) were performed. First, appropriate pre-tests were conducted to examine the suitability of the data for SEM analysis (Hair et al., 2014a). Then, the PLS-SEM algorithm was applied to the entire sample. We opted for PLS-SEM because it has received considerable attention in management disciplines as a state-of-the-art research technique (Ciavolino et al., 2022). Further justification for using PLS-SEM in the study is the fact that this algorithm makes no assumptions about data distribution and works robustly with small sample sizes and on formatively measured constructs (Hair et al., 2014b). The model we created and evaluated is a hierarchical SEM model. Questionnaire items are first used to create the first-order latent constructs of Management Support, Rewards/Reinforcement, Work Discretion/Autonomy, Time Availability, and Organizational Boundaries. Next, the created latent constructs are used to create the second-order latent construct CE environment.
In addition to examining the CE environment on the overall model, we aim to gain insight into the differences in the effects of the CEAI dimensions on different types of organizations. Therefore, we applied the Multi-group SEM (MG-SEM) analysis and statistically compared the SEM models between 5 groups-types of organizations (Matthews, 2017). Finally, the mean values for each of the dimensions of CEAI were calculated for each type of organization and statistical analysis of differences between the dimensions was conducted using analysis of variance (ANOVA) and Tamhane’s T2 as a post hoc test.
In this study, we conducted the CEAI survey in organizations from both the public and private sectors in Southeast Europe, specifically in the Republic of Serbia. The survey included 682 respondents from all five types of organizations using the CEAI questionnaire. Table 1 provides a comprehensive overview of the sample structure, categorizing respondents according to socio-demographic criteria: gender, age, work experience, and education level. Of all respondents, 58.8% work in the private sector, and the remaining 41.2% in the public sector. Regarding the organizational type characteristic, 10.7% of the respondents work in public administration, 17.89% in public institutions, and 12.61% in public enterprises, which means that 41.2% of the respondents work in the public sector. The remaining respondents, 58.8%, work in the private sector, specifically 28.89% in small and medium-sized enterprises and 29.91% in corporations. About half of the respondents had less than 6 years of work experience. Nearly 70% of respondents had at least a bachelor’s degree.
| Socio-demographic characteristics (N = 682) | Frequency | Percentage | |
| Gender | Male | 296 | 43.40% |
| Female | 386 | 56.60% | |
| Age | 18–30 | 354 | 51.91% |
| 31–45 | 173 | 25.37% | |
| 46–55 | 113 | 16.57% | |
| 56+ | 42 | 6.16% | |
| Organization type | Public administration | 73 | 10.70% |
| Public institution | 122 | 17.89% | |
| Public enterprise | 86 | 12.61% | |
| SMEs | 197 | 28.89% | |
| Corporation | 204 | 29.91% | |
| Work experience | 0 to 5 years | 333 | 48.83% |
| 6 to 10 years | 103 | 15.10% | |
| 11 to 20 years | 106 | 15.54% | |
| 21+ years | 140 | 20.53% | |
| Education level | Secondary | 134 | 19.64% |
| Tertiary | 77 | 11.29% | |
| Bachelor’s degree | 286 | 41.94% | |
| Master’s/PhD degree | 185 | 27.13% | |
SMEs, small and medium-sized enterprises; N, sample size.
The first step of the SEM analysis is to explore the internal consistency and discriminant validity of the proposed scales. Some commonly used indicators of internal consistency include Cronbach’s alpha, Average Variance Extracted (AVE), and rho A and rho C when PLS-SEM modeling is used (Hair et al., 2014a). All of the above metrics range from 0 to 1. The closer they are to 1, the better the internal consistency of the observed scale. On the other hand, discriminant validity measures whether a construct actually measures the phenomena of interest compared to all other constructs in the model (Hair et al., 2021).
A preliminary examination of the consistency of the scales using Cronbach’s alpha showed that all dimensions, with the exception of Organizational Boundaries (below 0.5), had an internal consistency marginally close or exceeding the required threshold of 0.7 (Nunnally, 1978).
Therefore, the Organizational boundaries dimension was further analyzed using a what-if analysis to determine whether excluding one or more items could lead to better internal scale consistency. The analysis showed that excluding the item Q46 “During the past year, my immediate supervisor discussed my work performance with me frequently” would result in the largest increase in Cronbach’s alpha, reaching a value of 0.675. Because of this, item Q46 was removed from the analysis to improve the internal reliability of the scale. This scale modification was not considered an obstacle to research, as the Organizational boundaries dimension also showed lower internal consistency in previous work (Hornsby et al., 2002; Van Wyk and Adonisi, 2011).
The results of the complete internal consistency analysis per dimension are presented in Table 2. As can be observed, all metrics either satisfy or are marginally close to the required threshold of 0.7. For rho A and rho C, all indices are above or marginally close to the threshold of 0.6 (Hair et al., 2021, p. 77). When it comes to AVE, three out of five dimensions satisfy the threshold of 0.5 (Hair et al., 2014b; Hair et al., 2021, p. 77). It can be concluded that the internal consistency of the majority of the scales is satisfactory after a slight modification of the Organizational boundaries scale.
| Dimension | No. of items | Cronbach’s alpha | Rho A | Rho C | AVE |
| Management support | 19 | 0.946 | 0.949 | 0.952 | 0.510 |
| Rewards/reinforcement | 6 | 0.831 | 0.852 | 0.879 | 0.554 |
| Work discretion/autonomy | 10 | 0.899 | 0.919 | 0.919 | 0.541 |
| Time availability | 6 | 0.632 | 0.588 | 0.660 | 0.308 |
| Organizational boundaries | 6 | 0.675 | 0.801 | 0.746 | 0.381 |
AVE, Average Variance Extracted.
Discriminant validity exploration was performed using the Fornell and Larcker (1981) criterion. The Fornell-Larcker criterion compares the square root of the AVE of a scale and the correlation coefficient between the observed scale and all other scales. If the square root of the AVE, on the main diagonal of the matrix, is greater than the correlation coefficients in the column, the discriminant validity is satisfactory (Fornell and Larcker, 1981). Based on the matrix presented in Table 3, the discriminant validity is satisfactory.
| Management support | Rewards/reinforcement | Work discretion/autonomy | Time availability | Organizational boundaries | |
| Management support | 0.714 | ||||
| Rewards/reinforcement | 0.697 | 0.744 | |||
| Work discretion/autonomy | 0.626 | 0.593 | 0.735 | ||
| Time availability | 0.439 | 0.384 | 0.307 | 0.555 | |
| Organizational boundaries | –0.445 | –0.452 | –0.399 | –0.457 | 0.617 |
Note: The bold values represent the square root of the AVE.
Since the two pre-tests showed that the data were suitable for SEM modeling, PLS-SEM was used in the next phase of the analysis to evaluate the model for the entire sample. The detailed path coefficients for the original sample and the bootstrap PLS-SEM results are presented in Table 4. All five subscales proved to be statistically significant predictors of the composite CEAI score. Out of the five scales, four subscales have a positive relationship with the composite score, while one, Organizational boundaries, has a negative relationship. This suggests that an increase in the score of the Organizational boundaries dimension results in a worse CE environment, whereas an increase in any other dimension leads to a better one. On the other hand, the remaining four dimensions are recognized as effective promoters of the CE environment, as an increase in the values of these dimensions contributes to an overall betterment of the environment. The sample mean values obtained by bootstrapping are close to the original sample values, and the measured standard deviations are low. These two measures indicate high stability of the measured paths.
| Dependent | Predictor | Original sample (O) | Sample mean (M) | Standard deviation (STDEV) | T statistics (|O/STDEV|) | p values |
| Composite | Management support | 0.986 | 0.986 | 0.005 | 193.238 | p |
| Rewards/Reinforcement | 0.902 | 0.902 | 0.013 | 67.913 | p | |
| Work discretion/Autonomy | 0.856 | 0.856 | 0.015 | 58.696 | p | |
| Time availability | 0.692 | 0.706 | 0.059 | 11.817 | p | |
| Organizational boundaries | –0.659 | –0.665 | 0.034 | 19.174 | p |
Note: Original sample, O—results based on the original data; Sample mean, M—mean value of the path coefficient after 3000 resampling iterations; STDEV—Standard deviation of the coefficient after 3000 resampling iterations.
To determine if there are differences between the same model created for the subsamples of respondents employed in different types of organizations, a multi-group SEM analysis was conducted. Table 5 shows the model evaluation for each of the five types of organizations.
| Predictor | 1 | 2 | 3 | 4 | 5 | ||||||||||
| Original | Mean | t | Original | Mean | t | Original | Mean | t | Original | Mean | t | Original | Mean | t | |
| Management support | 0.921 | 0.919 | 24.471 | 0.936 | 0.935 | 70.128 | 0.938 | 0.938 | 37.756 | 0.956 | 0.956 | 142.531 | 0.906 | 0.905 | 62.146 |
| Rewards/reinforcement | 0.695 | 0.706 | 9.001 | 0.826 | 0.828 | 26.634 | 0.835 | 0.838 | 24.801 | 0.820 | 0.823 | 30.789 | 0.714 | 0.717 | 17.567 |
| Work discretion/autonomy | 0.684 | 0.709 | 9.285 | 0.798 | 0.801 | 20.823 | 0.770 | 0.775 | 15.708 | 0.816 | 0.818 | 30.541 | 0.742 | 0.745 | 18.959 |
| Time availability | 0.556 | 0.594 | 5.358 | 0.572 | 0.596 | 8.052 | 0.487 | 0.497 | 2.512 | 0.580 | 0.593 | 10.915 | 0.496 | 0.510 | 8.296 |
| Organizational boundaries | 0.614 | 0.335 | 1.083 | –0.672 | –0.684 | 13.150 | –0.377 | –0.262 | 1.091 | –0.558 | –0.566 | 7.057 | –0.593 | –0.604 | 10.925 |
1—Public administration; 2—Public institutions; 3—Public enterprises; 4—Private SMEs; 5—Private corporations.
Note: bold values represent statistically significant values (p
Comparative analysis of the five models shows that the dimensions Work discretion/Autonomy, Rewards/Reinforcement, Management Support, and Time availability all act as statistically significant predictors of corporate entrepreneurship for every organization type. The dimension Organizational boundaries proved to be a statistically significant predictor in 3 out of 5 organization types, namely public institutions, private small enterprises (SMEs), and corporations.
In both public administration and public enterprises, all dimensions except Organizational Boundaries were statistically significant predictors of overall corporate entrepreneurship, with all of them having a positive influence on the overall CE environment. For both public administration and enterprises, the Management support dimension was the strongest predictor of corporate entrepreneurship. Rewards/Reinforcement and Work discretion/Autonomy dimensions followed, each with similar path coefficients. The dimension Time availability was the weakest predictor.
All five dimensions were found to be statistically significant predictors of CE in public institutions. Each dimension except Organizational boundaries has a positive effect on CE, and in terms of magnitude, the order is: Management support, Rewards/Reinforcement, Work discretion/Autonomy and finally Time availability. The situation is identical when it comes to private small and medium-sized enterprises.
Finally, the pattern for corporations is similar to that for public institutions and private SMEs, where all dimensions serve as statistically significant predictors of CE, with the Organizational boundaries dimension being the only one to exert a negative influence. However, the ranking of the other dimensions is slightly different. While Management support remains the strongest predictor, Work Discretion/Autonomy dimension has a higher path coefficient than the Rewards/Reinforcement dimension, while the time availability dimension still ranks last.
In addition to examining the path coefficients within each model, we also investigated whether there were statistically significant differences between the path coefficients for different organization types. Pairwise comparisons were conducted for this purpose, and the results are shown in Table 6. If the p-value is below 0.05 or above 0.95, there are statistically significant differences among path (Alzahrani et al., 2018).
| dif 1–2 | dif 1–3 | dif 1–4 | dif 1–5 | dif 2–3 | dif 2–4 | dif 2–5 | dif 3–4 | dif 3–5 | dif 4–5 | |
| Management support | –0.015 | –0.016 | –0.035 | 0.015 | –0.002 | –0.021 | 0.030 | –0.019 | 0.032 | 0.051** |
| Rewards/reinforcement | –0.130 | –0.139 | –0.125 | –0.019 | –0.009 | 0.006 | 0.111* | 0.015 | 0.120* | 0.106* |
| Work discretion/autonomy | –0.114 | –0.086 | –0.132 | –0.058 | 0.029 | –0.017 | 0.057 | –0.046 | 0.028 | 0.074 |
| Time availability | –0.017 | 0.069 | –0.024 | 0.060 | 0.086 | –0.007 | 0.076 | –0.093 | –0.009 | 0.084 |
| Organizational boundaries | 1.287** | 0.991 | 1.173* | 1.207** | –0.296 | –0.114 | –0.079 | 0.182 | 0.216 | 0.034 |
1—Public administration; 2—Public institutions; 3—Public enterprises; 4—Private SMEs; 5—Private corporations.
Note: * p
Based on the results presented, we can conclude that statistically significant differences exist in several cases. The effect of Organizational boundaries on CE in public administration, where an increase in the value of this dimension leads to a better CE environment, but the opposite is true for public institutions, SMEs, and corporations, is a source of several statistically significant differences. Secondly, statistically significant differences were found in relation to the Rewards/Reinforcement dimension between corporations on the one hand, and public institutions, public enterprises and SMEs on the other. In all cases, the impact of the Rewards/reinforcement dimension was lower in corporations. This is interesting, but actually to be expected, as corporations are the only organizational type that rates Work discretion/Autonomy higher than Rewards/reinforcement, while all other organizational types do the opposite. Finally, a marginal difference in the strength of the impact of the Management support dimension was found between SMEs and corporations, with SMEs rating this dimension higher.
To examine possible differences in CEAI dimension values across different types of organizations, dimension scores were calculated as the mean of all items within each subscale. Table 7 contains mean values and standard deviation (std.dev) for each type of organization.
| CEAI dimension | Public administration (1) | Public institution (2) | Public enterprise (3) | SME (4) | Corporation (5) |
| N | 73 | 122 | 86 | 197 | 204 |
| Management support | 2.451 |
2.826 |
2.616 |
3.369 |
3.314 |
| Rewards and reinforcement | 3.021 |
3.146 |
2.895 |
3.731 |
3.820 |
| Work discretion and autonomy | 2.953 |
3.323 |
2.724 |
3.592 |
3.630 |
| Time availability | 2.926 |
2.916 |
2.919 |
2.995 |
2.952 |
| Organizational boundaries | 2.632 |
2.541 |
2.633 |
2.606 |
2.578 |
The analysis of the results highlights clear differences between private and public sector organizations. Employees in SMEs (M = 3.369) and corporations (M = 3.314) indicate the highest level of Management support, while public administration has the lowest value (M = 2.451), indicating stronger management support in private organizations. Similarly, Work Discretion/Autonomy is rated highest in corporations (M = 3.630) and SMEs (M = 3.592), compared to public enterprises, administrations and institutions, indicating greater autonomy of employees in the private sector. The Rewards/Reinforcement dimension follows the same pattern, and is valued the highest in corporations (M = 3.820) and SMEs (M = 3.731), while it is valued the least in public enterprises (M = 2.895). In contrast, the dimensions Time Availability and Organizational boundaries show only minimal differences between the organizational types, indicating that these dimensions are relatively uniform in both sectors.
The dimension values per organization type were compared using a one-way ANOVA.
Given the sufficient sample size, a parametric test was employed. The results of
the ANOVA analysis indicate that there are statistically significant differences
in three of the five dimensions (p
| Work discretion/autonomy | Rewards/reinforcement | Management support |
 |
 |
 |
Note: 1—Public administration; 2—Public institutions; 3—Public enterprises; 4—Private SMEs; 5—Private corporations.
With regard to the Work discretion/Autonomy dimension, it is interesting to note that there are no differences within the private sector, i.e., between SMEs and Corporations. However, notable differences in values can be observed between private organizations and all public organizations, with each public organization having significantly lower mean values compared to the two private organization types. There are also differences between the various public organizations, with public institutions having a higher mean value compared to both public administration and public enterprises. A similar relationship between public and private organizations can be observed in the Rewards/reinforcement and Management support dimensions, although the dynamics vary between public organizations within these dimensions. Within the Rewards/Reinforcement dimension, public institutions exhibit a higher mean value compared to public enterprises. Similarly, regarding the Management Support dimension, public institutions demonstrate a higher mean value than public administration. Within the Rewards/Reinforcement dimension, public institutions exhibit a higher mean value compared to public enterprises. In contrast, with the Management Support dimension, public institutions demonstrate a higher mean value than the public administration.
As the conducted research and the proposed model lead to as many as ten research hypotheses, an omnibus presentation on the research results and the acceptance and rejection of the research hypotheses is given in Table 9. Each of the obtain results and conclusions is discussed below.
| Hypothesis | Sub-hypothesis | Model | Status |
| H1 | / | Overall sample | Accept |
| H2 | Accept | ||
| H3 | Accept | ||
| H4 | Accept | ||
| H5 | Accept | ||
| H6 | H6.1 | Multi-group SEM analysis | Accept |
| H6.2 | Accept | ||
| H6.3 | Reject | ||
| H6.4 | Reject | ||
| H6.5 | Accept |
The entire public sector should prioritize improving Management support for CE activities, as the results show that this dimension contributes by far the most to the overall CE environment for all types of public organizations (H1). This is in line with previous research on this topic, which states that management support plays a central role and has a significant impact on entrepreneurship (Al-Omoush, 2021). It appears that public administration may even find inspiration for its first steps within the public sector itself, as public enterprises have a statistically significantly higher mean value for this dimension. Nevertheless, the entire public sector can draw inspiration from the private sector, as the mean value for this dimension is statistically significantly higher for both private SMEs and private corporations (H6.1).
The second step of improvement actions in the public sector should focus on introducing a better reward system and job reinforcement, since the Rewards/reinforcement is the next dimension that contributes most to the CE environment (H2). This is especially true for public institutions and enterprises, which view this dimension as a clear second favorite, whereas the order of dimensions within public administration is much more balanced. The inspiration for initial action is again found in public institutions, which have the highest mean value for this dimension, statistically significantly higher than public enterprises (H6.2). Public administration follows closely in second place, and the public sector as a whole should examine the best practices of all actors in the private sector, which also have statistically significantly higher mean values for this dimension. An important point to note, however, is that the literature suggests that public sector employees often seek altruistic rewards. While financial incentives are important, an improved reward system in the public sector should not focus solely on financial rewards, but rather on a well-rounded system of both financial and non-financial incentives (Bullock et al., 2015).
H3 has been confirmed as Work discretion and autonomy are a statistically significant predictor of CE. Improving Work discretion and autonomy in the public sector, and thus conveying a developed entrepreneurial vision (Kearney and Meynhardt, 2016), is seen by all parties as the third most important dimension. Public institutions seem to be doing something right by giving their employees more autonomy, trusting them more and being more lenient in case of mistakes. Therefore, public administration and enterprises should first try to adopt the best practices from this part of the public sector. There is no statistically significant difference between public institutions and private SMEs and corporations, leading to rejection of H6.3.
As for the private sector, both SMEs and large corporations identify Management support as the dimension that contributes most to the CE environment. These two types of organizations appear to be on par, as there is no statistically significant difference in the mean values for this dimension. However, improving management support for entrepreneurial activities should be a top priority, as the results show that it has the greatest impact on the overall CE environment. This is particularly true for SMEs, which rate this dimension as statistically significantly more important than large corporations.
Private organizations differ in the second most important dimension. While SMEs see Rewards/reinforcement as the second most important dimension and Work discretion and autonomy as the third most important dimension, the order is reversed for large corporations. While both dimensions should be addressed and paid attention to, SMEs should focus more on improving and using rewards appropriately, especially financial ones (Bullock et al., 2015), while large corporations should look for ways to empower their employees and give them more authority and autonomy in their work, which provides a sense of control that is usually reserved for and given at the discretion of management. It is noteworthy that both public institutions and SMEs perceive the Rewards/reinforcement dimension as statistically significantly more important than private corporations, suggesting that corporate employees value their autonomy more than other types of rewards.
Time availability is considered the statistically least important dimension across all organizational types (H4). Interestingly, this contradicts previous findings (Janićijević and Kontić, 2025), which suggest that Time availability is not a valid CE determinant in the private banking sector in Serbia. However, Kontic et al. (2022) have shown in their previous work that Time availability is more important in state-owned enterprises, which also did not prove to be true in this case, as the results in Table 6 show no statistically significant difference in the perception of this dimension between organizational types, leading to the rejection of H6.4. The mean value appears to be even, with no statistically significant differences in the mean values. This suggests that it is still essential to allocate time for employees to consider improving their organization. The recommendation for all organizational types is to provide more time for entrepreneurial activities.
Organizational boundaries proved to be a statistically significant predictor at the overall sample (H5), but only for public institutions and private SMEs and corporations (H6.5). It has already been mentioned in the manuscript that this dimension is the most controversial/contested in other publications as well, as it has even been removed in later assessments, so the question remains whether it should be the focus at all. It is also unclear how to proceed, as this dimension has been shown to have a negative impact on the CE environment. We suspect that this is the case because organizational boundaries that are too strict can have a negative impact on the CE environment, but that this is also the case when these boundaries are too loose. We suggest finding a balance that allows employees enough freedom to express their entrepreneurial behavior while providing them with enough structure to do so productively.
Based on the presented results, the hypothesis H6 is partially accepted. Statistically significant differences in the impacts of CEAI dimensions on CE environment between different organization types have been found for Management support, Rewards/Reinforcement, and Organizational boundaries.
The findings of this study underscore the importance of observing and analyzing CE through the lens of Institutional Theory. The observed differences across organizational forms are not merely managerial but stem from the institutional logics that shape how organizations interpret and enable entrepreneurial behavior (DiMaggio and Powell, 1983). The presented results suggest that CE-support strategies should be institutionally contingent, as practices effective in market-driven private firms should not be directly translated to bureaucratically governed public entities.
This paper analyzes the internal CE environment in both the public and private sectors, highlighting the importance and the development of entrepreneurial determinants. The aim is to identify differences between the different types of organizations and suggest targeted areas for CE development based on these distinctions.
By applying the CEAI questionnaire and the MG-SEM analysis to five different types of organizations, the results presented demonstrate that the organizations differ statistically significantly in both the perceived importance and the level of development of certain dimensions examined.
In particular, the results indicate that the internal environment for fostering entrepreneurship is less developed in public sector organizations than in private SMEs and corporations. Private organizations show higher values in three out of five CE dimensions (Management support, Work discretion/autonomy and Rewards/reinforcement) and comparable values in the remaining two. Among public organizations, institutions show the highest propensity for internal entrepreneurship, slightly above the theoretical average, followed by public administration, while public enterprises show the lowest levels of entrepreneurial support.
These findings point to improvements that could be a good first step in promoting CE. The public sector as a whole could greatly benefit from developing strategies to systematically support and empower employees and their entrepreneurial activities, as entrepreneurship in the public sector has been shown to enhance the ability to achieve organizational goals (Vivona, 2024). This includes visible support and encouragement from top management, as well as the establishment of mechanisms to fund, implement and incorporate innovative ideas into daily work. Such a mechanism could signal to employees that entrepreneurial activities are valued and not ignored or discouraged. Although all public sector actors could benefit from these strategies, the results indicate that public administration should prioritize this effort to achieve the same level of success as other public organizations.
To fully reap the benefits of CE, the public sector should introduce more autonomy and flexibility into the decision-making process at lower levels. This could be achieved by delegating authority to employees or teams for specific projects, reducing bureaucratic procedures, and allowing experimentation without fear of consequences for mistakes. Top management still needs to be involved, but should focus on providing guidance and resources rather than overseeing delegated activities in detail. Such autonomy, combined with greater risk tolerance, can lead to enhanced problem-solving abilities and increased job satisfaction, ultimately fostering a more entrepreneurial culture in the public sector. This is of particular interest to public enterprises, as the findings suggest that they lag behind public institutions and administration.
The public sector could significantly improve entrepreneurial behavior by developing structured reward systems that recognize and incentivize innovation. Beyond promotions, recognition can take various forms, including bonuses, awards, career development opportunities, and even symbolic recognition, such as certificates or public commendations. Involving employees in the decision-making process at all levels or giving them co-responsibility for successful projects can also serve as strong motivators. The reward system, however it is implemented, should not only focus on successful outcomes, but also recognize effort, learning, and experimentation, so that employees feel confident to engage in entrepreneurial activities without fear of failure. Public enterprises should also pay special attention to this area in order to first achieve the level of other public organizations and then continue to improve together to reach the development of private organizations. By creating a structured, transparent, and fair recognition system, the public sector can promote a sustained commitment to entrepreneurial initiatives and institutionalize a culture of continuous improvement and innovation.
The results obtained contribute to the development of the CE environment through the implementation of actions and strategies tailored to the needs of specific types of organizations, rather than relying on broad catch-all policies developed mostly on the basis of private sector research (Urbano et al., 2022) and Western-influenced assumptions (Mustafa, 2024). More generally, this research can contribute to the establishment and improvement of principles for the development of internal entrepreneurship in both public and private sector organizations, which could lead to improved performance, higher market and employee satisfaction, and better overall economic activity (Audretsch et al., 2019; Kuratko and Audretsch, 2013; Zahra, 1991). However, certain limitations, such as the sample being exclusively from the Republic of Serbia, unequal subsample sizes for the different types of organizations, and the fact that only the dimensions present in the CEAI were examined, indicate the need for further research. Future studies could expand the geographic scope of the study to include cross-country analysis, or identify previously unrecognized CE dimensions unique to this emerging economy (Agapie et al., 2018), to further refine CE development strategies and promote innovation, entrepreneurial mindset, and behavior.
All data reported in this paper will be shared by the correspondence author upon reasonable request.
OA and ZR designed the research study, performed the research and participated in the writing of the manuscript. MM analyzed the data and participated in the writing of the manuscript. All authors read and approved the final manuscript. All authors have participated sufficiently in the work and agreed to be accountable for all aspects of the work.
The research protocol was approved by the Ethics Committee of the Faculty of Organizational Sciences, University of Belgrade. All retrieved data was anonymous, and all participants were informed that the collected data will solely be used for research purposes.
The authors gratefully acknowledge and thank prof. Donald F. Kuratko for permission to use CEAI in the research.
This research received no external funding.
The authors declare no conflict of interest.
During the preparation of this work the authors used InstaText in order to check spelling, grammar and improve the readability of the manuscript. After using this tool, the authors reviewed and edited the content as needed and take full responsibility for the content of the publication.
The CEAI instrument consists of 48 statements measuring 5 dimensions of CE environment (Kuratko et al., 2014). Each of these statements is evaluated on a 1–5 scale (1—strongly disagree, 5—strongly agree). See Table 10.
| Dimension | Num. | Statement | Higher is better |
| Management support | 1 | My organization is quick to use improved work methods. | Yes |
| 2 | My organization is quick to use improved work methods that are developed by workers. | Yes | |
| 3 | In my organization, developing one’s own ideas is encouraged for the improvement of the corporation. | Yes | |
| 4 | Upper management is aware and very receptive to my ideas and suggestions. | Yes | |
| 5 | A promotion usually follows from the development of new and innovative ideas. | Yes | |
| 6 | Those employees who come up with innovative ideas on their own often receive management encouragement for their activities. | Yes | |
| 7 | The “doers on projects” are allowed to make decisions without going through elaborate justification and approval procedures. | Yes | |
| 8 | Senior managers encourage innovators to bend rules and rigid procedures in order to keep promising ideas on track. | Yes | |
| 9 | Many top managers have been known for their experience with the innovation process. | Yes | |
| 10 | Money is often available to get new project ideas off the ground. | Yes | |
| 11 | Individuals with successful innovative projects receive additional rewards and compensation beyond the standard reward system for their ideas and efforts. | Yes | |
| 12 | There are several options within the organization for individuals to get financial support for their innovative projects and ideas. | Yes | |
| 13 | People are often encouraged to take calculated risks with ideas around here. | Yes | |
| 14 | Individual risk takers are often recognized for their willingness to champion new projects, whether eventually successful or not. | Yes | |
| 15 | The term “risk taker” is considered a positive attribute for people in my work area. | Yes | |
| 16 | This organization supports many small and experimental projects, realizing that some will undoubtedly fail. | Yes | |
| 17 | An employee with a good idea is often given free time to develop that idea. | Yes | |
| 18 | There is considerable desire among people in the organization for generating new ideas without regard for crossing departmental or functional boundaries. | Yes | |
| 19 | People are encouraged to talk to employees in other departments of this organization about ideas for new projects. | Yes | |
| Work discretion and autonomy | 20 | I feel that I am my own boss and do not have to double check all of my decisions with someone else. | Yes |
| 21 | Harsh criticism and punishment result from mistakes made on the job. | No | |
| 22 | This organization provides the chance to be creative and try my own methods of doing the job. | Yes | |
| 23 | This organization provides the freedom to use my own judgment. | Yes | |
| 24 | This organization provides the chance to do something that makes use of my abilities. | Yes | |
| 25 | I have the freedom to decide what I do on my job. | Yes | |
| 26 | It is basically my own responsibility to decide how my job gets done. | Yes | |
| 27 | I almost always get to decide what I do on my job. | Yes | |
| 28 | I have much autonomy on my job and am left on my own to do my own work. | Yes | |
| 29 | I seldom have to follow the same work methods or steps for doing my major tasks from day to day. | Yes | |
| Rewards/reinforcement | 30 | My manager helps me get my work done by removing obstacles and roadblocks. | Yes |
| 31 | The rewards I receive are dependent upon my innovation on the job. | Yes | |
| 32 | My supervisor will increase my job responsibilities if I am performing well in my job. | Yes | |
| 33 | My supervisor will give me special recognition if my work performance is especially good. | Yes | |
| 34 | My manager would tell his/her boss if my work was outstanding. | Yes | |
| 35 | There is a lot of challenge in my job. | Yes | |
| Time availability | 36 | During the past three months, my workload kept me from spending time on developing new ideas. | No |
| 37 | I always seem to have plenty of time to get everything done. | Yes | |
| 38 | I have just the right amount of time and workload to do everything well. | Yes | |
| 39 | My job is structured so that I have very little time to think about wider organizational problems. | No | |
| 40 | I feel that I am always working with time constraints on my job. | No | |
| 41 | My co-workers and I always find time for long-term problem solving. | Yes | |
| Organizational boundaries | 42 | In the past three months, I have always followed standard operating procedures or practices to do my major tasks. | No |
| 43 | There are many written rules and procedures that exist for doing my major tasks. | No | |
| 44 | On my job I have no doubt of what is expected of me. | No | |
| 45 | There is little uncertainty in my job. | No | |
| 46 | During the past year, my immediate supervisor discussed my work performance with me frequently. | Yes | |
| 47 | My job description clearly specifies the standards of performance on which my job is evaluated. | No | |
| 48 | I clearly know what level of work performance is expected from me in terms of amount, quality, and timelines of output. | No |
References
Publisher’s Note: IMR Press stays neutral with regard to jurisdictional claims in published maps and institutional affiliations.