

 , Fei Zhai 3,*
1 School of Economics and Management, Fuyang Institute of Technology, 236031 Fuyang, Anhui, China
2 School of Business, Pusan National University, 46241 Busan, Republic of Korea
3 School of Economics and Management, Shanghai Zhongqiao Voctaional and Technical University, 201514 Shanghai, China
Abstract
This study examines how financial constraints affect the sticky behavior of Research and Development (R&D) expenditures, with particular emphasis on the moderating role of green innovation. While maintaining R&D investment during sales declines is critical for sustainable innovation, the convex nature of R&D investment and its dependence on internal funding often cause constrained firms to exhibit reduced stickiness, or anti-stickiness. Using large-sample empirical evidence, we confirm a significant negative relationship between financial constraints and R&D cost stickiness. Crucially, we demonstrate that green innovation strategies mitigate this effect by alleviating financing frictions through enhanced investor confidence, which incentivizes managers to retain idle R&D resources. Robustness tests that extending to Selling, General and Administrative Expenses (SG&A) validate this dual mechanism. These findings highlight green innovation’s strategic value as a resilience lever, advancing environmental goals while strengthening firms’ financial flexibility in the face of resource constraints.
Keywords
- R&D cost stickiness
- financing constraints
- green innovation strategy
- cost behavior
Traditional cost models often underestimate managerial discretion in shaping cost structures by instead assuming that overhead costs vary proportionally with physical production or activity volume. Cooper and Kaplan (1992) were among the first to highlight the distinction between the resources supplied and consumed to an activity and those actually consumed, suggesting that managers can adjust resource allocations and retain unused capacity. Building on this insight, Anderson et al. (2003) initiated a formal study of cost stickiness, proposing that managers may retain underutilized resources due to adjustment costs. This work has sparked a growing body of literature exploring cost stickiness as a complex managerial phenomenon shaped by various constraints, incentives, and behavioral biases (Banker et al., 2018).
Recent studies identify access to capital as a key determinant of asymmetric cost behavior. Cost stickiness tends to diminish during economic downturns (Banker et al., 2020; Yang and Chen, 2023; Bubeck and Silva, 2025), in regions with underdeveloped financial systems (Cheng et al., 2018), and under high rollover risks (Li and Zheng, 2020). However, previous research has often underestimated how changes in sales affect resource allocation in firms with limited access to external capital. While cost stickiness reflects the asymmetric response of costs to changes in sales (Anderson et al., 2003), whether managerial investment behavior is particularly sensitive to temporary demand shocks, especially in firms experiencing financial friction, remains an open question. We argue that investment behavior in financially constrained firms is excessively sensitive to sales declines, resulting in anti-stickiness; that is, costs decrease more when sales fall than when sales rise by an equivalent amount (Weiss, 2010). Specifically, we examine the effect of financial friction on the asymmetric behavior of Research and Development (R&D) costs. Prior studies (e.g., Banker et al., 2014) show that R&D expenditures, like other cost categories, exhibit sticky behavior. As an intangible investment, R&D contributes positively to firm performance and market valuation (Griliches, 1985; Mairesse and Sassenou, 1991; Chan et al., 1990; Doukas and Switzer, 1992).
R&D investment constitutes the central driver of corporate innovation output, directly enhancing productivity and market valuation and promoting societal progress through technological spillovers. As a key indicator of sustainable development, green innovation intensifies the need for R&D stickiness due to its dual characteristics. On the one hand, green innovation shares the fundamental attributes of conventional innovation, such as the long-term accumulation of knowledge capital, path dependence, and the inherent risk of knowledge spillovers (Aghion et al., 2016). These characteristics require firms to maintain steady R&D investment even during economic downturns, resisting short-term pressures that may undermine long-term innovation continuity. On the other hand, the regulatory rigidity and technological irreversibility associated with green innovation substantially elevate the costs of interrupting R&D activities (Aghion et al., 2016; Kawai et al., 2018; Cao and Chen, 2019). These factors compel firms to demonstrate a greater degree of R&D stickiness than is typically required in conventional innovation. In the presence of financial constraints, adopting a green innovation strategy may enhance managerial commitment to retaining R&D resources, thereby offsetting tendencies toward R&D reduction or termination. Managers can actively reallocate limited financial resources by trimming budgets allocated to non-green operations and channeling them into green R&D initiatives (Teece, 2018). Furthermore, drawing on stakeholder theory, green innovation serves as a strategic signal that reduces information asymmetry with sustainability-oriented investors, attracting long-term capital inflows and alleviating financing constraints (Flammer, 2021). Collectively, these mechanisms help mitigate the risk of R&D disruption arising from financial limitations.
We begin by hypothesizing that financial constraints directly influence cost elasticity and, specifically, that financing constraints are negatively associated with cost stickiness. We then explore the positive relationship between green innovation strategies and R&D cost stickiness. Finally, we assess whether financially constrained firms exhibit different R&D cost behaviors when implementing green innovation strategies; that is, whether such strategies can mitigate financing constraints and thereby promote asymmetric cost behavior. Using data from China Stock Market & Accounting Research Database (CSMAR), a financial data provider in China, we examine the differences in asymmetric cost behavior across firms of different ages (sizes), observing that young (small) firms are more likely to exhibit anti-stickiness or decrease their degree of stickiness. We then use various methods based on the literature to measure the level of financing constraints. We follow Kama and Weiss (2013) and extend Anderson et al.’s (2003) stickiness model to estimate the impact of financing constraints. We confirm that the level of constraints is negatively associated with R&D cost stickiness, indicating that the sensitivity of costs to volume changes increases with the wedge between internal and external capital.
Subsequently, we examine whether green innovation strategies influence firms’ decisions to retain R&D resources during periods of declining sales. We further investigated the moderating role of green innovation in the relationship between financial constraints and cost stickiness. Specifically, we assess whether R&D cost behavior in financially constrained firms differs depending on the adoption of green innovation strategies. Consistent with our expectations, we find that constrained firms implementing green innovation are more likely to maintain R&D investment and display asymmetric cost behavior, owing to reduced financing frictions. Finally, our supplementary analyses show that institutional investors and large individual shareholders can strengthen the easing effect of green innovation strategies on financial constraints.
This study makes three key contributions. First, we uncover a nonlinear threshold effect of financial constraints on R&D cost stickiness (Hansen, 1999). Firms are more likely to exhibit sticky R&D cost behavior only when they have sufficient financial resources. In contrast, under severe financing constraints, firms tend to accelerate R&D cuts during revenue declines, exhibiting anti-sticky behavior. This challenges the prevailing assumption that cost stickiness is a default managerial behavior and emphasizes the necessity of financial slack for sustaining innovation. Second, we introduce green innovation strategy as a novel determinant of cost behavior. We find that green innovation, as a policy-sensitive strategic commitment, helps firms maintain R&D cost stickiness even during downturns. This highlights how environmental goals, shaped by external and internal forces, can alter the direction of managerial cost adjustment and reinforce firms’ long-term innovation orientation. Third, we identify the dual role of green innovation as both a moderator and a strategic absorber. It not only weakens the negative association between financial constraints and R&D stickiness, but also enables resource-constrained firms to maintain stable R&D investments. This sheds light on why firms committed to green innovation tend to experience less fluctuation in R&D spending under financial stress.
The rest of this paper is organized as follows. In Section 2, we discuss related theories and develop hypotheses. Section 3 describes the measurement of the variables and the empirical model. In Section 4, we discuss the main results and present additional tests. In Section 5, we provide our conclusions and limitations.
The traditional view of costs in accounting divides them into fixed and variable costs, with fixed costs remaining constant and variable costs changing in proportion to production volume. However, empirical studies have shown that overhead cost accumulation is often driven more by transactions than by physical production volumes (Foster and Gupta, 1990; Banker et al., 1995). From this perspective, activity volume is the primary determinant of variable costs. Most notably, Cooper and Kaplan (1992) argue that costs are incurred based on resource consumption linked to an activity system rather than merely volume-based drivers. They emphasize that managers often resist short-term cost variability and prefer to make long-term resource commitments (Cooper and Kaplan, 1988). For instance, a decline in activity levels does not automatically eliminate related resource costs.
Anderson et al. (2003) propose an alternative model in which costs decrease less when sales fall than when they increase by an equivalent amount; that is, costs are sticky. This raises important questions about the relationship between business activities and committed resources, particularly the factors that influence managerial decisions to adjust discretionary spending. Banker et al. (2018) synthesize prior findings and conclude that cost stickiness is influenced by various factors, including managerial constraints, incentives, and behavioral biases.
We argue that the existing research underestimates the impact of internal finance on cost decisions. That is, costs arise from resources that are dependent on internal funding according to the pecking order theory. On the one hand, not all firms can afford to maintain smooth investment in resources, such as R&D, which is a luxury pursuit for small or young firms (Acs and Audretsch, 1987; Hall, 2002). By contrast, retaining slack resources decreases current profitability and affects earnings properties. A growing body of literature links sticky costs to greater earnings volatility (Weiss, 2010; Shahzad et al., 2024), lower firm value (Costa and Habib, 2023), reduced dividend payouts (He et al., 2020), and diminished institutional ownership (Chung et al., 2019). Notably, firms facing sales declines or with strong incentive structures may even exhibit anti-sticky behavior by aggressively cutting costs (Kama and Weiss, 2013; Banker et al., 2014). As Hadlock and Pierce (2010) point out, when a firm’s age and size exceed certain thresholds—typically measured using the Size-Age (SA) index percentile—the firm tends to rapidly scale back its investment strategy, accelerating the reduction of strategic resource reserves.
Therefore, it may be particularly difficult for financially constrained firms to make asymmetric cost decisions. Although some studies have explored the availability of capital as a driver of cost management, very little attention has been paid to the following issues. First, the existing literature mainly focuses on the impact of external financing, such as economic slowdowns (Banker et al., 2020), rollover risk (Li and Zheng, 2020), financial development (Cheng et al., 2018), and corporate financialization (Zhu et al., 2021; Zhou, 2024; Karatzimas et al., 2024) as determinants of cost stickiness and does not consider the link between committed resources and financing constraints. Secondly, existing literature has paid limited attention to how demand shocks affect resource allocation differently under varying levels of financial constraints. Current studies on cost stickiness primarily focus on persistent demand shocks and their impact on managerial behavior, such as consecutive sales declines (Kama and Weiss, 2013; Banker et al., 2014) or large current sales decreases (Ciftci and Zoubi, 2019), which tend to amplify managerial pessimism and lead to anti-sticky cost adjustments. However, we argue that financially constrained firms may respond more sensitively and swiftly to transitory demand shocks. A robust stream of empirical research has shown that firms’ investment decisions are highly sensitive to fluctuations in internal financial resources, particularly under conditions of volatile cash flow, where firms tend to reduce discretionary expenditures (Fazzari et al., 1987; Almeida et al., 2004). Specifically, R&D investments are widely recognized as heavily reliant on internally generated funds, such as sales revenue (Hall et al., 1998), cash flow (Himmelberg and Petersen, 1994; Hall, 2005), and cash holdings (Hadlock and Pierce, 2010). Although these proxies differ conceptually, they all stem from firms’ sales-generating processes. As Dechow et al. (1998) note, sales contracts determine the timing and magnitude of both cash inflows and outflows. Therefore, when confronted with short-term demand shocks, financially constrained firms are more likely to accelerate resource reallocation in response to income uncertainty, leading to faster cost adjustments and a potential abandonment of cost stickiness behavior typically observed in unconstrained settings (Ciftci and Zoubi, 2019; Askarany et al., 2024; Berg et al., 2024; Hui et al., 2024).
Finally, if the retention of slack resources (i.e., cost stickiness) is considered an investment decision, then financing constraints should be directly linked to cost behavior. R&D investments, in particular, tend to be more irreversible and involve higher sunk costs than SG&A expenditures. R&D personnel expenses (Clinch, 1991) and training activities (Kim and Lee, 2022a) are closely tied to a firm’s innovation intensity. Moreover, the departure of R&D employees can lead to a loss of accumulated organizational knowledge (Jaumotte and Pain, 2005). However, considering the sticky behavior of SG&A expenses can be controversial because, while some studies have argued that Selling, General and Administrative (SG&A) cost stickiness is positively related to intangible assets (Venieris et al., 2015), a broader body of literature suggests that managers choose to increase the degree of SG&A cost asymmetry in response to a higher level of stakeholder activism (e.g., Chen et al., 2012; Costa and Habib, 2023; Rounaghi et al., 2021; Kim et al., 2022b; Li et al., 2025). Therefore, we first discuss R&D resources.
We consider a priori that it is difficult for firms with substantial financial frictions to retain their R&D resources in the face of declining market demand. Bond and Meghir (1994) argue that the response of investment expenditures subject to convex adjustment costs to demand shocks is largely determined by the availability of internal funds. This is also a common characteristic of R&D investment, which is financed by current profits and accumulated funds (Himmelberg and Petersen, 1994). Moreover, Baber et al. (1991) provide evidence that managers tend to significantly lower R&D expenses because these expenses cannot be amortized over accounting periods, jeopardizing current income. Consequently, firms facing potential constraints will save cash and abandon positive but costly net present value (NPV) projects, such as R&D investments (Almeida et al., 2004). Gorodnichenko and Schnitzer (2013) note that liquidity frictions restrain a firm’s ability to generate knowledge inputs and accelerate technical change. This is mainly manifested in the fact that small, young firms are at a disadvantage in terms of access to capital and more readily experience funding gaps in innovation (Hall, 2005). In other words, the likelihood of innovation activities increases if entrepreneurs have sufficient financial resources, even if they are unable to borrow large amounts of capital. Accordingly, we posit that financially constrained firms are more likely to reduce R&D spending, an expense drawn from retained earnings, in response to transitory demand shocks. In doing so, they abandon the sticky behavior typically associated with R&D costs.
Thus, we propose the following hypotheses:
H1: Firms with greater financing constraints have a lower degree of R&D cost stickiness.
The core driver of corporate innovation output lies in R&D investment, the scale and quality of which significantly influence innovation performance. However, it is the efficiency with which innovation inputs are transformed into outputs—referred to as innovation efficiency—that serves as a more fundamental indicator of a firm’s innovative capability (Berndt and Griliches, 1993; Wang and Wu, 2019). As a key output indicator in the contemporary context, green patents not only reflect the conversion efficiency of R&D investment but also capture the firm’s commitment to social responsibility (Cao and Chen, 2019; Zhang and Jin, 2021; Zhang and Leng, 2025). Accordingly, firms that pursue green innovation performance are likely to dynamically reshape their resource allocation strategies.
Green innovation strategy refers to the integration of green development principles into the technological innovation process, with the dual objective of reducing environmental pollution and improving resource efficiency (Kawai et al., 2018; Widyantoro et al., 2025; Anqi et al., 2025). First, unlike traditional market-driven innovation, green innovation is largely shaped by environmental obligations and policy pressure, and is thus classified as policy-induced innovation (Porter and Van Der Linde, 1995; Porter and Van Der Linde, 2000; Liu et al., 2025a). Firms adopt green innovation strategies not only to meet internal technological development needs but also in response to external environmental responsibilities and regulatory pressures (Kawai et al., 2018; Yuan and Cao, 2022; Le, 2022). Government commitments—such as R&D subsidies and tax incentives—can reduce firms’ adjustment costs and strengthen their motivation to innovate, encouraging managers to view R&D as a long-term strategic investment (Bai et al., 2019).
Second, green innovation is typically measured by the number of green patents or trademarks. However, it often involves high risks and long investment horizons, requiring firms to maintain organizational slack to ensure continuity and flexibility in innovation efforts. Liu et al. (2025b) provide empirical evidence that firms implementing green innovation strategies exhibit significantly lower volatility in R&D expenditures compared to industry averages, suggesting a greater commitment to stable and sustained R&D investment.
Despite this, most studies of green innovation have focused on the scale of R&D investment, overlooking its flexibility, that is, the degree to which firms maintain consistent R&D spending in response to changing demand conditions. From the perspective of cost stickiness theory, the retention of R&D spending represents an investment in future competitiveness (Banker et al., 2020; Lee et al., 2020). Meanwhile, the resource-based view (RBV) posits that the rigidity of R&D investment facilitates knowledge accumulation and the development of inimitable technologies (Bourgeois, 1981; Barney, 1991). Furthermore, the strategic management literature suggests that exploratory and differentiation strategies are more likely to be associated with cost stickiness, whereas defensive strategies tend to lead to resource retrenchment. Prospector-oriented firms and those pursuing differentiation strategies tend to exhibit higher cost stickiness, because managers regard sticky costs as investments in strategic resources (Ballas et al., 2022; Banker et al., 2025; Lefebvre, 2025). By contrast, defender-oriented firms or those following a cost leadership strategy typically exhibit lower cost stickiness, or even anti-stickiness, as managers are more inclined to cut resources to achieve short-term gains.
In this context, we argue that managers do not always maintain high R&D investment levels when executing green strategies. Instead, they dynamically adjust their discretionary costs in response to changing business conditions, thereby smoothing R&D expenditures. Such adjustments should not be interpreted as a withdrawal from green innovation but rather as a resilient approach to sustaining technological advancement over time. Based on the above discussion, we propose the following hypotheses:
H2: Firms following a green innovation strategy exhibit a higher degree of R&D cost stickiness.
Based on stakeholder theory, green innovation strategies serve as effective mechanisms for alleviating firms’ financing constraints, thereby enhancing sustainable profitability. Empirical evidence supports a positive association between green innovation and firm performance, primarily via three stakeholder-oriented pathways: First, enhanced market legitimacy. Green innovation improves consumers’ perceptions of a firm’s brand image (Olsen et al., 2014) and signals a strong commitment to corporate social responsibility (Yuan and Cao, 2022; Le, 2022; Lei and Peng, 2025), thereby increasing customer loyalty and enabling product premium pricing.
Second, increased investor confidence. Environmental disclosure reduces information asymmetry (Casciello et al., 2024; Wang et al., 2025), while superior ESG (Environmental, Social, and Governance) performance attracts institutional investors with a sustainability orientation (Tan and Zhu, 2022; Flammer, 2021). Third, mitigated regulatory risks. Environmental policies incentivize shareholders to support green innovation initiatives (Kawai et al., 2018). In parallel, regulatory tools such as environmental subsidies and tax incentives facilitate the adoption and development of green technologies (Cai et al., 2025).
Notably, these positive effects are more pronounced for financially constrained firms. For example, small and medium-sized enterprises (SMEs) may gain access to specialized sustainability-linked funding sources (including green bonds) through green innovation efforts (Yin et al., 2022). This observation challenges the conventional view that financial constraints inherently hinder green R&D investment. Furthermore, corporate strategy plays a critical role in shaping managerial decisions regarding resource allocation. By leveraging dynamic capability–based resource reallocation (as described by Teece, 2018), managers can shift capital from non-green domains (such as fossil-fuel-based assets) toward green innovation, thereby creating a self-reinforcing cycle that supports long-term innovation sustainability. Prior research also demonstrates that firms adopting exploratory or differentiation-oriented strategies are more likely to preserve strategic resources even during economic downturns (Cheng et al., 2018; Ballas et al., 2022; Banker et al., 2025), underscoring the persistence (or “stickiness”) of green innovation efforts under adverse conditions. Therefore, we propose the following hypothesis shown in Fig. 1.
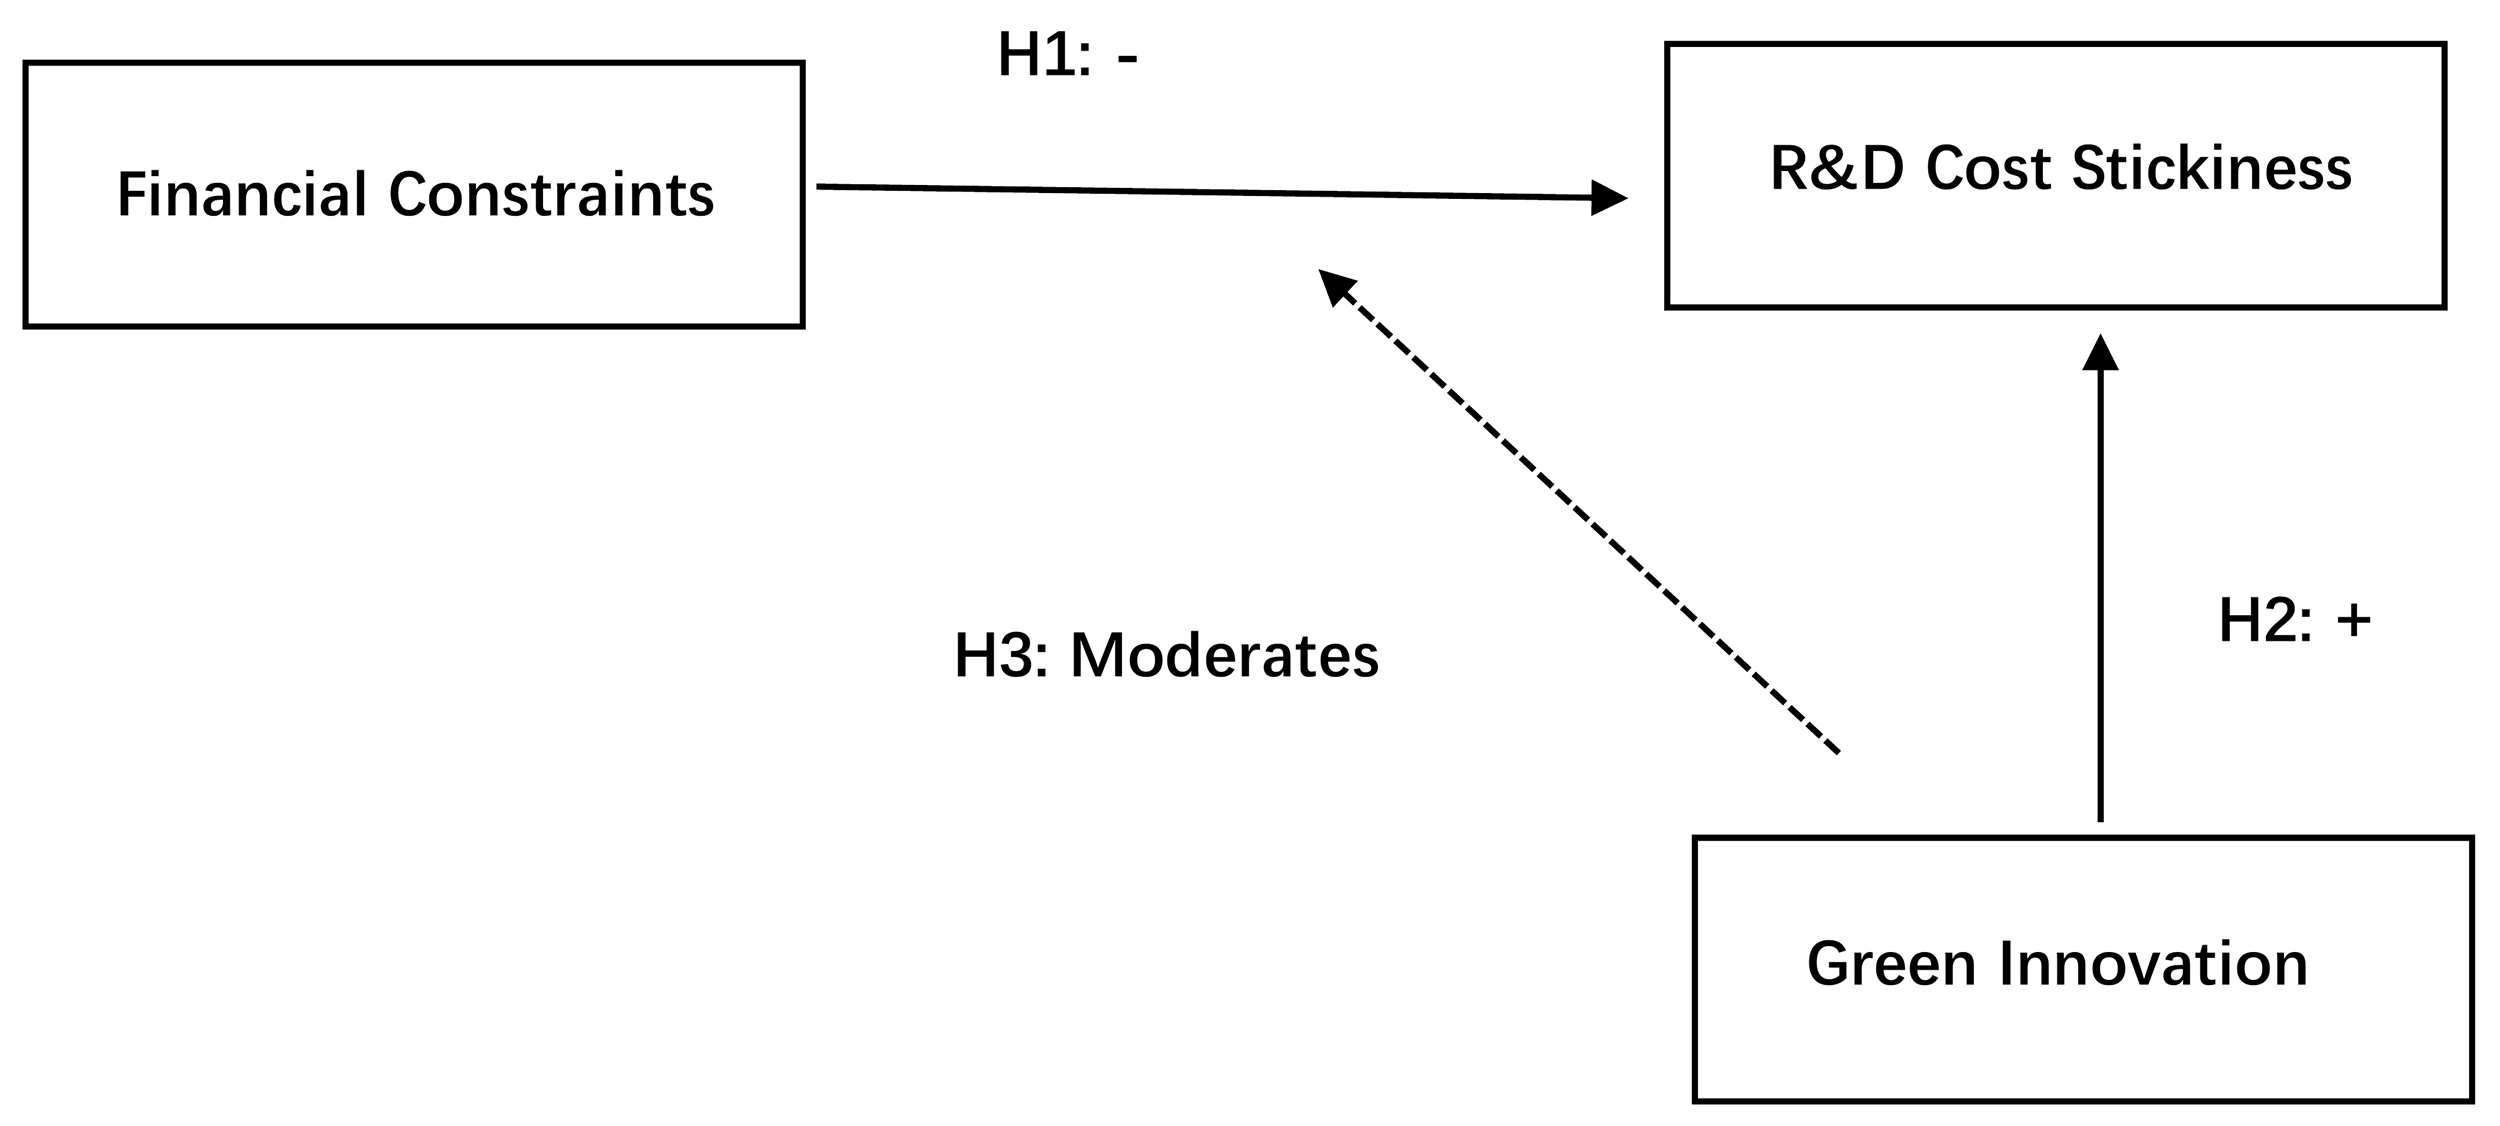 Fig. 1.
The theoretical framework of the study. R&D, research and development. “+” indicates a positive relationship, and “−” indicates a negative relationship.
H3: The implementation of a green innovation strategy mitigates the negative impact of financial constraints on R&D cost stickiness.
We model R&D cost stickiness using the canonical framework of Anderson, Banker, and Janakiraman (2003, hereafter ABJ). Cost stickiness occurs when costs decrease less during sales declines than they increase during sales expansions. We interpret R&D cost stickiness as the situation where a 1% decline in sales leads to a smaller reduction in R&D costs than the increase caused by a 1% rise in sales.
We estimate the following model:
where,
To analyze how financial frictions shape R&D cost behavior, we adopt firm age and size as financing constraint proxies, consistent with the lifecycle-scale paradigm (Hall, 2005; Hadlock and Pierce, 2010; Gorodnichenko and Schnitzer, 2013). This approach leverages two established mechanisms: First, young/small firms face higher borrowing costs and collateral constraints, amplifying cash flow sensitivity. Second, large/mature firms benefit from R&D scale economies, enabling stable innovation investment.
We stratify the sample into terciles by age and size separately, avoiding
conflation across dimensions. To mitigate potential confounding effects, we
include employee intensity, asset intensity, and leverage as control variables.
Using OLS with firm-level clustered standard errors and industry/year fixed
effects, we expect
Model A:
Although the baseline model captures the average stickiness pattern, it does not
account for firm heterogeneity. Hypotheses 1 and 2 posit that financial
constraints and green innovation strategies systematically alter firms’ R&D cost
decisions. We follow Kama and Weiss (2013) and Chang et al. (2022) and
parameterize
Substituting into Eqn. 1, we estimate:
Model B:
The interaction term FC*Dec*
KZ = –1.002CF + 0.283Q + 3.139Lev + 39.367Div – 1.315Cashholdings
where the CF is the ratio of cash flow to total assets, Q is Tobin’s Q, and cashholdings are cash holdings divided by total assets.
Second, we follow Zhang and Wang (2013), who developed a financial constraint index tailored to Chinese firms by adapting the Hadlock and Pierce (2010) approach. The index is derived from a logistic regression model using:
Pr (FC = 1/0 Zit) = 1/1 + e-Zit, where Zit =
where Lev is the leverage ratio, MB is the market-to-book ratio, Div is dividends divided by total assets, NWC is net working capital divided by total assets, and EBIT is earnings before interest and taxes divided by total assets.
Similarly, we incorporate green innovation into the model. The interaction term
GI*Dec*
We specify Model C:
We expect
Finally, we examine whether green innovation moderates the adverse effect of
financial constraints on R&D cost stickiness. We interact GI and FC variables in
the following model: In Model D, we expect
Model D:
Variable Definitions:
Deci,t = a dummy variable that equals to 1 when sales revenue decreases from year t-1 to t, and 0 otherwise;
EIi,t = the number of employees*100,000/sales revenue;
AIi,t = logarithm of the ratio of total assets to sales revenue;
Sdeci,t = a dummy variable that equals to 1 when sales have decreased in two consecutive years and zero otherwise;
Levi,t = the ratio of total debts to total assets;
GIi,t = logarithm of (green patent applications + 1);
FCi,t = financial constraint index measured by the KZ and Zhan-Wang indices;
Agei,t = the number of years since establishment;
Sizei,t = logarithm of total assets.
The sample comprises data on all listed firms covered by the CSMAR database from 2012 to 2022. We used annual data for the estimation and excluded statements from financial institutions. We remove observations with less than two years of financial data or main variables with missing data. To avoid potential bias from sample selection, we follow Banker et al. (2014) and do not remove observations where costs (e.g., SG&A costs) exceed sales revenue or do not move in a consistent direction. To limit the effects of extreme observations, we exclude all variables in the regression that fall within the top or bottom 0.5 percent of the distribution. The full sample contains 24,570 firm-year observations.
Panel A of Table 1 shows that R&D costs, on average, increased by approximately 16.6% and sales revenue increased by approximately 11.1%. In our sample, 28% of the annual observations show a decline in sales revenue relative to the previous period, a frequency similar to that in Anderson et al.’s (2003) sample (28% vs. 27.01% in ABJ). The mean value of two consecutive years of sales declines is 12%.
| Panel A | ||||||
| Variable | N | Mean | SD | Min | Max | p50 |
| 24,239 | 0.166 | 0.530 | –7.845 | 8.685 | 0.129 | |
| 24,239 | 0.111 | 0.314 | –3.832 | 5.530 | 0.100 | |
| Dec | 24,239 | 0.280 | 0.449 | 0.000 | 1.000 | 0.000 |
| Sdec | 24,239 | 0.120 | 0.325 | 0.000 | 1.000 | 0.000 |
| AI | 24,239 | 0.661 | 0.595 | –2.435 | 5.018 | 0.633 |
| EI | 24,239 | 0.013 | 0.009 | 0.001 | 0.064 | 0.011 |
| Lev | 24,239 | 0.411 | 0.195 | 0.055 | 0.946 | 0.402 |
| Panel B | ||||||
| Variable | N | Mean | SD | Min | Max | p50 |
| Age (years) | 24,239 | 10.010 | 7.394 | 1.000 | 28.000 | 8.000 |
| Size | 24,239 | 22.280 | 1.271 | 18.980 | 26.210 | 22.080 |
| FC | 24,239 | 0.503 | 0.284 | 0.004 | 0.948 | 0.538 |
| KZ | 24,239 | 0.754 | 2.396 | –11.470 | 11.390 | 1.030 |
| GI | 24,228 | 0.657 | 1.020 | 0.000 | 6.805 | 0.000 |
| IO | 24,209 | 41.750 | 25.060 | 0.297 | 91.930 | 42.970 |
| Top 10 | 24,239 | 57.78 | 14.90 | 22.94 | 93.34 | 58.26 |
Note: R&D, Research and Development.
Panel B presents the two indicators used to measure firms’ financial constraints (FC and KZ). In terms of firm age, younger firms have an average age of 4 years, while mature firms have an average age of 28 years. The average shareholding of the top ten largest shareholders (Top 10) is 57.78%, indicating a relatively high level of ownership concentration. In addition, institutional investors (IO) hold an average of 41.75% of total shares, suggesting that they play a significant role in corporate governance.
We tested the first hypothesis in Model A and report the results in Table 2 for the subsample of observations. We predict that financially constrained firms (small firms and young firms) are more sensitive to changes in sales and therefore may exhibit lower levels of stickiness or even anti-stickiness.
| Panel A: Firm Age | |||
| Young | Medium | Mature | |
| Variables | (1) | (2) | (3) |
| 0.563*** | 0.575*** | 0.663*** | |
| (16.868) | (12.094) | (11.688) | |
| Dec* |
0.044 | –0.380*** | –0.503*** |
| (0.262) | (–3.313) | (–2.834) | |
| Controls | Yes | Yes | Yes |
| N | 9302 | 7520 | 7748 |
| Adjusted R2 | 0.182 | 0.127 | 0.099 |
| Year and Industry fixed effects | Yes | Yes | Yes |
| Panel B: Firm Size | |||
| Small | Medium | Large | |
| Variables | (1) | (2) | (3) |
| 0.525*** | 0.599*** | 0.632*** | |
| (14.577) | (13.016) | (14.450) | |
| Dec* |
–0.166 | –0.295** | –0.531*** |
| (–1.214) | (–2.031) | (–2.617) | |
| Controls | Yes | Yes | Yes |
| N | 8190 | 8190 | 8190 |
| Adjusted R2 | 0.152 | 0.141 | 0.110 |
| Year and Industry fixed effects | Yes | Yes | Yes |
Notes: t-statistics are reported in parentheses. Standard errors are clustered at the firm level.
** p
This table reports the results of examining the differences in cost stickiness between financially constrained and unconstrained firms. Firm age and size serve as preliminary criteria for classifying financially constrained firms. Firm age is measured as the number of years since establishment, and firm size is defined as the natural logarithm of total assets. The estimations use Model A, controlling for year and industry fixed effects. Model A is specified as follows:
Control variables include asset intensity (AI), employee intensity (EI), consecutive sales declines (Sdec), and leverage ratio (Lev), with definitions provided in previous sections.
In panel A,
Similarly, panel B shows that the estimate of
We first use the ABJ model as a benchmark to observe whether cost stickiness
exists, and the first column of Table 3 shows that the
| Variables | (1) | (2) | (3) | |
| Pred. | KZ index | Zhang & Wang index | ||
| + | 0.612*** | 0.514*** | 0.700*** | |
| (23.948) | (8.108) | (7.326) | ||
| Dec* |
- | –0.210*** | –0.188 | –0.540*** |
| (–4.339) | (–1.527) | (–2.972) | ||
| –0.012* | –0.216*** | |||
| (–1.844) | (–2.889) | |||
| Dec* |
+ | 0.052** | 0.356** | |
| (2.112) | (2.295) | |||
| Dec* |
–0.004 | 0.010 | ||
| (–0.074) | (0.133) | |||
| Dec* |
–10.431*** | –11.651** | ||
| (–2.790) | (–2.284) | |||
| Dec* |
0.180*** | 0.110 | ||
| (3.014) | (1.452) | |||
| Dec* |
–0.169 | 0.468* | ||
| (–0.665) | (1.956) | |||
| 0.012 | 0.010 | |||
| (0.342) | (0.230) | |||
| 3.768 | 5.145* | |||
| (1.630) | (1.667) | |||
| 0.131 | –0.123 | |||
| (1.149) | (–0.900) | |||
| Intercept | 0.090** | 0.089** | 0.117*** | |
| (2.523) | (2.450) | (2.876) | ||
| N | 24,239 | 24,239 | 24,239 | |
| Adjusted R2 | 0.116 | 0.118 | 0.118 | |
| Industry | Yes | Yes | Yes | |
| Year | Yes | Yes | Yes |
Notes: t-statistics are reported in parentheses. Standard
errors are clustered at the firm level.
*p
This table reports the results of financial constraints (FC) and cost stickiness. FC are alternatively measured using the KZ index and the Zhang & Wang index. The estimations use Model B, controlling for year and industry fixed effects. Model B is specified as follows:
Control variables include asset intensity (AI), employee intensity (EI), consecutive sales declines (Sdec), and leverage ratio (Lev), with definitions provided in previous sections.
Specifically, we examine the relationship between financing constraints and R&D
cost stickiness using two measures: the KZ index (Kaplan and Zingales, 1995)
and the indicator proposed by Zhang and Wang (2013). A higher value of either
index indicates a greater degree of financial constraint. As shown in the second
column of Table 3, a higher KZ index indicates that a firm faces greater
financial constraints. The coefficient
To test the second hypothesis—that green innovation is positively associated
with R&D cost stickiness, implying that the implementation of green innovation
strategies requires slack R&D resources—we estimate Model C and examine the
coefficient on the triple interaction term
| Pred. | GI | |
| + | 0.569*** | |
| (9.995) | ||
| Dec* |
- | –0.256** |
| (–2.284) | ||
| 0.069*** | ||
| (3.933) | ||
| Dec* |
- | –0.158*** |
| (–5.383) | ||
| Intercept | 0.117*** | |
| (2.876) | ||
| Controls and their interactions | Included | |
| N | 24,239 | |
| Adjusted R2 | 0.118 | |
| Industry | Yes | |
| Year | Yes |
Notes: t-statistics are reported in parentheses. Standard errors are clustered at the firm level. “+” and “−” indicate the expected signs of the regression coefficients.
** p
This table reports the results of green innovation (GI) and cost stickiness. GI is measured as the natural logarithm of (green patent applications + 1). The estimations use Model C, controlling for year and industry fixed effects. Model C is specified as follows:
Control variables include asset intensity (AI), employee intensity (EI), consecutive sales declines (Sdec), and leverage ratio (Lev), with definitions provided in previous sections.
Using Model D, we estimate the moderating effect of green innovation on the relationship between financial constraints and R&D cost stickiness. We employ two measures of financial constraints—the KZ index and the Zhang and Wang (2013) indicator—with results presented in Table 5.
| (1) | (2) | |
| KZ index | Zhang & Wang index | |
| 0.511*** | 0.728*** | |
| (7.991) | (8.502) | |
| Dec* |
–0.177 | –0.528*** |
| (–1.445) | (–3.163) | |
| –0.016* | –0.228*** | |
| (–1.936) | (–3.032) | |
| Dec* |
0.060** | 0.382** |
| (2.381) | (2.428) | |
| 0.006 | 0.070** | |
| (1.076) | (2.095) | |
| Dec* |
–0.025*** | –0.241*** |
| (–2.977) | (–3.272) | |
| Intercept | 0.091** | 0.087** |
| (2.469) | (2.361) | |
| Controls and their interactions | Included | Included |
| N | 24,229 | 24,229 |
| Adjusted R2 | 0.118 | 0.118 |
| Year and Industry fixed effects | Yes | Yes |
Notes: t-statistics are reported in parentheses. Standard errors are clustered at the firm level.
*p
This table examines the moderating role of green innovation in the relationship between financial constraints and R&D cost stickiness. The estimations use Model D, controlling for year and industry fixed effects. Model D is specified as follows:
Control variables include asset intensity (AI), employee intensity (EI), consecutive sales declines (Sdec), and leverage ratio (Lev), with definitions provided in previous sections.
In the first column of Table 5, the coefficient
Similarly, the second column shows a significantly negative
Given that large individual shareholders and institutional investors can influence firms’ discretionary expense decisions (Baysinger, 1991; Chung et al., 2019), we extend our analysis to test whether green innovation strategies influence cost stickiness by shaping external investors’ perceptions and behaviors. Specifically, we examine whether green innovation strategies alleviate financial constraints by enhancing investor confidence, thereby influencing firms’ cost behavior.
We posit that green innovation alleviates firms’ financing frictions by attracting external investors, thereby enabling them to maintain R&D cost stickiness. To test this investor confidence mechanism, we conduct a heterogeneity analysis based on two proxies for investor monitoring and influence: institutional ownership and the shareholding ratio of the top ten shareholders (Top 10). We hypothesize that the moderating effect of green innovation will be stronger in firms with high institutional ownership or high ownership concentration, as investors in these firms tend to be more adept at valuing long-term strategic initiatives and can effectively discourage myopic R&D cuts.
First, we divide the sample into high- and low-institutional ownership groups.
The results indicate that the moderating effect of green innovation is more
significant for firms with higher institutional ownership. Specifically, in Table 6, the coefficient of
| (1) | (2) | |
| High | Low | |
| 0.558*** | 0.485*** | |
| (5.645) | (6.014) | |
| Dec* |
–0.362** | 0.083 |
| (–2.111) | (0.467) | |
| –0.012 | –0.017* | |
| (–0.817) | (–1.935) | |
| Dec* |
0.049 | 0.057* |
| (1.406) | (1.911) | |
| 0.010 | 0.003 | |
| (1.141) | (0.383) | |
| Dec* |
–0.025** | –0.011 |
| (–2.132) | (–0.814) | |
| Intercept | 0.055 | 0.150*** |
| (1.241) | (2.788) | |
| Controls and their interactions | Included | Included |
| N | 12,129 | 12,099 |
| Adjusted R2 | 0.109 | 0.151 |
| Year and Industry fixed effects | Yes | Yes |
Notes: t-statistics are reported in parentheses. Standard errors are clustered at the firm level.
*p
The estimations use Model D, controlling for year and industry fixed effects. Model D is specified as follows:
Control variables include asset intensity (AI), employee intensity (EI), consecutive sales declines (Sdec), and leverage ratio (Lev), with definitions provided in previous sections.
Next, we categorize firms based on the proportion of shares held by their top
ten shareholders to form high and low ownership concentration groups. In Table 7,
the results show that for firms with higher ownership concentration among large
shareholders, the coefficient of
| (1) | (2) | |
| High | Low | |
| 0.605*** | 0.369*** | |
| (6.399) | (4.607) | |
| Dec* |
–0.424** | 0.072 |
| (–2.084) | (0.472) | |
| –0.004 | –0.025*** | |
| (–0.291) | (–2.770) | |
| Dec* |
0.071* | 0.041 |
| (1.873) | (1.270) | |
| 0.006 | 0.008 | |
| (0.728) | (0.949) | |
| Dec* |
–0.027** | –0.019 |
| (–2.156) | (–1.449) | |
| Intercept | 0.147*** | 0.078 |
| (2.582) | (1.605) | |
| Controls and their interactions | Included | Included |
| N | 12,115 | 12,108 |
| Adjusted R2 | 0.140 | 0.101 |
| Year and Industry fixed effects | Yes | Yes |
Notes: t-statistics are reported in parentheses. Standard errors are clustered at the firm level.
*p
The estimations use Model D, controlling for year and industry fixed effects. Model D is specified as follows:
Control variables include asset intensity (AI), employee intensity (EI), consecutive sales declines (Sdec), and leverage ratio (Lev), with definitions provided in previous sections.
Together, these findings indicate that firms implementing green innovation strategies are more effective in boosting investor confidence, thereby alleviating financing constraints and enabling them to retain R&D resources, thus sustaining R&D cost decisions.
To test the robustness of our conclusions, we conduct several robustness checks.
To test the robustness of the regression results, we sequentially control for
different fixed effects. In Column (1) of Table 8, we include firm and year fixed
effects, while excluding industry fixed effects. The results show that the
coefficient of
| (1) | (2) | (3) | (4) | (5) | (6) | |
| Firm fixed effect | Firm, Industry and Year fixed effect | Ranked KZ | An alternative KZ = KZi,t-1 | 2SLS regression | An alternative COST = SG&A | |
| 0.544*** | 0.544*** | 0.573*** | 0.594*** | 0.584*** | 0.417*** | |
| (7.369) | (7.357) | (7.793) | (10.185) | (9.700) | (9.832) | |
| Dec* |
–0.327** | –0.327** | –0.333** | –0.211 | 0.031 | –0.015 |
| (–2.038) | (–2.035) | (–2.295) | (–1.502) | (0.175) | (–0.247) | |
| –0.013* | –0.013* | –0.044** | –0.014* | –0.015* | –0.030*** | |
| (–1.724) | (–1.721) | (–2.302) | (–1.816) | (–1.727) | (–5.865) | |
| Dec* |
0.052* | 0.052* | 0.059 | 0.057*** | 0.216*** | 0.033*** |
| (1.689) | (1.686) | (1.139) | (3.019) | (3.030) | (3.386) | |
| Dec* |
–0.004 | –0.004 | –0.003 | –0.079 | –0.035 | 0.047 |
| (–0.054) | (–0.054) | (–0.045) | (–1.321) | (–0.620) | (0.989) | |
| Dec* |
–8.775* | –8.775* | –10.512** | –4.343 | –12.736*** | –14.341*** |
| (–1.679) | (–1.676) | (–2.086) | (–1.087) | (–2.610) | (–5.559) | |
| Dec* |
0.194*** | 0.194*** | 0.110 | 0.162** | 0.199*** | 0.091** |
| (2.859) | (2.855) | (1.468) | (2.503) | (2.883) | (2.007) | |
| Dec* |
–0.053 | –0.053 | 0.055 | –0.179 | –1.498** | –0.593*** |
| (–0.167) | (–0.166) | (0.207) | (–0.838) | (–2.468) | (–5.753) | |
| 0.021 | 0.021 | 0.020 | 0.041 | 0.037 | –0.049** | |
| (0.541) | (0.541) | (0.463) | (1.263) | (1.133) | (–2.215) | |
| 2.571 | 2.571 | 4.161 | 1.578 | 1.548 | 8.538*** | |
| (0.871) | (0.870) | (1.389) | (0.649) | (0.627) | (5.064) | |
| 0.056 | 0.056 | 0.181 | 0.042 | 0.070 | 0.270*** | |
| (0.424) | (0.423) | (1.320) | (0.375) | (0.589) | (4.180) | |
| Intercept | 0.111*** | 0.082*** | –0.189*** | –0.169*** | 0.088** | –0.076*** |
| (6.380) | (15.958) | (–7.512) | (–5.670) | (2.461) | (–3.680) | |
| N | 24,239 | 24,083 | 24,239 | 22,471 | 21,834 | 28,263 |
| Adjusted R2 | 0.101 | 0.208 | 0.118 | 0.116 | 0.107 | 0.432 |
| Industry | No | Yes | Yes | Yes | Yes | Yes |
| Year | Yes | Yes | Yes | Yes | Yes | Yes |
| Firm | Yes | Yes | No | No | No | No |
Notes: t-statistics are reported in parentheses. Standard errors are clustered at the firm level.
*p
To relax the assumption of a linear relationship between financial constraints
and cost stickiness, we group the financial constraint indicator into quartiles
(Q1–Q4) and assign ordinal values from 0 to 3, then include them in the main
regression model. As shown in Column (3) of Table 8, the coefficient of
Given the potential bidirectional causality between financial constraints and R&D cost stickiness (e.g., reductions in R&D investment may also deteriorate financing conditions), we adopt two methods to mitigate endogeneity bias.
First, we use the lagged value of the financial constraint indicator as a
substitute for the contemporaneous value in the regression. As shown in column
(3) of Table 8, using the lagged KZ index as an example, the coefficient of
Second, we further use the one-period lagged financial constraint variable as an
instrument and conduct a two-stage least squares (2SLS) regression. The
first-stage regression results indicate that the instrument is strong, with an
adjusted R-squared of 0.7969 and a first-stage F-statistic of 46.88 (p
A growing number of papers argue that intangible investment is created not only
by R&D expenses but also by SG&A expenses (Enache and Srivastava, 2018). We extend the discussion of R&D costs to SG&A costs in
an additional analysis. We find that
This study establishes that financial constraints are a critical determinant forcing managers to deviate from the asymmetric cost behavior predicted by traditional models of cost stickiness. Using large-sample evidence from Chinese listed firms, we consistently find a significant negative relationship between financial constraints and R&D cost stickiness, indicating that financially constrained managers are more likely to accelerate cost reductions during sales declines.
More importantly, we identify green innovation strategy as an effective mitigating factor. By enhancing investor confidence and alleviating financing frictions, green innovation incentivizes manager to engage in asymmetric R&D cost behavior. This dual mechanism is corroborated by our subsample analysis, which shows that the effect is more pronounced in firms with high institutional ownership and high ownership concentration among large individual shareholders, as these stakeholders especially value sustainable innovation strategies. The robustness of our findings is further confirmed by extending the analysis to SG&A cost stickiness.
These findings contribute to the literature by integrating financing theory and resource-based perspectives into cost behavior research. We demonstrate that cost stickiness is not merely an operational decision but a strategic choice, heavily influenced by external financing conditions and signals of long-term value. For practitioners, this study highlights the strategic value of green innovation, which not only delivers environmental benefits but also serves as a credible commitment mechanism to investors, thereby securing strategic flexibility in R&D and sustaining investor support during economic downturns. Policymakers can also leverage these insights to design targeted financial incentives for the implementation of environmental sustainability policies, recognizing their role in stabilizing corporate innovation cycles.
However, our study is subject to limitations, as we do not examine whether the method of alleviating financial constraints remains effective for sticky SG&A costs. We consider this a potentially controversial issue due to agency problems associated with SG&A costs and plan to explore it in future research.
The data supporting the findings of this study are available from the corresponding author upon reasonable request.
QZ designed the research study and wrote the manuscript. FZ performed the research and analyzed the data. Both authors contributed to editorial changes in the manuscript. Both authors read and approved the final manuscript. Both authors have participated sufficiently in the work and agreed to be accountable for all aspects of the work.
We gratefully acknowledge the assistance and instruction from Dr. Xu of Jiangsu University of Science and Technology.
This research was supported by the Shanghai Zhongqiao Vocational and Technical University under a school-level project titled “The Impact of Financing Constraints on Stock Price Crashes: The Moderating Effect of ESG Disclosure” (Project No. ZQSK202406).
The authors declare no conflict of interest.
During the preparation of this work the authors used DeepL in order to check spell and grammar. After using this tool, the authors reviewed and edited the content as needed and takes full responsibility for the content of the publication.
See Table 9.
| Variable | Definition/Measurement | Source |
| Log-change in R&D costs in year t relative to year t-1 | CSMAR | |
| Log-change in sales revenue in year t relative to year t-1 | CSMAR | |
| Dec | A dummy variable that equals 1 when sales revenue decreases from year t-1 to t, and 0 otherwise | Constructed |
| FC (KZ index) | KZ = –1.002CF + 0.283Q + 3.139Lev + 39.367Div – 1.315Cashholdings | Constructed from CSMAR data |
| FC (Zhang & Wang index) | Alternative financial constraint measure proposed by Zhang & Wang (2013) | Constructed |
| GI | Green innovation, measured by ln (green patent applications + 1) | CNRDS |
| AI | Asset intensity, measured by logarithm of the ratio of total assets to sales revenue | CSMAR |
| EI | Employee intensity, measured by the number of employees*100,000/sales revenue | CSMAR |
| Sdec | A dummy variable that equals one when sales have decreased in two consecutive years and zero otherwise | Constructed |
| Lev | Leverage ratio, measured by total debts/total assets | CSMAR |
| Institutional ownership | Percentage of shares held by institutional investors | CSMAR |
| TOP 10 | The shareholding ratio of the top ten shareholders | CSMAR |
References
Publisher’s Note: IMR Press stays neutral with regard to jurisdictional claims in published maps and institutional affiliations.