

 , Liyuan Wang 1, Fengchun Lee 2, Zhihong Song 3,*
1 School of Economics and Management, Shanxi University, 030006 Taiyuan, Shanxi, China
2 Surrey International Institute, Dongbei University of Finance and Economics, 116025 Dalian, Liaoning, China
3 Institute of Management and Decision, Shanxi University, 030006 Taiyuan, Shanxi, China
Abstract
This study integrates the attention-based view (ABV), resource orchestration theory (ROT), and the stimulus–organism–response (S-O-R) framework to investigate how government digital initiatives influence enterprise digital transformation (EDT) through top management teams’ (TMTs) attention allocation and resource orchestration capability. Using panel data from 182 listed pharmaceutical companies in China’s Shanghai and Shenzhen A-share markets between 2012 and 2021, this research empirically tests the proposed theoretical model. Results show that government digital initiatives have a significant positive impact on EDT, with TMTs’ attention allocation and resource orchestration capability playing partial mediating roles. Notably, our findings resonate with digital transformation dynamics in Central and Eastern Europe (CEE), where governments similarly play a pivotal role in driving digital adoption, albeit within distinct institutional contexts. China’s centralized approach emphasizes top-down infrastructure development and strategic alignment, whereas CEE economies rely on European Union (EU)-driven frameworks and often face challenges in translating government support into widespread digital adoption. Despite these differences, the core mechanisms—government stimuli shaping managerial attention and resource allocation—are generalizable to emerging and transitional economies, including those in CEE. Overall, this study highlights that effective digital transformation requires both policy clarity to guide TMTs’ attention and targeted support for resource orchestration, offering insights for CEE contexts navigating EU digital mandates alongside local institutional constraints.
Keywords
- attention-based view
- resource orchestration theory
- government digital initiatives
- TMTs attention allocation
- resource orchestration capability
- enterprise digital transformation
In recent years, the rapid development of new-generation information technologies, including artificial intelligence, big data, and the Internet of Things, has coincided with intensified market competition, prompting enterprises to integrate digital technologies into their existing operations for high-quality and sustainable development. Enterprise digital transformation (EDT), defined as “a process that improves enterprises by triggering significant changes through combinations of information, computing, communication, and connectivity technologies” (Vial, 2019), offers benefits such as enhanced operational efficiency, expanded sales channels, improved customer experience and customer loyalty, cost reduction, revenue growth, and adaptability to market dynamics. However, empirical evidence shows that the pace of EDT remains slow in China: a 2021 survey by the China Association of Listed Companies revealed that among 726 sampled listed firms, only 8.7% achieved relative maturity in digital transformation, and 0.2% completed the process, whereas the majority were still in the exploratory stage. This gap underscores the urgent need to explore effective drivers of EDT, a goal with significant theoretical and practical importance.
The literature on the driving forces behind EDT has examined both the internal characteristics of organizations and the influences of the external environment. The internal factors driving EDT include: the characteristics of the top management teams (TMTs) (Li et al., 2018; Wrede et al., 2020), board governance style (Turel et al., 2019), strategic vision (Cheng et al., 2024), executives’ paradoxical leadership (Wu et al., 2025), and digital strategy (Bharadwaj et al., 2013). In contrast, external environmental factors encompass government support (Howell, 2017), environmental uncertainty (Chen and Tian, 2022). Despite these insights, critical gaps remain: the mechanisms linking external stimuli (e.g., government digital initiatives (GDIs)) to internal organizational processes (e.g., TMTs attention allocation, resource orchestration capability (ROC)) in driving EDT are underexplored, particularly in context-specific settings such as the pharmaceutical industry.
Specifically, prior research on the relationship between GDIs and EDT can be systematically categorized into two distinct streams, each contributing unique insights while leaving critical gaps unaddressed. The first stream of research focuses primarily on the role of financial incentives of government-provided financial resources and their direct impact on EDT (Bronzini and Piselli, 2016; Liu and Mao, 2019; Zhao et al., 2024). For example, Bronzini and Piselli (2016) explored how Research and Development (R&D) subsidies influence firm innovation, highlighting the role of financial incentives in reducing the cost burden for enterprises engaging in digital R&D. Howell (2017) also demonstrated that R&D grants could effectively stimulate innovation activities related to digital transformation. Based on the panel data of 2928 manufacturing listed companies in China from 2016 to 2020, Zhao et al. (2024) empirically illustrated that subsidies effectively incentivize the digital transformation of manufacturing enterprises. However, these studies predominantly emphasized direct effects while overlooking the cognitive processes through which TMTs interpret and allocate resources in response to financial support. The black box of how GDIs shape TMTs attention allocation—a critical precursor to strategic decision-making—remains underexplored. The attention-based view (ABV) posits that TMTs possess limited cognitive resources, requiring them to selectively allocate attention to issues critical for organizational survival (Ocasio, 1997; Ocasio, 2011). GDIs, such as policy signals, financial subsidies, or infrastructure investments, represent significant external stimuli that should theoretically influence TMTs attention allocation. However, existing research has overlooked the mediating role of TMTs attention in the relationship between GDIs and EDT.
The second stream of research investigates the roles of policy guidance and regulatory frameworks of government-led digital infrastructure development (Nambisan et al., 2019; Wang et al., 2023a). Wang et al. (2023a) analyzed how government investments in 5G, big data platforms, and smart city initiatives created enabling environments for EDT. They found that improved digital infrastructure could reduce the barriers for enterprises to access digital resources and promote digital innovation. Nambisan et al. (2019) examined regulatory frameworks for data governance and digital services, highlighting their role in reducing transformation risks. Nevertheless, these studies often treat enterprises as passive recipients of policy stimuli, neglecting the active cognitive mechanisms through which organizations interpret policy signals. The literature lacks clarity on how TMTs translate infrastructure support into strategic priorities for EDT. Resource orchestration theory (ROT) argues that firms build competitive advantages by structuring, bundling, and leveraging resources (Sirmon et al., 2007; Sirmon et al., 2011). In the context of EDT, this involves integrating digital technologies with existing resources to form new capabilities. GDIs can provide critical resources that enable resource orchestration, but prior research rarely links these elements.
The gaps above are not unique to China. In Southeast Asia, for example, a study of Indonesian micro, small and medium enterprises (MSMEs) during COVID-19 showed that while government aid stabilized firms’ financial soundness, it failed to boost digital adoption, largely because support was untargeted and lacked alignment with digital goals (Kurniawan et al., 2023). This raises a broader question: why do some government initiatives successfully drive digital transformation, while others merely sustain short-term stability? Additionally, managerial myopia, amplified by institutional uncertainties in transitional economies, often undermined long-term digital innovation, further complicating the link between policy and transformation.
The Central and Eastern Europe(CEE) contexts differ from China’s in key ways. Digital transformation in CEE is often European Union (EU)-driven rather than state-led, shaped by weaker state capacity and pressures to harmonize with EU policies (Raimo et al., 2023). Yet, the core challenge—how policy stimuli translate into organizational action—remains similar. By unpacking the cognitive (TMTs attention) and operational (resource orchestration) mechanisms linking GDIs to EDT, our study offers a framework to understand not only China’s experience but also dynamics in CEE, where similar tensions between policy intent, managerial cognition, and resource constraints persist.
To fill the above research gaps, this study explores how GDIs drive EDT in China’s pharmaceutical industry, which is mediated by TMTs attention allocation and ROC. By bridging the ABV, ROT, and the stimulus-organism-response (S-O-R) framework, we aim to address critical gaps in the literature: (1) the understudied mechanism linking external policy stimuli to internal organizational processes in EDT; (2) the joint roles of managerial cognition and resource management in translating policy support into tangible digital outcomes; and (3) the contextual specificity of digital transformation in highly regulated, data-intensive industries such as pharmaceuticals.
The rest of this paper is structured as follows. Section 2, which is based on the S-O-R framework, combines the ABV and ROT to construct a theoretical model. Section 3 describes the sample, data source, and variable measurement. Section 4 uses empirical research methods to test the impact and mechanism of GDIs on EDT. Section 5 summarizes the research conclusions of this paper and proposes limitations and further research directions.
The S-O-R framework is a classic model in the field of consumer behavior that is used to study the changes in psychology and cognitive emotions when individuals are stimulated by the external environment (Mehrabian and Russell, 1974). In the S-O-R framework, stimulus (S) is defined as an environmental factor that affects the internal state of an individual. The organism state (O) refers to the approach or avoidance psychology of an individual due to external stimulation. The response (R) is considered a certain positive or negative behavior performed by an individual. The S-O-R framework reveals the relationship between the organizational process and response and emphasizes the correlation between the internal process and response of the organization. On the basis of the S-O-R framework, this paper explores how GDIs, as external environmental stimuli, promote EDT. Since the information processing of GDIs by the TMTs can be regarded as a cognitive process, the essence of cognition is considered “the psychological structure and process involving thinking, understanding, and interpreting environmental stimuli and events”. Therefore, when the local government releases digital initiatives, as external environmental stimuli, the attention configuration of the TMTs on digital-related issues reflects the internal psychological state or emotional response of the organism (Jani and Han, 2015), which in turn leads to the behavioral response of the TMTs to make digital transformation decisions.
The S-O-R framework is adopted as the foundational model because of its unique
ability to capture the dynamic interplay between external stimuli and
organizational responses. First, unlike existing studies that focus solely on
direct relationships (e.g., government initiatives
The ABV, rooted in Ocasio’s (1997) seminal work, posits that attention is a scarce resource shaping organizational decision-making. Ocasio’s framework highlights three core elements: (1) attention structures (formal/informal systems guiding where attention is directed), (2) attention focus (the issues or domains that decision-makers prioritize), and (3) attention allocation (the distribution of time and effort that decision-makers pay attention to, encode, interpret, and focus on an organization’s issues and answers) (Ocasio et al., 2018).
For TMTs, attention allocation is critical because strategic actions (including digital transformation) are constrained by the limited cognitive capacity of managers (Ocasio, 1997; Ocasio, 2011). External stimuli, such as GDIs, act as “attention triggers” by signaling policy priorities, altering organizational attention structures (e.g., formal meetings to discuss policy compliance), and redirecting the TMTs focus toward digital issues (Li et al., 2018). In the pharmaceutical industry, where regulatory compliance and policy alignment are paramount, TMTs are particularly sensitive to government signals, making attention allocation a key link between external policies and internal transformation efforts (Wrede et al., 2020).
The ABV explains why not all external stimuli translate into action: only when TMTs allocate attention to digital transformation do firms commit resources to it. This aligns with our focus on TMTs attention allocation as a mediator between government initiatives and EDT.
ROT, developed by Sirmon et al. (2007; 2011), extends resource-based views by emphasizing that resource ownership alone does not guarantee competitive advantage; instead, firms must actively orchestrate resources to create value. ROT identifies three interrelated processes: resource structuring, resource bundling, and resource leveraging. Resource structuring refers to acquiring, accumulating, or divesting resources (e.g., investing in digital talent or artificial intelligence (AI) technologies). Resource bundling refers to integrating existing resources (e.g., combining clinical expertise with big data analytics) to form capabilities. Resource leveraging refers to employing bundled resources to seize opportunities (e.g., launching telemedicine platforms using AI diagnostics).
In dynamic contexts such as digital transformation, ROT is particularly relevant because it explains how firms adapt to external changes by reconfiguring resources (Sirmon et al., 2011). For pharmaceutical firms, digital transformation requires orchestrating not only traditional resources (e.g., R&D labs) but also digital assets such as patient data and the cloud infrastructure. GDIs, such as subsidies for digital infrastructure, can enhance structuring efforts, whereas firms’ ROC guides bundling and leveraging—creating a mechanism linking policy to transformation (Cheng et al., 2024).
In the pharmaceutical industry, GDIs (e.g., subsidies for medical big data platforms, policies promoting telemedicine, and investments in smart hospital infrastructure) provide critical external digital resources and policy signals. ROC here refers to pharmaceutical enterprises’ ability to acquire and internalize these external digital resources (Resource absorption capability) and efficiently deploy them across operational processes (Resource allocation capability), which aligns with Hou et al. (2025)’s logic of integrating “external resource absorption” and “internal resource utilization”.
Resource absorption capability reflects pharmaceutical enterprises’ capacity to identify, acquire, and transform external digital resources derived from government initiatives into internal capabilities. For example, government-funded digital infrastructure (e.g., 5G-enabled medical networks) or policy-driven technical standards, such as electronic health record (EHR) protocols, require enterprises to invest in R&D to adapt, assimilate, and integrate these resources into clinical workflows (e.g., developing AI diagnostic tools compatible with government data platforms). This corresponds to Hou et al. (2025)’s (Green resource absorption capability, GRAC), which emphasizes absorbing external green resources to build internal capabilities. Resource allocation capability captures the efficiency of deploying absorbed digital resources to create value. After absorbing digital resources (e.g., AI systems or cloud-based EHRs), pharmaceutical enterprises need to integrate them into service processes (e.g., using EHRs to optimize patient scheduling or telemedicine platforms to expand service coverage) to improve operational efficiency and service quality. This aligns with Hou et al. (2025)’s green resource allocation capability (GRAL), which focuses on optimizing resource utilization to maximize performance.
Recent studies have extended ROT to the digital transformation context, highlighting its unique role in integrating digital resources. Cheng et al. (2024) proposed a dynamic model of digital resource orchestration, emphasizing that enterprises must continuously restructure, bundle, and leverage data assets to adapt to rapid technological changes. For example, in the pharmaceutical industry, ROC enables firms to integrate big data analytics with clinical research processes, fostering innovations like precision medicine and smart healthcare systems (Wang et al., 2023b). Unlike traditional resource management, digital resource orchestration requires specialized capabilities such as real-time data processing, cross-organizational collaboration, and agile resource reallocation (Cenamor et al., 2019). These findings align with our study’s focus on how GDIs facilitate EDT by enhancing enterprises’ ability to orchestrate digital-specific resources, such as AI technologies and cloud infrastructure. Notably, digital transformation driven by resource orchestration is not limited to the pharmaceutical industry; similar mechanisms have been observed in other sectors. For example, Jia et al. (2024) found that regional digitalization, by reshaping resource allocation and technological integration in China’s industrial sector, significantly improved energy efficiency—highlighting the generalizability of resource orchestration in leveraging digital resources to enhance sector-specific performance.
On the basis of the S-O-R framework, this paper combines the ABV and ROT and proposes a hypothesized relationship between GDIs, TMTs attention allocation, ROC, and EDT.
GDIs refer to various measures and policies taken by government agencies to promote digital infrastructure construction, including government subsidies, tax incentives, and public digital policies and projects in the form of government support. There are three micro-level mechanisms through which GDIs influence EDT. First, government subsidies and tax incentives act as direct financial buffers, enabling firms to reallocate resources toward digital transformation. In other words, tax savings may directly augment free cash flow (Liu and Mao, 2019), which can be earmarked for digital transformation without compromising operational stability. In the early stages of EDT, GDIs can provide financial support, alleviate enterprise cost pressure (Bronzini and Piselli, 2016), and allocate funds for enterprise resource planning and product lifecycle management projects to complete the purchase, upgrade, and replacement of hardware equipment, thus reducing the amount of transformation resources and time wasted. Howell (2017) analyzed U.S. R&D grant programs and demonstrated that R&D grants boost patent output and commercial outcomes by reducing financial constraints for high-risk projects. This effect is particularly pronounced in small and medium enterprises (SMEs), which often face tighter credit constraints. In addition, Wang et al. (2023a) documented that Chinese government subsidies boost EDT by alleviating financial constraints, particularly for SMEs.
Second, government-led digital infrastructure and policy-driven initiatives, such as 5G networks, public data platforms, and digital governance advocacy, provide firms with critical shared resources that facilitate digital capability building. This is supported by Wang et al. (2023b), who found that provincial government digital initiatives promote digital innovation in Chinese firms (via patents in digital technologies), primarily by reducing information asymmetry and transaction costs.
Third, government-industry-academia partnerships may facilitate digital capability transfer and government-sponsored digital talent training programs may address skill shortages. China’s “Digital Transformation Pilot Projects” connect firms with research institutes, resulting in a 35% increase in digital technology commercialization rates (MIIT, 2023).
In summary, GDIs act as multi-dimensional catalysts for EDT, exerting their influence through a sophisticated interplay of financial, institutional, and capacity-building mechanisms. Therefore, the following hypothesis is proposed:
H1. Government digital initiatives have a positive effect on EDT.
As stakeholders with close ties to enterprises, GDIs affect the survival of enterprises and are important external environmental stimuli for enterprises in making decisions (Tian et al., 2021). GDIs, such as public digital policies and projects, may improve the digitalization level of the economy and society through digital applications and are accompanied by other government incentives, such as tax incentives, financial support, and digital projects. Therefore, enterprises have the motivation and opportunity to leverage GDIs to gain competitive and commercial value advantages (Wang et al., 2023a). In addition, GDIs often stimulate new opportunities, which stimulate enterprises to respond positively, enabling them to exploit these opportunities and ultimately obtain considerable benefits (Lazzarini, 2015). According to the ABV, decision-makers’ attention resources are limited, and they need to judge which issues and solutions are of high priority and focus their limited attention on these issues (Ocasio, 2011). The process of focusing attention is also a process of communication and consensus, which is influenced by the decision-making context in which decision-makers are located (Ocasio et al., 2018). GDIs are released with the aim of achieving political and social goals in economic and social activities, which affect the attention allocation of the TMTs because these initiatives may be crucial to enterprise survival and success (Nambisan et al., 2019). When the government releases digital initiatives that may include fiscal subsidies, tax incentives, the formulation of policies and regulations, and the construction of digital infrastructure, the TMTs would pay more attention to issues and solutions related to digitalization.
GDIs can stimulate the TMTs to focus on digital-related issues through three mechanisms. First, in emerging economies, a major source of business opportunities comes from GDIs and changes in related policies. Therefore, the government’s release of digital initiatives may bring about new opportunities (Wei et al., 2020). National digital strategies and high-profile policy announcements act as cognitive primes, activating TMTs’ mental models of digital transformation. Ocasio (2011) argued that organizations attend to issues framed as “institutional priorities”, and government policies serve as authoritative signals that redefine strategic agendas. Second, financial support (subsidies, tax incentives) reduces the opportunity cost of digital investment, making it rationally appealing for TMTs to allocate attention. This aligns with Ocasio’s (2011) ABV: subsidies trigger TMTs to reclassify digitalization from an “optional initiative” to a “strategic imperative”, leading to resource reallocation. Third, data governance regulations (e.g., General Data Protection Regulation (GDPR), China’s Data Security Law) create compliance imperatives that force TMTs to attend to digital infrastructure. Therefore, the following hypothesis is proposed:
H2. GDIs have a positive effect on TMTs attention allocation.
Sirmon et al. (2011) defined resource orchestration as the process of structuring, bundling, and leveraging resources, which in the digital context means integrating technologies (structuring), aligning digital tools with business processes (bundling), and scaling digital solutions (leveraging). In the digital age, resource orchestration is a complex process in which enterprises actively structure, bundle, and leverage their own resources to accelerate their response to the call for EDT. The literature shows that to adapt to the ever-changing market environment, enterprises need to have a high level of ROC, which refers to the ability of enterprises to achieve goals by combining, configuring, and deploying resources (Wang et al., 2020).
GDIs may provide the resources required for enterprises to implement EDT. First, government-provided digital infrastructure (e.g., 5G networks and public data hubs) and financial resources reduce the cost of resource structuring. Wang et al. (2023b) empirically showed that province-level government digital initiatives (e.g., 5G networks, open data platforms) promote digital innovation in Chinese firms by reducing information asymmetry and transaction costs, evidenced by increased digital technology patents. Second, policy endorsements (e.g., digital transformation awards) legitimize resource reallocation for EDT, reducing internal resistance to orchestration. Thus, institutional legitimacy signals validate the strategic value of reconfiguring resources toward digital capabilities. Third, policies such as accelerated approval for digital therapeutics encourage firms to leverage orchestrated resources. A firm that bundles AI algorithms with clinical trial data can submit faster, more data-driven applications for new drug approvals, turning resource bundling into tangible market outcomes (Wrede et al., 2020). Therefore, the following hypothesis is proposed:
H3. GDIs have a positive impact on ROC.
With the rapid development of new-generation information technology, the Chinese government has successively issued a series of policies related to digital initiatives, which means that the importance of EDT has risen to the level of the national strategy. The Guiding Opinions on Accelerating the Cultivation and Development of High-quality Manufacturing Enterprises, issued by the Chinese Ministry of Industry and Information Technology, the Chinese Ministry of Science and Technology, the Chinese Ministry of Finance, and six other ministries in June 2021, noted that accelerating the integration of digitalization and services in key industries and the pace of digital transformation and implementing the digital transformation action plan of state-owned enterprises through intelligent manufacturing projects and 5G application innovation action are necessary. In the context of governments vigorously advocating digital transformation, the TMTs of enterprises may allocate more attention to digitalization and digital transformation-related issues than to other issues. TMTs attention allocation is the process of consciously and continuously allocating cognitive resources to guide problem-solving, planning, meaning construction, and decision-making (Ocasio, 2011). If the TMTs regard digital transformation as a priority, incorporate it into the EDT strategic planning, and regard it as a key driving force for the enterprise’s future development, then the enterprise is more likely to implement digital transformation (Shepherd et al., 2017). In addition, the TMTs of an enterprise may dynamically adjust their attention allocation and decision-making direction on the basis of the guidance of GDIs and the internal needs of the enterprise. If the TMTs can understand the impact of different digital technologies on the enterprise and selectively pay attention to and invest in a large amount of information and tasks, then the enterprise can better select and apply strategies that are suitable for its own situation to promote EDT. Therefore, the following hypothesis is proposed:
H4. TMTs attention allocation plays a mediating role in the relationship between GDIs and EDT.
As an organizational change activity, EDT requires enterprises to have digital resources and be able to coordinate these resources to build resource portfolios. Therefore, the core of EDT lies in effectively organizing and managing digital resources (Amit and Han, 2017). Through the digital technology infrastructure brought about by GDIs, enterprises can use these digital technology infrastructures to enable business innovation on the one hand and “bundle” these digital technology infrastructures with internal enterprise resources on the other hand to form competitive advantages.
Building on recent advancements, we argue that ROC in the digital era involves more than just traditional resource management. It encompasses the dynamic integration of digital technologies (e.g., Internet of Things (IoT) sensors, blockchain) with organizational processes, a process critical for medical firms to transform data into actionable insights (Cheng et al., 2024). GDIs may provide subsidies for digital infrastructure or policy incentives for data-driven innovation, enabling enterprises to increase their ability to structure digital resources (e.g., acquire AI patents), bundle them with existing medical expertise, and leverage them to create new service models (e.g., telemedicine platforms). For example, a government-promoted AI subsidy may lead firms to structure AI technology purchases, bundle them with customer data, and leverage the combined capability to launch a smart customer service system, thereby driving EDT. In addition, as GDIs may involve financial support and tax incentives to EDT, enterprises may actively implement digital transformation by structuring, bundling, and leveraging internal and external organizational resources. For enterprises, a higher level of ROC enables them to acquire and accumulate digital resources (Cheng et al., 2024); improve their ability to structure, bundle, and leverage resources; and thus, promote digital transformation. Therefore, the following hypothesis is proposed:
H5. ROC mediates the relationship between GDIs and EDT.
Fig. 1 depicts the integrated theoretical model, illustrating how GDIs (Stimulus) simultaneously trigger TMTs attention allocation (Organism’s cognitive response, informed by ABV) and activate resource orchestration capabilities (Organism’s operational response, informed by ROT), ultimately leading to EDT (Response). This visual representation clarifies the sequential and mediating relationships among key constructs.
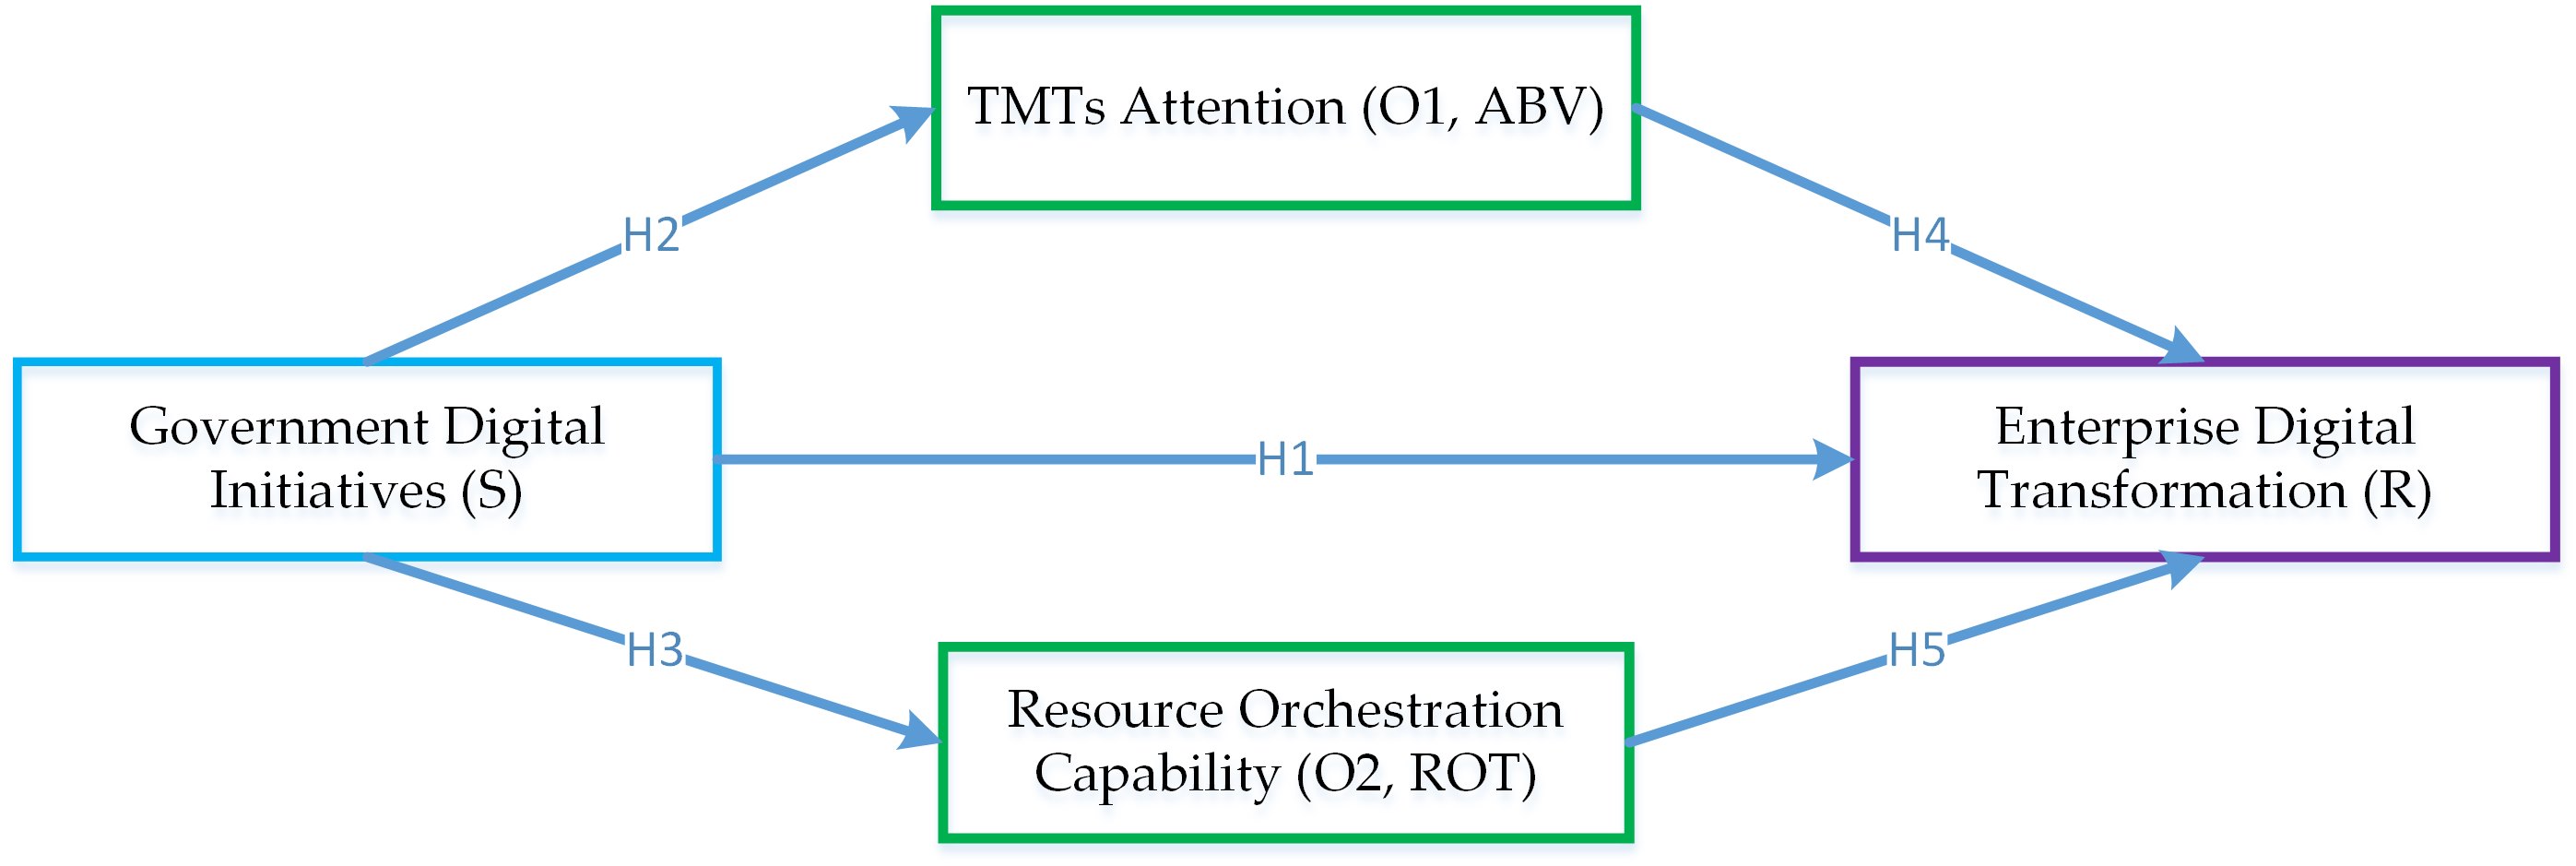 Fig. 1.
Theoretical model integrating the S-O-R, ABV, and ROT. S-O-R, stimulus-organism-response; ABV, attention-based view; ROT, resource orchestration theory; TMTs, top management teams.
This paper takes listed companies in the pharmaceutical industry in the Chinese Shanghai and Shenzhen A-share markets as the research sample. The rationale for selecting pharmaceutical listed companies as the research sample is threefold. First, China has prioritized the digital transformation in healthcare as part of its “Healthy China 2030” strategy and “Digital China” initiatives, making pharmaceutical firms a focal point for GDIs. Since 2015, the Chinese government has issued targeted policies, which provide subsidies for digital infrastructure (e.g., medical big data platforms) and tax incentives for R&D in digital technologies. This creates a strong external stimulus (GDIs) to study, as required by our theoretical framework (S-O-R model).
Second, postpandemic digital healthcare, such as telemedicine, smart pharmacies, and electronic health records, has become integral to patient care. Pharmaceutical firms are increasingly integrating digital tools to connect with hospitals, pharmacies, and patients, making their digital transformation not just a strategic choice but a necessity to remain competitive. In addition, drug R&D requires massive investment in data analysis, highlighting the role of ROC—a core mediator in our model. This industry context amplifies the relevance of studying how firms allocate resources to digital initiatives.
Third, pharmaceutical listed companies offer unique advantages for empirical research. On the one hand, as regulated entities, pharmaceutical firms are required to disclose detailed information on R&D investments, digital initiatives, and government subsidies in their annual reports. This ensures high-quality data for measuring variables such as EDT (via text analysis of annual reports) and resource orchestration (via R&D intensity). On the other hand, compared with cross-industry samples, pharmaceutical firms share similar operational models (R&D-driven, heavy regulation, Business-to-Business (B2B)/Business-to-Consumer (B2C) hybrid sales), reducing unobserved heterogeneity that could confound results. This homogeneity strengthens the internal validity of our findings on the mechanisms (TMTs attention allocation, ROC) linking government initiatives to EDT.
Specifically, according to the industry classification results of listed companies in the third quarter of 2021 by the China Securities Regulatory Commission, a total of 275 listed enterprises in the pharmaceutical manufacturing industry (with an industry category code of 27), as well as 63 enterprises involved in medical device and drug R&D and manufacturing in the special equipment manufacturing industry (with an industry category code of 35), research and experimental development (with an industry category code of 73), and software and information technology services (with an industry category code of 65), were selected. The above 338 listed enterprises in the medical industry were initially selected as the research sample. For the initial sample collected, this study considers the following two principles for screening and data processing. First, we eliminate listed enterprises with *ST and ST designations. Second, we eliminate listed enterprises with many missing values. To eliminate the influence of extreme values, this paper winsorizes all continuous variables by 1% and finally obtains unbalanced panel data of 182 listed companies in the medical industry from 2012 to 2021.
This paper collected data through multiple sources. First, the data for the measurement of EDT come from the annual reports released by 182 listed companies in the pharmaceutical industry, and the data for the measurement of TMTs attention allocation come from the Management Discussion and Analysis (MD&A) sections of the annual reports of listed companies. Second, the data for the measurement of GDIs come from work reports and text databases released on the official websites of government departments in 22 provinces, 5 autonomous regions, and 4 municipalities. Government work reports constitute one of the main carriers of the government’s annual work summary and the work plan for the next year. The government work report usually mentions the relevant content of the government’s digital initiatives, such as promoting the construction of digital government, accelerating the development of the digital economy, promoting the development of digital industries, optimizing digital government services, and accelerating the construction of information infrastructure. Therefore, this paper uses local government work reports to construct measures of GDIs. Third, the data for the control variable provincial gross domestic product (GDP) per capita come from the Statistical Yearbook of China. Finally, the measurement of ROC and other control variables comes from the China Stock Market & Accounting Research (CSMAR), China Research Data Service Platform (CNRDS), and Wind databases.
Referring to Wu et al. (2021), the keyword frequency of digital transformation in the annual reports of listed enterprises is used to construct a measurement for EDT. Specifically, Python 3.12 (Python Software Foundation, Wilmington, DE, USA) is used first to crawl the annual report texts of 182 listed companies, which are then processed on the basis of the keyword of EDT by Wu et al. (2021), so that the digital transformation keyword dictionary can better reflect the contextual characteristics of “listed enterprises in the medical industry” (see Table 1). Second, on the basis of the keyword dictionary in Table 1, Python 3.12 is used to search for keywords in the annual reports of listed companies, and the total word frequency of digital transformation keywords for the sample enterprises from 2012 to 2021 is obtained. Since this type of data has the characteristic of “right bias”, this study performs logarithmic processing on the total word frequency and uses it as a measure of EDT.
| Variable | Keywords | Data sources |
| EDT | digital transformation; artificial intelligence; big data; cloud computing; blockchain; image understanding; investment decision; support system; intelligent data analysis; intelligent robot; machine learning; deep learning; semantic search; biometric technology; face recognition; voice recognition; identity verification; natural language processing; data mining; text mining; data visualization; heterogeneous data; flow computing; graph computing; memory computing; multiparty secure computing; brain-like computing; cognitive computing; fusion architecture; billions of concurrent; eb-level storage; information physical system; distributed computing; mobile payment; intelligent energy; Business-to-Business (B2B); Business-to-Consumer (B2C); Consumer-to-Business(C2B); Consumer-to-Consumer(C2C); Online-to-Offline (O2O); network connection; intelligent medical; intelligent customer service; intelligent marketing; unmanned retail; internet finance; digital finance; data management; data mining; data network; data platform; data center; data science; digital control; digital technology; digital communication; digital network; digital intelligence; digital terminal; digital marketing; cloud IT; cloud ecology; cloud service; cloud platform; internet of things; internet | Annual reports of listed enterprises from 2012 to 2021 |
| GDI | subsidy; grant; tax incentive; R&D funding; digital subsidy; regulation; policy; standard; data governance; compliance; strategy; guideline; vision; digital plan; roadmap | 2012–2021 local government work report |
EDT, enterprise digital transformation; GDI, government digital initiative.
Text analysis is used to measure the variable of GDIs. The policy documents and development plans of national and local governments usually provide detailed descriptions of the goals, measures, and effects of GDIs. The selection of keywords for measuring GDIs is grounded in two key theoretical frameworks. First, drawing from policy instrument theory (Howlett et al., 2020), we categorize government actions into three dimensions: financial support, regulatory measures, and informational signaling. This categorization is used to guide our keyword identification to ensure coverage of diverse policy tools. Second, informed by the literature on digital transformation drivers (Wang et al., 2023a), we focus on keywords that reflect direct and indirect government interventions relevant to EDT. For financial support, terms such as “subsidy”, “grant”, and “tax incentive” were selected because prior research (Howell, 2017) has shown that these instruments directly influence firms’ digital investment decisions. For regulatory measures, keywords such as “regulation”, “policy”, and “standard” were included, which indicates that regulatory signals shape firms’ digital strategy and resource allocation. Informational signaling keywords, such as “strategy”, “guideline”, and “vision”, were chosen to capture government-issued documents that set directional priorities for digital development (Wei et al., 2020).
We use three iterative steps in the keyword selection process. First, we
conducted an extensive review of 30+ top-tier articles on government-led digital
transformation, extracting 87 frequently-used terms related to government
initiatives. Second, we consulted two scholars specializing in digital policy and
two industry experts involved in government-enterprise digital collaboration.
Through semistructured interviews, we refined the initial list, eliminating
redundant or ambiguous terms (e.g., “support” was deemed too broad). Finally, a
pilot text analysis was performed on a sample of 20 Chinese local government
annual work reports. We calculated the inter-keyword correlation and
document-level coverage. Terms with low correlation (
(1) TMTs attention allocation (TMTs Attention). The existing research has used text analysis methods to measure the level of TMTs attention. On the basis of the Sapir‒Wolfe hypothesis, the thinking of an individual can be presented through his or her own language. Qualitative materials such as annual reports of listed enterprises, meeting minutes of company management, board reports, speeches of senior managers, emails of senior managers, and industry reports reflect the enterprise’s strategic issues that the TMTs consider important and represent the beliefs in which the TMTs believe. The focus of the TMTs can be reflected by the keywords that appear in qualitative materials such as the annual reports of listed enterprises and board reports, and the frequency of these keywords reflects the degree of attention allocation of the TMTs. This article refers to Cho and Hambrick (2006) and uses Python to conduct text analysis on MD&A sections in the annual reports of sample enterprises from 2012 to 2021 to measure the level of TMTs attention allocation.
The specific steps are as follows. We first download the annual reports of 182
A-share listed medical companies from 2012 to 2021 from the Juchao Information
Network and then merge them with the MD&A sections in the annual reports. We
then use NVivo to perform word segmentation and remove words with a word
frequency less than 100. Third, we perform word meaning analysis with the word
segmentation results and select words that are similar to the concept of digital
transformation. Finally, we measure the degree of TMTs attention allocation by
calculating “(keyword frequency
(2) ROC. ROC, as defined by Sirmon et al. (2007; 2011), involves three interrelated processes: structuring (acquiring/divesting resources), bundling (integrating/developing resources), and leveraging (deploying resources for value creation). The existing studies have adopted two main measurement approaches: (1) Multi-dimensional scales. For example, Wang et al. (2020) developed a 10-item survey scale to measure resource orchestration in green innovation, covering dimensions such as resource reconfiguration and dynamic integration. Cheng et al. (2024) proposed a digital resource orchestration scale for SMEs, including items on data asset management and technology bundling. (2) Process-specific proxies. Hou et al. (2025) used the number of green patent applications as a proxy for green resource absorption capability to reflect the ability to identify and acquire resources, and used the total asset turnover ratio as a measure for green resource allocation capability to reflect the ability to integrate and optimize the resources it has acquired.
In the pharmaceutical industry, GDIs (e.g., subsidies for medical big data platforms, policies promoting telemedicine, and investments in smart hospital infrastructure) provide critical external digital resources and policy signals. Resource orchestration capability here refers to healthcare enterprises’ ability to acquire and internalize these external digital resources (Resource absorption capability) and efficiently deploy them across operational processes (Resource allocation capability), which aligns with Hou et al. (2025)’s logic of integrating “external resource absorption” and “internal resource utilization”.
Consistent with Hou et al. (2025)’s operationalization of GRAC and GRAL, we adopt two indicators to measure the two dimensions of ROC: R&D intensity (proxy for digital resource absorption capability) and total asset turnover ratio (proxy for digital resource allocation capability). In the context of government digital initiatives, pharmaceutical enterprises’ R&D investments primarily target digital technologies aligned with policy priorities, such as AI-based diagnostic algorithms, medical data analytics systems, or EHR integration tools. Higher R&D intensity indicates stronger efforts to absorb external digital resources (e.g., government-subsidized technologies or technical spillovers from public digital platforms) and transform them into internal capabilities, mirroring Hou et al. (2025)’s use of R&D-related metrics to measure GRAC.
Total asset turnover ratio, measured by the ratio of operating income to average total assets, reflects how efficiently healthcare enterprises utilize their total assets—including absorbed digital resources (e.g., AI equipment, cloud servers, or data platforms)—to generate revenue. A higher total asset turnover ratio indicates that absorbed digital resources are effectively deployed across processes (e.g., reducing patient wait times via digital scheduling or increasing service volume via telemedicine), aligning with Hou et al. (2025)’s use of asset utilization metrics to measure GRAL.
To integrate the two indicators into a single, comprehensive measure of ROC, we use the entropy method, which objectively assigns weights based on data variability (avoiding subjective bias).
To exclude the influence of other factors on EDT, this paper introduces a set of control variables, including firm age, firm size, ownership, board size, leverage ratio, and return on assets.
(1) Firm Age. Firms with a shorter time since founding may be more receptive to and apply digital technologies because they may be more flexible and adaptable to changes in organizational structure, culture, and processes. Therefore, this paper uses firm age as a control variable and the difference between the sample selection year and the founding year as a measure of firm age.
(2) Firm Size. Larger firms usually have greater resource investment and richer experience and may be more likely to promote and implement digital transformation than smaller firms. Therefore, this paper uses firm size as a control variable and the natural logarithm of total assets as a measure of firm size.
(3) Ownership. Enterprises with different ownership types may have different attitudes toward digital transformation. This variable is a dummy variable. If the largest shareholder of an enterprise is state-owned, then the measure takes a value of 1 and 0 otherwise.
(4) Board Size. The board of directors plays an important role in the formulation and implementation of corporate strategy. The size of the board of directors can reflect the ability of the enterprise to allocate resources and supervise. This paper uses the number of board members to measure the size of the board of directors.
(5) Leverage Ratio. EDT usually requires a large amount of capital investment. The leverage ratio reflects the financing structure and capital available for the enterprise. Therefore, this paper uses the leverage ratio as a control variable.
(6) Return on Assets (ROA). A higher return on assets indicates that the enterprise can better cope with market competition, reduce costs, and achieve profitability. This paper uses return on assets as a control variable and measures it via the ratio of net profit after tax to total assets.
(7) Provincial GDP per capita (PGDP). As wealthier provinces may both adopt more digital initiatives and foster higher EDT, this paper uses provincial GDP per capita as a control variable. This paper uses the natural logarithm of provincial GDP per capita as a measure of provincial GDP per capita.
To test the five hypotheses, we construct the following econometric models:
(1) Model 1 (Test for H1: Direct effect of GDIs on EDT)
(2) Model 2 (Test for H2: Effect of GDIs on TMTs attention allocation)
(3) Model 3 (Test for H3: Effect of GDIs on ROC)
(4) Model 4 (Test for H4: Mediating role of TMTs attention allocation)
(5) Model 5 (Test for H5: Mediating role of ROC)
where, Controls denote vectors of all control variables
(Controls = {Firm Age, Firm Size, Ownership, Board Size, Leverage
Ratio, ROA, PGDP}),
Table 2 shows the descriptive statistics and correlation matrix of the variables. Furthermore, since the correlation coefficients between all the variables are low and the variance inflation factor (VIF) values of all the variables are below the threshold of 10, there is no serious multicollinearity problem.
| Variables | 1 | 2 | 3 | 4 | 5 | 6 | 7 | 8 | 9 | 10 | 11 |
| GDI | – | ||||||||||
| EDT | 0.143*** | 1.268 | |||||||||
| TMTs Attention | 0.212*** | 0.434*** | 1.314 | ||||||||
| ROC | 0.166*** | –0.023 | 0.128*** | 1.485 | |||||||
| Ownership | –0.080*** | 0.016 | 0.019 | –0.138*** | 1.229 | ||||||
| Board size | –0.017 | –0.003 | 0.049* | –0.203*** | 0.187*** | 1.094 | |||||
| Leverage ratio | 0.012 | 0.145*** | 0.071*** | –0.341*** | 0.304*** | 0.080*** | 1.809 | ||||
| ROA | 0.011 | 0.039 | 0.104*** | 0.036 | –0.140*** | –0.003 | –0.434*** | 1.284 | |||
| Firm size (log) | 0.144*** | 0.258*** | 0.246*** | –0.215*** | 0.246*** | 0.210*** | 0.417*** | –0.008 | 1.616 | ||
| Firm age | 0.331*** | 0.087*** | 0.155*** | –0.024 | 0.197*** | 0.039 | 0.220*** | –0.061** | 0.261*** | 1.119 | |
| PGDP (log) | 0.637*** | 0.219*** | 0.326*** | 0.218** | –0.225** | 0.032 | 0.108* | 0.323* | 0.152* | 0.226** | 1.485 |
| Mean | 0.005 | 3.656 | 0.006 | 0.076 | 0.204 | 8.417 | 0.332 | 0.061 | 21.934 | 18.304 | 11.049 |
| Standard deviation | 0.003 | 1.127 | 0.003 | 0.043 | 0.403 | 1.398 | 0.191 | 0.067 | 1.046 | 5.388 | 0.508 |
| Min. | 0 | 1.099 | 0 | 0 | 0 | 5 | 0.044 | –0.214 | 19.912 | 6 | 9.887 |
| Max. | 0.018 | 6.829 | 0.028 | 0.237 | 1 | 12 | 0.821 | 0.239 | 24.732 | 33 | 12.025 |
Note. *p
Since the dependent variable of EDT and the mediating variables of TMTs
attention allocation and ROC are all continuous variables, fixed and random
effects models can be used. This paper uses the F test and Hausman test to choose
the appropriate panel data regression model (see Table 3). As shown in Table 3,
the Hausman test results originally suggested random effects for EDT and TMTs
attention allocation, but the significant F test (p
| Test type | p value | Results | |
| EDT as the dependent variable | F test | p = 0.000 | FE |
| Hausman test | p = 0.955 | RE | |
| TMTs attention allocation as the dependent variable | F test | p = 0.000 | FE |
| Hausman test | p = 0.549 | RE | |
| ROC as the dependent variable | F test | p = 0.000 | FE |
| Hausman test | p = 0.090 | FE |
Note. FE, Fixed effect; RE, Random Effect.
| Predictor variables | Model 1 (EDT) | Model 2 (TMTs Attention) | Model 3 (ROC) | Model 4 (EDT) | Model 5 (EDT) |
| GDIs | 0.014*** | 0.089*** | 0.651*** | 0.009* | 0.013*** |
| (2.781) | (3.982) | (2.823) | (1.856) | (2.729) | |
| TMTs Attention | 0.060*** | ||||
| (10.978) | |||||
| ROC | 0.012*** | ||||
| (2.823) | |||||
| Ownership | –0.017** | –0.045* | –1.502*** | –0.013* | –0.018** |
| (–2.312) | (–1.645) | (–2.954) | (–1.783) | (–2.401) | |
| Board size | 0.001 | 0.007* | –0.013 | 0.001 | 0.001 |
| (0.985) | (1.256) | (–0.152) | (0.471) | (0.943) | |
| Leverage ratio | 0.015 | –0.060 | –3.485*** | 0.023** | 0.016 |
| (1.382) | (–1.721) | (–4.812) | (2.256) | (1.564) | |
| ROA | 0.040* | 0.195* | –15.932*** | 0.027 | 0.048** |
| (1.856) | (1.824) | (–10.63) | (1.234) | (2.125) | |
| Firm size | 0.013*** | 0.036*** | –0.589*** | 0.010*** | 0.014*** |
| (4.912) | (3.056) | (–3.154) | (3.712) | (5.513) | |
| Firm age | 0.002*** | 0.014*** | 0.233*** | 0.001* | 0.001*** |
| (3.612) | (5.421) | (5.712) | (1.823) | (2.685) | |
| PGDP | 0.173*** | 0.026* | 0.013*** | 0.109*** | 0.126*** |
| (2.885) | (1.792) | (3.014) | (2.857) | (4.216) | |
| Firm Fixed Effects | Yes | Yes | Yes | Yes | Yes |
| Time Fixed Effects | Yes | Yes | Yes | Yes | Yes |
| R-squared | 0.432 | 0.517 | 0.634 | 0.478 | 0.436 |
Note. *p
To test H1, H2, and H3, three models are constructed (see Table 4). The results
of Model 1 show that GDIs have a significantly positive effect on EDT (
This paper conducts robustness checks by replacing the measurement of the dependent variable with alternative regression models and shortened sample period (2015–2021).
Specifically, we use the frequency of keywords as a measurement of EDT. Since
the dependent variable is a nonnegative integer with different means and
variances, this paper chooses the negative binomial panel data regression model
for empirical analysis. We construct Models 1 to 5 to check the robustness (see
Appendix Table 5). As shown in Appendix Table 5, the results of Model 1 show that
GDIs have a significantly positive effect on EDT (
To test whether the results are sensitive to the time window, we restrict the sample to 2015–2021. This period aligns with China’s intensified digital policy initiatives and reduces potential noise from earlier years with less mature digital transformation practices. The results are shown in the Appendix Table 6.
As shown in Appendix Table 6, GDIs remain significantly positively associated
with EDT in the shortened period (2015–2021), with a slightly larger coefficient
(
The results validate that the core findings are not driven by pre-2015 data, when digital policies were less prominent. The stronger coefficients in the shortened sample highlight the increasing effectiveness of government digital initiatives in promoting EDT as policy frameworks matured post-2015. This reinforces the reliability of our conclusion that GDI, mediated by TMTs attention and ROC, is a robust driver of digital transformation in China’s pharmaceutical industry.
Endogeneity arises when the independent variable (GDIs) is correlated with the error term in the regression model, leading to biased estimates. In this study, four key endogeneity concerns are identified: (1) Selection bias. Self-selection bias emerges when firms “choose” to be exposed to GDIs based on unobserved characteristics, leading to non-random treatment assignment. Specifically, firms with stronger resource bases (e.g., larger size, higher ROA) may be more likely to participate in government digital pilots or qualify for subsidies. These same firms are also inherently better positioned to pursue EDT, creating a correlation between GDIs exposure and EDT that reflects pre-existing differences rather than policy effects. (2) Reverse causality. GDIs may not only drive EDT but could also be responsive to EDT. For example, regions with more advanced EDT in pharmaceutical firms may prompt local governments to launch additional digital policies to reinforce industrial advantages (Wang et al., 2023b). This bidirectional relationship violates the exogeneity assumption of GDIs. (3) Omitted variable bias. Unobserved factors (e.g., regional digital infrastructure quality, industry competition intensity, or managerial ability) may simultaneously affect GDIs and EDT. For example, regions with stronger information technology (IT) infrastructure may both attract more GDIs and enable firms to adopt digital technologies more easily, leading to omitted variable bias. (4) Measurement error. Variables such as TMTs attention allocation and ROC are measured via text analysis or weighted integration of R&D intensity and total asset turnover ratio using the entropy method, which may not perfectly capture their theoretical constructs. Measurement error in these mediating variables could bias the estimated coefficients (Chen and Tian, 2022). To address these issues, we employ three complementary methods: Propensity score matching (PSM) analysis, Instrumental variable (IV) regression, and System Generalized Method of Moments (GMM).
(1) PSM. To mitigate selection bias in government initiative allocation, we
performed PSM (Rosenbaum and Rubin, 1983; Dehejia and Wahba, 2002). We
defined treated firms as those with above-median government initiative exposure
and control firms as those below and then estimated propensity scores via a
probit model with the following covariates: Firm Size (Log), Firm Age (Years),
Leverage Ratio, ROA, Board Size, and Ownership (see Appendix Table 7). As shown
in Appendix Table 7, The McFadden R2 of 0.280 and significant Wald test
(p
To ensure that the treatment and control groups become comparable in terms of
observed covariates, a balance test was conducted to evaluate whether this
assumption holds, as imbalance in covariates post-matching implies residual
selection bias that could confound causal inference (Rosenbaum and Rubin, 1983). After matching via a caliper of 0.03 (Rosenbaum and Rubin, 1985; Stuart, 2010), the standardized bias for all covariates decreased by
The PSM results (see Appendix Table 9) show that treated firms have
significantly higher EDT scores than control firms do (average treatment effect
on the treated = 0.477, p
(2) Instrumental variable (IV) regression. We use lagged GDIs (t-1) as the
instrument for current GDIs (t). Lagged GDIs are correlated with current GDIs
(due to policy persistence) but are unlikely to be directly affected by current
EDT, satisfying the relevance and exogeneity conditions (Howell, 2017). The
IV regression results are shown in Appendix Table 10. As shown from Appendix
Table 10, controlling for firm characteristics, the effect of GDIs on EDT remains
significant (
(3) System GMM. We control for all covariates in both the level and difference
equations, using lagged values of GDI and EDT as instruments. The system GMM
results are shown in Appendix Table 11. As shown in Appendix Table 11, dynamic
persistence in EDT (
This study reveals that GDIs significantly promote EDT in pharmaceutical listed companies, with two critical mediators: (1) TMTs attention allocation, government policies redirect managerial focus toward digital issues, creating the cognitive foundation for transformation, and (2) ROC, policy support enhances firms’ ability to structure, bundle, and leverage digital resources (e.g., R&D investments in AI or telemedicine). These mechanisms are robust to endogeneity checks (e.g., PSM, System GMM, and IV regression).
The contributions of this study are threefold. First, by merging the ABV, ROT, and S-O-R framework, this study creates a unified theoretical model. The ABV explains how TMTs selectively attend to GDIs, ROT describes how firms orchestrate resources in response, and the S-O-R framework links these processes to EDT. This integration enriches the theoretical understanding of how environmental stimuli shape organizational transformation (Amit and Han, 2017; Barney et al., 2011).
Second, this study identifies TMTs attention allocation as a key mediating variable. Government initiatives act as external stimuli (S), triggering TMTs to allocate attention to digital issues (O1), which in turn drive EDT (R). This model bridges the gap between macro-level policy effects and micro-level organizational responses (Chen and Tian, 2022).
Third, by treating ROC as a mediator, this research investigates how government initiatives (e.g., digital infrastructure support) enable firms to (1) structure digital resources (e.g., acquire AI technology), (2) bundle resources (e.g., merge government-provided health data with internal systems), and (3) leverage capabilities (e.g., deploy smart diagnostic solutions). This bridges the gap between policy support and EDT by highlighting resource orchestration as the operational mechanism (Amit and Han, 2017; Wang et al., 2023b).
The empirical findings of this study offer actionable insights for both government agencies and TMTs, which can be better illustrated through real-world enterprise practices.
Given that GDIs effectively drive EDT, government agencies should provide infrastructure, policy frameworks, and financial incentives to facilitate enterprise transformation. Singapore’s Government Technology Agency (GovTech) and the Ministry of Health (MOH) collaboratively launched HealthHub in November 2015, a centralized digital health infrastructure, and provided subsidies for healthcare providers to integrate their services into the platform. This initiative reduced the cost and technical barriers for smaller clinics to digitize patient records and offer teleconsultation services. Raffles Medical Group, a leading private healthcare provider, leveraged HealthHub’s infrastructure to orchestrate its internal resources, integrating its patient management system with the platform. As a result, it achieved a 30% reduction in appointment processing time and a 25% increase in patient satisfaction scores (Raffles Medical Annual Report, 2023). The above case shows that governments should develop sector-specific digital platforms (e.g., for healthcare and manufacturing) and offer targeted subsidies, enabling enterprises to focus resources on EDT.
From the perspective of the ABV, TMTs have limited cognitive resources, and external stimuli, such as government digital policies, play a crucial role in shaping their attention allocation. Government policies act as powerful signals that can redefine an enterprise’s strategic agenda. When TMTs perceive these policies as important institutional priorities, they are more likely to allocate resources, time, and cognitive focus towards related strategic actions, which in the context of this study, are actions related to EDT. Therefore, the TMTs of enterprises in all sectors should establish dedicated teams or mechanisms to closely monitor government digital policies. These teams should not only track the release of new policies but also conduct in-depth analyses of their potential impacts on the enterprise’s business model, market opportunities, and competitive landscape. Tencent Health is a case in point. China’s “Internet + Healthcare” policy, introduced in 2018, was a comprehensive regulatory initiative aimed at promoting the digitalization of the healthcare sector. Tencent Health, a subsidiary of the tech giant Tencent, closely monitored the development of the “Internet + Healthcare” policy. The company’s TMTs recognized the significant business opportunities and strategic importance of the policy-driven digital transformation in the healthcare sector. As a result, they initiated a series of strategic actions to align with the policy signals. By aligning its TMTs’ attention with the government’s “Internet + Healthcare” policy signals, Tencent Health achieved remarkable results. By 2023, the company’s telemedicine platform had facilitated 120 million online consultations. This significant increase in service volume was a direct result of the company’s ability to adapt quickly to the policy-created opportunities.
As the government’s digital initiatives affect EDT through the ROC of enterprises, both parties should invest in innovation capabilities and talent cultivation to enhance resource orchestration for EDT. Shanghai’s Digital Health Pilot Program provided 5G infrastructure and R&D grants for public hospitals to adopt smart technologies. In response, Ruijin Hospital’s TMTs formed a cross-departmental digital transformation task force, which orchestrated internal clinical expertise with external tech resources (e.g., partnering with Huawei for AI imaging systems). This collaboration reduced misdiagnosis rates by 22% and increased outpatient service capacity by 35% (Zhu et al., 2023). Governments should establish R&D platforms that encourage resource sharing (e.g., data, talent) between enterprises and research institutions. TMTs, in turn, should prioritize talent training and retention—for instance, by offering specialized digital technology courses and performance-based incentives to attract professionals capable of driving resource orchestration and innovation.
Our findings align with CEE experiences in key ways. Governments in both regions are critical drivers of digital adoption. In Indonesia, for example, state aid stabilized firms during COVID-19, much as China’s subsidies alleviate digital transformation costs (Kurniawan et al., 2023). Both contexts highlight that policy clarity is essential to guide TMTs attention toward digital priorities. However, institutional differences shape outcomes. China’s centralized approach enables coordinated resource allocation (e.g., 5G infrastructure, data platforms) that directly facilitates resource orchestration. In contrast, CEE initiatives, often EU-driven, face challenges of institutional fragmentation and untargeted support, which limit their ability to translate aid into digital adoption (Raimo et al., 2023).
To address the key challenge in CEE where policy intent often fails to translate into digital adoption (Raimo et al., 2023), policymakers should design initiatives that actively shape managerial attention and build capabilities. Unlike untargeted aid, which stabilized Indonesian SMEs financially during COVID-19 but failed to drive digitalization (Kurniawan et al., 2023), subsidies should be structured to require firms to invest in digital capability-building. For instance, 50% of subsidy funds could be released only after TMTs complete certified training in AI applications or data analytics, with the remaining 50% disbursed once employees finish digital skill courses. This conditional framework ensures that resources directly strengthen both the cognitive foundations (TMTs’ attention to digital priorities) and operational capacities (employee digital skills) required for transformation, which aligns with our empirical finding that TMTs’ attention acts as a mediator in the relationship between GDIs and EDT.
To fully leverage government-enabled digital opportunities amid the complex policy landscapes of transitional economies, managers should prioritize building dedicated “policy-attention teams”. Comprising cross-functional members, including policy analysts, digital specialists, and TMTs representatives, these teams should actively monitor EU digital directives (e.g., the Digital Single Market strategy) and local policy updates, translating abstract policy language into concrete, actionable strategies for the firm. For example, a pharmaceutical firm in Romania could empower its policy-attention team to monitor EU “Digital Europe Programme” grants specifically earmarked for AI-driven drug discovery, ensuring the firm submits timely applications aligned with its R&D priorities. This prevents policy signals from being lost amid institutional noise, directly addressing the attention gap identified in our model. Additionally, managers must embed policy alignment into organizational routines to sustain TMTs’ focus on digital transformation. For example, allocating 20% of quarterly TMTs’ meetings to reviewing new government initiatives and their implications, or tying performance bonuses to teams that propose and implement policy-supported digital projects. Such practices counteract managerial myopia by making digital transformation a persistent strategic priority, ensuring consistent progress even amid short-term operational pressures.
This study has several limitations, which need to be further improved upon in future research. First, the sample is restricted to pharmaceutical listed companies, limiting generalizability to non-listed firms or other sectors (e.g., manufacturing). Future work should focus on comparative studies across industries (e.g., healthcare vs. retail) to explore how sectoral traits (e.g., regulation intensity) moderate the policy-EDT relationship. Second, ROC is proxied by the weighted integration of R&D intensity and total asset turnover ratio via the entropy method, which may not perfectly capture the multidimensional characteristics of ROC. Future work should use multi-item scales (e.g., survey data on cross-departmental digital collaboration) to better capture the complexity of ROC. China and CEE are distinct institutional contexts. China’s centralized model emphasizes top-down infrastructure and alignment, whereas CEE economies depend on EU frameworks and face challenges converting government support into adoption. Thus, a third promising avenue is comparative studies between China and CEE, exploring how institutional traits (e.g., state capacity, EU integration) moderate the relationships between government initiatives, TMTs attention, and resource orchestration.
Data used to support the findings of the study are available from the corresponding author upon request.
DL and ZS designed the research study, secured funding, and oversaw the conceptualization, review, and editing processes. DL additionally provided guidance on drafting the original manuscript. LW was responsible for data collection, analysis, and drafting the initial manuscript. FL co-developed the research hypotheses, conducted the endogeneity analysis, and critically revised the Discussion section during the major revision stage. All authors contributed to editorial changes in the manuscript. All authors reviewed and approved the final manuscript. All authors have participated sufficiently in the work and agreed to be accountable for all aspects of the work.
We express our gratitude to the reviewers for their time and effort in delivering constructive comments that have significantly enhanced the manuscript submitted for publication in the JEEMS journal.
This research was funded by the Humanities and Social Science Fund of Ministry of Education of China, grant number 22YJA630040.
The authors declare no conflict of interest.
During the preparation of this work the authors used Deepseek-R1 in order to check spell and grammar. After using this tool, the authors reviewed and edited the content as needed and takes full responsibility for the content of the publication.
| Predictor variables | Model 1 (EDT) | Model 2 (TMTs Attention) | Model 3 (ROC) | Model4 (EDT) | Model 5 (EDT) |
| GDIs | 0.028*** | 0.163*** | 0.279*** | 0.018*** | 0.013*** |
| (3.216) | (4.273) | (2.832) | (3.257) | (2.621) | |
| TMTs Attention | 0.032*** | ||||
| (6.134) | |||||
| ROC | 0.011*** | ||||
| (2.852) | |||||
| Ownership | –0.023* | –0.012 | –0.126 | –0.014* | –0.023* |
| (–1.821) | (–0.664) | (–0.235) | (–1.792) | (–1.894) | |
| Board size | 0.021 | 0.002 | –0.028 | 0.001 | 0.010 |
| (0.769) | (0.634) | (–0.579) | (0.429) | (0.974) | |
| Leverage ratio | 0.036 | –0.032 | –0.946*** | 0.019** | 0.022 |
| (1.573) | (–0.843) | (–3.632) | (1.993) | (1.643) | |
| ROA | 0.017 | 0.076 | –0.937*** | 0.034 | 0.037* |
| (1.282) | (0.643) | (–8.218) | (1.269) | (1.854) | |
| Firm size (log) | 0.023*** | 0.124*** | 0.235 | 0.103*** | 0.129*** |
| (3.632) | (6.294) | (1.263) | (3.668) | (3.252) | |
| Firm age | 0.016*** | 0.022*** | 0.273*** | 0.012* | 0.001* |
| (3.226) | (2.938) | (3.147) | (1.894) | (1.87) | |
| PGDP (log) | 0.254*** | 0.013*** | 0.011** | 0.015*** | 0.022*** |
| (4.812) | (2.185) | (1.912) | (2.237) | (3.781) | |
| Firm Fixed Effects | Yes | Yes | Yes | Yes | Yes |
| Time Fixed Effects | Yes | Yes | Yes | Yes | Yes |
Note. *p
| Predictor variables | Model 1 (EDT) | Model 2 (TMTs Attention) | Model 3 (ROC) | Model 4 (EDT) | Model 5 (EDT) |
| GDIs | 0.015*** | 0.093*** | 0.072*** | 0.010** | 0.014*** |
| (3.891) | (4.272) | (3.645) | (2.213) | (3.763) | |
| TMTs Attention | 0.062*** | ||||
| (12.145) | |||||
| ROC | 0.023*** | ||||
| (3.693) | |||||
| Ownership | –0.018*** | –0.046* | –1.518*** | –0.014* | –0.019** |
| (–2.366) | (–1.692) | (–2.981) | (–1.814) | (–2.413) | |
| Board size | 0.001 | 0.007* | –0.014 | 0.001 | 0.001 |
| (0.919) | (1.796) | (–0.126) | (0.418) | (0.935) | |
| Leverage ratio | 0.016 | –0.061* | –3.493*** | 0.024*** | 0.017 |
| (1.329) | (–1.743) | (–4.823) | (2.278) | (1.158) | |
| ROA | 0.042* | 0.197* | –15.96*** | 0.028 | 0.049** |
| (–1.828) | (–1.834) | (–10.636) | (1.275) | (2.115) | |
| Firm size | 0.014*** | 0.037*** | –0.591*** | 0.011*** | 0.015*** |
| (4.923) | (3.017) | (–3.196) | (3.753) | (5.543) | |
| Firm age | 0.002*** | 0.015*** | 0.234*** | 0.002* | 0.002*** |
| (3.653) | (5.449) | (5.712) | (–1.893) | (2.699) | |
| PGDP | 0.176*** | 0.027* | 0.014*** | 0.111*** | 0.128*** |
| (2.912) | (–1.801) | (3.029) | (2.872) | (4.253) | |
| Firm Fixed Effects | Yes | Yes | Yes | Yes | Yes |
| Time Fixed Effects | Yes | Yes | Yes | Yes | Yes |
| R-squared | 0.439 | 0.525 | 0.640 | 0.488 | 0.442 |
Note: *p
| Variables | Coefficients | S.E. | p-value |
| Firm size (Log) | 0.232*** | 0.078 | |
| Firm age (Years) | –0.154 | 0.182 | |
| Leverage ratio | –0.324*** | 0.113 | |
| ROA | 0.448*** | 0.134 | |
| Board size | 0.003 | 0.032 | |
| Ownership | 0.282*** | 0.103 | |
| Constant | –4.122*** | 0.752 |
Pseudo R2 (McFadden): 0.280, Log Likelihood: –112.561, Wald Chi-Square: 58.732*** (df = 5).
Note: ***p
| Covariate | Pre-Matching standardized bias (%) | Post-Matching standardized bias (%) | Bias reduction rate (%) | Balance test p-value |
| Firm size (Log) | 32.911 | 2.742 | 91.668 | 0.271 |
| Firm age (Years) | 28.462 | 2.386 | 91.617 | 0.314 |
| Leverage | 25.635 | 1.824 | 92.885 | 0.429 |
| ROA | 22.384 | 2.082 | 90.699 | 0.295 |
| Board size | 30.122 | 2.667 | 91.146 | 0.355 |
| Ownership | 18.247 | 1.358 | 92.558 | 0.293 |
| Average bias reduction | - | - | 91.762 | - |
| Variable | Treatment group (n = 106) | Matched control group (n = 76) | ATE on treated | t-value | p-value |
| EDT score | 3.771 | 3.294 | 0.477 | 3.216 | |
| Firm size (Log) | 21.352 | 21.336 | 0.016 | 0.147 | 0.892 |
| Firm age (Years) | 22.437 | 21.918 | 0.519 | 1.115 | 0.191 |
| Leverage | 0.374 | 0.323 | 0.051 | 0.034 | 0.598 |
| ROA | 0.078 | 0.067 | 0.011 | 3.228 | |
| Board size | 8.722 | 8.167 | 0.555 | 1.032 | 0.284 |
| Ownership | 0.247 | 0.225 | 0.022 | 1.986 |
| Predictor variables | First stage (GDIs) | Second stage (EDT) | Second stage (EDT with mediators) |
| Lagged GDIs (t-1) | 0.782*** (0.041) | - | - |
| Predicted GDIs | - | 0.015*** (0.004) | 0.009** (0.003) |
| TMTs Attention | - | - | 0.058*** (0.006) |
| ROC | - | - | 0.012*** (0.001) |
| Ownership | –0.032*** (0.009) | –0.017** (0.008) | –0.013* (0.007) |
| Board size | 0.002** (0.001) | 0.001 (0.001) | 0.001 (0.001) |
| Leverage ratio | –0.045** (0.018) | 0.015 (0.013) | 0.024** (0.012) |
| ROA | 0.123** (0.049) | 0.040* (0.021) | 0.027 (0.020) |
| Firm size (log) | 0.028*** (0.005) | 0.013*** (0.004) | 0.010*** (0.003) |
| Firm age | 0.003*** (0.001) | 0.002*** (0.001) | 0.001* (0.001) |
| PGDP (log) | 0.136*** (0.029) | 0.047*** (0.011) | 0.032*** (0.012) |
| Firm Fixed Effects | Yes | Yes | Yes |
| Time Fixed Effects | Yes | Yes | Yes |
| Observations | 1638 | 1638 | 1638 |
| R-squared | 0.527 | 0.412 | 0.468 |
| First Stage F-Statistic | 372.651*** | - | - |
Note: Standard errors in parentheses; *p
| Predictor variables | Dependent variable: EDT | Dependent variable: TMTs Attention | Dependent variable: ROC |
| Lagged EDT (t-1) | 0.321*** (0.052) | - | - |
| GDIs | 0.014*** (0.003) | 0.086*** (0.012) | 0.645*** (0.078) |
| TMTs Attention | 0.057*** (0.005) | - | - |
| ROC | 0.001** (0.000) | - | - |
| Ownership | –0.011 (0.007) | –0.034** (0.013) | –1.492*** (0.271) |
| Board size | 0.000 (0.000) | 0.006** (0.003) | –0.012 (0.063) |
| Leverage ratio | 0.008 (0.010) | –0.052** (0.020) | –3.481*** (0.427) |
| ROA | 0.012 (0.015) | 0.183** (0.073) | –15.918*** (1.824) |
| Firm size (log) | 0.008** (0.003) | 0.035*** (0.006) | –0.587*** (0.128) |
| Firm age | 0.001** (0.000) | 0.013*** (0.002) | 0.232*** (0.046) |
| PGDP (log) | 0.182***(0.021) | 0.026*** (0.011) | 0.126*** (0.032) |
| Sargan Test p-value | 0.278 | 0.312 | 0.296 |
| Observations | 1638 | 1638 | 1638 |
Note: Standard errors in parentheses; **p
References
Publisher’s Note: IMR Press stays neutral with regard to jurisdictional claims in published maps and institutional affiliations.