


 , Dandan Li 2, Souha Balti 3, Sui Sui 4,*
1 School of Finance, Dongbei University of Finance and Economics, 116025 Dalian, Liaoning, China
2 International Business College, Dongbei University of Finance and Economics, 116025 Dalian, Liaoning, China
3 Department of Accounting, HEC Montreal, Montréal, QC H3T 2A7, Canada
4 Global Management Studies Department, Ted Rogers School of Management, Toronto Metropolitan University (formerly Ryerson University), Toronto, ON M5G 2K3, Canada
Abstract
This study examines how green credit policies (GCP) influence corporate social responsibility (CSR) in pollution-intensive firms in China, using China’s 2012 “Green Credit Guidelines” as a quasi-natural experiment. Through a difference-in-differences (DID) model analyzing 3627 publicly listed Chinese companies from 2010 to 2020, we identify key challenges in aligning financial incentives with environmental goals. Our findings reveal that financial constraints and differences in total factor productivity (TFP) may limit the effectiveness of GCP in promoting CSR initiatives among highly polluting firms. However, this inhibitory effect decreases once TFP surpasses a threshold, suggesting that greater productivity can mitigate these disincentives. Interestingly, we find that GCP have a negative impact on CSR in highly polluting firms, underscoring the need for more refined green credit policies to encourage sustainable corporate practices. These insights have significant implications for transition economies facing similar environmental challenges and contribute to broader global sustainability strategies.
Graphical Abstract
Keywords
- corporate social responsibility
- green credit policy
- heavily-polluting industries
- financial constraints
- total factor productivity
In recent decades, scholars and policymakers have increasingly acknowledged sustainable development as essential for addressing the environmental, economic, and social challenges of modern society. Researchers have emphasized the need to transition from traditional development models, which prioritize short-term economic growth, to more sustainable approaches that balance ecological, social, and financial objectives (Baumgartner, 2014). Within this broad context, green finance has emerged as a key tool for promoting sustainable practices among firms, including mechanisms such as green credit policies (GCPs) that incentivize environmentally responsible into their operations (Lee et al., 2023). A notable example is China’s adoption of green finance policies, particularly its 2012 Green Credit Guidelines, which limit bank loans to heavily-polluting enterprises. The Green Credit Guidelines were a top-down government measure with timing and scope determined externally in 2012. This policy provides a valuable case study for examining how financial tools can drive environmental change in high-pollution industries.
Despite these advances, significant controversy remains over the effectiveness of green credit policies, particularly in emerging markets such as China (Meng et al., 2025; Zhang et al., 2024). Some studies highlight the positive role of the Green Credit Policy (GCP) in improving firms’ environmental performance. Scholars argue that by channeling financial resources toward low-carbon sectors, the policy enhances corporate green investment and environmental governance capacity, thereby contributing to industrial upgrading and the transition toward a greener economy (Lin et al., 2025). Other research, however, underscores several challenges in the implementation of China’s GCP, including weak enforcement, limited regulatory mechanisms, and heavy reliance on self-reported data (Guo et al., 2025), all of which risk distorting or overstating actual environmental practices. Moreover, although GCP is an essential instrument for addressing environmental challenges, its effectiveness often hinges on broader institutional and market conditions. In China, rapid economic growth has sustained reliance on high-pollution industries, while uneven regulatory enforcement across regions further complicates policy implementation. For instance, in eastern regions where the financial system is more developed and green industries are better established, firms are more likely to benefit from GCP (Guo et al., 2023). In contrast, firms in central and western regions often face limited financial resources and industrial structures dominated by heavy industries, making access to green financing more difficult and resulting in regionally uneven policy outcomes (Zhou and Xu, 2022).
With respect to the impact of green credit on corporate social responsibility (CSR), the literature remains divided. Although the policy is designed to enhance CSR by encouraging firms to adopt environmentally friendly practices, scholars have reached differing conclusions about its effectiveness (He et al., 2019). Some argue that green credit policies strengthen CSR performance by providing financial incentives for firms to increase environmental investment, thereby improving their overall responsibility profiles (Xu and Lin, 2025). Others contend that, particularly for heavily-polluting enterprises, such policies may impose additional financial burdens. These firms are often economically reliant on pollution-intensive production models, and the costs of transitioning to greener practices are high while the short-term financial returns are limited (Leong and Yang, 2021). As a result, the financial constraints induced by green credit may crowd out environmental investment and, in turn, weaken CSR engagement.
Addressing this complexity is essential to achieving the core objectives of sustainable development. If green credit policies inadvertently limit firms’ ability to engage in CSR due to heightened financial constraints, they could undermine broader goals of environmental governance. Heavily-polluting firms already face significant pressure to reduce their environmental footprint, and restricting their access to finance could further hinder their ability to adopt CSR initiatives, which encompass both ecological and social dimensions. Given these firms’ critical roles in global supply chains, their constrained ability to contribute meaningfully to sustainability goals could have widespread implications (Chan et al., 2017). Therefore, it is crucial to understand mediating mechanisms such as financial constraints and total factor productivity (TFP) in order to refine policy and ensure that financial tools like GCPs can advance environmental and social objectives.
Meanwhile, transition economies in Eastern Europe have also begun leveraging sustainable finance policies to drive corporate environmental behavior within evolving institutional frameworks. For example, banks in countries like Poland are introducing green credit offerings to support clean energy investments, indicating an emerging alignment of financial systems with sustainability goals (Pyka and Nocoń, 2021). Research on Polish and Romanian banking sectors reveals a quick advancement towards “greening” financial products and services, reflecting broad commitments to sustainability (Siemionek-Ruskań and Fanea-Ivanovici, 2023). These East European contexts provide a comparative framework where lessons from China’s GCP implementation can inform sustainable finance strategies amid post-socialist institutional change.
In this study, we investigate the research question: How does China’s Green Credit Policy (GCP), as an exogenous regulatory intervention, affect the CSR performance of heavily-polluting firms, and what mechanisms mediate this relationship? Previous research has mainly explored the overall impact of green credit policies on firm behavior or focused on firms with relatively strong environmental performance (Zhou and Xu, 2022). Moreover, many of these studies rely on self-constructed or modified CSR proxies, which may introduce measurement bias (Chatterji et al., 2016; Berg et al., 2022; Li et al., 2022). Our study explicitly focuses on heavily-polluting firms, and uses authoritative CSR ratings from the Hexun database. Using the 2012 Green Credit Guidelines as a quasi-natural experiment, we apply a difference-in-differences (DID) methodology to analyze a dataset of 3627 firms spanning a decade (2010–2020). This approach controls for confounding variables and isolates the effect of GCP on CSR performance. Additionally, existing studies typically examine individual mediating mechanisms, such as financial constraints or innovation incentives (Hu et al., 2021). We employ a double mediation model to examine the roles of financial constraints and TFP in this relationship. To ensure robustness, we perform additional tests, including propensity score matching (PSM), placebo tests, and time trend analyses. The study also explores the moderating effects of state ownership, local green financial development, and industry concentration on the GCP-CSR nexus in order to evaluate the policy’s impact thoroughly.
This paper contributes to the literature on green finance and CSR in several ways. First, it provides empirical insights from China’s green credit policies, which can be utilized by other emerging economies facing similar environmental and financial challenges. Second, this study enhances our understanding of how mechanisms such as GCPs influence CSR by introducing financial constraints and TFP as double mediators. While prior studies have often focused on single mediators, this research highlights the multifaceted responses of firms to green policy. Third, adopting a threshold regression model to capture the nonlinear effects of GCP on CSR is also a novel contribution, demonstrating how firms at different stages of development respond variably to green finance policies. Lastly, the findings emphasize the need for policymakers to refine GCPs to better align financial incentives with CSR outcomes, especially in economically lagging regions.
The remainder of this paper is structured as follows. Section 2 reviews the literature and presents the research hypotheses. Section 3 outlines the data and empirical model. Section 4 provides the empirical analysis. Section 5 discusses the results. Section 6 outlines contributions and implications and Section 7 concludes.
China’s green credit policy originated with the 1995 “Circular on Issues Related to the Implementation of Credit Policy and Strengthening of Environmental Protection” issued by the People’s Bank of China (PBOC). However, these early efforts failed to garner sufficient attention, as economic growth took precedence over environmental concerns at the time (Zhang et al., 2023). A significant development occurred in 2007 when the former State Environmental Protection Administration (SEPA), PBOC, and former China Banking Regulatory Commission (CBRC) (The China Banking Regulatory Commission was established in 2003. In 2018, the China Banking Regulatory Commission and the China Insurance Regulatory Commission merged to form the China Banking and Insurance Regulatory Commission. In 2023, the National Financial Regulatory Administration was established on the basis of the China Banking and Insurance Regulatory Commission.) issued documents requiring commercial banks to support green production initiatives, marking the formal establishment of China’s green credit policy. Despite this, the policy still lacked strong enforcement and adequate support measures during this period (Zhang et al., 2021). In 2012, the CBRC issued the “Green Credit Guidelines”, which provided comprehensive directives for financial institutions, outlining specific supervisory roles in six areas, including management, policy systems, and information disclosure. This marked a significant milestone in formalizing China’s green credit practices (Liu et al., 2019).
For firms, green credit policies impose financing penalties on highly polluting companies, negatively affecting their debt financing (Song et al., 2021). Some studies suggest that green credit influences investment decisions and environmental performance, incentivizing firms to relocate polluting activities to avoid financial constraints, which results in no overall improvement in their environmental performance (Bartram et al., 2022). The impact on economic performance is debated. Some scholars argue that GCP restricts productive operations, although technological innovation can offset this through the Porter effect (Chen et al., 2022). However, there is no consensus on the Porter effect’s existence under the green credit policy (Egger et al., 2021).
The relationship between CSR and firm performance remains contested in the literature (Afrin and Rahman, 2024; Lopatta et al., 2024). Some argue that CSR enhances profitability and firm value by improving reputation, attracting investors, mitigating conflicts between shareholders and stakeholders and fostering innovation, encapsulated in the concept of “doing well by doing good” (Tetrault Sirsly and Lvina, 2019). However, the impact of CSR on company performance is not always positive. Some suggest that only firms with strong financial performance can afford CSR initiatives, which is referred to as “doing good by doing well” (Lopatta et al., 2024). Implementing CSR activities typically involves increased costs, such as environmental measures, charitable donations, and employee benefits, which may directly reduce short-term profits. Financial constraint theory suggests that companies may need to sacrifice other business activities to maintain CSR initiatives, leading to imbalanced resource allocation and thereby affecting short-term performance (Attig, 2024). Additionally, some studies indicate that management may use CSR as a tool for personal prestige or political gain rather than focusing on improving company performance (Gupta et al., 2021; Petrenko et al., 2016; Wang and Qian, 2011). Agency theory points out that there may be conflicts of interest between management and shareholders, with management potentially pursuing personal interests rather than company interests, leading to inefficient or ineffective implementation of CSR initiatives (Dmytriyev et al., 2021). Furthermore, CSR may conflict with the goal of maximizing shareholder value, especially when CSR projects do not yield direct profit returns, which may weaken shareholders’ financial returns and thus affect shareholder support and company market performance (Battilana et al., 2022). Overcommitting to CSR activities may also lead to overly high expectations from the market and customers. If the company fails to fulfill its commitments, it may face a trust crisis, affecting brand value and market performance.
Green credit policy, as an environmental policy tool, aims to channel financial resources toward environmentally friendly and sustainable projects, thereby promoting corporate environmental governance and corporate social responsibility. However, despite the original intent of green credit policy to encourage CSR, in some cases, the policy may inadvertently suppress corporate social responsibility performance. This phenomenon can be analyzed from multiple theoretical perspectives.
First, from the perspective of the resource dependence theory, a firm’s access to and allocation of resources heavily depend on the external environment, particularly financial resources (Chi et al., 2025). Green credit policies typically require firms to meet specific environmental standards and criteria when obtaining loans, which may lead to financial constraints for some firms. Firms with high capital needs that do not meet green credit criteria may redirect more resources toward complying with green finance requirements, thereby neglecting other aspects of CSR, such as employee welfare, social welfare, and corporate governance (Liu and He, 2021). Therefore, to secure loan support, firms may prioritize environmental compliance as their sole focus, sacrificing other dimensions of CSR.
Second, from the viewpoint of the stakeholder theory, green credit policies strengthen the monitoring of corporate environmental behavior by banks and financial institutions (Mahajan et al., 2023). However, in certain cases, firms may focus on short-term investments in environmental performance to obtain loans or avoid penalties, rather than fulfilling CSR obligations from a long-term perspective. This phenomenon is particularly evident in firms under financial pressure or those with tight profit margins (Almeida et al., 2024). These firms may view environmental compliance as the minimum requirement for dealing with financial regulation while neglecting other areas of CSR, such as labor rights protection and consumer rights. Thus, while green credit policies may lead firms to take action in the environmental domain, they may result in a narrow focus on environmental issues, overlooking broader CSR responsibilities.
Third, from the perspective of the agency theory, management may, due to external pressure from green credit policies, engage in short-term actions to meet the criteria of green credit, even if these actions are not part of the firm’s long-term strategy (Al-Faryan, 2024). In such cases, management may treat environmental projects as short-term signaling tools rather than long-term CSR commitments. This signaling behavior may lead to insufficient investment in other CSR areas, particularly when these areas are not directly addressed by green credit policies.
Finally, the implementation of green credit policy also increases compliance costs, especially for firms that are not competitive in the environmental field (Xu and Li, 2020). Financially constrained firms are more likely to prioritize short-term survival over long-term CSR investments since they are inclined to view social responsibility initiatives as discretionary when resources become scarce (Leong and Yang, 2021). In such cases, reduced investment in CSR can enable firms to allocate scarce funds to immediate operational needs, ensuring their survival in the marketplace. These firms may invest heavily in environmental compliance in the short term to meet policy requirements, but due to resource constraints, they may reduce their investments in other CSR areas, creating resource allocation conflict. This conflict may lead to a shift in priorities when fulfilling CSR, ultimately suppressing their performance in other CSR domains. Based on these insights, we propose the following hypothesis:
Hypothesis 1: The implementation of GCP exerts a negative direct effect on the CSR performance of heavily-polluting firm.
The institutional theory suggests that external pressures, such as regulatory mandates, shape firm behavior (Lewis et al., 2019). In post-socialist economies, institutional transitions have also influenced CSR adoption. For instance, East European firms’ responsible practices reflect both legacy constraints and new normative pressures (Koleva et al., 2010). In China, GCP serves as a regulatory tool that incentivizes heavily-polluting firms to align their resource allocation strategies with environmental regulations. By restricting financing for high-polluting firms, GCP encourages funding for environmentally compliant initiatives that support cleaner production and sustainability. However, this policy significantly constrains firms’ financial and strategic decision-making.
GCP amplifies financial pressures on heavily-polluting firms by increasing financing thresholds and costs. As a result, banks prioritize credit to green-compliant firms, which leaves high-polluting firms with limited external funding and reduced capital liquidity (Lei et al., 2023). Resource dependence theory highlights how this scarcity of external resources forces firms to reallocate funds toward meeting environmental compliance requirements to avoid penalties or further financing restrictions (Lin and Pan, 2024).
These financial constraints have cascading effects on firms’ total factor productivity (TFP). While stricter financing conditions push firms to optimize internal resource usage, GCP-mandated investments in green technologies and emission reduction projects often divert resources away from productivity-enhancing activities (Zhao et al., 2022). This reallocation causes a crowding-out effect, which reduces the marginal productivity of assets and negatively impacts TFP (Heil, 2019).
The decline in TFP, coupled with financial constraints, further weakens firms’ ability to meet their CSR commitments. With limited resources, firms are forced to prioritize short-term operational needs over long-term CSR goals. Time preference theory explains this behavior, by suggesting that firms favor investments with immediate returns, often at the expense of CSR initiatives (Cohen et al., 2020). As a result, heavily-polluting firms may scale back or delay CSR expenditures, viewing them as non-essential under constrained capital conditions.
In summary, GCP disrupts firms’ resource allocation by tightening financial constraints, which in turn reduces TFP and weakens CSR performance. This double mediation channel illustrates how GCP simultaneously influences firms’ financial and operational decisions and, ultimately, restricts their social and environmental contributions. Fig. 1 illustrates the theoretical framework of the mediating effect. From this theoretical foundation, we formulate the following hypothesis:
 Fig. 1.
Theoretical framework diagram of the mediating effect. CSR, corporate social responsibility.
Hypothesis 2: Financial constraints mediate the effect of GCP on CSR. Specifically, the implementation of GCP increases financial constraints, which negatively affect TFP. The reduction in TFP, together with the increased financial constraints, ultimately leads to a decline in CSR performance.
Given the unique ownership structures of Chinese firms, the variability in regional green financial development, and the diversity of industry structures, this study examines firm ownership (SOE), the regional green economic development index (GREEN), and industry concentration (HHI) as moderators of the GCP–CSR relationship.
State-owned enterprises (SOEs) are a dominant organizational form in China. They benefit from low capital costs due to preferential access to loans and government subsidies, which insulates them from market discipline and makes them less responsive to environmental accountability measures. SOEs also pursue objectives beyond profitability, such as social stability, employment maintenance, and regional development (Xu and Li, 2020). Under the GCP, heavily-polluting SOEs may neglect environmental standards in favor of fulfilling other government objectives. This is consistent with the theory of institutional multiplicity, which suggests that firms facing competing institutional logics may engage in symbolic rather than substantive CSR (Brammer et al., 2012). Moreover, SOEs tend to have lower managerial autonomy and weaker stakeholder pressure compared to private firms. In the absence of strong accountability from shareholders or capital markets, their CSR practices are often compliance-oriented and reactive, making them more vulnerable to suppression when GCP imposes regulatory or reputational risks that they do not perceive as financially consequential. These financial advantages may also reduce their incentives to voluntarily expand CSR engagement.
Regional disparities in green finance development further shape how firms respond to GCP. In regions with well-developed green finance systems, resources are primarily directed toward firms with strong environmental performance (Gao et al., 2023). This allocation can restrict financing for heavily-polluting firms, suppressing their ability to invest in CSR. Such firms face higher financing costs and capital shortages, which weaken their competitiveness and may crowd out CSR (Ragazou et al., 2025). In contrast, firms in weaker financial systems may find ways to bypass institutional constraints, but this can exacerbate symbolic CSR responses. Local variation in green finance also affects market perceptions of the “green firm” label. In regions with robust financial systems, lenders and stakeholders impose stronger “green reputation” pressures (Khalid et al., 2024). High-polluting firms may respond outwardly to these pressures, yet given the gap between their current production models and green transformation, they often resort to symbolic rather than substantive CSR.
Industry concentration likewise influences CSR engagement. Resource dependence theory suggests that firms in highly concentrated industries may be less responsive to external demands because they control critical resources (Zhu et al., 2025). Dominant firms often possess greater bargaining power in negotiating debt covenants and may secure favorable terms despite green credit restrictions, thereby weakening policy incentives to improve CSR (Claver-Cortés et al., 2019). Reduced competition further lowers incentives to adopt substantive CSR. Moreover, firms in concentrated industries are more likely to leverage their market power to resist external pressures, opting for incremental rather than large-scale environmental investments (Kok and Ligthart, 2014). Consequently, heavily-polluting firms in highly concentrated industries may adopt a slower CSR approach under GCP, delaying substantive green transformation.
On this basis, we propose the following hypotheses:
Hypothesis 3a: State ownership strengthens the negative relationship between GCP and CSR of heavily-polluting firms.
Hypothesis 3b: Higher levels of regional green financial development strengthen the negative relationship between GCP and CSR of heavily-polluting firms.
Hypothesis 3c: Higher industry concentration strengthens the negative relationship between GCP and CSR of heavily-polluting firms.
To evaluate the impact of China’s 2012 Green Credit Policy (GCP) on CSR performance, we employed a difference-in-differences (DID) model using data from Chinese listed firms between 2010 and 2020. The data were sourced from the China Stock Market and Accounting Research (CSMAR) and Hexun databases. To ensure data integrity and alignment with the study’s objectives, we refined the sample through the following steps in line with Lin and Pan (2024): (1) Exclusions: Financial companies, Special Treatment (ST) and Particular Transfer (PT) companies were excluded. In the Chinese context, ST firms are publicly listed companies flagged by stock exchanges for financial instability or operational challenges, while PT firms face even more severe financial or operational issues. (2) Data Completeness: Firms with missing data were removed from the sample. The distribution of the top 20 industries by proportion after excluding financial, ST, and PT companies is shown in Appendix Table 8. Appendix Table 9 reports the ratio of the total value and average of total assets and total revenue in the sample after excluding certain observations, compared to the corresponding metrics before the exclusion, to assess whether the remaining sample still represents the overall population. (3) Outlier Mitigation: All continuous variables were winsorized at the 1% and 99% levels to reduce the influence of extreme outliers. The final dataset consists of 28,001 observations from 3627 listed firms, including 891 heavily-polluting and 2736 non-heavily-polluting firms.
To evaluate the policy’s impact on the CSR performance of heavy-polluting firms, we adopt a DID specification. The treatment group consists of firms in heavily-polluting industries, while the control group comprises all other firms. Appendix Table 10 provides detailed information on the classification standards for heavily-polluting industries (per Chinese regulatory definitions). Our baseline model is specified in Eqn. 1.
Where
Dependent variable: Following Ouyang et al. (2024), this study uses CSR indicators from the Hexun database as the dependent variable. A higher CSR score indicates a higher level of CSR performance of the firm. Appendix Table 11 details the structure of the CSR performance measure.
Independent variables: Following Ma et al. (2025), treat is a dummy variable that equals 1 if the firm operates in a heavy polluting industry and 0 otherwise. post is a dummy variable representing the pre- and post-GCP periods, equaling 1 for years 2013 and onwards and 0 otherwise.
Control variables: Consistent with prior research (Al-Shammari et al., 2023), several firm-level control variables are incorporated to account for potential confounding effects. These include firm size (Size), leverage ratio (Lev), return on equity (Roe), book-to-market ratio (Bm), net profit margin (Net), accounts receivable ratio (Rec), inventory ratio (Inv), and fixed assets ratio (Fix).
Mediating variables: This study uses corporate financial constraints (WW) and firms’ total factor productivity (TFP) as mediators. The measurement of corporate financial constraints is based on the index developed by Whited and Wu (2006), which captures the degree of financial limitations faced by firms. For TFP, we adopt the methodology proposed by Levinsohn and Petrin (2003). Detailed procedures for constructing WW and TFP are provided in Appendix D and Eqns. 7,8,9.
Moderating variables: Firm ownership, regional green economic development, and industry concentration are included as moderating variables. Firm ownership (SOE) is a binary variable, set to one for state-owned enterprises and zero otherwise. Drawing on Lin and Zhou (2022), the regional green economic development index (GREEN) is constructed from seven key aspects, including green credit, green insurance, and green investment. These aspects comprehensively reflect regional green financial development and are outlined in Appendix Table 12. Additionally, industry concentration is measured using the Herfindahl-Hirschman Index (HHI), which represents the revenue share of a firm relative to its industry, as defined by Bessen (2017). The precise definitions and measurement details of all variables are summarized in Table 1.
| Variables | Definition | Data source |
| CSR | Rating of corporate social responsibility performance | Hexun |
| treat | The value for heavily-polluting firms is 1, and for non-heavily-polluting firms is 0 | Authors’ coding based on 2012 Green Credit Guidelines |
| post | The value of the sample is 1 in 2013, and later, otherwise 0 | The National Financial Regulatory Administration |
| treat |
The interaction term between green credit policy and the nature of firms | |
| Size | Natural logarithm of total assets | CSMAR |
| Lev | Total liabilities/total assets | CSMAR |
| Roe | Net profit/average net asset | CSMAR |
| Bm | (Total assets - total liabilities)/market capitalization | CSMAR |
| Net | Net profit/sale revenue | CSMAR |
| Rec | Accounts receivable/current assets | CSMAR |
| Inv | Inventory value/total assets | CSMAR |
| Fix | Fixed assets/total assets | CSMAR |
| WW | Weighted using financial indicators | CSMAR |
| TFP | Calculated by the LP method | CSMAR |
| SOE | State-owned firms | CSMAR |
| HHI | Market concentration rate | CSMAR |
| GREEN | The green financial development index | CSMAR |
Note: LP, Levinsohn and Petrin; CSMAR, China Stock Market and Accounting Research.
Table 2A,2B,2C summarizes the key variables, comparing treatment (heavily-polluting firms) and control groups. The treatment group exhibits distinct characteristics in the pre-policy period: on average, they have higher leverage (mean leverage 43.4% vs. 40.8% for controls), slightly lower profitability (mean ROE 6.3% vs. 7.1%), and notably lower mean CSR scores (0.296 vs. 0.303). These differences reflect the nature of heavy-polluting industries—they tend to be capital-intensive with higher debt and historically less CSR engagement. Importantly, the parallel trends assumption appears to hold: Fig. 2 (the dynamic CSR trend plot) shows that CSR trajectories for treated and control firms were similar prior to 2012, diverging only after the policy. Correlation coefficients of Table 2B indicate no multicollinearity concerns, as all values are below 0.5. Furthermore, Table 2C displays the variance inflation factor (VIF) values, which range from 1 to 3, confirming that multicollinearity does not pose a problem for our analysis (Bouchmel et al., 2024).
 Fig. 2.
Dynamic effects of the Green Credit Policy (GCP) on CSR. Note: 2012 is used as the baseline year (t = 0); all reported estimates are relative to this reference.
| Treatment firms | Control firms | |||||||
| N | Mean | Median | S.D. | N | Mean | Median | S.D. | |
| treati |
891 | 0.859 | 1.000 | 0.348 | 2736 | 0.000 | 0.000 | 0.000 |
| CSR | 891 | 0.296 | 0.303 | 0.072 | 2736 | 0.303 | 0.312 | 0.069 |
| Size | 891 | 22.242 | 22.066 | 1.206 | 2736 | 22.050 | 21.901 | 1.122 |
| Lev | 891 | 0.434 | 0.437 | 0.192 | 2736 | 0.408 | 0.398 | 0.195 |
| Roe | 891 | 0.063 | 0.060 | 0.080 | 2736 | 0.071 | 0.069 | 0.078 |
| Bm | 891 | 0.648 | 0.669 | 0.247 | 2736 | 0.585 | 0.592 | 0.245 |
| Net | 891 | 0.068 | 0.059 | 0.091 | 2736 | 0.092 | 0.080 | 0.102 |
| Rec | 891 | 0.086 | 0.064 | 0.076 | 2736 | 0.124 | 0.111 | 0.094 |
| Inv | 891 | 0.113 | 0.094 | 0.087 | 2736 | 0.139 | 0.113 | 0.117 |
| Fix | 891 | 0.306 | 0.293 | 0.148 | 2736 | 0.175 | 0.148 | 0.130 |
| SOE | 891 | 0.438 | 0.000 | 0.496 | 2736 | 0.328 | 0.000 | 0.470 |
| HHI | 879 | 0.103 | 0.080 | 0.089 | 2730 | 0.140 | 0.090 | 0.131 |
| GREEN | 891 | 0.164 | 0.136 | 0.073 | 2736 | 0.188 | 0.152 | 0.086 |
| WW | 891 | 0.094 | 0.101 | 0.029 | 2736 | 0.084 | 0.100 | 0.039 |
| TFP | 891 | 0.111 | 0.114 | 0.079 | 2736 | 0.106 | 0.100 | 0.078 |
Note: This table provides descriptive statistics of the variables used to test the hypotheses. N is the number of samples, S.D. is the standard deviation.
| (1) | (2) | (3) | (4) | (5) | (6) | (7) | (8) | (9) | (10) | ||
| (1) | CSR | 1 | |||||||||
| (2) | Size | 0.198*** | 1 | ||||||||
| (3) | Lev | –0.002 | 0.512*** | 1 | |||||||
| (4) | Roe | 0.396*** | 0.145*** | –0.022*** | 1 | ||||||
| (5) | Bm | 0.055*** | 0.457*** | 0.344*** | –0.098*** | 1 | |||||
| (6) | Net | 0.336*** | –0.072*** | –0.376*** | 0.579*** | –0.149*** | 1 | ||||
| (7) | Rec | –0.136*** | –0.208*** | –0.040*** | –0.016*** | –0.115*** | –0.095*** | 1 | |||
| (8) | Inv | 0.059*** | 0.065*** | 0.249*** | 0.024*** | 0.068*** | –0.134*** | 0.019*** | 1 | ||
| (9) | Fix | –0.061*** | 0.077*** | 0.089*** | –0.083*** | 0.076*** | –0.161*** | –0.261*** | –0.201*** | 1 | |
| (10) | Treat | –0.034*** | 0.068*** | 0.059*** | –0.046*** | 0.103*** | –0.108*** | –0.183*** | –0.089*** | 0.369*** | 1 |
Note: This table reports Pearson correlation coefficients. *** indicates significance at the 1% levels.
| Variables | Size | Lev | Roe | Bm | Net | Rec | Inv | Fix |
| VIF | 1.85 | 1.94 | 1.80 | 1.34 | 2.16 | 1.24 | 1.22 | 1.38 |
Note: This table displays the variance inflation factor (VIF) values for examining multicollinearity.
A key identification assumption for applying the difference-in-differences (DID) method is that the treatment and control groups follow a common trend before the implementation of the policy. This requirement is known as the parallel trend assumption. Based on this, we conduct a test using an event study approach, with the following model specification (Eqn. 2):
In this model,
Although Fig. 2 shows a slight upward movement in CSR levels during the later post-policy years, this change is not statistically significant. The confidence intervals in those periods overlap with earlier negative effects, suggesting that the observed rebound may reflect natural fluctuation rather than a meaningful reversal of the policy impact. Thus, the Green Credit Policy’s negative effect on CSR persists throughout the study period.
Table 3 presents the results of the baseline regression model. Column (1) shows
the results without control variables, while Column (2) includes all controls. In
both cases, the interaction term treat
| (1) | (2) | (3) | (4) | (5) | (6) | (7) | |
| CSR | CSR | Sha | Emp | Sup | Env | Soc | |
| treati |
–0.0020*** | –0.0078*** | –0.0036** | –0.0039*** | –0.0029 | –0.0081*** | –0.0003 |
| (0.0007) | (0.0026) | (0.0016) | (0.0014) | (0.0023) | (0.0027) | (0.0014) | |
| Size | 0.0115*** | 0.0073*** | 0.0087*** | 0.0074*** | 0.0094*** | 0.0009 | |
| (0.0015) | (0.0012) | (0.0008) | (0.0012) | (0.0013) | (0.0009) | ||
| Lev | –0.0312*** | –0.0630*** | 0.0025 | 0.0041 | 0.0039 | –0.0016 | |
| (0.0055) | (0.0043) | (0.0025) | (0.0040) | (0.0043) | (0.0032) | ||
| Roe | 0.2472*** | 0.2253*** | 0.0240*** | 0.0362*** | 0.0295*** | 0.0701*** | |
| (0.0126) | (0.0078) | (0.0038) | (0.0063) | (0.0068) | (0.0065) | ||
| Bm | 0.0204*** | 0.0160*** | –0.0073*** | –0.0092*** | –0.0118*** | 0.0107*** | |
| (0.0029) | (0.0021) | (0.0014) | (0.0021) | (0.0024) | (0.0016) | ||
| Net | 0.2611*** | 0.2687*** | –0.0126*** | –0.0264*** | –0.0241*** | 0.0449*** | |
| (0.0133) | (0.0087) | (0.0036) | (0.0058) | (0.0063) | (0.0065) | ||
| Rec | 0.0240** | 0.0107 | 0.0062 | 0.0021 | 0.0015 | 0.0004 | |
| (0.0112) | (0.0088) | (0.0052) | (0.0077) | (0.0086) | (0.0071) | ||
| Inv | 0.0255*** | 0.0010 | –0.0028 | –0.0059 | –0.0028 | 0.0125** | |
| (0.0088) | (0.0070) | (0.0042) | (0.0069) | (0.0066) | (0.0057) | ||
| Fix | –0.0130** | –0.0226*** | –0.0040 | –0.0016 | –0.0029 | –0.0008 | |
| (0.0064) | (0.0051) | (0.0031) | (0.0051) | (0.0057) | (0.0038) | ||
| Constant | 0.0290*** | 7.0312*** | –1.2023** | 4.4587*** | 6.7029*** | 7.1193*** | 0.7920** |
| (0.0044) | (0.5276) | (0.5390) | (0.2650) | (0.4275) | (0.4689) | (0.3243) | |
| Observations | 28,001 | 22,317 | 23,177 | 23,177 | 23,177 | 23,177 | 23,177 |
| R-squared | 0.151 | 0.339 | 0.585 | 0.148 | 0.152 | 0.150 | 0.066 |
| Number of samples | 3627 | 3627 | 3627 | 3627 | 3627 | 3627 | 3627 |
| Year effect | YES | YES | YES | YES | YES | YES | YES |
| Industry effect | YES | YES | YES | YES | YES | YES | YES |
| Id effect | YES | YES | YES | YES | YES | YES | YES |
Note: Columns (3)–(7) represent shareholder responsibility; employee responsibility; supplier and customer rights responsibilities; environmental responsibility and social responsibility. **, and *** indicate significance at the 5% and 1% levels, respectively. Robust t-statistics based on standard errors are in parentheses.
Among the control variables, higher leverage (Lev) and fixed assets ratios (Fix) are negatively associated with CSR. Firms with higher leverage face increased debt burdens, limiting funds available for CSR. Similarly, capital-intensive firms with higher fixed asset ratios may prioritize operational investments over CSR activities. Other control variables, such as firm size and profitability metrics, show varying effects on CSR dimensions.
To examine the double mediating effect of the GCP on CSR, we employ a model that
explores the sequential relationships between GCP, WW, TFP, and CSR. The analysis
builds on methodologies proposed by Marco-Lajara et al. (2023), utilizing
three equations to capture the interconnected effects. To better control for the
potential influence of firm life cycle and industry characteristics on total
factor productivity (TFP), we follow Breuer and DeHaan (2024) by including a
“life cycle
The variable definitions of
The results in Table 4 show that GCP significantly increases WW, as
indicated by the positive coefficient on the interaction
term
| Variables | (1) | (2) | (3) |
| WW | TFP | CSR | |
| treati |
0.0033*** | –0.0014 | –0.0019** |
| (0.0009) | (0.0036) | (0.0008) | |
| WW | –0.0976*** | –0.0163*** | |
| (0.0184) | (0.0030) | ||
| TFP | 0.0050** | ||
| (0.0020) | |||
| Constant | 6.0931*** | –4.9557*** | 2.2291*** |
| (0.3259) | (0.7439) | (0.1484) | |
| Control variables | YES | YES | YES |
| Year effect | YES | YES | YES |
| Age-Industry effect | YES | YES | YES |
| Id effect | YES | YES | YES |
| Observations | 21,847 | 21,847 | 21,847 |
| Number of samples | 3622 | 3622 | 3622 |
| R-squared | 0.232 | 0.172 | 0.262 |
Note: **, and *** indicate significance at the 5% and 1% levels, respectively. Robust t-statistics based on standard errors are in parentheses.
Fig. 3 illustrates these relationships visually, mapping the pathways through which GCP affects financial constraints, TFP, and, eventually, CSR performance. The mediation pathway highlights the ripple effects of GCP, in which pressures from regulators not only generate financial strain but also influence firms’ productivity and social responsibility efforts.
 Fig. 3.
Path of double mediating effect. ** and *** indicate significance at the 5% and 1% levels, respectively.
Table 5 examines how firm ownership (SOE), the regional green economic
development index (GREEN), and industry concentration (HHI) moderate the
relationship between GCP and CSR. The interaction terms are all negative and
statistically significant: posttreat
| Variables | (1) | (2) | (3) |
| treati |
–0.0013* | –0.0021** | –0.0019** |
| (0.0007) | (0.0007) | (0.0008) | |
| posttreat |
–0.0027** | ||
| (0.0010) | |||
| posttreat |
–0.0132* | ||
| (0.0068) | |||
| posttreat |
–0.0347*** | ||
| (0.0061) | |||
| Constant | 1.8169*** | 1.9399*** | 1.9471*** |
| (0.1256) | (0.1298) | (0.1262) | |
| Control variables | YES | YES | YES |
| Year effect | YES | YES | YES |
| Industry effect | YES | YES | YES |
| Id effect | YES | YES | YES |
| Observations | 20,108 | 21,707 | 21,096 |
| Number of samples | 3627 | 3627 | 3627 |
| R-squared | 0.228 | 0.252 | 0.253 |
Note: *, **, and *** indicate significance at the 10%, 5% and 1% levels, respectively. Robust t-statistics based on standard errors are in parentheses.
The relationship between GCP and CSR varies depending on a firm’s TFP. TFP reflects a firm’s ability to adapt to changes, such as market demand fluctuations, policy shifts, and technological advancements. Firms with different TFP levels exhibit distinct investment behaviors, which may influence how GCP impacts their CSR performance (Zhong et al., 2022).
To investigate this, we applied a threshold regression model based on Wang C and Wang L (2023), using TFP as the threshold variable (Eqn. 6). This model identifies whether the GCP–CSR relationship changes when firms’ TFP surpasses specific thresholds.
Where I is an indicator function that equals 1 when the condition is
satisfied and 0 otherwise.
| Panel A: Test of threshold number | |||
| Type of Threshold | Threshold Value | p value | Number of Bootstrap |
| Single Threshold | 0.9298** | 0.032 | 500 |
| Second Threshold | 1.5392 | 0.764 | 500 |
| Panel B: Threshold effect test | |||
| Coefficient | Standard Error | ||
| DID (TFP |
–0.0143** | 0.007 | |
| DID (TFP |
–0.0094* | 0.005 | |
Note: * and ** indicate significance at the 10% and 5% levels, respectively. Robust t-statistics based on standard errors are in parentheses. DID, regression results of non-linear difference-in-differences.
The results in Panel B of Table 6 show that when TFP is below 0.9298, the
coefficient for the GCP’s effect on CSR is –0.0143 (p
Two explanations can account for this phenomenon. First, increased TFP improves the efficiency of a firm by allocating capital, labor, and resources, which lowers production costs and enables companies to absorb additional costs associated with GCP without significantly affecting profitability (Lee and He, 2022). Second, a higher TFP makes a firm more competitive in the market, prompting it to enhance its CSR practices to attract consumers and investors (Peng et al., 2021).
These findings highlight the moderating role of TFP in the GCP-CSR link. They emphasize the importance of productivity improvements in mitigating the policy’s negative effects on CSR performance and suggest that supporting productivity enhancements can make GCP implementation more effective.
To verify the reliability of our findings, we conducted several robustness checks.
Placebo tests. We reassigned “fake” policy years before 2012 and re-estimated the DID model. As shown in Fig. 4, placebo estimates are centered around zero and statistically insignificant, confirming that the observed CSR decline is attributable to the 2012 Green Credit Policy rather than spurious shocks.
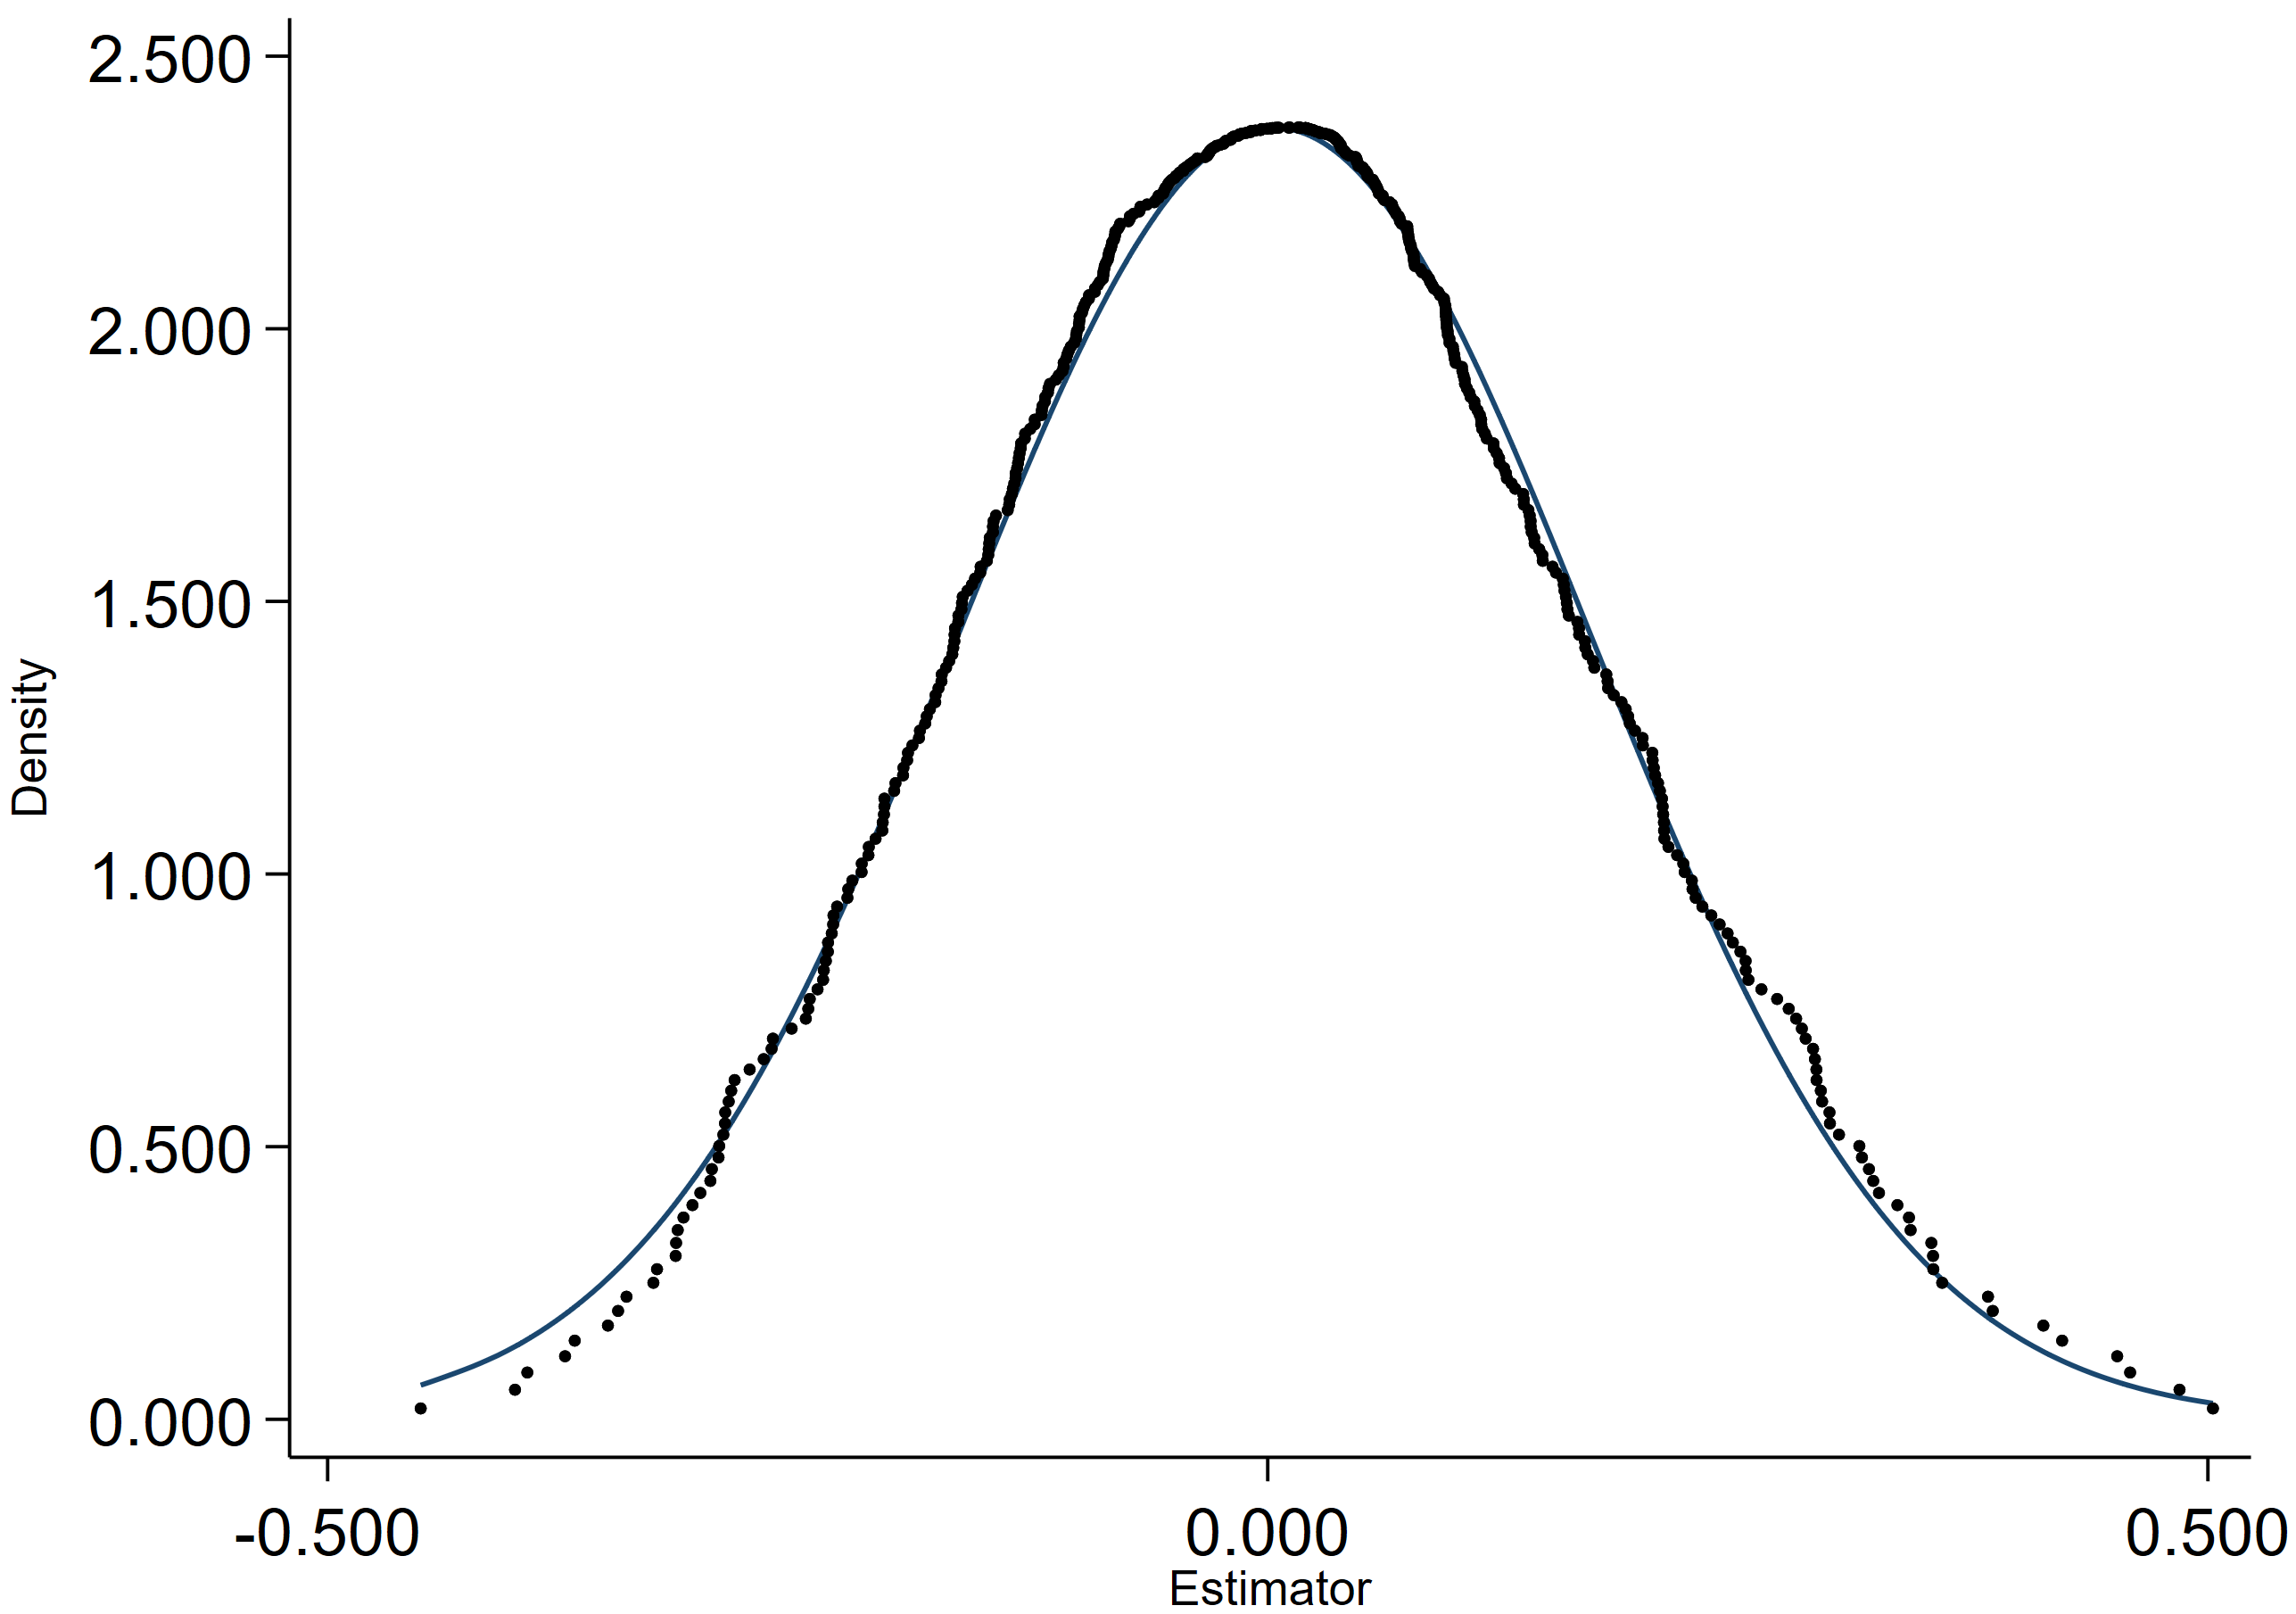 Fig. 4.
Placebo test.
Propensity score matching (PSM). We matched treated and control firms based on pre-policy characteristics to mitigate selection bias. Post-matching results remain consistent with our baseline estimates: the negative impact of GCP on CSR persists and is of similar magnitude (Table 7, Column 1). Detailed covariate balance statistics and kernel density plots (showing improved overlap between treatment and control groups) are provided in Appendix Table 13 and Fig. 5.
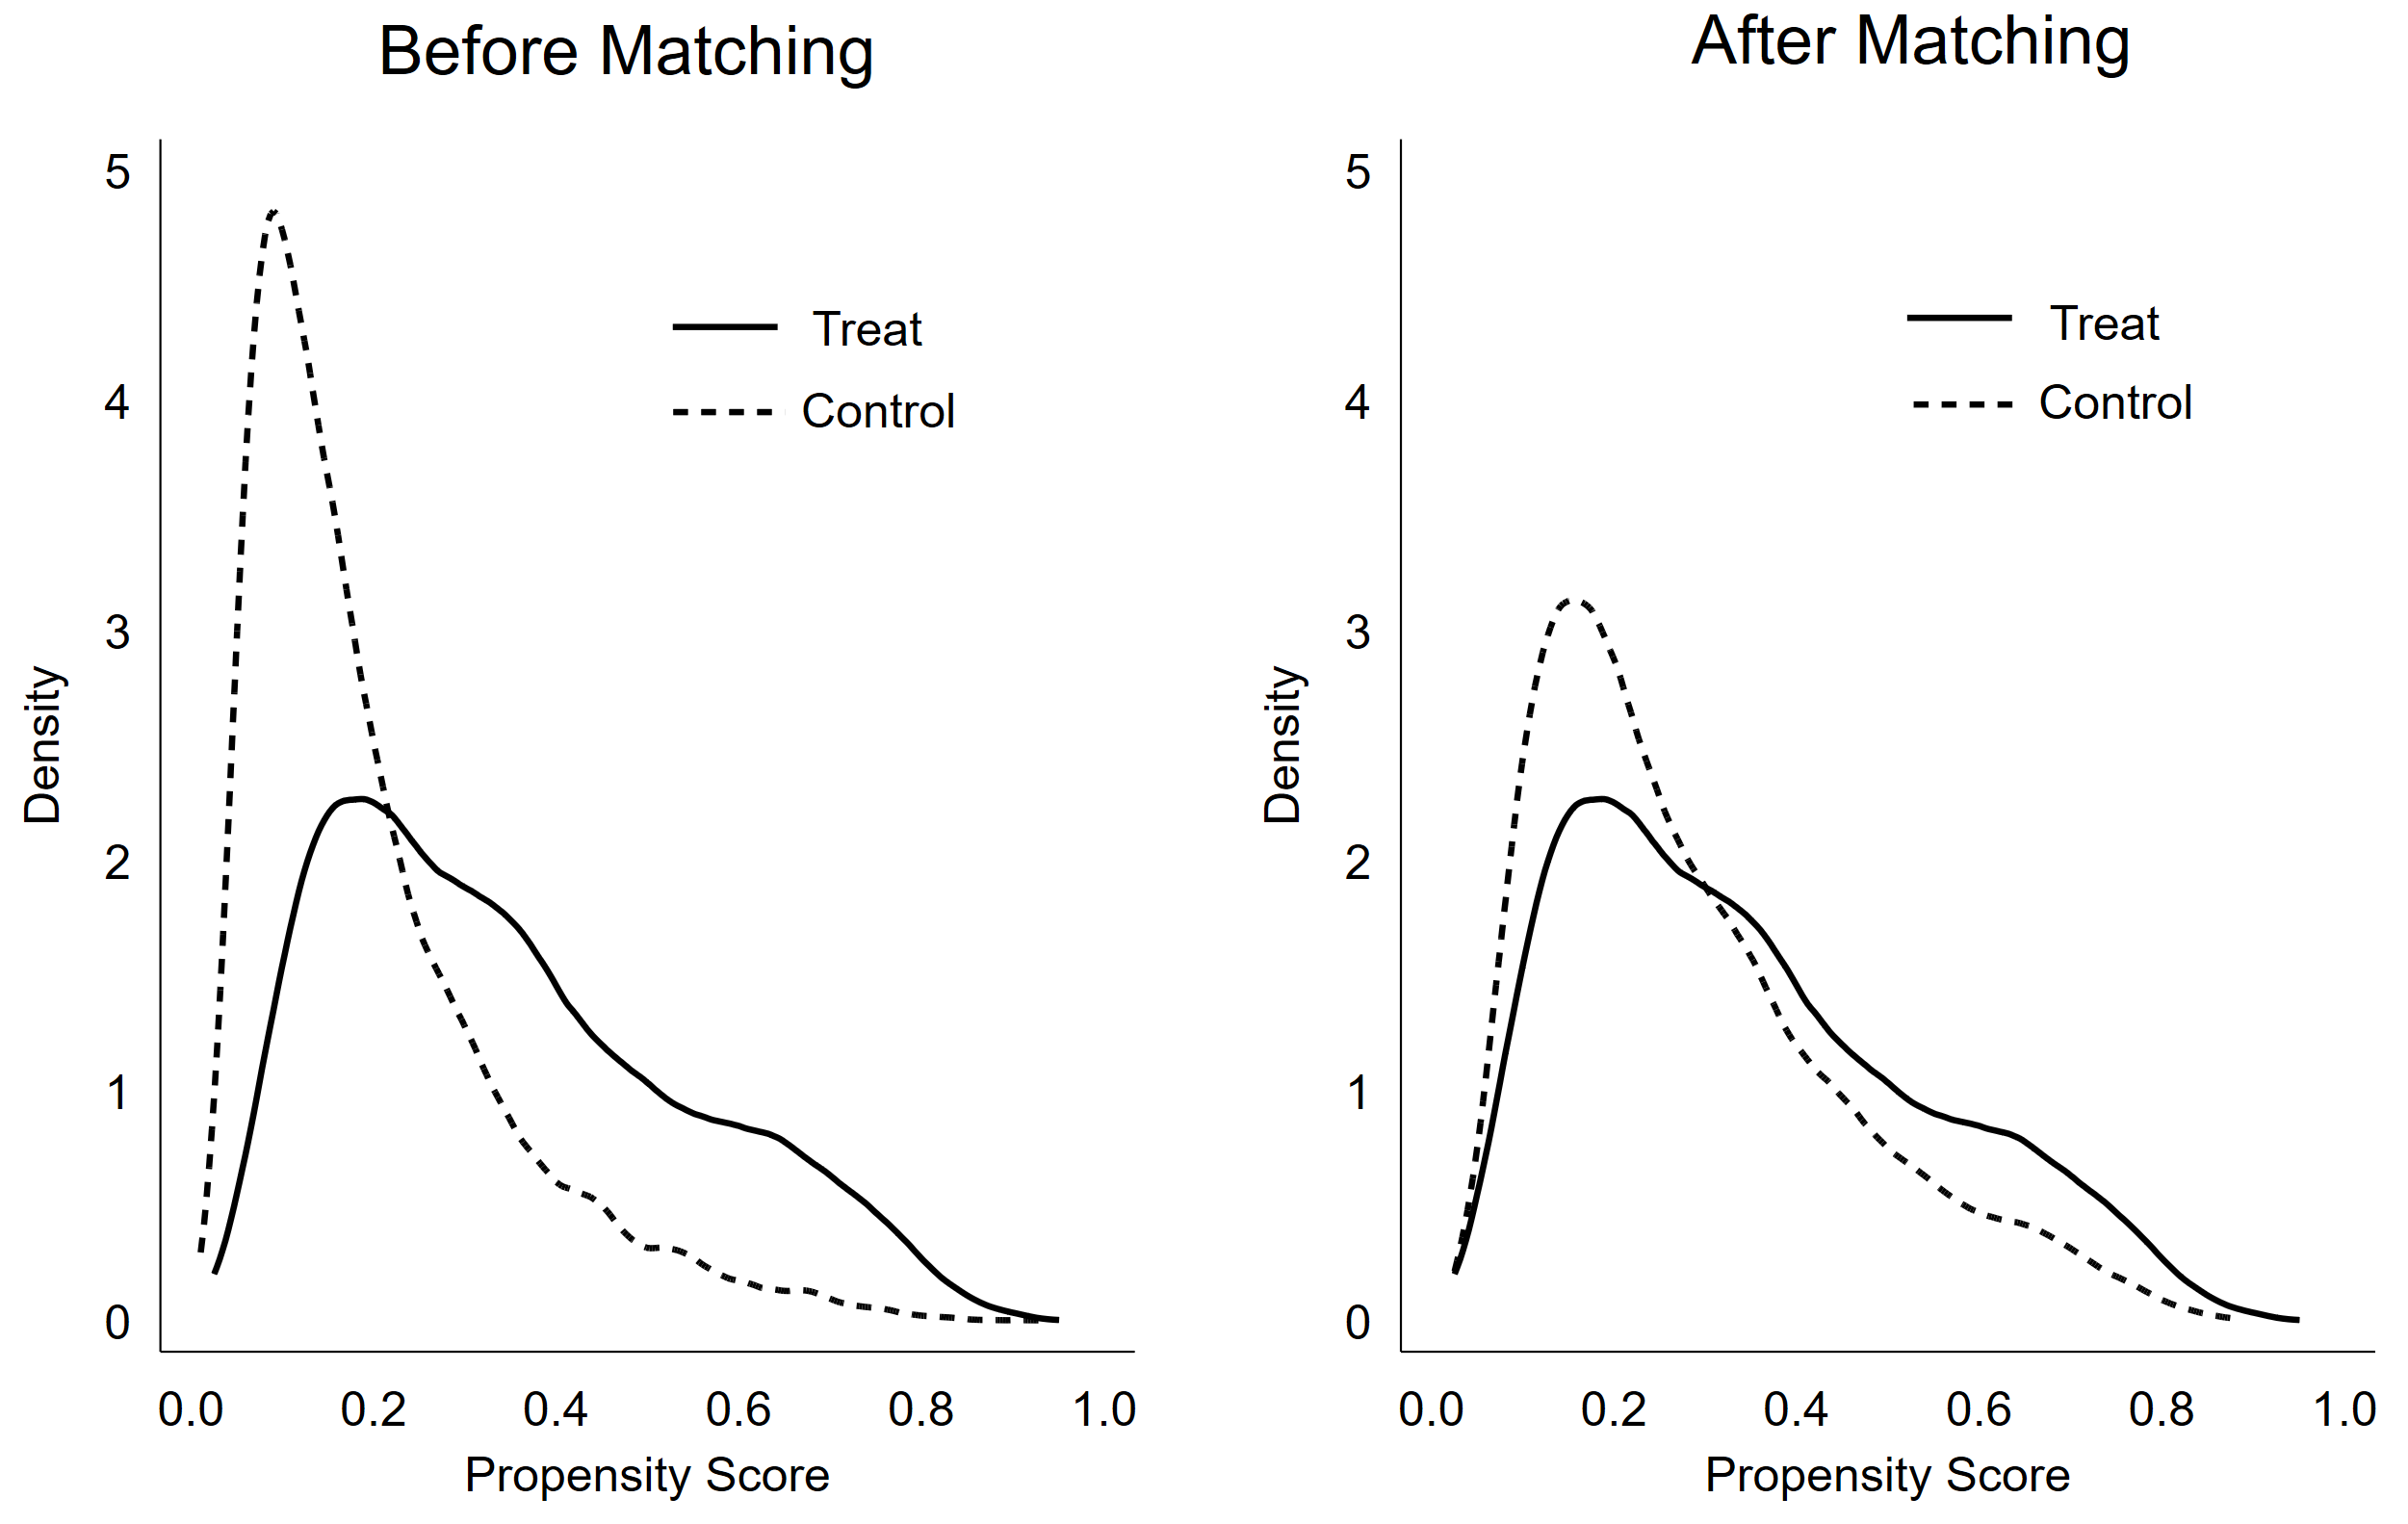 Fig. 5.
Kernel density distribution before and after matching.
| Variables | (1) | (2) | (3) | (4) |
| treati |
–0.0015** | –0.0011* | –0.0017** | –0.0018*** |
| (0.0007) | (0.0006) | (0.0008) | (0.0007) | |
| Constant | 1.9467*** | 2.4031*** | 1.9975*** | 2.0892*** |
| (0.1250) | (0.2769) | (0.1478) | (0.1335) | |
| Control variables | YES | YES | YES | YES |
| Year effect | YES | YES | YES | YES |
| Industry effect | YES | YES | YES | YES |
| Id effect | YES | YES | YES | YES |
| Observations | 21,907 | 9735 | 15,283 | 19,617 |
| Number of samples | 3610 | 2325 | 2437 | 3167 |
| R-squared | 0.252 | 0.210 | 0.262 | 0.240 |
Note: *, **, and *** indicate significance at the 10%, 5% and 1% levels, respectively. Robust t-statistics based on standard errors are in parentheses.
Concurrent policy shocks. We further accounted for major contemporaneous events that could confound the analysis, such as the 2015 Environmental Protection Law, the establishment of green finance pilot zones in 2016, and the COVID-19 outbreak in late 2019. Regression results (Table 7, Columns 2–4) show that excluding these events does not materially alter our findings.
Overall, these robustness checks reinforce the validity of our results. Across placebo tests, matched samples and controls for concurrent shocks, the evidence consistently indicates that the Green Credit Policy reduced CSR among heavily-polluting firms.
While prior studies emphasize the positive role of green credit in guiding firms toward improved environmental performance and increased green investment (Lin et al., 2025), our findings shed light on an unintended consequence: a paradoxical reduction in broader CSR engagement among targeted firms, especially those with limited resources. In anchoring these results to theory, we see alignment with resource dependence theory—firms under resource constraints retrench in non-core areas—and stakeholder theory—firms under intense creditor scrutiny may focus narrowly on compliance. The evidence of a threshold effect resonates with the Porter Hypothesis only conditionally: beyond a certain productivity, firms might cope or even thrive under stricter green finance rules, but many firms in our sample had not reached that tipping point during 2010–2020, resulting in a net CSR decline.
Comparing to the literature, our negative GCP–CSR linkage echoes the concerns raised by studies like Liu et al. (2025) that green credit could inadvertently hamper firms’ voluntary social and environmental efforts. We extend those works by pinpointing why: through the twin channels of finances and productivity, and we add nuance by showing it’s not uniform across all firms. For example, our finding that SOEs exhibit stronger CSR suppression aligns with institutional theory views (Brammer et al., 2012) on SOEs juggling multiple goals—they meet the letter of environmental mandates but possibly at the cost of broader CSR, due to weaker market discipline and implicit guarantees. This contrasts with private firms, which might feel more pressure from private investors to uphold CSR reputation even when finances tighten.
Our mediation results also contribute to the growing literature on how environmental policies translate into firm-level outcomes (e.g., Bartram et al., 2022). By showing the sequential hit on financing and productivity, we provide an integrated explanation: GCP first limits financing (higher WW), which lowers productivity (less innovation, efficiency), thereby squeezing out CSR budgets. Notably, if firms had slack resources or could maintain productivity, the absence of one mediator might mean CSR would not suffer. This raises an intriguing implication: enhancing firms’ capacity (e.g., through subsidies or technical assistance) could break this chain, a point we return to in policy implications.
Our discussion also touches on heterogeneity beyond China. While our analysis is China-specific, we consciously related our findings to emerging evidence in Eastern Europe and other transition economies. In those contexts, green finance is nascent and institutional support may be weaker; thus, the risk of “crowding out” CSR could be as high or higher. We discussed Poland and Hungary’s moves, noting that without safeguards, their firms might respond similarly to Chinese firms—focusing only on what’s measured or mandated (environmental compliance), at the expense of other responsibility areas. This comparative outlook broadens the relevance of our study, suggesting that what we observe in China could serve as a cautionary tale or lesson for other regions implementing green credit or similar sustainable finance policies.
Finally, we interpret the productivity threshold in light of the Porter Hypothesis debate: our results imply that strict environmental financial policies like GCP may hinder less efficient firms (confirming a “narrow” Porter effect does not hold generally), but for highly efficient firms, these policies might not be detrimental and could even spur innovation if coupled with the right incentives. Thus, a blanket statement on Porter Hypothesis doesn’t fit—nuance is required, considering firm heterogeneity.
This study offers several important insights into how an environmental financial policy can reshape corporate behavior in a transition context. First, by focusing on heavily-polluting firms, we highlight an under-examined segment in the green finance literature. Prior works often looked at greener firms or average effects. We show that firms most in need of reform—the worst polluters—may paradoxically pull back on certain positive behaviors (CSR) when faced with financial strictures. This contributes to the literature on institutional voids and firm strategy in emerging markets (Meyer and Peng, 2016) by illustrating a context where policy intent (to improve environment) meets firm reality (resource constraints), producing unintended outcomes. Second, we contribute to the micro-foundations of sustainable finance by unpacking the mechanisms—financial constraints and productivity—through which policy affects firm outcomes. While studies like Aghion et al. (2016) emphasize innovation’s role in climate policy and others like Attig (2024) focus on finance–CSR links, we bring these threads together, demonstrating a connected causal chain. This integrative perspective enriches both CSR theory and environmental economics by showing how financial and operational dimensions jointly mediate policy impact. Third, methodologically, our introduction of a threshold regression to identify a TFP turning point is novel in this domain. It provides a quantitative way to test conditional theories (like Porter’s) within a single policy evaluation. We empirically establish that beyond a certain productivity level (~0.93 in our sample), the firm’s response to GCP changes nature—offering a rare concrete estimate that future research can build on or test in other contexts. Finally, our findings on SOEs add to institutional theory by evidencing how state ownership can moderate policy effectiveness in emerging markets. We provide a nuanced narrative: despite their financial advantages, SOEs might underperform on voluntary CSR under environmental financial pressure, due to institutional multiplicity and weaker external oversight. This underscores that governance structure is a critical lens when evaluating sustainability policies (Aguilera et al., 2006).
Our results carry practical implications for policymakers and financial regulators in China and beyond. For China: The Green Credit Policy, while well-intentioned and partly successful (firms did cut pollution investments as other studies show), appears to have side effects that need addressing. The fact that CSR fell suggests that heavy polluters might be neglecting social and governance aspects (like workplace safety, community engagement) when financially strained. Regulators should be aware that sustainability is multidimensional; focusing on one aspect (environment) in isolation may inadvertently harm others (social responsibility). Policy refinement is warranted: Our threshold finding implies a one-size-fits-all approach could be recalibrated. For lower-productivity firms, complementary support could help them comply with environmental mandates without sacrificing CSR. This might include subsidized green loans for SMEs, technical assistance to improve process efficiency, or phased targets that give them time to adjust. For higher-productivity firms, on the other hand, the government could tighten standards, as they can better absorb the costs and maybe turn them into innovation opportunities. By tailoring GCP intensity to firm capability, policymakers can mitigate negative externalities on CSR. Additionally, monitoring and incentives can be broadened: if banks (perhaps in collaboration with stock exchanges) also monitor CSR performance or if credit terms slightly reward comprehensive sustainability performance (not just environmental metrics), firms would have motivation to not let their CSR lapses too much. Banks could integrate Environmental, Social, and Governance (ESG) scoring that covers social factors into their credit risk models.
For transition/emerging economies: Our comparative discussion pointed out that Eastern European countries like Poland, Hungary, as well as nations like Brazil or India, are experimenting with green finance policies. Our study suggests a caution: ensure firms in these contexts are not overburdened to the point they neglect other responsibilities. It might be beneficial for these countries to simultaneously promote frameworks for CSR or to channel some green finance into capacity-building (like tech upgrades that boost productivity) so that firms are more resilient. International development agencies and financial institutions (e.g., World Bank, IFC) should take note that tying lending to green outcomes could have trade-offs; they should encourage holistic sustainability assessments.
For business managers: The findings highlight the importance of efficiency and stakeholder management in navigating policy shocks. Firms that invested in productivity (through innovation, better management) were less adversely affected in their CSR by GCP. This signals to managers that building a robust, efficient operation not only improves competitiveness but also provides slack to maintain CSR even when new regulations hit. Managers in high-pollution sectors should, paradoxically, double down on CSR communication and integration during challenging times, to avoid reputational damage from being seen as retracting their social commitments. Those in SOEs, in particular, might need to proactively maintain CSR to counteract the complacency that can arise from their safety nets.
While this study provides valuable insights, it has several limitations. First, the sample is limited to Chinese listed firms through 2020. Data beyond 2020 were not fully available (and 2021–2022 saw COVID-19 disruptions and new green policies). Future research could extend the timeframe as data emerge to see if the negative CSR effect persists, diminishes, or reverses with longer adjustment or with newer policy refinements (China updated green credit guidelines in 2020–2021). Second, our focus on listed firms means the findings may not directly generalize to private or smaller firms not captured in Hexun’s database. These unlisted companies might react differently or even more strongly (since they often have even tighter finances and lower CSR baselines). Future studies could use survey methods or case studies to examine GCP impacts on SMEs or privately-held polluters. Moreover, a limitation of our approach is the inherent difficulty in objectively measuring CSR. Although we use a widely recognized index (Hexun), sustainability metrics such as CSR or ESG are known to vary significantly across data providers, methodologies, and underlying assumptions. These measurement discrepancies can influence empirical findings and may obscure deeper behavioral patterns. Recent studies have discussed the fragmentation and subjectivity of ESG/CSR metrics in the literature (Clément et al., 2025; Drago et al., 2024; Kotsantonis and Serafeim, 2019). Future research may explore cross-validating CSR through a combination of text analysis, case interviews, and third-party surveys to provide a more comprehensive and objective portrayal of corporate social responsibility practices. Finally, our identification, like all DID analyses, assumes no other concurrent shocks systematically differ by treatment group. We addressed major ones (e.g., COVID, other green policies) as best as possible, but we cannot rule out all confounding events. Researchers might supplement our quantitative approach with qualitative research (interviews with firm managers, regulators) to validate the causal stories—understanding, for example, how decision-makers prioritized budgets under GCP constraints.
Despite these limitations, our study opens several avenues. One is exploring synergies between green finance and CSR incentives: for instance, do firms that had strong CSR cultures cope better with GCP because of stakeholder goodwill or innovation mindset? Another is cross-country analysis: comparing China’s experience with say, an Eastern European country’s green credit roll-out to see if similar patterns emerge, which could strengthen external validity of our conclusions.
This study examines the impact of GCP on CSR among heavily-polluting firms in China, using a DID approach with data from 3627 listed companies spanning 2010 to 2020. We find that the Green Credit Policy while aimed at improving environmental performance had the unintended effect of reducing overall CSR engagement in targeted firms. Our analysis identifies the mechanisms of this effect: policy-induced financial constraints and productivity declines jointly mediated the reduction in CSR. We also find that beyond a certain productivity threshold, firms were less adversely affected, suggesting heterogeneity in policy impact linked to firm capabilities. Further, state-owned firms exhibited a stronger negative CSR response than private firms, highlighting the role of institutional factors in shaping outcomes.
These findings contribute to academic debates on sustainable finance and CSR by revealing how an environmental policy can produce trade-offs at the firm level, and by emphasizing the importance of firm heterogeneity in policy effectiveness. For practitioners and policymakers, the results underscore the need for nuanced approaches: complementary support for weaker firms, integration of CSR considerations into green finance frameworks, and caution in assuming that environmental policies automatically yield across-the-board sustainability gains. By learning from China’s experience, other economies can design greener financial systems that also uphold corporate social responsibility, ensuring that shades of green progress do not come at the expense of broader social goals.
All data reported in this paper will be shared by the corresponding author upon reasonable request.
ZW and DL designed the research study. ZW performed the research and analyzed the data. ZW and DL drafted the manuscript. SS and SB contributed substantially to the study conceptualization, theoretical framework, and interpretation of results, and provided critical intellectual input throughout the research process. All authors contributed to the critical revision of the manuscript for important intellectual content. All authors read and approved the final manuscript and have participated sufficiently in the work to take public responsibility for all aspects of the study.
Not applicable.
This work was supported by 111 Project (D21007).
The authors declare no conflict of interest. Given the role as Editorial Board Members, Sui Sui was not involved in the peer-review of this article and has no access to information regarding its peer-review. Full responsibility for the editorial process for this article was delegated to Thomas Steger.
During the preparation of this work, the authors used ChatGPT-4.5 to check spelling and grammar. After using this tool, the authors reviewed and edited the content as needed and take full responsibility for the content of this publication.
Appendix A
| Industry | Pre-adjustment | Post-adjustment | ||
| Percent | Cumulative Percent | Percent | Cumulative Percent | |
| C39 | 9.13 | 9.13 | 9.46 | 9.46 |
| C26 | 6.87 | 16.00 | 6.86 | 16.32 |
| C38 | 6.14 | 22.14 | 6.38 | 22.70 |
| C27 | 6.07 | 28.21 | 6.32 | 29.03 |
| C35 | 5.66 | 33.87 | 5.74 | 34.77 |
| I65 | 4.84 | 38.71 | 5.05 | 39.81 |
| K70 | 4.23 | 42.94 | 4.23 | 44.04 |
| C34 | 3.61 | 46.55 | 3.70 | 47.74 |
| C36 | 3.23 | 49.78 | 3.32 | 51.06 |
| F52 | 2.96 | 52.74 | 3.05 | 54.11 |
| C30 | 2.63 | 55.36 | 2.71 | 56.82 |
| D44 | 2.25 | 57.62 | 2.31 | 59.13 |
| F51 | 2.09 | 59.71 | 2.21 | 61.33 |
| C32 | 2.03 | 61.73 | 2.08 | 63.42 |
| C29 | 2.01 | 63.75 | 1.99 | 65.41 |
| C33 | 1.72 | 65.47 | 1.81 | 67.22 |
| E48 | 1.71 | 67.17 | 1.78 | 69.01 |
| C17 | 1.34 | 68.52 | 1.34 | 70.35 |
| C37 | 1.34 | 69.86 | 1.32 | 71.67 |
| C13 | 1.33 | 71.19 | 1.31 | 72.98 |
Note: The industry codes in the above table represent, in order: Computer, communication, and other electronic equipment manufacturing; Chemical raw materials and chemical products manufacturing; Electrical machinery and equipment manufacturing; Pharmaceutical manufacturing; Manufacture of special equipment; Software and information technology services; Real estate; General equipment manufacturing; Automobile manufacturing; Retail; Non-metallic mineral products manufacturing; Electricity, heat production and supply; Wholesale and retail trade; Nonferrous metal smelting and rolling; Rubber and plastic products manufacturing; Metal products manufacturing; Civil engineering construction; Textile manufacturing; Railway, shipbuilding, aerospace and other transportation equipment manufacturing; Processing of agricultural and sideline products. ST, special treatment; PT, particular transfer.
| Year | Assets | Assets | Revenue | Revenue |
| (Total) | (Mean) | (Total) | (Mean) | |
| 2010 | 19.84% | 23.85% | 79.61% | 95.77% |
| 2011 | 20.72% | 24.29% | 80.56% | 94.45% |
| 2012 | 20.95% | 24.01% | 80.98% | 92.76% |
| 2013 | 21.34% | 23.97% | 81.41% | 91.41% |
| 2014 | 21.36% | 23.86% | 80.03% | 89.40% |
| 2015 | 21.92% | 24.33% | 78.17% | 86.74% |
| 2016 | 22.36% | 24.76% | 79.18% | 87.62% |
| 2017 | 23.62% | 25.76% | 81.35% | 88.67% |
| 2018 | 24.58% | 26.62% | 82.26% | 89.06% |
| 2019 | 23.80% | 25.87% | 81.39% | 88.46% |
| 2020 | 23.83% | 26.10% | 80.79% | 88.44% |
| Full sample | 22.73% | 25.00% | 80.69% | 90.00% |
Note: Columns (2)–(5) present the ratios of the final sample’s total and mean values of assets and revenue to those of the initial population (in billions of RMB), illustrating sample representativeness. The exclusion of PT/ST and financial firms accounts for the decline in asset-based proportions due to their structurally large and often incomparable asset figures. However, revenue-based coverage remains high, indicating that the retained sample captures the majority of economically active firms and remains representative for analyzing operational outcomes.
Appendix B
The Ministry of Ecology and Environment (MEE) of the People’s Republic of China is the national environmental regulatory authority responsible for formulating and implementing nationwide environmental protection policies and regulations, as well as supervising and managing the environmental behavior of enterprises. One of the primary functions of the MEE is to set pollution emission standards for enterprises, enforce environmental protection laws, and ensure that enterprises comply with the prescribed emission regulations. China’s environmental regulatory framework encompasses various aspects, including air, water, and soil, and imposes strict requirements on the discharge behaviors of enterprises. In accordance with the Environmental Protection Law of the People’s Republic of China and the Pollution Discharge Permit Management Regulations, all enterprises are required to regularly disclose their pollution emission data and undergo inspections by environmental regulatory authorities. Enterprises that fail to meet national environmental standards are subject to penalties and are required to rectify their non-compliant behaviors. According to the “Industry Classification Management Catalog for Environmental Protection Verification of Listed Companies” issued by the Ministry of Ecology and Environment of the People’s Republic of China, the following industries are defined as heavily polluting industries (see Table 10).
| Industry category | Subcategory |
| Thermal power | Thermal power generation (including cogeneration, waste rock utilization power generation, and waste-to-energy power generation) |
| Steel | Ironmaking (including smelting and reduction), pelletizing and sintering, steelmaking, ferroalloy smelting, steel rolling, coking |
| Cement | Cement manufacturing (including clinker manufacturing) |
| Electrolytic aluminum | Including all scales and the entire production process |
| Coal | Coal mining and washing, underground coal gasification, coal chemical industry (coal-to-oil, coal-to-gas, coal-to-methanol or dimethyl ether, etc.) |
| Metallurgy | Non-ferrous metal smelting (commonly used non-ferrous metals, precious metals, rare earth metals, and other rare metals), non-ferrous metal alloy manufacturing, scrap metal smelting, non-ferrous metal rolling and processing, metal surface treatment and heat treatment processing (electroplating, organic coating, hot-dip galvanizing (with passivation) process) |
| Building materials | Manufacture of glass and glass products, manufacture of glass fiber and glass fiber reinforced plastic products, manufacture of ceramic products, manufacture of asbestos products, manufacture of refractory ceramic products and other refractory materials, manufacture of graphite and carbon products |
| Mining | Oil extraction, natural gas extraction, non-metallic mineral mining and beneficiation, ferrous metal mining and beneficiation, non-ferrous metal mining and beneficiation |
| Chemical industry | Manufacture of basic chemical raw materials, manufacture of fertilizers, manufacture of paints, dyes, pigments, inks, and other similar products, manufacture of synthetic materials, manufacture of specialty chemicals, manufacture of chemical pesticides, biochemical pesticides, and microbial pesticides, manufacture of daily chemical products, rubber processing, manufacture of tires and recycled rubber |
| Petrochemical industry | Crude oil processing, natural gas processing, petroleum product production (including ethylene and downstream product production), crude oil extraction from oil shale, bio-based oil production |
| Pharmaceutical industry | Manufacture of chemical drugs (including intermediates), manufacture of chemical drug preparations, manufacture of biological and biochemical products, manufacture of traditional Chinese medicine |
| Light industry | Brewing, papermaking, fermentation, sugar production, vegetable oil processing |
| Textile industry | Chemical fiber manufacturing, cotton, chemical fiber textile, and printing and dyeing finishing, wool textile and dyeing and finishing, silk textile and finishing, chemical fiber pulp manufacturing, cotton pulp manufacturing |
| Leather industry | Leather tanning and processing, fur tanning and product processing |
Appendix C
Since 2009, in response to the requirement of the Circular on Strengthening the Social Responsibility of Listed Firms issued by the Shanghai Stock Exchange, China’s listed firms have continued to disclose independent social responsibility reports, which has provided the possibility of obtaining more systematic and comprehensive social responsibility information. On this basis, in 2010, Hexun started to evaluate the fulfillment of social responsibility of listed firms and publish the data, which provides the basis for this paper to measure the performance of corporate social responsibility. Compared with other methods based only on social responsibility reports, the score is calculated based on social responsibility reports and annual reports, so even if listed companies do not disclose their social responsibility reports, they can still be scored based on the relevant contents of their annual reports. Given the limited quantity and quality of social responsibility reports in China at present, it may be more authoritative and comprehensive to rely on both annual reports and social responsibility reports for the scoring method. CSR measurement, further divided into five secondary categories: shareholder responsibility; employee responsibility; supplier and customer rights responsibilities; environmental responsibility and social responsibility. The structure of the CSR performance measure is provided in Table 11. The CSR score is equal to the weighted total of these five indicators, with a maximum of 100 points, and there are 5 secondary indicators and 13 tertiary indicators.
| Secondary indicators | Tertiary indicators |
| Shareholder responsibility (30%) | Profitability (10%) |
| Solvency (3%) | |
| Dividend (8%) | |
| Penalties (5%) | |
| Innovative capacity (4%) | |
| Employee responsibility (15%) | Employee Income (5%) |
| Safety (5%) | |
| Caring for employees (5%) | |
| Supplier and customer rights responsibilities (15%) | Quality of products (7%) |
| After-sales service (3%) | |
| Honest and mutually beneficial (5%) | |
| Environmental responsibility (20%) | Environmental governance (20%) |
| Social responsibility (20%) | Contributing value (20%) |
Appendix D
Our measure of corporate financing constraints is the index developed by Whited and Wu (2006). The WW index uses several key variables as proxies for financing constraints and is constructed using a regression model.
where CF is the cash flow to total assets ratio; DivPos is a dummy variable for cash dividend payment, which is one if a cash dividend is paid in the current period and otherwise 0; Lev is the long-term liabilities to assets ratio; Size is the natural logarithm of total assets; ISG is the industry average sales growth rate; SG is the sales revenue growth rate.
We follow Levinsohn and Petrin (2003) approach to calculate TFP and use the Levinsohn-Petrin (LP) method takes its logarithmic form. The LP method defines TFP shown as follows.
where
Appendix E
Considering that hierarchical analysis is a relatively subjective method of assigning values, principal component analysis has strict requirements on the assumptions of the data, and entropy weighting is a method based on the degree of data dispersion to determine the weight of the indicators, which is more objective and flexible, this paper adopts entropy weighting to measure the green financial development index (see Table 12).
| Primary indicator | Secondary indicators | Specific measurements |
| Green economic development | Green credit | Total credit for urban environmental projects/total credit for cities |
| Green insurance | Total income from urban environmental liability insurance/total urban gross premium income | |
| Green investment | Total investment in urban environmental governance/city GDP | |
| Green support | Total environmental protection expenditure of city finance/Total general budget expenditure of city finance | |
| Green bonds | Total amount of urban green bond issuance/Total amount of urban bond issuance | |
| Green fund | Total city green fund/total city fund | |
| Green equity | (Urban carbon trading + energy usage rights trading + sewage rights trading)/total urban equity market transactions |
Note: GDP, Gross Domestic Product.
Appendix F
A balance test was conducted before and after matching to ensure reliability, specifically by testing whether the covariates’ values significantly differed between the two groups post-matching. According to Rosenbaum and Rubin (1985), standardized deviations should be under 20% for effective matching; in our case, all variables’ standardized deviations were below 10%, with most nearing zero. The t-test results indicate no significant differences between the treatment and control groups, confirming the effectiveness of the matching.
The indicator %bias indicates the percentage deviation of a covariate before and after matching. Specifically, it measures the change in the mean difference between the treatment and control groups on each covariate before and after matching. %bias is commonly used to assess the degree of balance in the covariates before and after matching. A higher %bias indicates a greater difference between the two groups on that covariate, while a lower %bias means that the two groups are more similar on that covariate.
The indicator %reduct indicates the percentage reduction in bias during matching. It measures by what percentage the bias on the covariate was reduced by propensity score matching. The %reduct is used to assess the effectiveness of propensity score matching in reducing bias on covariates. A higher %reduct means that the matching process was effective in reducing the difference between the treatment and control groups on that covariate. Detailed covariate balance statistics are provided in Table 13.
| Variables | Unmatched | Mean | Bias | t-test | ||
| Matched | Treated | Control | %bias | %reduct | p | |
| Size | U | 22.145 | 21.958 | 16.8 | 70.9 | 0.000 |
| M | 22.138 | 22.084 | 4.9 | 0.014 | ||
| Lev | U | 0.414 | 0.390 | 12.8 | 54.3 | 0.000 |
| M | 0.413 | 0.402 | 5.9 | 0.002 | ||
| Roe | U | 0.064 | 0.073 | –11.4 | 88.5 | 0.000 |
| M | 0.065 | 0.064 | 1.3 | 0.508 | ||
| Bm | U | 0.647 | 0.581 | 28.1 | 89.3 | 0.000 |
| M | 0.646 | 0.639 | 3.0 | 0.123 | ||
| Net | U | 0.069 | 0.093 | –27.3 | 94.5 | 0.000 |
| M | 0.070 | 0.071 | –1.5 | 0.441 | ||
| Rec | U | 0.094 | 0.133 | –44.6 | 98.5 | 0.000 |
| M | 0.095 | 0.095 | –0.7 | 0.704 | ||
| Inv | U | 0.120 | 0.140 | –21.0 | 84.3 | 0.000 |
| M | 0.120 | 0.117 | 3.3 | 0.062 | ||
| Fix | U | 0.301 | 0.184 | 85.7 | 98.1 | 0.000 |
| M | 0.299 | 0.301 | –1.6 | 0.448 | ||
References
Publisher’s Note: IMR Press stays neutral with regard to jurisdictional claims in published maps and institutional affiliations.