

 , Kujtim Zylfijaj 2,*
1 Department of Management, Faculty of Economics, University of Prishtina in Kosovo, 10000 Prishtina, Kosovo
2 Faculty of Management, Business and Economics, University of Business and Technology, 10000 Prishtina, Kosovo
Abstract
Small and medium-sized enterprises (SMEs) constitute a substantial segment of the private sector, driving job creation and economic growth. The study utilizes data from the World Bank’s Enterprise Performance Survey to examine the challenges facing SMEs, as perceived by enterprise managers, and their impact on growth in the Western Balkan countries (WBCs). This study draws on contingency theory and adopts a resource-based perspective. The empirical analysis employs a probit regression. Firm growth is used as the dependent variable, measured by sales growth, while firm characteristics and external business environment obstacles serve as explanatory variables. The research findings indicate that barriers constraining firm growth in WBCs include informal-sector competition, electricity shortages, access to finance, tax rates, tax administration, business licensing and permits, political instability, inefficient courts, and crime, theft, and disorder. Internal firm characteristics, such as having a written business strategy, are positively associated with firm growth, whereas firm size is negatively associated. This research contributes to both policy-making and practical applications.
Keywords
- small and medium-sized enterprises
- firm growth
- obstacles to growth
- Western Balkan Countries
The Western Balkan Countries (WBCs) are transitional countries, having undergone a paradigm shift in economic structure from a centrally planned to a market economy in the early 1990s. The ongoing process of economic restructuring distinguishes them as still having complexities in this transformative phase. Despite aspiring to join the European Union (EU), WBCs faces numerous obstacles that challenge its economic development. WBCs’ economic situation remains unfavourable due to past wars, a lack of rule of law, and inadequate economic systems, which have led to a weak foundation for further economic growth (Disoska, 2017), which caused disruptions in international economic relations and showed the dependence on WBCs on the EU countries on trade, investment, and finance (Disoska, 2017). The transition from a plan-based to a market-based economy within WBCs has been extremely challenging due to the external and internal barriers to Small and Medium-sized Enterprises (SMEs) growth, including high unemployment levels and a decline in GDP compared to the EU (Džafić, 2015). The WBCs is particularly vulnerable to the economic impact due to its relatively small size, openness, and reliance on imports. Moreover, SMEs within the WBCs lag behind those within the EU in terms of productivity (Ur Rehman et al., 2019), which stands at 60% of the EU average (Sanfey and Milatovic, 2018). Nevertheless, SMEs in WBCs contribute a larger share of value-added, accounting for 65% of GDP compared to the EU average of 56% (OECD, 2022). Thus, WBCs must recognize the crucial role of SMEs in driving economic growth and emphasize that this sector should be a priority in addressing economic challenges.
The growth of the SMEs sector holds profound importance for WBCs, given its status as an EU pre-accession economy. This sector accounts for 75% of total employment within these countries. There is progress in the Western Balkans (WB) as these countries are covered by the EU enlargement agenda and exhibit advancements in transitioning towards a market-based economic system. This transformation is facilitated by implementing policies within SMEs that contribute to broader innovation frameworks and infrastructural developments (OECD/EU/EBRD/ETF/SEECEL, 2016). Entrepreneurial activity must be developed to foster entrepreneurship and SMEs growth within the WBCs, which involves investing in entrepreneurial education, promoting innovative business practices, and thereby transforming the entrepreneurial culture within firms in the WBCs. WBCs should focus on establishing new businesses and have productive firms with long-term strategic direction (Džafić, 2015).
Despite these impediments, SMEs possess significant potential, characterized by flexibility, entrepreneurial culture, employment generation capabilities, and the capacity to drive technological advancements (Woschke et al., 2017). Various studies highlight the pivotal role of SMEs in transition countries (Smallbone and Welter, 2001; Gruda and Milo, 2010). Moreover, Williams (2017a) reinforces the significance of SMEs in regional development, a perspective echoed by the European Bank for Reconstruction and Development (EBRD), an international institution, which characterizes SMEs in the Western Balkan region as catalysts for fostering innovation and economic growth.
Research into the characteristics of firm growth usually encompasses the examination of barriers. Barriers comprise internal and external factors that limit a firm’s growth potential (Storey, 1994; Achtenhagen et al., 2004). Consequently, it is crucial to understand the impact of obstacles on SMEs growth, particularly in transitional countries (Wells et al., 2003).
Given the risk associated with start-up investments, the influence of access to finance on SMEs’ growth depends on their size. Consequently, the availability of low-risk collateral is constrained compared to their well-established businesses (Beck, 2007). Notably, Wang (2016) argues that one of the biggest obstacles hindering the growth of SMEs is access to finance. The main barriers to securing external financing are the high cost of borrowing and the need for requisite consultant support. Recognized obstacles to growth for SMEs encompass deficiencies in expertise, limited funding availability, and challenges related to cash flows (Lee, 2014).
Informal practices refer to business activities that occur outside of legal and regulatory frameworks, which are employed to cut costs. They lead to unfair competition, reduce government tax revenue, and disrupt market fairness, particularly in countries with weak enforcement of regulations or high costs of legal compliance (Chen, 2007). In the WBCs, weak enforcement of laws, high levels of corruption, and economic pressures make informality a key challenge, accounting for about one-third of GDP (OECD, 2022). Despite its widespread presence, there is no single agreed-upon definition, with most definitions focusing on legal aspects while often overlooking cultural factors that deeply influence informality. Luque (2022) explored 102 definitions of the informal economy, identifying seven key dimensions: economic, legal, social, political, cultural, ethical, and labour-related.
The informal economy is complex and encounters challenges related to the economy, politics, society, and the labour market. The informal economy has grown significantly, accounting for approximately 40% of GDP in developing countries and around 17% in developed ones (Webb et al., 2009). According to the most recent International Labor Organization report on men and women working in the informal economy, more than 2 billion individuals, or over 60% of the global employed population, work informally (International Labour Organization, 2018). Informality changes slowly, especially in emerging economies, despite sustained economic development. The high informality rate and lack of working conditions limit feasible economic activities and hinder the growth of potential industries that require significant capital investments (Golman and Ernst, 2022). Treating informality as a crime without offering support or solutions merely exposes the shortcomings of today’s globalized society, which is often driven by vested interests and either lacks the tools to address these issues or misuses available resources on development projects like military expansion, infrastructure construction, and tax breaks for environmentally harmful vehicles (Luque, 2022).
These barriers hinder the growth of the private sector, as demonstrated by previous research, particularly in transition and developing economies, which examines firm characteristics and the business environment to explain firm growth (Hashi, 2001; Krasniqi, 2007; Džafić et al., 2011). While extensive research has explored specific obstacles and their impact on growth in various developing countries (Doern, 2009), only a limited number of studies (Džafić et al., 2011; Ur Rehman et al., 2019; Zylfijaj et al., 2020) have focused on the WBCs, identifying the key barriers faced by firms.
Given the existing research gap, this study aims to advance the understanding of the impact of barriers on SMEs growth, with a particular focus on the practices of the informal sector. This study employs data sourced from the World Bank’s Enterprise Performance Survey (World Bank Group, 2020). Similar to the study by Safari and Saleh (2020), the research model is based on the resource-based view (RBV) (Galbreath, 2005) and contingency theory (Beleska-Spasova, 2014). The resource-based view theory examines the origins of competitive advantage and the growth of superior firms (Bakar and Ahmad, 2010). The primary contribution of the resource-based view is its emphasis on sustainable competitive advantage, which enables firms to maximize their returns (Galbreath, 2005). Moreover, contingency theory is used because internal and external environmental factors should be considered to promote firm growth (Beleska-Spasova, 2014).
The remainder of this study is structured as follows. Through a comprehensive review of existing literature, this research examines all obstacles confronting SMEs within the distinctive contexts of the WBCs. The first section provides an overview of SMEs within the WBCs, focusing on the barriers to their growth and development. The research systematically identifies and analyses challenges that SMEs encounter within each WBCs, employing a probit regression model. The empirical findings subsequently offer potential solutions and policy recommendations, aiming to formulate a shared SMEs growth strategy that could improve both SMEs and the overall economic performance of these nations. It concludes with practical and policy implications derived from the empirical findings.
In 2020, SMEs accounted for 99.7% of all enterprises in the WBCs, with a predominant share being micro enterprises (90.1%). This trend indicates a rising number of SMEs per resident, suggestive of an improving entrepreneurial culture and a potentially enhanced business climate, with simplified firm start-up procedures and initiatives combating informality. Notably, the highest proportion of SMEs per population is in Montenegro, followed by Serbia (OECD, 2023).
Enterprises within the WBCs predominantly exhibit a pronounced orientation towards service-oriented activities, with SMEs being heavily concentrated in sectors such as wholesaling, transportation, lodging and food, and real estate. The preponderance of SMEs within the manufacturing domain spans over 13% of all businesses throughout the region, with North Macedonia demonstrating the highest proportion at 24.7% (OECD, 2023).
Despite confronting challenges over the past three years, the economies of WBCs have shown improvement across 11 out of 12 policy areas, according to the 2022 Small Business Act (SBA) assessment (OECD, 2022). This progress indicates their ongoing commitment to cultivating an environment that supports SMEs. They have excelled in public procurement, standards, technical regulations, internationalization, support services for SMEs, and the institutional and regulatory framework for SMEs policymaking. However, the region has yet to effect improvements in several policy areas, including enterprise skills, innovation policy for SMEs, bankruptcy and second-chance policies, and the integration of SMEs into a green economy (OECD, 2023).
Across the WB region, SMEs identify the main challenges to growth as inadequate training and advisory services, limited market information, and restricted access to finance (Regional Cooperation Council, 2021). These difficulties were further aggravated by the COVID-19 pandemic, leaving SMEs especially susceptible to the crisis’s far-reaching consequences. The transition of Business Support Services (BSS) to online platforms, necessitated by the pandemic, proved to be disadvantageous to smaller and less connected SMEs, given the reliance of many BSS offerings on in-person interactions. Nevertheless, the shift to digital platforms has resulted in efficiencies for some SMEs by reducing travel expenses. BSS played a crucial role in overcoming barriers by offering training and mentorship to firms (OECD, 2023).
Internal factors, predominantly under the company’s control, play a crucial role in its growth. These factors must strategically align with the external business environment to optimize firm performance. Internal factors influencing SMEs growth include age, sector, location, size, workforce education and training, and management practices. Firms operating in one sector may grow faster than those operating in another, influencing firm growth rates. Size is related to the employment levels of the firm, where small firms grow faster than larger ones, except for sole proprietorships (Storey, 1994). According to Nunes et al. (2013), age and size function as limiting factors in the growth of young SMEs, but these factors are not significant in the growth of older SMEs.
Furthermore, Anggadwita and Mustafid (2014) found that the competencies of human resources have a significant and positive impact on the performance of SMEs. Wang et al. (2007) emphasize the importance of strategic planning in SMEs, arguing that it facilitates firm growth. Additionally, Wang (2016) suggests that critical determinants of firm characteristics include size, age, growth rate, and ownership. A study conducted by Cowling et al. (2018) presents evidence demonstrating the relationship between firm age and growth. Idris et al. (2023) found a positive and significant relationship between training and SMEs performance using large-scale data from UK SMEs. A study based on a comprehensive survey of Indian firms finds that firms with international quality certification perceive fewer obstacles compared to those without such certification (Ali and Yusuf, 2021).
2.2.2.1 Access to Finance
A predominant challenge confronting SMEs in the WBCs in entrepreneurship is the issue of access to financing (OECD, 2023). A thorough analysis of the literature about emerging nations revealed that the predominant barrier to SMEs growth is access to finance (Zylfijaj and Nikoloski, 2021; OECD, 2023). The unfavourable business environment in developing countries contributes to the challenges faced by SMEs when seeking financing (Hashi, 2001). The results of the study conducted by Krasniqi (2010) indicate that high interest rates, stringent collateral requirements, and short payment terms significantly hinder access to financing, thereby posing a barrier to the expansion of small businesses. In the context of Serbia, financial access barriers are caused by a lack of microfinance organizations and inadequate assistance from the banking industry, which tends to regard SMEs as businesses that will fail within five years (Hadžić and Pavlović, 2016).
2.2.2.2 Labour
SMEs require access to a skilled and motivated labour pool to sustain their growth. As Hellriegel et al. (2008) noted, managerial competencies encompass the knowledge, abilities, behaviours, and attitudes that underpin individual effectiveness. The survival and expansion of newly established SMEs heavily depend upon the possession of managerial competencies; however, many of them fail due to the lack of requisite skills and competencies (Martin and Staines, 1994). Hiring qualified labour is costly and difficult for SMEs (Mahadea, 2008). The absence of a suitably qualified labour force emerges as a significant barrier for SMEs, particularly in light of the introduction of new technologies and the need for managerial and entrepreneurial abilities (Mamman et al., 2007).
2.2.2.3 Infrastructure
Infrastructure development plays a significant role in either helping or hindering SMEs growth, according to Džafić et al. (2011), who characterize it as an external determinant of firm growth. The quality of infrastructure, including roads, bridges, energy, sewerage, electrical grids, and telecommunications, impacts the growth of SMEs (Akinyele et al., 2016). Notably, the competitiveness and productivity of SMEs have been affected by poor infrastructure (Igwe, 2016), particularly in rural areas where transport costs for inputs and product shipping are higher due to the poor condition of roads (Kubíčková et al., 2017). Firms in the WBCs face administrative barriers that are costly for doing business, including difficulties in getting electricity and construction permits, paying taxes, enforcing contracts, or resolving insolvency (Bartlett et al., 2022).
2.2.2.4 Tax Rate, Customs, and Trade Regulations
SMEs are particularly harmed by a regulatory environment that is overly burdened with regulations and barriers to business start-up and operation. Taxation, regulations, rules, and procedures, as well as institutional growth, are essential to the overall consolidation of the economy (Aidis and Estrin, 2006). The transitional setting of SMEs in developing countries is characterized by a dynamic legislative framework, a high degree of bureaucratic procedures, and a lack of management expertise in the private sector, stemming from the legacy of communism (Smallbone and Welter, 2001). These circumstances necessitate reliance on interpersonal connections and networks, prompting them to engage in the informal economy. Moreover, tax payments and registration licenses that new SMEs must obtain pose challenges caused by regulatory constraints (Hashi, 2001). Newly established SMEs believe that the government needs to provide them with adequate assistance (Siringoringo et al., 2009). The prominent issues that hinder firm growth in WBCs include tax rates and tax administration, while customs and trade regulations are a major problem for many exporters (Sanfey and Milatovic, 2018). Gómez et al. (2023) argue that the non-coordinated approach of WBCs to trade facilitation reforms hinders welfare and growth.
2.2.2.5 Practices of the Informal Sector
The predominant obstacle to the market has been attributed to informal sector operations for many years. Godfrey (2011) enumerates several informal economy participants, including individuals and SMEs. The fact that their transactions are being carried out in an unregulated manner unites them all, affecting both developed and developing nations, with the latter accounting for 17% of GDP in developed nations and 40% in developing nations (Webb et al., 2009). In the WBCs, informal practices arise as a reaction to the shortcomings of formal institutions, such as new laws, agencies, and procedures introduced through top-down political reforms (SSES, 2019). Informality is widely driven by corruption, weak institutions and regulatory environments, insufficient enforcement capacity of the public authorities, and low awareness of its negative social implications (SELDI, 2022). The INFORM project’s findings reveal that informality is a prevalent phenomenon in the WB region (SSES, 2019), with a prevalence three times higher than the average EU level since 2008 (OECD, 2023). Thus, it is crucial to understand how these societies truly operate in bridging the gaps between formal legal frameworks and actual informal practices (SSES, 2019).
Over the last century, emerging countries have experienced rapid urban growth, resulting in the emergence of alternative income-generating means and the development of an informal economy. Informal businesses often engage in tax evasion and illegal labour practices, and as a result, they are not subject to the same societal regulations as formal businesses (Golman and Ernst, 2022). They are economic activities conducted by unregistered businesses or those operating under the radar, hidden from taxation (Godfrey, 2011). Chowdhury (2005) highlights the core features of the informal sector, including irregular payments, weak rule of law, political instability, and corruption. The primary objective of informal businesses is to secure their survival rather than make large profits. In addition, the workforce is primarily composed of family members, characterized by low capital investment, outdated technology, and small-scale operations (Tokman, 2007). Nevertheless, when unregulated financing costs increase more than fixed expenses, taxes, and registration fees, businesses decide to turn to the formal sector, where they may be more productive.
The dualist view divides the economy into two distinct sectors, formal and informal, which are seen as entirely separate. Dualists argue that economic development would either transform or absorb the informal sector into the formal economy (Bacchetta et al., 2009). However, critics from the structuralist perspective highlight the interconnections between these sectors, viewing them as a continuum of economic activities. In this view, the informal sector comprises micro-firms and workers that reduce input and labour costs, thereby enhancing the competitiveness of larger firms (Tokman, 1978). Meanwhile, the voluntarist view regards informal firms as small units that opt for informality to evade taxes and costly regulations, weighing the costs and benefits of operating outside formal institutions (Maloney, 2004).
2.2.2.6 Corruption
A universal phenomenon that affects various entrepreneurial domains is corruption. According to Williams et al. (2017b), the impact of corruption on entrepreneurship is primarily attributed to weak institutions and complicated procedures and legal frameworks, especially in the WB region (Budak and Rajh, 2014). Corruption is high in transition economies due to the continuous changes in the legal environment (Xheneti and Bartlett, 2012). Gaviria (2002) highlights that bureaucracy and regulatory compliance issues are frequently connected to SMEs’ engagement in corruption. Due to the limited bargaining power, SMEs cannot resist demands for unofficial payments and similar solicitations.
The business environment and firm growth are closely related; if the business climate is unfavourable, the firm’s ability to grow will be limited (Herrera and Kouamé, 2017). Herein, the business environment is the collection of factors encompassing strategies, institutions, and laws that influence and spur an organization’s growth, employment creation, and productivity (Igwe, 2016). Within the context of transition economies, SMEs play a transformative role by reducing labour force surpluses, establishing and reorganizing economic sectors, and effecting changes in social structures (Smallbone and Welter, 2001).
The conceptualization of firm growth dates back to the 1930s, when it was known as the Law of Proportionate Effect, commonly referred to as Gibrat’s Law of Proportionate Growth. This framework is used to determine firm growth, which is independent of the firm’s size (Rosli and Sidek, 2013). Sales growth is an exceptionally reliable and commonly used indicator due to its ease of measurement and higher likelihood of accurate recording (Barringer et al., 2005).
While previous studies have identified obstacles that SMEs face, there is a need for more empirical observations of the specific impacts on SMEs growth, particularly within transitional nations (Aidis and Estrin, 2006; Budak and Rajh, 2014; Bartlett et al., 2022). Based on the theories outlined above, this research aims to answer the primary question: “What are the key obstacles to SMEs’ growth in WBCs?” To evaluate what the literature indicates about obstacles within the context of WBCs, the following hypotheses have been formulated:
H1: Business environment barriers significantly influence sales growth.
H2: Firm characteristics significantly influence sales growth.
Fig. 1 presents the study’s conceptual framework. The framework illustrates the relationship between business obstacles, firm characteristics, and sales growth.
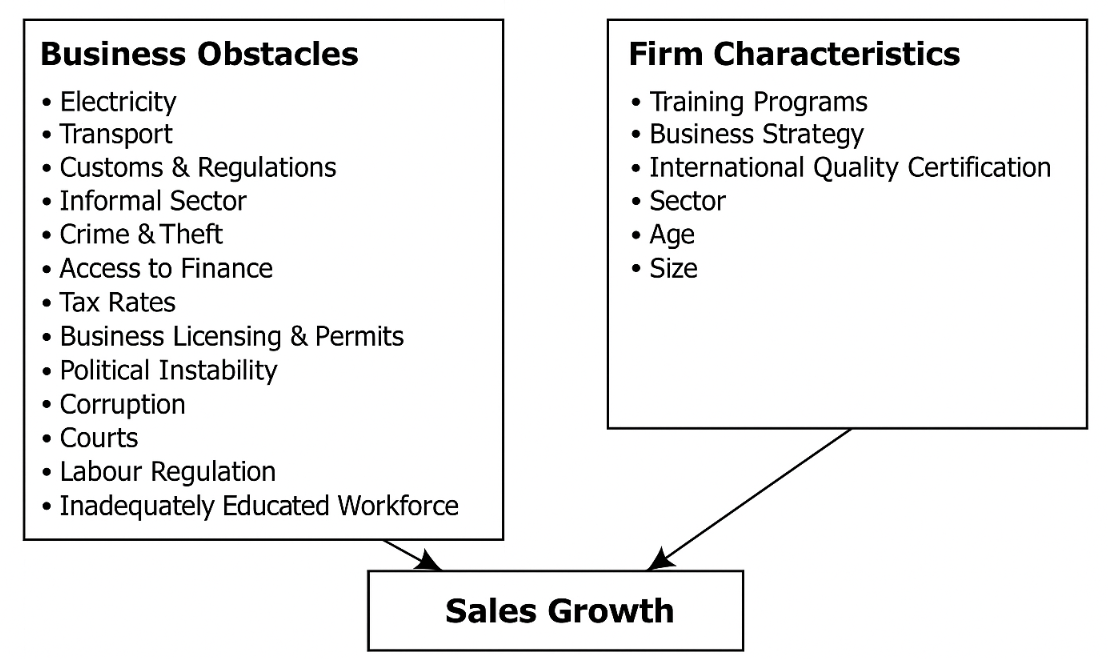 Fig. 1.
Conceptual framework.
The study employs an empirical approach, utilizing primary research data from the sixth round of the Enterprise Performance Survey on WBCs (BEEPS VI), conducted in 2019–2020. The survey was part of a joint project of the European Bank for Reconstruction and Development (EBRD), the European Investment Bank (EIB), and the World Bank Group (WBG). The BEEPS VI survey focuses on capturing the experiences and perceptions of firms regarding the business environment, infrastructure, access to finance, governance, and firm performance across the WBCs. The survey collects anonymous responses from top managers, offering valuable firm-level information on firm growth and insights into firm barriers. A previous study has also utilized this dataset (Bartlett, 2023). It offers a more comprehensive and detailed dataset suitable for our research purposes.
More precisely, the study seeks to identify barriers to the growth of the private sector, aligning with the ultimate goal of increased employment and economic growth. Given the cross-country nature of the data, cultural differences may concern the quality of the data. Nevertheless, this survey provides a valuable opportunity for benchmarking across diverse national contexts. Our sample covers six WBCs. Table 1 presents the distribution of firms included in the sample, classified by country and sector (services vs. manufacturing). The total sample consists of 1859 firms from six WBCs. Specifically, Albania accounts for 20.3% of the total sample, followed by Bosnia and Herzegovina (19.5%), Kosovo (14.6%), North Macedonia (19.3%), Montenegro (6.9%), and Serbia (19.4%).
| Country | Sector | |||||
| Country | Frequency | Percent | Service | Percent | Manufacturing | Percent |
| Albania | 377 | 20.3% | 119 | 13% | 258 | 27% |
| Bosnia & Herzgovina | 362 | 19.5% | 241 | 26% | 121 | 13% |
| Kosovo | 271 | 14.6% | 135 | 15% | 136 | 15% |
| North Macedonia | 360 | 19.3% | 122 | 13% | 238 | 25% |
| Montenegro | 128 | 6.9% | 59 | 7% | 69 | 7% |
| Serbia | 361 | 19.4% | 237 | 26% | 124 | 13% |
| Total | 1859 | 100% | 913 | 100% | 946 | 100% |
Regarding sectoral distribution, the sample is relatively balanced, with 913 firms (49%) operating in the service sector and 946 firms (51%) in the manufacturing sector. In Albania and North Macedonia, manufacturing firms are more prevalent, accounting for 27% and 25% of the total sample, respectively. In contrast, Bosnia and Herzegovina and Serbia have a higher concentration of service sector firms, accounting for 26% and 25%, respectively, of the total sample.
Table 2 illustrates the distribution of firms across six WBCs based on their size. Firms are categorized as small, medium, or large according to the number of employees, following standard classification criteria. The results indicate that small firms (767) constitute the largest proportion of the sample (41.3%), followed by medium-sized firms (32.9%) and large firms (25.9%). Notably, Kosovo has the lowest proportion of large firms (4%), while Bosnia and Herzegovina and Serbia each report relatively higher shares of large firms (23%).
| Country | Small Firms | Percent | Medium Firms | Percent | Large Firms | Percent |
| Albania | 156 | 20% | 117 | 19% | 104 | 22% |
| Bosnia & Herzegovina | 130 | 17% | 123 | 20% | 109 | 23% |
| Kosovo | 146 | 19% | 104 | 17% | 21 | 4% |
| North Macedonia | 142 | 19% | 119 | 20% | 99 | 20% |
| Montenegro | 52 | 7% | 38 | 6% | 38 | 8% |
| Serbia | 141 | 18% | 110 | 18% | 110 | 23% |
| Total | 767 | 100% | 611 | 100% | 481 | 100% |
This section outlines the dependent and independent variables employed for this study. The SMEs’ growth in terms of sales is the dependent variable, and the challenges they face in achieving this growth are the independent variables. Evaluating many independent variables provides a more accurate business development presentation (Wiklund et al., 2009). The questionnaire consists of questions that enable us to specify the variables of interest, as outlined in the literature review. As specified in the questionnaire, obstacles to the business environment are reported based on the respondents’ perceptions of these issues. To scale their perception, the Likert scale was applied with the following modalities: 0—no obstacle, 1—minor obstacle, 2—moderate obstacle, 3—major obstacle, and 4—very severe obstacle. We also include model control variables as dummy variables, which refer to the organizational competencies of the firms. The dependent variable, based on the respondents’ predictions, is derived from the question: Considering the following year, are this establishment’s total sales expected to increase, decrease, or stay the same? The answers decreased and stayed the same were coded, not growth. Therefore, we have a dummy sales variable: 1—growth and 0—no growth.
Table 3 shows descriptive statistics related to the perceived obstacles to sales growth in the context of the WBCs. These factors encompass aspects such as infrastructure (electricity, transport), regulatory environment (customs and trade regulations, tax administration), market dynamics (practices of competitors in the informal sector, inadequately educated workforce), governance issues (corruption, political instability), and internal organizational characteristics (sector, firm size, age of the firm, formal training programs, written business strategy, and international recognized quality certification).
| Western Balkans | ||||
| Variables definition | Min | Max | Mean | Std. Dev. |
| Sales (1—growth; 0—no growth) | 0 | 1 | 0.38 | 0.337 |
| Electricity (0—no obstacle; 1—minor to very severe obstacle) | 0 | 1 | 0.58 | 0.492 |
| Transport (0—no obstacle; 1—minor to very severe obstacle) | 0 | 1 | 0.45 | 0.498 |
| Customs and trade regulations (0—no obstacle; 1—minor to very severe obstacle) | 0 | 1 | 0.44 | 0.497 |
| Practices of competitors in the informal sector (0—no obstacle; 1—minor to very severe obstacle) | 0 | 1 | 0.65 | 0.476 |
| Crime, theft, and disorder (0—no obstacle; 1—minor to very severe obstacle) | 0 | 1 | 0.49 | 0.500 |
| Access to finance (0—no obstacle; 1—minor to very severe obstacle) | 0 | 1 | 0.54 | 0.499 |
| Tax rate (0—no obstacle; 1—minor to very severe obstacle) | 0 | 1 | 0.71 | 0.452 |
| Tax administration (0—no obstacle; 1—minor to very severe obstacle) | 0 | 1 | 0.54 | 0.498 |
| Business licensing and permit (0—no obstacle; 1—minor to very severe obstacle) | 0 | 1 | 0.44 | 0.496 |
| Political instability (0—no obstacle; 1—minor to very severe obstacle) | 0 | 1 | 0.68 | 0.466 |
| Corruption (0—no obstacle; 1—minor to very severe obstacle) | 0 | 1 | 0.57 | 0.495 |
| Court inefficiency (0—no obstacle; 1—minor to very severe obstacle) | 0 | 1 | 0.51 | 0.500 |
| Labour regulation (0—no obstacle; 1—minor to very severe obstacle) | 0 | 1 | 0.44 | 0.497 |
| Inadequately educated workforce (0—no obstacle; 1—minor to very severe obstacle) | 0 | 1 | 0.57 | 0.495 |
| Sector (1—service; 0—others) | 0 | 1 | 0.49 | 0.500 |
| Manufacturing (1—manufacturing; 0—others) | 0 | 1 | 0.51 | 0.500 |
| Size of the firm (1—small firms, 0—Others) | 0 | 1 | 2.16 | 40.671 |
| Size of the firm (1—medium firms, 0—Others) | 0 | 1 | 1.87 | 40.682 |
| Size of the firm (1—large firms, 0—Others) | 0 | 1 | 2.28 | 49.968 |
| Age of the firm (1—1–5 years, 0—Others) | 0 | 1 | 0.14 | 0.347 |
| Age of the firm (1—6–15 years, 0—Others) | 0 | 1 | 0.33 | 0.471 |
| Age of the firm (1—16+ years, 0—Others) | 0 | 1 | 0.52 | 0.499 |
| Formal training programs (1—Yes; 0—No) | 0 | 1 | 0.41 | 0.492 |
| Written business strategy (1—Yes; 0—No) | 0 | 1 | 0.45 | 0.497 |
| Internationally recognized quality certification (1—Yes; 0—No) | 0 | 1 | 0.28 | 0.472 |
Std. Dev., Standard deviation.
The analysis reveals that 38% of SMEs anticipate sales growth, while 62% do not, indicating a notable variation across firms.
Among business environment obstacles, tax rates (0.71), political instability (0.68), and informal sector competition (0.65) are perceived as the most significant challenges. Electricity (0.58), corruption (0.57), access to finance (0.54), and tax administration (0.54) are viewed as moderate obstacles, while transport (0.45), customs and trade regulations (0.44), and labor regulations (0.44) are generally seen as minor issues. High standard deviations indicate considerable differences in how these obstacles are experienced across firms.
Regarding firm characteristics, most SMEs operate in the service sector (63%), while 37% are in the manufacturing sector. The majority are medium to large firms, with a substantial share established for 16 years or more (52%). Furthermore, 55% of firms offer formal training programs, 58% have a written business strategy, and 70% possess internationally recognized quality certifications, reflecting strong adoption of international standards among many SMEs.
We employ a probit model (Gujarati, 2004) to predict the effects of obstacles in the business environment on SMEs sales growth, using STATA/ SE 15.1 (StataCorp LLC; College Station, TX, USA) software. The probit model is specifically suited for situations where the dependent variable is binary, as in this case, SMEs sales growth in the WB is represented as a binary outcome. This model effectively captures the nonlinear relationship between the predictors and the probability of sales growth, making it an appropriate choice for this analysis. The coefficients derived from the probit model can be interpreted through their marginal effects, indicating how a one-unit change in a predictor variable influences the probability of sales growth (Wooldridge, 2019). The model incorporates a broad set of independent variables, detailed in Table 3, that reflect various dimensions of the business environment and the importance of firm characteristics. This comprehensive approach facilitates a nuanced understanding of how multiple factors collectively influence SMEs sales growth (Storey, 1994). The findings derived from the probit model can help inform targeted strategies for enhancing SMEs growth, thereby contributing to broader economic development in the WB.
Coefficients and marginal effects for all estimated equations are given in Table 4.
| Variable | Sales growth | ||
| Coefficient ( |
p-value | ||
| Business Environment Obstacles | |||
| Electricity | –0.0664363 | 0.477 | |
| Transport | –0.1234794 | 0.222 | |
| Customs and trade regulations | 0.1154157 | 0.26 | |
| Practices of competitors in the informal sector | –0.0040314 | 0.967 | |
| Crime, theft, and disorder | 0.1334495 | 0.173 | |
| Access to finance | –0.1894421 | 0.051* | |
| Tax rate | 0.0715372 | 0.544 | |
| Tax administration | –0.0635064 | 0.577 | |
| Business licensing and permits | 0.3241401 | 0.002*** | |
| Political instability | –0.0172304 | 0.877 | |
| Corruption | –0.0979257 | 0.39 | |
| Courts inefficiency | –0.013547 | 0.899 | |
| Labour regulation | –0.2168102 | 0.038** | |
| Inadequately educated workforce | 0.0772403 | 0.426 | |
| Formal training programs | 0.1040223 | 0.248 | |
| Written business strategy | 0.1284966 | 0.151 | |
| International recognized quality certification | 0.1324101 | 0.153 | |
| Sector and Firm Characteristics | |||
| Service Sector | 0.1153909 | 0.421 | |
| Manufacturing Sector | 0.1830395 | 0.272 | |
| FirmAge_New | –4.408129 | 0.99 | |
| FirmAge_Growing | –4.459042 | 0.99 | |
| FirmAge_Mature | –4.459892 | 0.99 | |
| Small firms | –0.0012903 | 0.1* | |
| Medium firms | 0.2087399 | 0.058* | |
| Large firms | 0.3445691 | 0.049** | |
| Country dummy (Albania = Reference) | |||
| Bosnia & Herzegovina | 0.9471826 | 0.000*** | |
| Kosovo | 0.5491353 | 0.001*** | |
| North Macedonia | 0.1559486 | 0.286 | |
| Montenegro | –0.9119221 | 0.000*** | |
| Serbia | 0.8054079 | 0.000*** | |
| Model fit | |||
| Log-likelihood | –592.34232 | ||
| Pseudo-R2-Nagelkerke | 0.1513 | ||
| Observations | 1804 | ||
Notes: *, **, *** Significant at 10, 5, and 1 percent levels, respectively.
We conducted probit regression analysis using the aggregate data from the WBCs, followed by separate regression analyses for each country. Table 4 presents the probit regression results examining the impact of various firm-level obstacles and characteristics on the likelihood of experiencing sales growth among firms in the WB. The sample comprises 1804 firms, and the model shows a Nagelkerke pseudo-R2 of 0.1513 with a log-likelihood of –592.34.
Table 5 presents marginal effects. Three variables emerge as statistically significant predictors of sales growth among the business environment factors. First, the effect of the variable “business licensing and permits” is estimated at around 6%, meaning that firms identifying this as an obstacle are 6% more likely to report sales growth. This suggests that firms overcoming such barriers might be better positioned or more capable. Second, the effect of the variable “labour regulation” is negative, indicating that firms identifying labour regulations as an obstacle are about 4% less likely to report sales growth. This suggests that regulatory rigidity in labour markets may constrain firm expansion.
| Variable | Sales growth | ||
| dy/dx | p-value | ||
| Business Environment Obstacles | |||
| Electricity | –0.0120057 | 0.477 | |
| Transport | –0.0223139 | 0.222 | |
| Customs and trade regulations | 0.0208567 | 0.260 | |
| Practices of competitors in the informal sector | –0.0007285 | 0.967 | |
| Crime, theft, and disorder | 0.0241156 | 0.172 | |
| Access to finance | –0.034234 | 0.051* | |
| Tax rate | 0.0129274 | 0.544 | |
| Tax administration | –0.0114762 | 0.577 | |
| Business licensing and permits | 0.0585752 | 0.002*** | |
| Political instability | –0.0031137 | 0.877 | |
| Corruption | –0.0176961 | 0.390 | |
| Courts inefficiency | –0.0024481 | 0.899 | |
| Labour regulation | –0.0391796 | 0.038** | |
| Inadequately educated workforce | 0.013958 | 0.426 | |
| Formal training programs | 0.0187978 | 0.247 | |
| Written business strategy | 0.0232206 | 0.151 | |
| International recognized quality certification | 0.0239278 | 0.152 | |
| Sector and Firm Characteristics | |||
| Service Sector | 0.0208522 | 0.421 | |
| Manufacturing Sector | 0.033077 | 0.272 | |
| FirmAge_New | –0.7965904 | 0.990 | |
| FirmAge_Growing | –0.8057908 | 0.990 | |
| FirmAge_Mature | –0.8059445 | 0.990 | |
| Small firms | –0.0002332 | 0.100 | |
| Medium firms | 0.0377213 | 0.058* | |
| Large firms | 0.0622669 | 0.049** | |
| Country dummy (Albania = Reference) | |||
| Bosnia & Herzegovina | 0.155 | 0.000*** | |
| Kosovo | 0.111 | 0.001*** | |
| North Macedonia | 0.038 | 0.293 | |
| Montenegro | –0.309 | 0.000*** | |
| Serbia | 0.142 | 0.000*** | |
| Observations | 1804 | ||
Notes: *, **, *** Significant at 10, 5, and 1 percent levels, respectively. dy/dx, Marginal effects.
“Access to finance” shows a marginally negative effect, indicating that firms identifying it as an obstacle are about 3% less likely to report sales growth. This highlights the persistent challenge of securing credit for firms seeking to expand their operations. Other commonly cited barriers, such as electricity, transportation, customs regulations, and corruption, did not significantly impact sales growth.
Firm size plays an important role in sales performance. Medium-sized firms are about 3.8% more likely to report sales growth compared to micro and small firms, while large firms are 6.2% more likely. This suggests that larger firms benefit from economies of scale, stronger market presence, and greater resources, which enhance their ability to grow and compete effectively.
The country-level results reveal notable differences across the region. Firms in Bosnia and Herzegovina are about 15.5% more likely to report sales growth compared to those in Albania, while firms in Kosovo and Serbia are 11.1% and 14.2% more likely, respectively. These positive differences suggest that the business environments in these countries offer more supportive conditions for firm growth, due to stronger institutional frameworks, better market opportunities, or more effective policy support. In contrast, firms in Montenegro are 30.9% less likely to report sales growth relative to firms in Albania. This suggests potential structural or institutional barriers, such as a limited market size, regulatory challenges, or weaker access to resources, that may be constraining business performance in Montenegro.
These findings suggest that regulatory and financial constraints, along with country-specific factors, have a significant influence on firm performance in the WBs. The cross-country variations highlight the importance of considering local economic and policy contexts when evaluating business growth dynamics in the region.
The aggregate regression model included country dummy variables to account for fixed differences across countries. To examine potential heterogeneity, separate regressions were then conducted for each country, as presented in Table 6 (regression estimates) and Table 7 (marginal effects). This approach enables the coefficients of the explanatory variables to vary across countries, providing deeper insights into how specific barriers affect firm growth within different national contexts.
| Variables | Albania | Bosnia and Herzegovina | Kosovo | Montenegro | North Macedonia | Serbia | ||||||
| Sales growth | Sales growth | Sales growth | Sales growth | Sales growth | Sales growth | |||||||
| Coef. | p |
Coef. | p |
Coef. | p |
Coef. | p |
Coef. | p |
Coef. | p | |
| Electricity | –0.277 | 0.181 | 0.463 | 0.130 | 0.684 | 0.006*** | –0.104 | 0.590 | 0.188 | 0.511 | ||
| Transport | –0.060 | 0.764 | –0.121 | 0.753 | 0.022 | 0.964 | 0.081 | 0.768 | –0.316 | 0.136 | –0.080 | 0.799 |
| Customs and trade Regulations | 0.203 | 0.302 | –0.039 | 0.922 | –0.304 | 0.509 | 0.399 | 0.163 | 0.166 | 0.455 | –0.061 | 0.842 |
| Informal Sector | 0.205 | 0.320 | 0.338 | 0.318 | 0.902 | 0.100* | –0.186 | 0.472 | –0.314 | 0.136 | –0.158 | 0.616 |
| Crime Theft Disorder | 0.062 | 0.755 | 0.264 | 0.433 | –1.121 | 0.048** | 0.618 | 0.043** | 0.246 | 0.212 | –0.164 | 0.606 |
| Access to Finance | –0.139 | 0.483 | –0.282 | 0.384 | 0.005 | 0.993 | –0.571 | 0.028** | –0.091 | 0.639 | –0.090 | 0.781 |
| Tax Rates | 0.564 | 0.077* | 0.887 | 0.042** | 0.077 | 0.892 | 0.112 | 0.678 | –0.372 | 0.090* | 0.023 | 0.947 |
| Tax Administrations | –0.399 | 0.076* | –0.240 | 0.594 | –0.217 | 0.705 | –0.106 | 0.649 | 0.756 | 0.035** | ||
| Business Licensing Permits | 0.632 | 0.001*** | –0.107 | 0.768 | 1.352 | 0.004*** | –0.107 | 0.655 | –0.035 | 0.915 | ||
| Political Instability | 0.183 | 0.418 | –0.506 | 0.289 | –0.615 | 0.273 | 0.108 | 0.636 | –0.045 | 0.890 | ||
| Corruption | –0.350 | 0.176 | 0.132 | 0.721 | 0.758 | 0.169 | –0.108 | 0.654 | 0.411 | 0.244 | ||
| Courts | –0.212 | 0.320 | –0.895 | 0.038** | –0.888 | 0.092* | 0.290 | 0.230 | –0.175 | 0.599 | ||
| Labour Regulations | –0.178 | 0.343 | –0.279 | 0.435 | –0.713 | 0.177 | 0.095 | 0.681 | –0.522 | 0.139 | ||
| Inadequately Educated Workforce | –0.133 | 0.469 | 0.202 | 0.559 | 0.598 | 0.233 | 0.062 | 0.759 | –0.226 | 0.487 | ||
| Training Programs | 0.013 | 0.940 | –0.038 | 0.900 | 0.565 | 0.113 | 0.093 | 0.624 | 0.388 | 0.206 | ||
| Business Strategy | 0.213 | 0.302 | 0.163 | 0.588 | 0.523 | 0.068* | 0.166 | 0.383 | –0.069 | 0.803 | ||
| International recognized quality certification | 0.100 | 0.653 | 0.471 | 0.202 | –0.818 | 0.026** | 0.256 | 0.281 | 0.270 | 0.398 | ||
| Service | 0.327 | 0.101 | –0.222 | 0.391 | 0.406 | 0.042** | 0.106 | 0.730 | ||||
| Manufacturing | 0.130 | 0.698 | ||||||||||
| Firm Age New | 0.178 | 0.431 | –0.391 | 0.393 | 0.117 | 0.769 | –2.316 | 0.990 | –3.029 | 0.991 | ||
| Firm Age Growing | 0.121 | 0.539 | –0.664 | 0.035** | –0.480 | 0.088* | –2.591 | 0.989 | –3.056 | 0.990 | ||
| Firm Age_Mature | –2.445 | 0.989 | –3.352 | 0.990 | ||||||||
| Small firms | –0.473 | 0.039** | –0.345 | 0.365 | –0.441 | 0.096* | –0.138 | 0.603 | 0.300 | 0.426 | ||
| Medium firms | 0.133 | 0.601 | –0.026 | 0.950 | –0.105 | 0.693 | 0.221 | 0.542 | ||||
| Log-likelihood | –155.879 | –53.374 | –67.517 | –78.159 | –138.313 | –57.347 | ||||||
| Pseudo-R2-Nagelkerke | 0.123 | 0.186 | 0.187 | 0.117 | 0.091 | 0.125 | ||||||
| N | 376 | 362 | 267 | 128 | 360 | 361 | ||||||
Notes: *, **, *** Significant at 10, 5, and 1 percent levels, respectively. Coef., Coefficient.
| Variables | Albania | Bosnia and Herzegovina | Kosovo | Montenegro | North Macedonia | Serbia | ||||||
| dy/dx | p |
dy/dx | p |
dy/dx | p |
dy/dx | p |
dy/dx | p |
dy/dx | p | |
| Electricity | –0.064 | 0.179 | 0.036 | 0.137 | 0.238 | 0.002 | –0.022 | 0.590 | 0.016 | 0.512 | ||
| Transport | –0.014 | 0.764 | –0.009 | 0.753 | 0.003 | 0.964 | 0.028 | 0.768 | –0.067 | 0.135 | –0.007 | 0.799 |
| Customs and trade Regulations | 0.047 | 0.301 | –0.003 | 0.922 | –0.042 | 0.508 | 0.139 | 0.154 | 0.035 | 0.454 | –0.005 | 0.842 |
| Informal Sector | 0.047 | 0.318 | 0.026 | 0.321 | 0.125 | 0.100* | –0.065 | 0.469 | –0.067 | 0.134 | –0.013 | 0.616 |
| Crime Theft Disorder | 0.014 | 0.754 | 0.020 | 0.435 | –0.155 | 0.048** | 0.215 | 0.033** | 0.052 | 0.211 | –0.014 | 0.607 |
| Access to Finance | –0.032 | 0.483 | –0.022 | 0.387 | 0.001 | 0.993 | –0.199 | 0.020** | –0.019 | 0.639 | –0.008 | 0.782 |
| Tax Rates | 0.130 | 0.075* | 0.069 | 0.046** | 0.011 | 0.892 | 0.039 | 0.678 | –0.079 | 0.088* | 0.002 | 0.947 |
| Tax Administrations | –0.092 | 0.073* | –0.019 | 0.594 | –0.030 | 0.706 | –0.022 | 0.649 | 0.063 | 0.044** | ||
| Business Licensing Permits | 0.146 | 0.001*** | –0.008 | 0.768 | 0.187 | 0.004*** | –0.023 | 0.655 | –0.003 | 0.915 | ||
| Political Instability | 0.042 | 0.417 | –0.039 | 0.293 | –0.085 | 0.272 | 0.023 | 0.636 | –0.004 | 0.890 | ||
| Corruption | –0.081 | 0.173 | 0.010 | 0.721 | 0.105 | 0.167 | –0.023 | 0.654 | 0.034 | 0.250 | ||
| Courts | –0.049 | 0.319 | –0.069 | 0.045** | –0.123 | 0.091* | 0.061 | 0.227 | –0.015 | 0.599 | ||
| Labour Regulations | –0.041 | 0.342 | –0.022 | 0.437 | –0.099 | 0.175 | 0.020 | 0.681 | –0.044 | 0.147 | ||
| Inadequately Educated Workforce | –0.031 | 0.468 | 0.016 | 0.561 | 0.083 | 0.230 | 0.013 | 0.759 | –0.019 | 0.489 | ||
| Training Programs | 0.003 | 0.940 | –0.003 | 0.900 | 0.078 | 0.112 | 0.020 | 0.624 | 0.032 | 0.213 | ||
| Business Strategy | 0.049 | 0.301 | 0.013 | 0.587 | 0.072 | 0.071* | 0.035 | 0.383 | –0.006 | 0.803 | ||
| International recognized quality certification | 0.023 | 0.653 | 0.036 | 0.208 | –0.113 | 0.025** | 0.054 | 0.280 | 0.023 | 0.402 | ||
| Service | 0.076 | 0.099* | –0.031 | 0.390 | 0.086 | 0.040** | 0.009 | 0.731 | ||||
| Manufacturing | 0.010 | 0.698 | ||||||||||
| Firm Age New | 0.041 | 0.430 | –0.030 | 0.395 | 0.016 | 0.769 | –0.490 | 0.990 | –0.253 | 0.991 | ||
| Firm Age Growing | 0.028 | 0.538 | –0.051 | 0.041** | –0.067 | 0.089* | –0.548 | 0.989 | –0.255 | 0.990 | ||
| Firm Age Mature | –0.517 | 0.989 | –0.280 | 0.990 | ||||||||
| Small firms | –0.109 | 0.037** | –0.027 | 0.369 | –0.061 | 0.098 | –0.029 | 0.603 | 0.025 | 0.428 | ||
| Medium firms | 0.031 | 0.601 | –0.002 | 0.950 | –0.022 | 0.693 | 0.018 | 0.543 | ||||
Notes: *, **, *** Significant at 10, 5, and 1 percent levels, respectively.
Key variables such as electricity (Montenegro), crime (Kosovo and Montenegro), access to finance (Montenegro), tax rates (Bosnia and Herzegovina), tax administration (Serbia), and business licensing (Albania and Kosovo) remain significant in both models, affirming their robust association with SMEs sales growth across the WB. Based on marginal effects for individual countries, obstacles related to electricity have been positively correlated with sales growth in Montenegro. A one-unit increase in the perception of electricity as a business obstacle increases the likelihood of sales growth by 23.8%, holding other factors constant. A comparable study on the impact of inadequate electricity supply on SMEs growth found that the unreliable electricity supply and its high tariffs negatively impacted the quantity and quality of production, resulting in low sales and profitability (Forkuoh and Li, 2015). Moreover, Akinyele et al. (2016) emphasize the importance of infrastructure, including electricity, as a supporting framework for the expansion of SMEs.
Transport and regulatory constraints in customs and trade did not significantly influence sales growth in WBCs. Nevertheless, firm growth is impeded by a legal, social, and fiscal framework that does not encourage the exchange of moral principles, particularly for small enterprises, which are then compelled to make tactical short-term concessions (Lorizio and Gurrieri, 2016). In transition economies, where higher levels of regulation are required, the incidence of bribery is also likely to be higher (Djankov et al., 2002).
Informal sector practices reveal a significant value related to Kosovo’s sales growth. The marginal effect for this variable suggests that it is subject to competitive pressure from unregistered firms. Informal sector activity often undermines formal sector activity, which is required to comply with regulations and pay taxes (Williams, 2005). However, while the informal sector primarily operates in marginalized contexts, providing self-employment and basic livelihoods, its formalization is essential for enhancing growth prospects and ensuring long-term sustainability (Zylfijaj et al., 2020).
In Kosovo and Montenegro, crime, theft, and disorder have had a significant impact, indicating that security concerns are a real impediment to growth. The overall results indicate that criminal activity is negatively associated with the performance of SMEs. The high incidence of crime affecting small firms and its adverse impact on their performance underscores the importance of collaboration between the government and the business sector in establishing effective and affordable security solutions tailored to small enterprises. Supporting these businesses is crucial for promoting economic growth and creating employment opportunities (Moyo, 2012). Access to finance is negatively related to sales growth in Montenegro. It indicates that the probability of experiencing sales growth decreases by 19.9% for every one-unit increase in the perceived severity of access to finance as an obstacle. The most significant barrier for businesses is the high cost of funding, which includes interest rates and bank-imposed administrative expenses (Zylfijaj and Nikoloski, 2021).
The tax rate is highly significantly related to the sales growth of Bosnia and Herzegovina, North Macedonia, and Albania. In Bosnia and Herzegovina and Albania, firms that perceive the tax rate as a more severe obstacle are likely to experience sales growth, possibly because better-performing firms report higher taxes, holding other factors constant. In North Macedonia, firms are 7.9% less likely to experience sales growth for each additional severity level in the tax rate as an obstacle. Most SMEs perceive their tax liability as a growing burden; as a result, they frequently have to pay extra taxes, as they require more competent personnel to address tax compliance concerns. Abrie and Doussy (2006) argue that there is a need to increase awareness of available services and tax incentives for SMEs to mitigate this burden.
Perceptions of tax administration were significantly negative in Albania
(
Political instability did not significantly affect sales growth in any country. Although a study has demonstrated the significance of SMEs for economic growth, impediments to SMEs development are frequently caused by government regulations and political instability (Tambunan, 2009). If entrepreneurs encounter an unfavourable environment for growing their businesses due to political instability and cultural impediments, it could lead to a decline in the growth of small businesses (Ahmed et al., 2015).
Instances of corruption manifest non-significant values in WBCs. Nevertheless, the effects of corruption on the business environment and how competition across enterprises is distorted have been extensively researched in the literature (Mauro, 1995). Nevertheless, Djankov et al. (2002) argue that an excessive number of rules and procedures within the regulatory environment not only delays and deters businesses but also acts as a catalyst for the emergence of informal operations. In a study by Budak and Rajh (2014), respondents who perceive corruption as a significant barrier to their business place more emphasis and responsibility on the government’s response to the issue, rather than taking individual measures against corruption as a business.
Court inefficiency has a negative impact on sales growth in Bosnia and Herzegovina and Kosovo, indicating that firms that perceive court inefficiency as a significant obstacle are less likely to experience sales growth, holding other factors constant. Firm growth is further hampered by a legal, social, and fiscal framework, particularly for small enterprises. Thus, actions should be taken to address the issues with the judicial system and establish clear connections between justice and competitiveness (Lorizio and Gurrieri, 2016). Labour regulations did not significantly affect growth in any of the countries. While coefficients were generally negative (Kosovo, Serbia), the results suggest labour rigidity may not be the most binding constraint.
Moreover, firms that perceived an inadequately educated workforce as a more significant obstacle did not experience a significant impact on sales growth in any of the countries. Formal education is key to developing human capital and personal attributes, while educational reforms are crucial for equipping the workforce with the essential skills it needs to succeed (Cooper et al., 1994; Nikoloski et al., 2024). Hypothesis 1, that business environment barriers significantly impact sales growth, is partially confirmed.
Firm characteristics also play a significant role in determining firm growth. The results show that sector affiliation is positively associated with sales growth in Albania and North Macedonia. Specifically, firms in the service sector (7.6% in the case of Albania and 8.6% in the case of North Macedonia) are more likely to experience sales growth compared to firms in the manufacturing sector. A previous study has largely focused on manufacturing firms (Menor et al., 2002). Several studies highlight the significance of the service sector (Gianiodis et al., 2010; Rodríguez-Gutiérrez et al., 2015). Still, Thornhill (2006) emphasizes that firms can exhibit growth based on industry dynamism, regardless of the industry in which they operate.
The firm size negatively affects sales growth in Albania and Kosovo, indicating that small firms do not outperform larger ones in terms of sales growth. Although Gibrat’s law of proportionate growth assumes no correlation between size and firm growth, another empirical study has concluded that growth decreases as firm size increases (Almus and Nerlinger, 2000).
The age of a firm, in terms of the growing firms’ category, exhibits a negative impact on sales growth in Bosnia and Herzegovina and Kosovo. Thus, these findings align with other studies that indicate a significant negative correlation between firm age and growth (Krasniqi, 2010; Coad et al., 2018). However, Garnsey et al. (2006) argue that firm age can have a positive effect on growth, suggesting that the relationship between firm age and growth may vary across different contexts.
Implementing formal training programs had no statistically significant effects,
though Kosovo again showed a strong positive coefficient (
Formulating a written business strategy is associated with positive sales growth in Kosovo, indicating that firms with a written business strategy are 7.2% more likely to experience sales growth than those without one. In line with our empirical findings, Ghobadian et al. (2008) highlight the contribution of strategic planning to firm growth. Strategic planning is perceived to contribute to a firm’s survival and growth but not necessarily its short-term performance. Moreover, business strategy has a significant impact on export performance; therefore, firms should develop effective business strategies to grow and succeed in both local and international markets (Safari and Saleh, 2020).
Additionally, possessing internationally recognized quality certifications is negatively related to sales growth in Kosovo, indicating that firms with a quality certificate are 11.3% less likely to experience sales growth than those without one. A study concludes that the certification process, based on the ISO 9000 standard, represented an evolution in managing the organization. It has been associated with cultural change in the organization, communication, and quality system (Cooper et al., 1994). Nevertheless, the challenges SMEs face with ISO standards are related to their size and scarce resources. Technical issues and challenges are often associated with high implementation costs, inadequate resources, and insufficient external assistance (Lo and Humphreys, 2000). Hypothesis 2, which is that firm characteristics significantly influence sales growth, is confirmed.
Considering that SMEs make up the majority of the economy in the WBCs, we have examined the primary barriers limiting their firm growth. As a result, this sector is crucial to the development of these nations and to their integration as EU members. SMEs growth drivers that have been included in this study are electricity, transport, customs, and trade regulations, practices of competitors in the informal sector, crime, theft and disorder, access to finance, tax rate, tax administration, business licensing, and permit, political instability, corruption, courts inefficiency, labour regulation, inadequately educated workforce, firm strategy, firm training program and internationally recognized quality standards in each WBCs. Cross-sectional data from the World Bank Survey are used in part of the analysis. Furthermore, probit regression analysis was used to test and generate empirical results. The country-specific analysis reveals notable differences in sales growth among SMEs in the WB.
The analysis of marginal effects confirms the robustness of the main regression results, with most key variables maintaining their direction and significance. Some marginal effects, particularly in Montenegro, are omitted due to multicollinearity and small sample sizes. Significant barriers to SMEs sales growth across WBCs include electricity, crime, access to finance, tax rates, tax administration, business licensing, and informality. Notably, electricity constraints in Montenegro and crime in Kosovo and Montenegro are strongly associated with sales performance, highlighting infrastructure and security concerns. Access to finance emerged as a critical constraint, particularly in Montenegro, while tax-related obstacles showed mixed effects across countries. Administrative inefficiencies in Albania contrast with supportive reforms in Serbia, indicating context-dependent outcomes. Informality, especially in Kosovo, poses competitive pressures on formal firms, further impeding growth.
Overall, the findings partially support the hypothesis that business environment barriers significantly influence SMEs sales growth in the WB, underscoring the need for targeted reforms and supportive policies to foster a more enabling business climate. These insights are crucial for policymakers and stakeholders aiming to enhance SMEs growth across the region. The empirical results suggest that enhancing the competence, capability, and productivity of SMEs becomes crucial for policymakers and researchers in achieving sustainable growth and advancement.
WBCs encounter business environment barriers, making their reduction essential for improving SMEs’ growth (Ur Rehman et al., 2019). Government intervention plays a crucial role in helping SMEs overcome barriers to growth and improve their business environment. For instance, there are numerous options for SMEs to flourish when there is a high awareness of their contribution, including simple loan applications from official financial institutions, providing training programs, helping with technology acquisition, and much more (Irjayanti and Azis, 2012). Entrepreneurial value within education is crucial for achieving long-term benefits within SMEs. Marinkovic (2015) states that the lack of promotion of an entrepreneurial culture through regional education underscores the need for institutional interventions. Potential reforms from policymakers can help achieve better regulations, institutional development, and efficient governance. Moreover, SMEs should direct their strategic emphasis toward addressing internal barriers to systematically reduce their impact on growth, leading to sustained competitive advantage.
The informal sector plays a crucial role in addressing poverty, particularly for vulnerable groups, such as women and children; therefore, more political support should be provided to this sector to facilitate its formalization. There must be a shift from a family business to a more formal labour relationship, setting aside personal ties. Additionally, it is essential to highlight the benefits of formalization, thereby increasing awareness of access to various instruments, including training, assistance, and finance. Employees should be protected by offering good working conditions, investing in their development by enhancing their skills, and expanding health and social benefits.
Given the shared challenges across the WBCs, there is a strong case for regional policy harmonization and cooperation to strengthen SMEs as a vital sector for job creation and economic growth. Firms in the WBCs should consider adjusting their strategies in response to the identified internal and external challenges, which include enhancing workforce skills to remain competitive, improving productivity, and raising quality standards.
Future studies may employ a panel data set with a larger sample size to enhance the robustness of analyses. Additionally, it is possible to undertake comparative assessments of the main barriers faced by SMEs across diverse sectors. Research could be conducted to develop specific steps for implementing possible solutions to SMEs’ barriers within WBCs.
All data reported in this paper will be shared by the corresponding author upon reasonable request.
LRM and KZ jointly conceived and designed the study, performed the data analysis and interpretation, and contributed equally to drafting and revising the manuscript. Both authors approved the final version and are fully accountable for all aspects of the work.
Not applicable.
This research received no external funding.
The authors declare no conflict of interest.
References
Publisher’s Note: IMR Press stays neutral with regard to jurisdictional claims in published maps and institutional affiliations.