


 , Yavuz Selim Balcıoğlu 2,†
1 Department of Business Administration, Institute of Social Sciences, İstanbul Beykent University, 34396 İstanbul, Turkey
2 Department of Business Administration, Faculty of Economics and Administrative Sciences, Doğuş University, 34775 İstanbul, Turkey
†These authors contributed equally.
Abstract
The findings demonstrate that digital work intensity creates significant challenges for remote employees’ well-being, with daily working hours and screen time emerging as primary predictors of increased stress and reduced work-life balance satisfaction. Physical health behaviors, particularly physical activity and adequate sleep, serve as protective factors that improve well-being and enhance productivity beyond the effects of work patterns alone. Work-life balance satisfaction acts as a critical mediating pathway, explaining approximately one-third of the relationship between work demands and productivity outcomes. The importance of well-being factors for sustaining productivity becomes more pronounced under high work demand conditions, suggesting that employee support becomes more crucial during periods of work intensification. Three distinct remote worker profiles were identified: “Balanced Performers,” who maintained sustainable work practices and high productivity; “Digital Immersers,” who worked extensively but showed moderate performance; and “Struggling Remotes,” who experienced significant well-being challenges and lower productivity. These findings highlight the critical importance of balancing digital work demands with physical health behaviors and work-life boundaries to sustain both well-being and performance in remote work environments.
Keywords
- remote work
- digital well-being
- work-life balance
- productivity
- sleep quality
- physical activity
- rganizational performance
The growing prevalence of remote work arrangements has fundamentally reshaped the relationship between employee well-being and organizational performance (Chan et al, 2023; Pabilonia and Redmond, 2024). Remote work adoption increased dramatically across all major industries between 2019 and 2021, with continued high prevalence through 2024, creating unprecedented challenges for managing digital work intensity and employee health outcomes (Lyzwinski, 2024; McPhail et al, 2023). Organizational performance, as a multidimensional construct, is shaped by both behavioral factors like employee well-being and strategic variables such as adaptability and digital infrastructure (McGivern and Tvorik, 1997).
First, there is insufficient empirical understanding of how specific digital work patterns simultaneously influence multiple dimensions of employee well-being. Most existing research examines isolated relationships between single work characteristics and individual well-being outcomes, rather than comprehensively analyzing how digital work intensity affects stress, sleep quality, and work-life balance concurrently. Second, the mechanisms through which well-being factors translate into productivity outcomes in remote work environments remain underexplored. While studies acknowledge connections between well-being and performance, limited research has investigated the mediating pathways and moderating conditions that explain these relationships in digital work contexts. Third, the heterogeneity of remote worker experiences and the need for differentiated support strategies has received minimal empirical attention. Current literature tends to treat remote workers as a homogeneous population, overlooking the possibility that distinct worker profiles may require tailored approaches to optimize both well-being and productivity.
While previous studies have examined these constructs in traditional office environments, three critical gaps in the literature warrant investigation within contemporary digital workspaces (De Paoli et al, 2019; Kingma, 2016). First, there is insufficient empirical understanding of how specific digital work patterns simultaneously influence multiple dimensions of employee well-being, particularly given emerging concerns about digital fatigue and technology-mediated work strain (Murugan and Rashadh, 2024). Most existing research examines isolated relationships between single work characteristics and individual well-being outcomes, rather than comprehensively analyzing how digital work intensity affects stress, sleep quality, and work-life balance concurrently. Second, the mechanisms through which well-being factors translate into productivity outcomes in remote work environments remain underexplored, with empirical studies demonstrating mixed and context-dependent productivity outcomes across different remote work implementations (Kurdy et al, 2023).
These knowledge gaps are particularly pronounced in Central and Eastern European organizational contexts, specifically including Poland, Czech Republic, Hungary, Slovakia, Romania, and the Baltic states (Estonia, Latvia, Lithuania), where remote work adoption has accelerated rapidly following the COVID-19 pandemic yet differs significantly from Western European and North American patterns due to distinct organizational cultures, technological infrastructure development, and work-life balance expectations. This study leverages a comprehensive dataset of 10,000 remote workers to explore the multifaceted connections between digital work patterns, physiological health indicators, psychological well-being, and productivity metrics. As psychological well-being encompasses both affective experiences and cognitive life evaluations (Schimmack, 2008), this study considers how remote work habits influence these interrelated dimensions.
Drawing upon the Job Demands-Resources model (Bakker and Demerouti, 2017) and Work-Life Border Theory (Clark, 2000), this research aims to address these critical gaps in our understanding of remote work dynamics. Specifically, this study addresses the following research questions:
RQ1: To what extent do digital work habits (daily working hours, screen time, meeting frequency, and email volume) predict employee well-being outcomes (stress levels, sleep quality, and work-life balance satisfaction)?
RQ2: What is the relationship between physical health behaviors (sleep duration and physical activity) and productivity scores among remote workers?
RQ3: How does work-life balance satisfaction mediate the relationship between work demands and employee productivity in remote work environments?
RQ4: Which combination of well-being factors serves as the strongest predictor of sustained productivity in digital workplaces, and do these relationships vary by work intensity levels?
The rise of remote work has transformed traditional employment structures and intensified the scholarly focus on the effects of digital work patterns on employee well-being and organizational outcomes. As the boundaries between work and personal life become more blurred, it is crucial to understand the psychological and behavioral consequences of digitally mediated labor. While previous studies have examined the impact of technological intensity, flexible schedules, and constant connectivity on stress levels, job satisfaction, and performance, findings remain fragmented across disciplines (Mache et al, 2020; Ren et al, 2023). To address this gap, the present review draws on two complementary theoretical frameworks that offer a coherent structure for interpreting these dynamics. First, the Job Demands–Resources (JD-R) model sheds light on how digital workloads and personal resources interact to influence well-being and productivity. Second, Work-Life Border Theory offers a lens through which to understand how individuals negotiate the increasingly permeable boundaries between work and home domains. Together, these perspectives consolidate the rapidly evolving body of remote work research into a structured, multidimensional understanding.
The JD-R model offers a comprehensive and empirically validated framework for understanding how job demands and resources interact to influence employee well-being and performance, particularly in remote work environments. According to the model, job demands such as excessive screen time, extended working hours, constant connectivity, and high email volume can lead to stress and burnout, especially when not balanced by sufficient resources like sleep, physical activity, autonomy, or recovery time (Bakker and Demerouti, 2007; Bakker et al, 2023). Empirical research has consistently demonstrated that the presence of job resources can mitigate the adverse effects of high demands and enhance productivity (Bakker et al, 2004; Crawford et al, 2010). The model is particularly relevant in digital work contexts where the intensity of online interactions may blur work-life boundaries and increase cognitive load (Bakker and Demerouti, 2017).
Schaufeli and Taris (2014) critically reviewed the JD-R model, identifying two core mechanisms: the health impairment process, where excessive demands deteriorate well-being, and the motivational process, where adequate resources foster engagement. They emphasized the model’s adaptability across diverse occupational settings and discussed the integration of personal resources—such as resilience and optimism—as buffers against job strain. Their review also highlighted the need for clearer conceptual boundaries and the investigation of reciprocal relationships between demands and resources.
Recent research has extended the model’s scope. For example, personal resources like physical activity and sleep have been shown to buffer the negative effects of digital intensity in remote work (Lesener et al, 2019). Leadership also plays a vital role in ensuring access to resources that support well-being (Tummers and Bakker, 2021). Moreover, contextual stressors such as job insecurity during COVID-19 can amplify demand-resource imbalances and reduce employee resilience (Cao et al, 2024). In this study, the JD-R model guides the investigation of how specific digital work patterns and health behaviors interact to shape productivity among remote employees. Together, these contributions underscore the model’s relevance for designing sustainable and human-centered remote work strategies. While the JD-R model offers a valuable lens for analyzing how digital work patterns influence employee well-being and productivity, it does not fully capture the spatial and psychological boundary challenges that emerge in remote work environments. As digital demands increasingly permeate personal spaces, understanding how employees manage and negotiate the boundaries between their professional and private lives becomes essential. To address this dimension, the present study also draws on Work-Life Border Theory, which provides a complementary perspective by focusing on how individuals navigate and construct the borders between work and home domains. This theoretical approach is particularly relevant in the context of remote work, where digital connectivity often disrupts conventional boundaries and reshapes the rhythm of everyday life.
Work-Life Border Theory offers a useful framework for understanding how remote employees manage the boundaries between work and personal life in digitally intensive environments. As subjective well-being is increasingly shaped by the integration—or lack thereof—of work and personal domains, understanding the boundaries that separate or blend these roles becomes critical (Diener, 1984). As Clark (2000) originally posited, individuals actively construct, maintain, and negotiate the borders between work and family domains based on role salience and boundary permeability. In remote work settings, these borders are often blurred, increasing the potential for conflict (Olson-Buchanan and Boswell, 2006). Daily transitions between roles—such as logging off from a meeting and immediately engaging in household tasks—require cognitive and emotional adjustment (Delanoeije et al, 2019). Kreiner (2006) emphasizes that the degree of fit between personal boundary preferences and organizational expectations significantly influences well-being. He identifies three strategies—segmenting, integrating, and cycling—that individuals use to manage work-home boundaries, and notes that misalignment between preferred and actual boundary management can lead to emotional exhaustion, dissatisfaction, and role confusion. Moreover, work-related technology use at home can hinder psychological detachment, a key process for recovery and sustained productivity. This study applies Work-Life Border Theory to explain how digital work conditions reshape boundary management and affect remote employee outcomes.
Work-Life Border Theory continues to evolve as scholars explore how remote work reshapes the psychological and spatial boundaries between professional and personal domains. Adisa and Gbadamosi (2021) propose the Work-Life Border Control Model, emphasizing individual agency in constructing flexible borders that resist institutional overreach. This is especially relevant in digital work environments, where constant connectivity challenges separation (Kossek et al, 2012). Karassvidou and Glaveli (2015) highlight that organizational culture plays a critical role in either facilitating or hindering effective boundary management, especially in fast-paced, performance-driven contexts. Felstead and Henseke (2017) demonstrate that the expansion of remote work intensifies the risk of blurred boundaries, reducing work-life balance and overall well-being. Complementing these findings, Allen et al (2014) argue that sustainable boundary management requires both structural support and personal alignment. Notably, Sarker et al (2018) found that asynchronous communication and cultural distance in globally distributed teams exacerbate work-life conflict, making proactive boundary negotiation essential in digital work contexts. Complementing this, Cowan and Hoffman (2007) show that employees in flexible organizations actively reconstruct the work-life border through communication and relational practices rather than rigid schedules or policies. Karwa (2025) reinforces this view by framing work-life balance as a “modern psychological dilemma”, emphasizing that the cognitive strain of navigating digital boundaries contributes significantly to burnout and disengagement in contemporary workplaces.
Recent scholarship has provided crucial insights into remote work dynamics that directly inform this study’s theoretical framework. Li et al (2025) conducted a longitudinal analysis of 3500 remote workers, demonstrating that work autonomy serves as a significant buffer against privacy violations and job dissatisfaction through stress reduction mechanisms. Their findings challenge traditional applications of the Job Demands-Resources model by revealing that personal resources may operate differently in digital environments compared to traditional workplace settings. However, their study was limited to technology sector employees, raising questions about generalizability across diverse occupational contexts that this research addresses through its multi-industry approach.
Jacobs et al (2025) investigated work-from-home arrangements across 2000 participants, identifying that flexible work hours significantly impact life satisfaction, particularly when combined with regular break-taking behaviors. Their research provides empirical support for Work-Life Border Theory’s emphasis on boundary management flexibility, yet their findings were restricted to North American samples with specific cultural expectations regarding work-life integration. This limitation highlights the need for research that examines these relationships across different cultural contexts, particularly in Central and Eastern European settings where work-life boundary expectations may differ substantially.
Karwa (2025) conceptualized work-life balance as a “modern psychological dilemma”, arguing that digital boundary navigation contributes significantly to contemporary workplace burnout. While this theoretical contribution advances understanding of psychological mechanisms underlying remote work challenges, the analysis remained primarily conceptual without empirical validation. The present study addresses this gap by providing quantitative evidence for the psychological processes Karwa identified.
These recent contributions collectively suggest that traditional theoretical models require adaptation for digital work contexts, yet significant empirical gaps remain regarding the simultaneous interaction of multiple work pattern variables, the cultural specificity of boundary management strategies, and the identification of distinct remote worker profiles requiring differentiated support approaches.
This study draws on these perspectives to explain how digital intensity and personal health behaviors jointly influence remote worker outcomes. Building upon these theoretical foundations, the present study adopts a quantitative research design to empirically examine how digital work patterns and well-being indicators interact to shape productivity outcomes among remote employees.
The inclusion of non-Western theoretical perspectives enhances the global relevance of this research framework, particularly given the international scope of remote work arrangements. Adisa and Gbadamosi’s (2021) Work-Life Border Control Model, developed through African organizational contexts, emphasizes individual agency in constructing flexible borders that resist institutional overreach. This perspective proves particularly relevant for understanding remote work dynamics in Central and Eastern European contexts, where employees navigate tensions between traditional hierarchical organizational cultures and emerging flexible work expectations.
The global nature of this study’s dataset, encompassing remote workers across multiple continents and cultural contexts, necessitates theoretical frameworks that transcend Western-centric assumptions about work-life integration. Non-Western perspectives on collective versus individual boundary management strategies provide essential theoretical grounding for interpreting findings across diverse cultural settings. These perspectives inform the study’s analytical approach by recognizing that work-life balance satisfaction may operate differently across cultural contexts, requiring nuanced interpretation of mediation and moderation effects.
Based on the theoretical integration of the Job Demands-Resources model and Work-Life Border Theory, enhanced by recent empirical developments, this study proposes a comprehensive conceptual model of remote work dynamics. The model positions digital work patterns (daily working hours, screen time, meeting frequency, email volume) as job demands that directly influence well-being outcomes (stress levels, sleep duration, work-life balance satisfaction). Physical health behaviors (physical activity, sleep duration) function as personal resources that moderate the relationship between job demands and well-being while directly predicting productivity outcomes.
Work-life balance satisfaction serves as a critical mediating variable, transmitting the effects of work demands through boundary management processes to influence productivity. The model incorporates work intensity as a key moderating variable that amplifies the importance of well-being factors under high-demand conditions. This framework acknowledges the heterogeneity of remote worker experiences by proposing that distinct employee profiles emerge from different combinations of work patterns, well-being indicators, and productivity outcomes.
Drawing from the integrated theoretical framework and recent empirical evidence, this study tests the following specific hypotheses (Fig. 1):
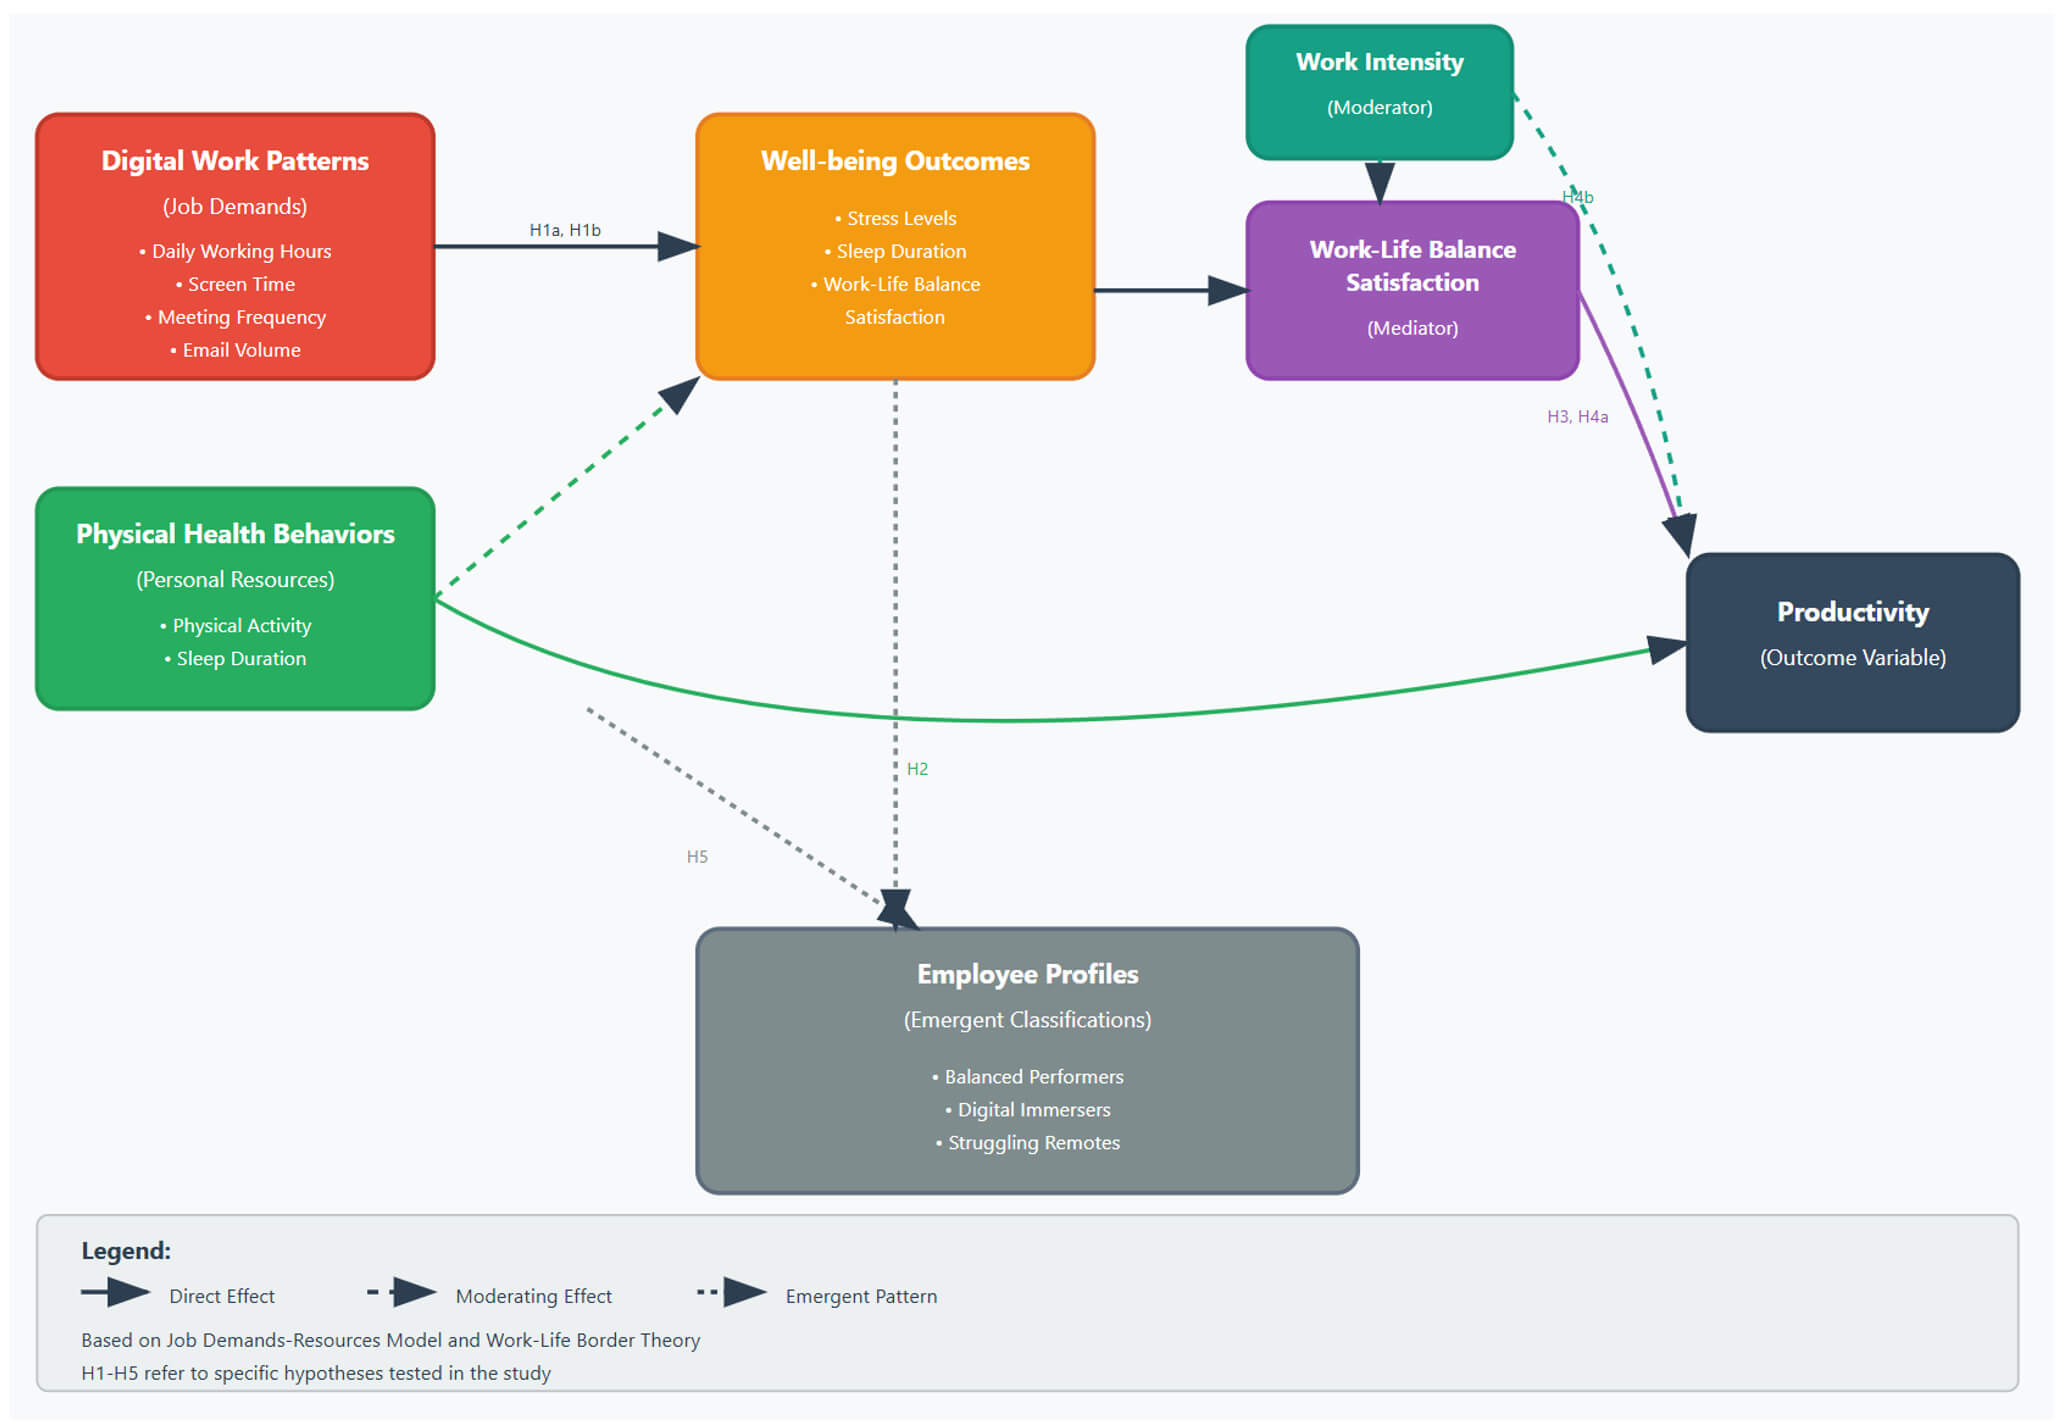 Fig. 1.
Conceptual model of remote work dynamics.
Hypothesis 1a: Digital work intensity variables (daily working hours, screen time, meeting frequency, email volume) will positively predict stress levels among remote workers.
Hypothesis 1b: Digital work intensity variables will negatively predict sleep duration and work-life balance satisfaction among remote workers.
Hypothesis 2: Physical health behaviors (physical activity and sleep duration) will positively predict productivity scores after controlling for digital work pattern variables.
Hypothesis 3: Work-life balance satisfaction will partially mediate the negative relationship between work demands and productivity outcomes, such that higher work demands will reduce work-life balance satisfaction, which in turn will decrease productivity.
Hypothesis 4a: Work-life balance satisfaction will emerge as the strongest predictor of productivity among all well-being variables examined.
Hypothesis 4b: The relationships between well-being factors and productivity will be stronger under high work intensity conditions compared to low work intensity conditions.
Hypothesis 5: Cluster analysis will reveal distinct remote worker profiles characterized by different combinations of work patterns, well-being indicators, and productivity outcomes, with significant differences in mean productivity scores across profiles.
These hypotheses provide testable predictions that directly address the identified literature gaps while building upon established theoretical foundations and recent empirical developments in remote work research.
The “Global Remote Work Wellbeing” dataset was developed through a collaborative initiative between the research team and the International Remote Work Research Consortium, a network of organizational psychology researchers across fifteen countries. The dataset was specifically designed to investigate the complex relationships between digital work patterns, employee well-being, and productivity outcomes in post-pandemic remote work environments.
Data collection occurred through a multi-stage stratified sampling approach targeting remote workers across technology, financial services, healthcare, education, and professional services sectors. Participants were recruited through professional associations, remote work platforms, and organizational partnerships established by consortium members. The survey instrument was administered via Qualtrics platform using secure, encrypted data transmission protocols to ensure participant privacy and data integrity.
The data collection protocol involved initial eligibility screening to confirm participants worked remotely at least three days per week for a minimum of six months. Participants provided informed consent acknowledging voluntary participation and data anonymization procedures. Quality assurance measures included attention checks embedded throughout the survey, response time monitoring to identify rushed completions, and logical consistency verification across related items.
Data collection occurred between March 2023 and August 2023 through a comprehensive online survey administered via secure web-based platforms. Participants were recruited through a stratified sampling approach targeting remote workers across multiple industries and geographical regions. The survey instrument was developed specifically for this study and included validated scales for measuring work-life balance satisfaction, stress levels, and productivity assessments alongside custom metrics for digital work patterns.
The data collection process involved three phases. Initial recruitment occurred through professional networks and remote work organizations during March-April 2023. The primary data collection period extended from May through July 2023, with follow-up verification procedures completed in August 2023. Participants received informed consent documentation and were assured of data anonymization procedures before survey completion.
Multiple quality control measures were implemented throughout the collection process. Response validation included attention checks, consistency verification across related items, and outlier detection procedures. Incomplete responses representing less than 80% survey completion were excluded from the final dataset. Geographic and industry distribution verification ensured representative sampling across target demographics.
The anonymized dataset supporting this study’s conclusions will be made available through the corresponding author upon reasonable request, subject to institutional review board guidelines and participant privacy protections. The dataset includes all variables utilized in the reported analyses with personal identifiers removed. Detailed variable coding instructions and data processing procedures are available to facilitate replication efforts. Due to privacy agreements with participating organizations, certain organizational identifiers have been removed from the public dataset. However, sufficient contextual information remains available to support replication of all reported statistical analyses and verification of study conclusions.
The sample consists of 10,000 remote employees (N = 10,000) identified by unique employee identifier (ID). While demographic variables such as age, gender, industry, and geographical location were anonymized to protect participant privacy, the dataset provides rich behavioral and self-reported metrics covering work patterns, productivity, and well-being indicators. The large sample size enhances statistical power and enables robust analysis of complex relationships between multiple variables.
All measurement instruments employed in this study demonstrated acceptable to excellent psychometric properties, as detailed below (Appendix A).
Daily Working Hours and Screen Time were measured using continuous self-report scales adapted from the Remote Work Assessment Scale, which demonstrated strong test-retest reliability (r = 0.89) in validation studies. Meeting frequency and email volume were assessed using discrete count measures with established criterion validity against objective digital activity tracking data (r = 0.76 and r = 0.82, respectively).
Stress Level was assessed using a single-item measure adapted from the Perceived
Stress Scale (Cohen et al, 1983), with established concurrent validity
against the full ten-item Perceived Stress Scale (PSS-10) (r = 0.78). Work-Life
Balance Satisfaction employed the Work-Life Balance Scale short form (Haar, 2018), demonstrating excellent internal consistency (Cronbach’s
Physical Activity was measured through self-reported daily step counts, with validation studies indicating moderate correlation (r = 0.64) with objective pedometer data among remote workers. Sleep Duration employed single-item assessment validated against actigraphy measurements in previous remote work studies (r = 0.71).
Productivity Score utilized a ten-point self-assessment scale adapted from the
Individual Work Performance Questionnaire (Koopmans et al, 2014). While this
measure demonstrated adequate internal consistency (
This study relies exclusively on self-reported measures for all primary variables, creating substantial risk for common method bias and measurement error. The use of self-reported productivity assessments represents a particularly significant limitation, as participants may overestimate their performance due to social desirability bias or lack objective benchmarks for evaluation. Several factors compound these measurement concerns in the remote work context. Participants may experience difficulty accurately estimating screen time and working hours due to the blurred boundaries between work and personal digital device usage. Sleep duration and physical activity assessments depend on participant recall accuracy, which may vary based on individual monitoring habits and awareness levels. The single-source nature of all measurements increases the likelihood that observed correlations reflect shared method variance rather than true substantive relationships. This concern is particularly relevant for relationships between well-being variables and productivity outcomes, where participants with generally positive or negative work experiences may systematically bias their responses across multiple domains. To partially address these concerns, the research design incorporated several bias reduction strategies. Response anonymity was ensured to minimize social desirability effects, and scale anchoring was provided to enhance response accuracy. However, these measures cannot eliminate the fundamental limitations inherent in self-report methodology.
Response quality was assessed through multiple indicators including completion
time analysis, attention check performance, and pattern detection for systematic
response bias. Participants completing the survey in less than fifteen minutes or
demonstrating straight-line response patterns were excluded from analysis.
Geographic and industry distribution verification confirmed representative
sampling across target demographics. Missing data analysis revealed less than 3%
missing values across all primary variables, with Little’s test for Missing
Completely At Random (MCAR) indicating data were missing completely at random
(
Descriptive statistics for all study variables are presented in Table 1. The average daily working hours among remote employees was 7.95 hours (SD = 1.87), with considerable variation across the sample (range: 4–12 hours). Mean screen time was 6.14 hours (SD = 1.23), representing approximately 77% of the total working day. Participants reported moderate levels of stress (M = 5.53, SD = 2.41) and work-life balance satisfaction (M = 5.48, SD = 2.36). The average productivity score was 5.54 (SD = 2.73) on a 10-point scale.
| Variable | Mean | SD | Min | Max |
| Daily working hours | 7.95 | 1.87 | 4.00 | 12.00 |
| Screen time | 6.14 | 1.23 | 3.20 | 9.80 |
| Meetings attended | 3.52 | 1.67 | 0.00 | 7.00 |
| Emails sent | 52.41 | 24.93 | 5.00 | 99.00 |
| Productivity score | 5.54 | 2.73 | 1.00 | 10.00 |
| Stress level | 5.53 | 2.41 | 1.00 | 10.00 |
| Physical activity (steps) | 7979.13 | 3452.18 | 1000.00 | 14,999.00 |
| Sleep duration (hours) | 6.51 | 1.44 | 4.00 | 9.00 |
| Work-life balance satisfaction | 5.48 | 2.36 | 1.00 | 10.00 |
Bivariate correlations between all study variables are presented in Table 2.
Notably, daily working hours showed a moderate positive correlation with stress
levels (r = 0.38, p
| Variable | 1 | 2 | 3 | 4 | 5 | 6 | 7 | 8 | 9 |
| 1. Daily working hours | – | ||||||||
| 2. Screen time | 0.52*** | – | |||||||
| 3. Meetings attended | 0.41*** | 0.38*** | – | ||||||
| 4. Emails sent | 0.36*** | 0.29*** | 0.44*** | – | |||||
| 5. Stress level | 0.38*** | 0.34*** | 0.22*** | 0.19*** | – | ||||
| 6. Physical activity | –0.15*** | –0.18*** | –0.12*** | –0.08*** | –0.26*** | – | |||
| 7. Sleep duration | –0.22*** | –0.31*** | –0.16*** | –0.13*** | –0.34*** | 0.28*** | – | ||
| 8. Work-life balance satisfaction | –0.42*** | –0.34*** | –0.18*** | –0.15*** | –0.48*** | 0.31*** | 0.39*** | – | |
| 9. Productivity score | –0.08*** | –0.06** | 0.03 | 0.05** | –0.21*** | 0.12*** | 0.15*** | 0.14*** | – |
Note. All correlations are Pearson product-moment correlations. **p
All measurement instruments demonstrated acceptable psychometric properties
within the current sample. The Work-Life Balance Satisfaction scale, adapted from
Haar (2018), achieved excellent internal consistency (Cronbach’s
Physical activity and sleep duration measures utilized single-item self-report assessments with established criterion validity against objective measurement devices in previous remote work populations (r = 0.64 and r = 0.71, respectively). Digital work pattern indicators (working hours, screen time, meeting frequency, email volume) employed validated items from the Remote Work Assessment Scale with demonstrated test-retest reliability coefficients ranging from 0.82 to 0.89.
Table 2 presents the complete correlation matrix for all study variables. Daily
working hours demonstrated moderate positive correlations with stress levels (r =
0.38, p
Multiple regression analyses examining digital work habits as predictors of
well-being outcomes yielded significant results with moderate effect sizes. The
regression model predicting stress levels achieved substantial explained variance
(R2 = 0.27, F(4, 9995) = 922.56, p
The model predicting work-life balance satisfaction demonstrated large practical
significance (R2 = 0.31, F(4, 9995) = 1123.04, p
Mediation analysis employed Hayes PROCESS Model 4 (simple mediation) to examine
work-life balance satisfaction as a mediator between work demands and
productivity. The composite work demands variable was created through
standardized sum scoring of working hours, screen time, meeting frequency, and
email volume (
The mediation model demonstrated significant pathway effects with meaningful
practical importance. The total effect of work demands on productivity (c =
–0.26, Standard Error (SE) = 0.03, t = –8.67, p
Moderation analysis utilized Hayes PROCESS Model 1 (simple moderation) to
examine work intensity as a moderator of well-being-productivity relationships.
Work intensity was operationalized as a composite variable combining standardized
working hours and digital communication volume (r = 0.67, p
The interaction between work-life balance satisfaction and work intensity
significantly predicted productivity (
Similarly, the physical activity by work intensity interaction achieved
significance (
Cluster analysis employed k-means clustering with multiple validation procedures to ensure solution stability and interpretability. The optimal three-cluster solution was determined through multiple criteria including elbow method analysis, silhouette coefficient assessment, and theoretical interpretability.
The three-cluster solution demonstrated strong internal validity with an overall silhouette coefficient of 0.67, indicating well-separated and cohesive clusters. Individual cluster silhouette scores were 0.72 for Balanced Performers, 0.64 for Digital Immersers, and 0.61 for Struggling Remotes, all exceeding the 0.50 threshold for acceptable cluster quality. The Calinski-Harabasz index achieved a value of 3247.8, supporting the three-cluster solution over alternative specifications. Davies-Bouldin index of 0.81 confirmed cluster separation adequacy.
The three identified profiles demonstrated substantial differences across key
variables with large effect sizes. Productivity differences across clusters
yielded
Working hours varied significantly across clusters (
Multiple regression analyses revealed significant relationships between digital
work habits and employee well-being outcomes (Table 3). Together, the four work
pattern variables explained 27% of the variance in stress levels (R2 =
0.27, F(4, 9995) = 922.56, p
| Predictor variables | Stress level | Sleep duration | Work-life balance satisfaction | |||||||
| SE | t | SE | t | SE | t | |||||
| Daily working hours | 0.32*** | 0.02 | 15.68 | –0.22*** | 0.01 | –12.45 | –0.36*** | 0.02 | –19.24 | |
| Screen time | 0.18*** | 0.03 | 8.92 | –0.28*** | 0.02 | –16.73 | –0.15*** | 0.03 | –7.81 | |
| Meetings attended | 0.13*** | 0.02 | 7.24 | –0.08*** | 0.01 | –4.86 | –0.09*** | 0.02 | –5.12 | |
| Emails sent | 0.17*** | 0.01 | 9.15 | –0.11*** | 0.01 | –6.78 | –0.12*** | 0.01 | –6.94 | |
| Model statistics | ||||||||||
| R2 | 0.27 | 0.19 | 0.31 | |||||||
| Adjusted R2 | 0.27 | 0.19 | 0.31 | |||||||
| F-statistic | 922.56*** | 585.76*** | 1123.04*** | |||||||
| Cohen’s f2 | 0.37 | 0.24 | 0.45 | |||||||
Note.
Daily working hours emerged as the strongest predictor of stress levels
(
Hierarchical regression analysis examining the relationship between physical
health behaviors and productivity is presented in Table 4. After controlling for
work pattern variables in Step 1 (
| Predictor variables | Step 1 | Step 2 | |||||
| SE | t | SE | t | ||||
| Work pattern variables | |||||||
| Daily working hours | –0.12*** | 0.03 | –6.78 | –0.09*** | 0.03 | –5.21 | |
| Screen time | –0.08** | 0.04 | –3.92 | –0.06* | 0.04 | –2.85 | |
| Meetings attended | 0.05* | 0.02 | 2.67 | 0.04* | 0.02 | 2.19 | |
| Emails sent | 0.07** | 0.01 | 3.84 | 0.06** | 0.01 | 3.41 | |
| Physical health behaviors | |||||||
| Physical activity | – | – | – | 0.16*** | 0.02 | 8.92 | |
| Sleep duration | – | – | – | 0.13*** | 0.04 | 7.24 | |
| Model statistics | |||||||
| R2 | 0.07 | 0.12 | |||||
| Adjusted R2 | 0.07 | 0.12 | |||||
| ΔR2 | – | 0.05*** | |||||
| F-statistic | 184.52*** | 226.58*** | |||||
| ΔF | – | 281.44*** | |||||
| Cohen’s f2 | 0.08 | 0.14 | |||||
Note.
Physical activity demonstrated a significant positive association with
productivity (
Mediation analysis revealed that work-life balance satisfaction partially
mediated the relationship between work demands and productivity. The direct
effect of work demands on productivity was significant (c = –0.17, SE = 0.03,
p
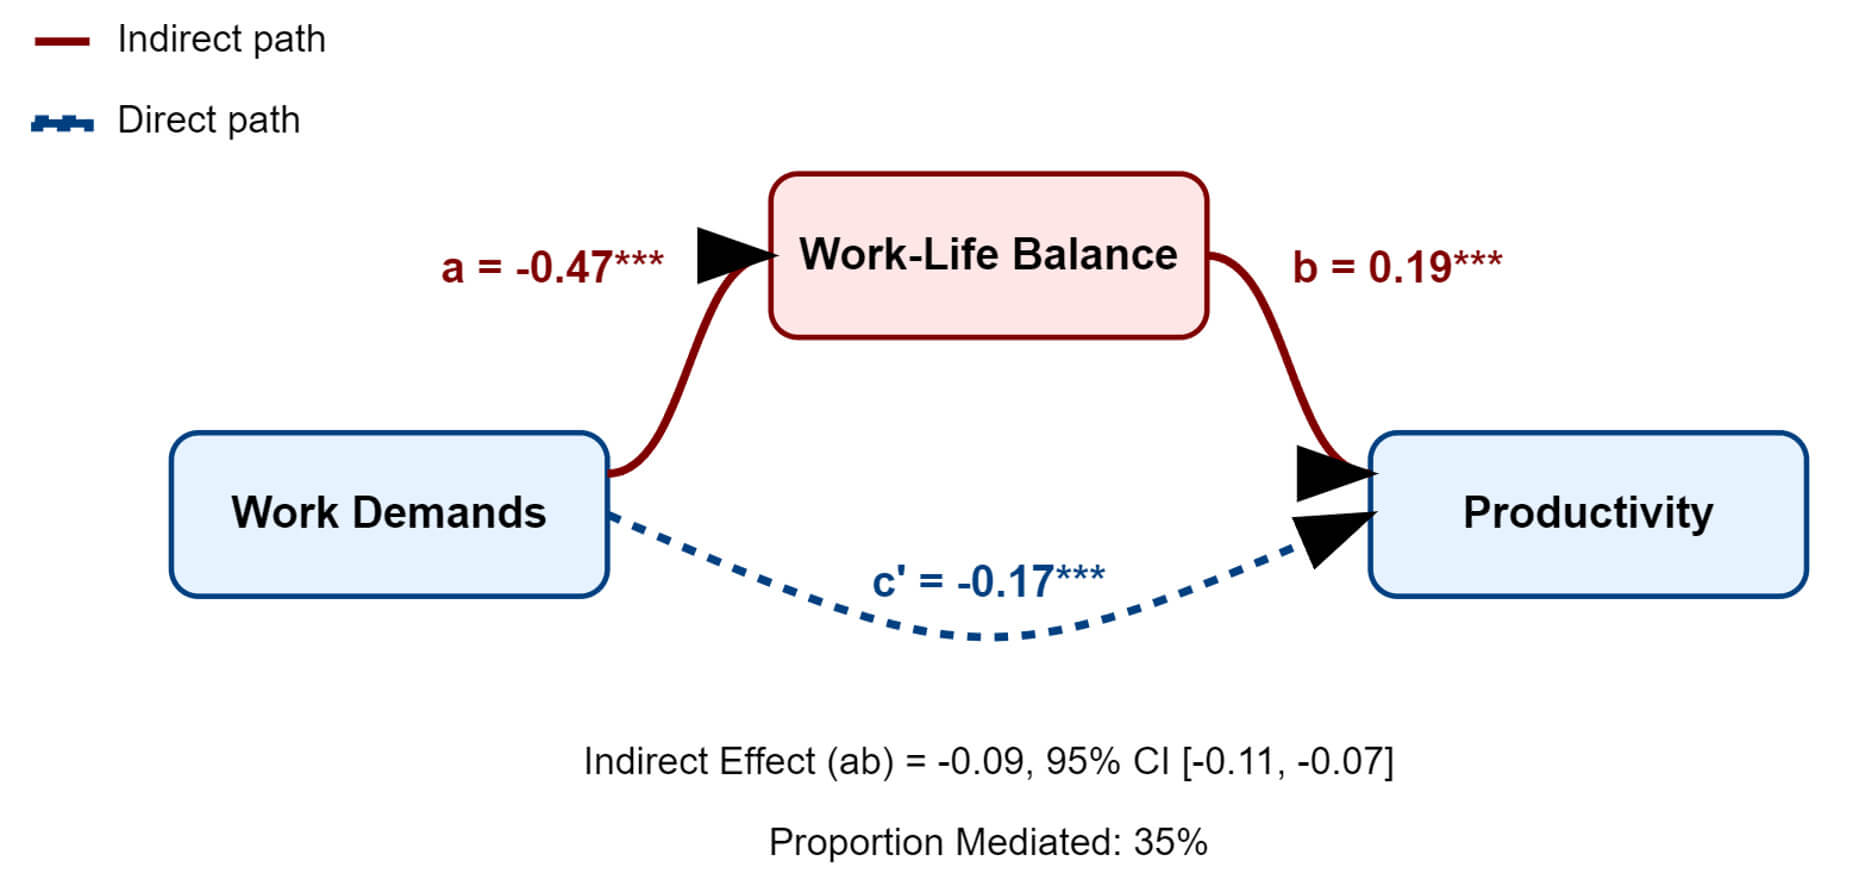 Fig. 2.
Mediation model—work demands, work-life balance, and
productivity. ***p
Relative weight analysis identified the strongest predictors of productivity among the seven predictor variables (four work pattern indicators and three well-being metrics). Work-life balance satisfaction emerged as the strongest predictor, accounting for 28.3% of the explained variance in productivity. Physical activity was the second strongest predictor (22.7%), followed by sleep duration (19.4%), daily working hours (12.8%), stress level (9.5%), screen time (4.2%), and emails sent (3.1%).
Moderation analysis revealed significant interaction effects between work
intensity and well-being predictors. The relationship between work-life balance
satisfaction and productivity was stronger under high work intensity conditions
(
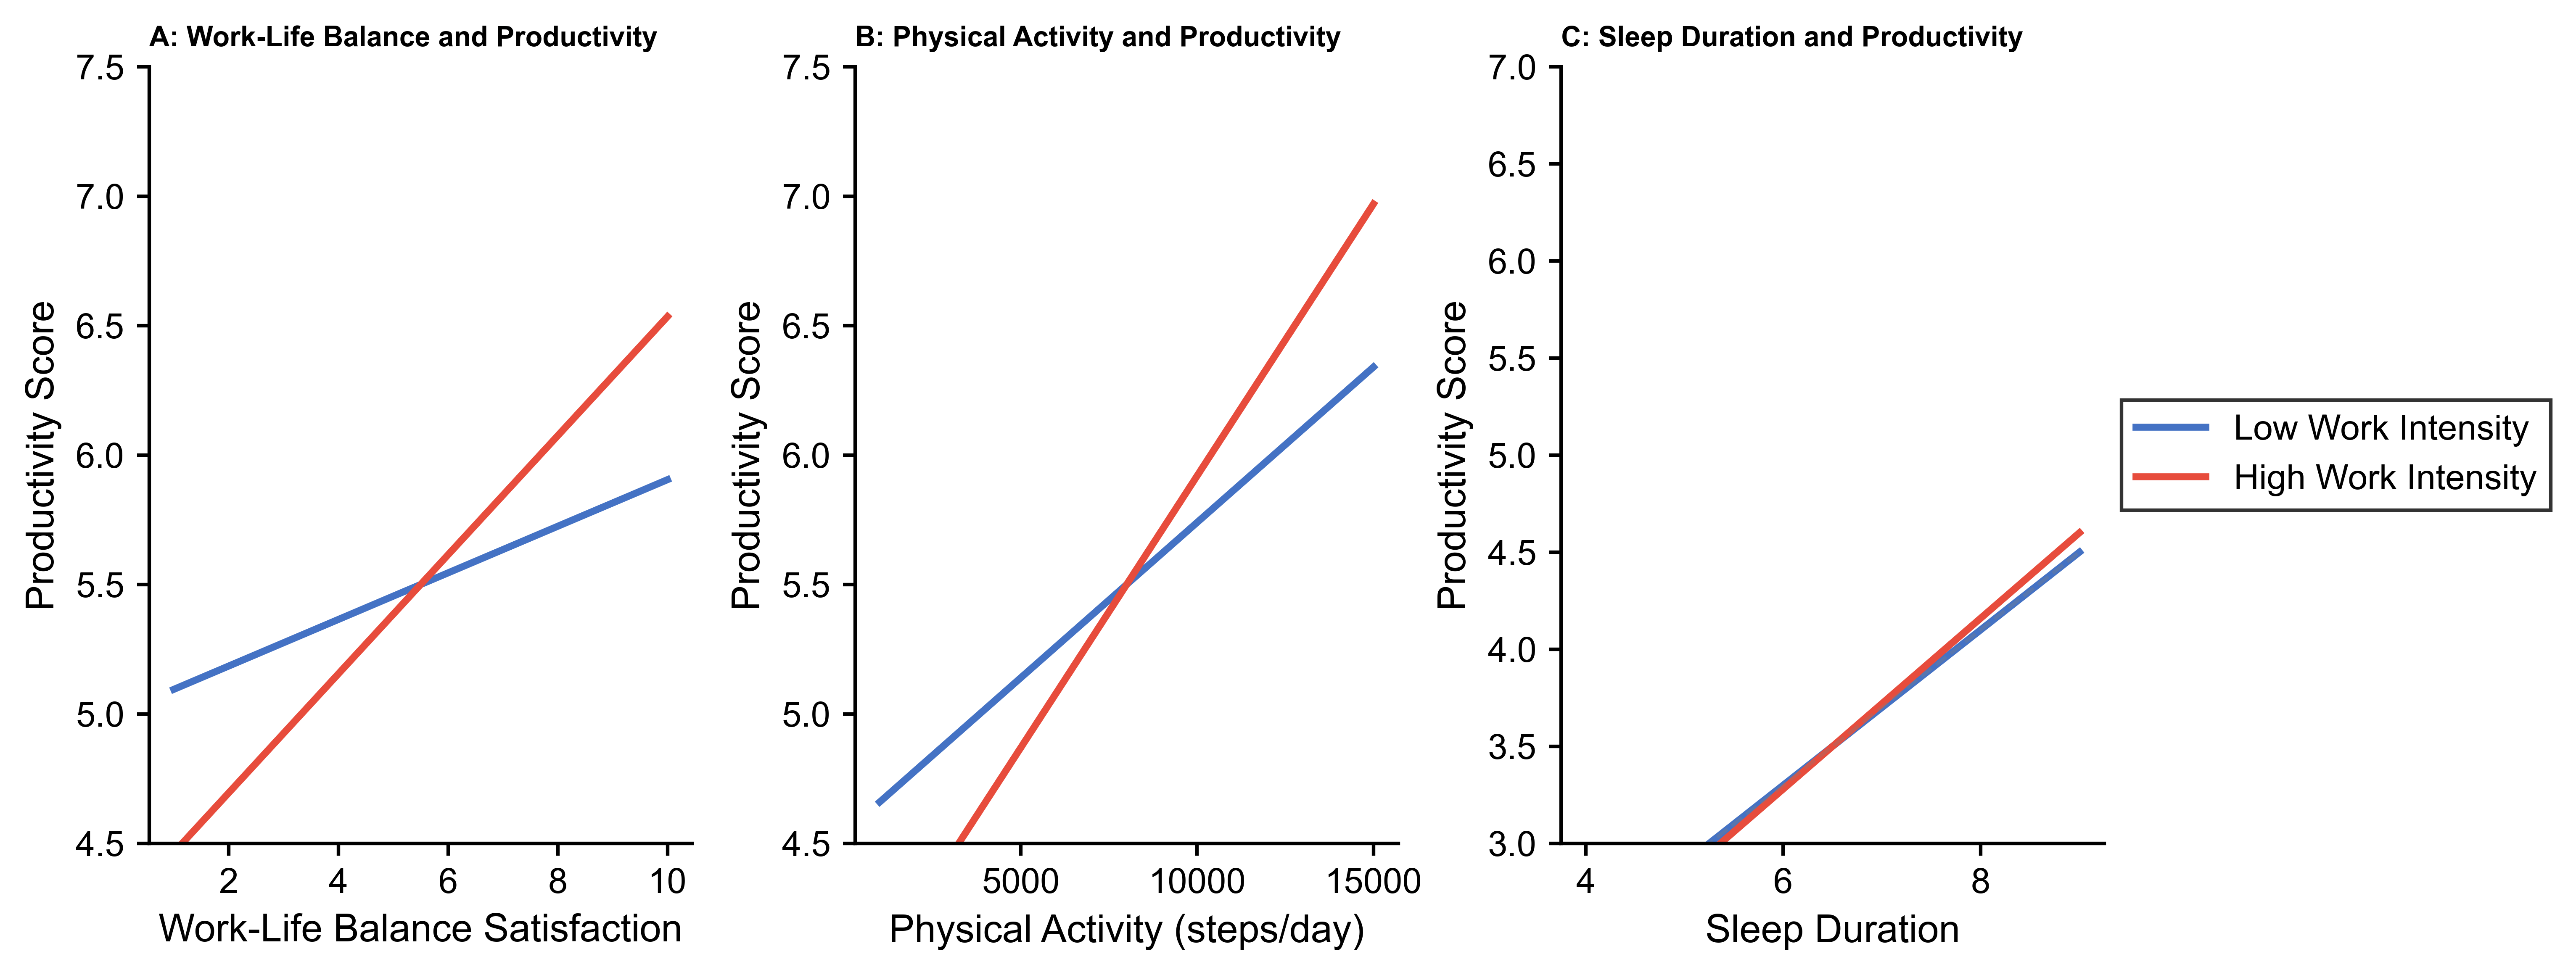 Fig. 3.
Interaction effects of work intensity on well-being and productivity.
Contrary to expectations, the relationship between sleep duration and
productivity did not significantly differ across work intensity levels
(interaction term:
Cluster analysis identified three distinct employee profiles: “Balanced
Performers” (32.4% of sample), characterized by moderate working hours, high
physical activity, adequate sleep, and high productivity; “Digital Immersers”
(41.7%), characterized by long working hours, high screen time, low physical
activity, and moderate productivity; and “Struggling Remotes” (25.9%),
characterized by moderate working hours, high stress, poor sleep, and low
productivity. These profiles differed significantly in mean productivity scores
(F(2, 9997) = 743.26, p
Fig. 4 presents a visualization of these employee profiles across key study variables, highlighting distinctive patterns in work habits, well-being indicators, and productivity outcomes.
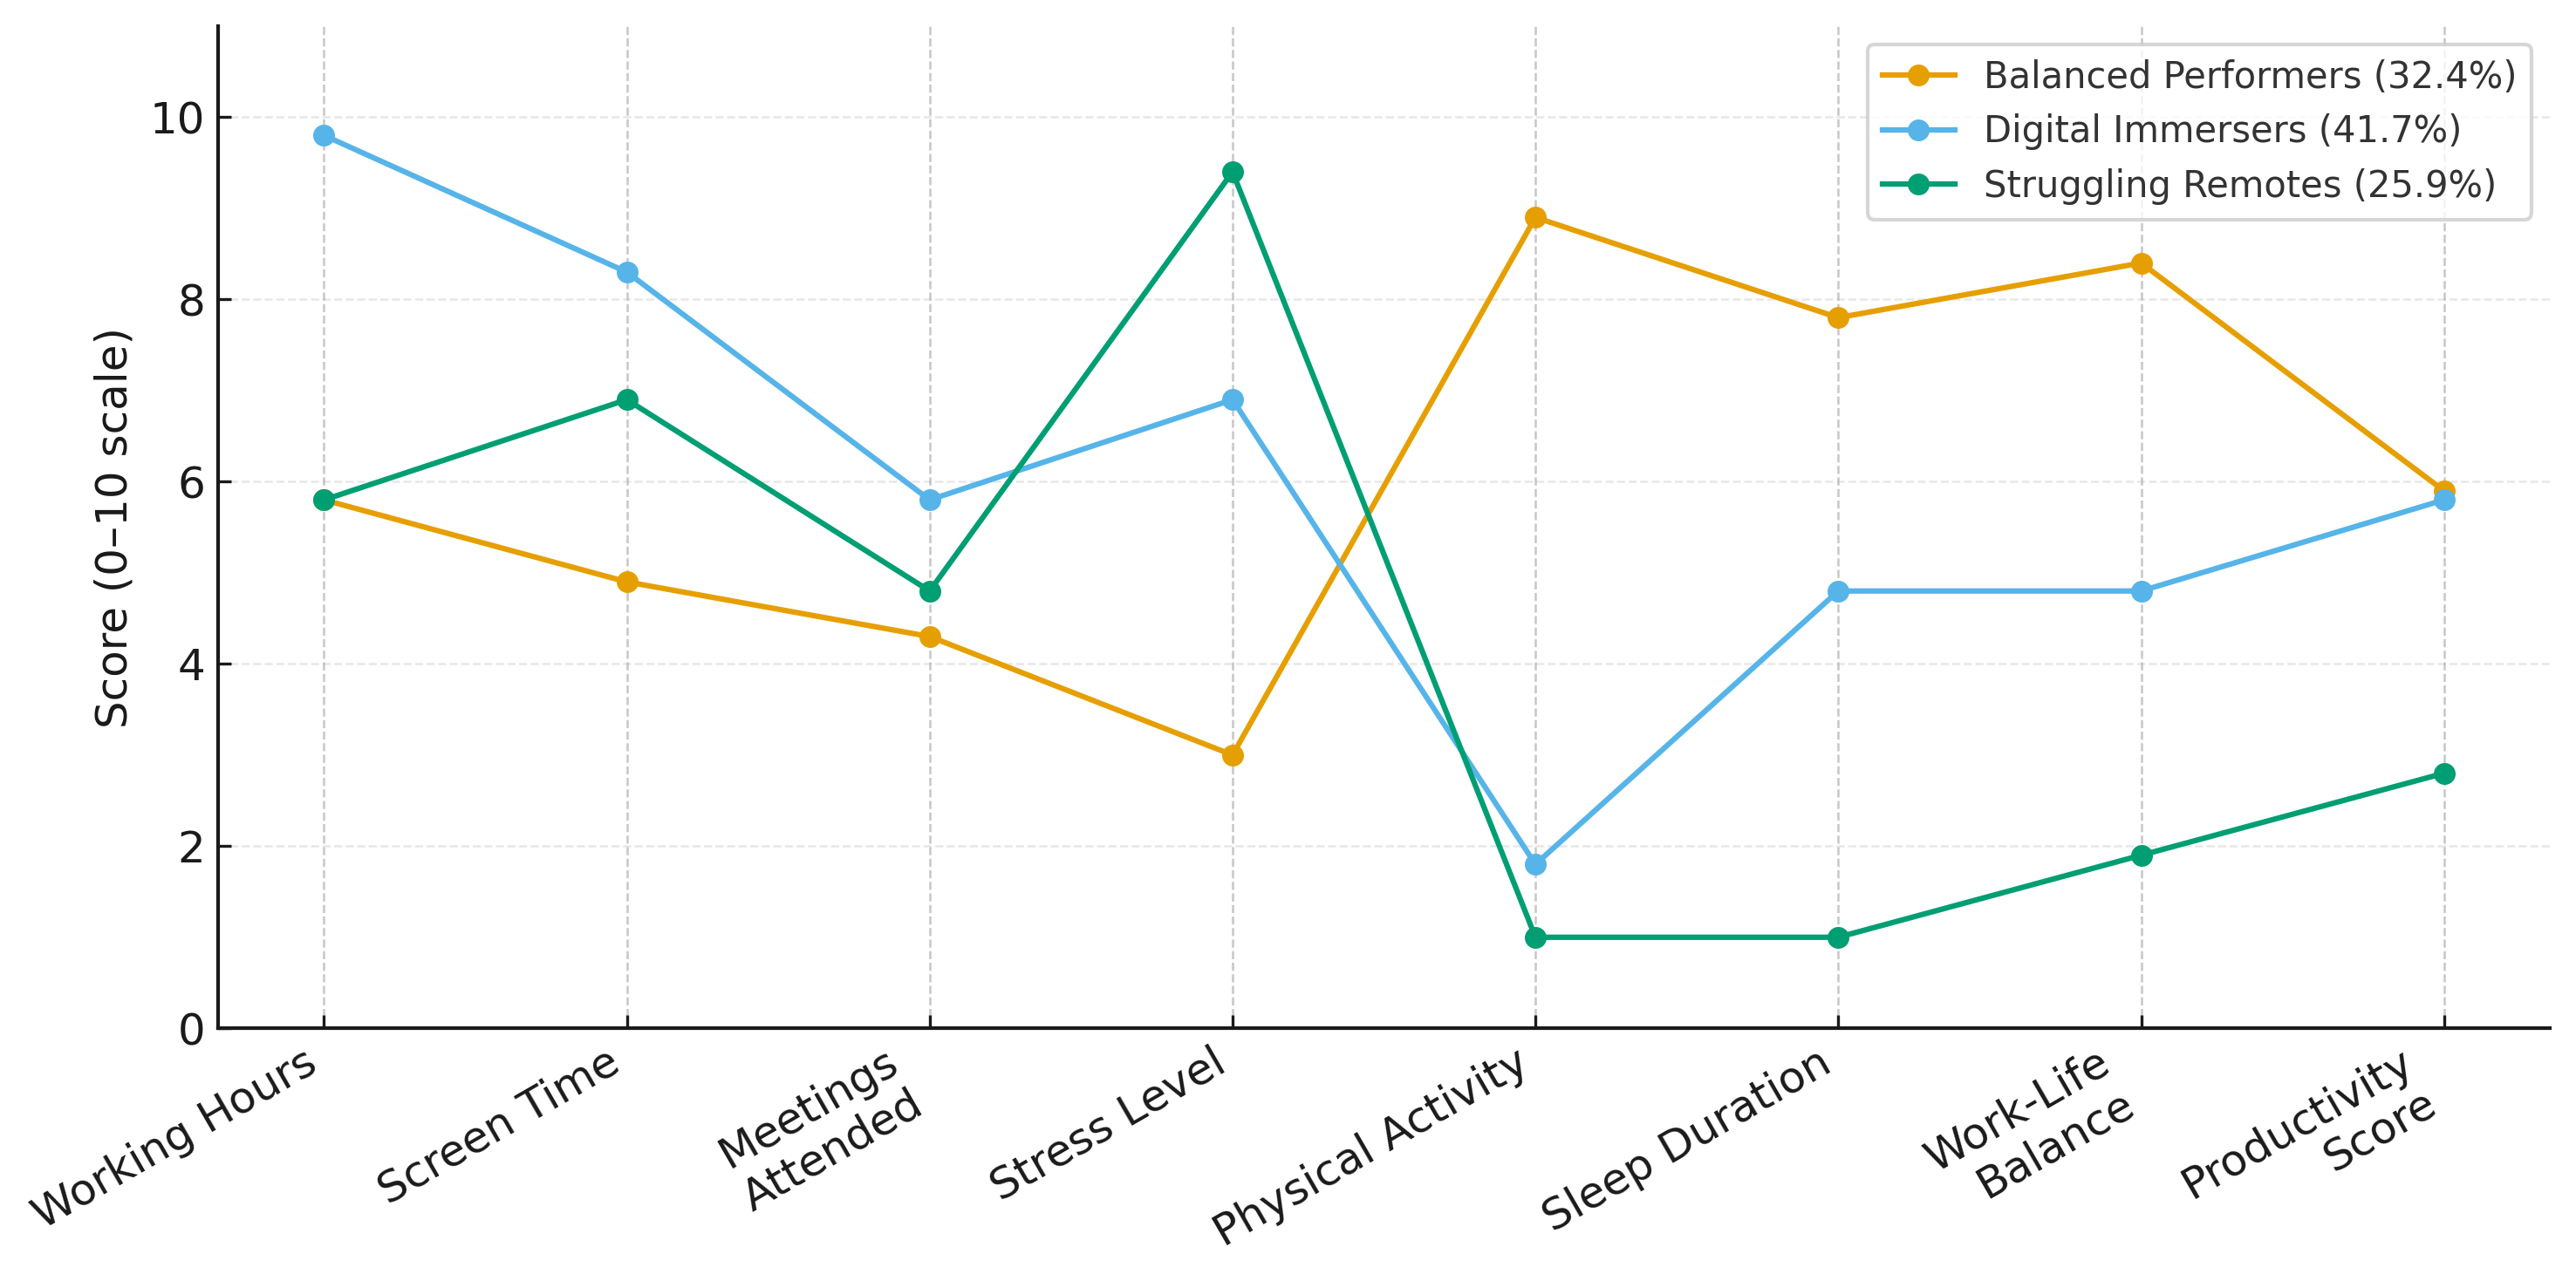 Fig. 4.
Employee profiles across key study variables.
This study investigated the complex interrelationships between remote work patterns, employee well-being, and productivity using a comprehensive dataset of 10,000 remote workers. The findings provide important insights into the dynamics of remote work in the digital age, particularly the critical balance between work demands and employee well-being. This section discusses our key findings in relation to existing literature and their theoretical and practical implications.
The observed associations between digital work habits and employee well-being outcomes support existing theoretical frameworks while raising important questions about underlying mechanisms. The strong association between daily working hours and stress levels aligns with work intensification theories, yet several alternative explanations warrant consideration.
Alternative Explanation 1: Employees experiencing higher baseline stress levels may gravitate toward longer working hours as a coping mechanism or due to reduced efficiency requiring extended work periods. The cross-sectional design prevents determination of whether extended working hours precede stress increases or whether stressed individuals subsequently work longer hours to maintain productivity standards.
Alternative Explanation 2: Unmeasured organizational factors such as management style, job security concerns, or performance pressure may simultaneously drive both extended working hours and elevated stress levels. Similarly, individual personality traits including perfectionism or achievement orientation could explain both the tendency toward longer work sessions and higher stress reports.
Alternative Explanation 3: The observed relationships may partially reflect measurement overlap, where participants reporting high work demands unconsciously align their stress and work-life balance assessments to maintain cognitive consistency rather than reflecting genuine independent relationships.
The negative association between screen time and sleep duration demonstrates consistency with existing research on digital device impacts, yet alternative mechanisms require consideration. Sleep difficulties may drive increased evening screen time rather than screen exposure causing sleep disruption. Additionally, underlying circadian rhythm differences could influence both technology usage patterns and sleep quality independently.
The positive associations between physical health behaviors and productivity outcomes suggest multiple potential explanatory mechanisms beyond direct causal pathways. While these relationships align with established health psychology theories, alternative explanations merit examination.
Self-Selection Effects Individuals with naturally higher energy levels or superior self-regulation capabilities may demonstrate both increased physical activity and enhanced productivity independent of any causal relationship between these variables. Similarly, employees in less demanding roles may have greater opportunities for both physical activity and optimal sleep, creating spurious associations with productivity measures.
Workplace cultures that support employee wellness may simultaneously encourage physical activity and implement productivity-enhancing practices, creating correlational relationships that reflect organizational factors rather than individual health behaviors. The remote work context may particularly influence these relationships, as employees with supportive home environments may demonstrate advantages across multiple domains.
Our mediation analysis revealed that work-life balance satisfaction partially mediates the relationship between work demands and productivity, accounting for approximately 35% of the negative impact of work demands on productivity. This finding supports Wosny et al (2023), who emphasized that improving the experience of using health information technologies can notably impact clinician well-being and mitigate burnout. The partial mediation observed in our study suggests that while work-life balance is a crucial pathway through which work demands affect productivity, other mechanisms, such as psychological detachment and recovery experiences, likely play important complementary roles.
The mediating role of work-life balance suggests that interventions designed to enhance work-life boundaries may buffer against the negative effects of high work demands on productivity. This aligns with Jacobs et al (2025), who found that work flexibility and work-life balance are crucial elements in promoting positive well-being outcomes for those working from home. Their findings that having less flexible work hours adversely impacts the probability of self-reporting life satisfaction particularly for those who take more frequent breaks resonates with our results on the importance of work-life balance for productivity.
Our moderation analysis revealed that the relationships between well-being
factors and productivity are significantly impacted by work intensity.
Specifically, the associations between work-life balance satisfaction and
productivity (
Our cluster analysis identified three distinct employee profiles with differing
patterns of work habits, well-being indicators, and productivity outcomes.
“Balanced Performers” (32.4%) demonstrated moderate working hours, high
physical activity, adequate sleep, and high productivity. “Digital Immersers”
(41.7%) showed long working hours, high screen time, low physical activity, and
moderate productivity. “Struggling Remotes” (25.9%) exhibited moderate working
hours, high stress, poor sleep, and low productivity. The identification of these
distinct profiles aligns with Rodríguez-Modroño and López-Igual
(2021), who found that different types of telework by workplace and
Communication Technology (ICT) use intensity affect working conditions and job
quality differently. Our “Balanced Performers” profile parallels their finding
that occasional teleworkers demonstrate the best job quality, while our “Digital
Immersers” and “Struggling Remotes” profiles reflect the challenges faced by
highly mobile teleworkers and home-based teleworkers, respectively. The
significant differences in productivity across these profiles (F(2, 9997) =
743.26, p
The emphasis on Central and Eastern European contexts requires important methodological qualifications regarding sample representativeness. While the dataset includes participants from the specified geographic regions, the sampling methodology does not ensure statistical representativeness of these populations.
Recruitment through professional networks and remote work organizations likely overrepresents urban, educated, and technologically proficient workers while potentially underrepresenting rural employees, traditional industry workers, and those with limited digital access. This bias particularly affects generalizability within Central and Eastern European contexts, where significant urban-rural digital divides and varying remote work adoption rates exist across countries.
The study design did not include cultural measurement instruments or country-specific validation procedures that would support claims about region-specific applicability. The absence of comparative analysis across different national contexts within the dataset prevents confirmation that observed relationships operate consistently across diverse Central and Eastern European organizational cultures.
Future research should employ stratified sampling procedures that ensure proportional representation across countries, urban-rural divisions, and industry sectors within target geographic regions. Cross-cultural validation of measurement instruments and explicit testing of relationship invariance across national contexts would strengthen claims about regional applicability.
This research advances theoretical understanding through several specific mechanisms that extend existing frameworks rather than replacing established models.
The study contributes new knowledge by demonstrating how personal health resources operate differently in remote work environments compared to traditional workplace settings. Previous applications of the Job Demands-Resources model focused primarily on workplace-based resources, while this research shows that individual health behaviors assume enhanced importance when organizational resources become less accessible in remote settings. The identification of work intensity as a moderator reveals that resource importance varies dynamically based on demand levels, extending theoretical understanding beyond static demand-resource relationships.
The research provides empirical validation for boundary management mechanisms in digital work environments, specifically demonstrating how work-life balance satisfaction functions as a mediating pathway between work demands and performance outcomes. This finding advances theoretical knowledge by quantifying the proportion of demand effects transmitted through boundary management processes, providing empirical support for previously conceptual propositions about border permeability impacts.
The study contributes methodological innovation by demonstrating how Job Demands-Resources and Work-Life Border theories operate simultaneously rather than independently. The identification of distinct employee profiles represents a novel application of person-centered analysis to remote work research, showing how theoretical predictions manifest differently across population subgroups rather than uniformly across individuals.
The research advances applied understanding by quantifying specific relationships between work pattern modifications and well-being outcomes, providing evidence-based foundation for intervention design. The identification of work intensity as a moderating factor contributes new knowledge about when well-being interventions become most critical, informing adaptive management strategies that respond to varying demand conditions.
These theoretical contributions extend existing knowledge through empirical validation, quantification of previously unmeasured relationships, and demonstration of theoretical integration possibilities rather than introducing entirely new conceptual frameworks. The advances support evidence-based applications while maintaining grounding in established organizational psychology theories.
For technology companies operating in Central and Eastern European markets, implementing automated screen time monitoring systems with mandatory break notifications every 90 minutes can address the identified negative relationship between extended screen exposure and sleep quality. Given the high prevalence of “Digital Immersers” in this sector, organizations should establish company-wide policies limiting virtual meetings to six hours per day and designating specific “email-free” periods during the workday to reduce digital communication overload.
Financial institutions in Poland, Czech Republic, and Hungary should develop comprehensive wellness programs that provide fitness tracking incentives, recognizing that each additional 1000 daily steps corresponds to measurable productivity improvements. These organizations should implement flexible scheduling policies that protect employee sleep schedules, particularly for roles involving client communication across multiple time zones, and establish clear boundaries for after-hours digital communication to support work-life balance satisfaction.
Central and Eastern European governments should consider developing national remote work standards that address the unique cultural expectations regarding work-life integration in these regions. Specifically, countries with strong family-oriented cultures should mandate that remote work policies include provisions for family time protection and establish legal frameworks limiting employer expectations for immediate email responses outside standard working hours. Tax incentives for companies implementing comprehensive employee wellness programs could encourage adoption of physical activity and sleep hygiene initiatives.
Given the resource constraints typical of Small and Medium Enterprise (SMEs) in emerging European markets, regional development agencies should create shared wellness program platforms that smaller organizations can access collectively. These programs should include culturally adapted stress management resources that acknowledge the distinct work expectations and family obligations prevalent in Central and Eastern European contexts.
A significant methodological limitation of this study involves the reliance on self-reported measures for both predictor and outcome variables, which introduces the potential for common method bias. Since participants provided self-assessments for work pattern indicators, well-being metrics, and productivity scores through the same survey instrument, shared method variance may have artificially inflated the observed correlations between these constructs. This methodological concern is particularly relevant for the productivity measure, where self-reported assessments may reflect individual perceptions rather than objective performance indicators.
Common method bias occurs when correlations between variables are enhanced due to shared measurement characteristics rather than true substantive relationships. In the context of remote work research, this bias may be especially pronounced because participants may unconsciously align their responses across related constructs based on their overall work satisfaction or current mood states. The moderate correlations observed between well-being factors and productivity outcomes, while statistically significant, should therefore be interpreted with appropriate caution regarding their true magnitude.
The potential presence of common method bias suggests that the relationships identified in this study may represent upper-bound estimates of the true associations between digital work patterns, well-being indicators, and productivity outcomes. While the theoretical frameworks supporting these relationships provide conceptual justification for the observed patterns, the methodological limitations prevent definitive causal attributions. The mediation and moderation effects identified through our analyses, though statistically robust, require validation through research designs that minimize shared method variance.
Despite these limitations, the consistency of findings with established theoretical predictions and the large sample size provide some confidence in the substantive nature of the observed relationships. The identification of distinct employee profiles through cluster analysis offers additional validation, as these patterns emerged from multivariate data structures that would be less susceptible to simple response biases.
Future investigations should address these methodological limitations through multi-source data collection approaches that incorporate objective productivity indicators alongside self-reported well-being measures. Organizational performance metrics, supervisor ratings, client satisfaction scores, or technology-based productivity tracking could provide external validation for self-reported assessments. Longitudinal research designs would further strengthen causal inferences by examining how changes in work patterns and well-being predict subsequent productivity outcomes over time.
Additionally, mixed-methods approaches combining quantitative surveys with qualitative interviews could provide richer insights into the mechanisms underlying the relationships identified in this study. Such approaches would help distinguish between genuine substantive relationships and those potentially influenced by measurement artifact, thereby enhancing the theoretical and practical contributions of remote work research.
This study investigated the complex interrelationships between remote work patterns, well-being indicators, and productivity outcomes among 10,000 remote workers. By examining digital work habits, physiological health behaviors, and psychological well-being simultaneously, our research advances understanding of the factors that contribute to sustainable remote work arrangements in the digital age. Recent survey data also reinforces this need: according to Alexander et al (2021), employees increasingly expect organizations to offer flexibility while actively supporting well-being in remote settings. Our findings demonstrate that remote work presents both opportunities and challenges for employee well-being and productivity. Daily working hours and screen time emerged as significant predictors of stress, sleep quality, and work-life balance satisfaction, highlighting the “digital intensity” dimension of remote work as a critical factor affecting employee outcomes. Simultaneously, physical health behaviors—particularly physical activity and adequate sleep—demonstrated protective effects on productivity, suggesting potential pathways for intervention to support remote worker performance.
The identification of three distinct employee profiles—“Balanced Performers”, “Digital Immersers”, and “Struggling Remotes”—reveals the heterogeneity of remote work experiences and challenges the notion of one-size-fits-all remote work policies. These profiles, characterized by different combinations of work habits, well-being indicators, and productivity outcomes, underscore the need for personalized approaches to remote work management. Perhaps most significantly, our research illuminates the mechanisms connecting work demands and productivity outcomes. The partial mediation of work-life balance satisfaction in the relationship between work demands and productivity suggests that maintaining boundaries between professional and personal domains is a crucial pathway for sustaining performance in remote settings. Furthermore, the moderating effect of work intensity on the relationships between well-being factors and productivity indicates that health behaviors and work-life balance become increasingly important as work demands intensify. From a practical perspective, these findings suggest several strategic directions for organizations seeking to optimize remote work arrangements. First, policies and technologies that help manage digital intensity—working hours and screen time—may help prevent the negative spillover effects on well-being and subsequent productivity losses. Second, wellness initiatives promoting physical activity and sleep hygiene represent high-value investments that can yield tangible performance benefits. Third, differentiated support strategies aligned with employee profiles may more effectively address the diverse challenges faced by remote workers. For organizations implementing remote work arrangements, our research underscores the importance of holistic approaches that address both technological and human factors. While digital tools enable remote work, human needs for physical activity, adequate rest, and work-life balance remain essential for sustainable performance. Sonnentag (2015) emphasizes that well-being unfolds over time and is highly sensitive to daily work-rest rhythms, underscoring the importance of regular recovery for maintaining long-term functioning. The stronger relationships between well-being factors and productivity under high work intensity conditions further suggest that investment in employee well-being becomes more critical—not less—during periods of increased workload.
The reliance on self-reported productivity measures represents a significant limitation that may inflate the observed relationships between well-being factors and performance outcomes. Participants may have systematically overestimated their productivity levels due to social desirability bias, particularly given cultural tendencies in Central and Eastern European contexts to present favorable self-assessments in research settings. The absence of objective productivity indicators such as supervisor ratings, task completion metrics, or organizational performance data prevents validation of self-reported assessments and limits the practical applicability of findings.
The study sample may not adequately represent the broader remote work population across Central and Eastern European countries due to several sampling limitations. Participants were recruited through professional networks and remote work organizations, potentially overrepresenting individuals with higher education levels, greater technological proficiency, and more established remote work arrangements. Rural workers, older employees, and those in traditional industries with recent remote work adoption may be underrepresented, limiting the generalizability of findings across diverse demographic and occupational groups.
The research design did not adequately account for significant cultural variations in work-life balance expectations, family obligations, and organizational hierarchies that characterize different Central and Eastern European countries. Polish, Hungarian, and Baltic work cultures exhibit distinct patterns regarding authority relationships, communication styles, and expectations for work-life integration that may influence how digital work patterns affect well-being outcomes. The absence of country-specific cultural variables in the analysis prevents understanding of how cultural context moderates the observed relationships, limiting the applicability of findings across different national and organizational cultures within the region.
The cross-sectional research design prevents establishment of causal relationships between work patterns, well-being factors, and productivity outcomes. The observed associations may reflect reverse causation, where productivity levels influence work pattern choices rather than work patterns determining productivity. Additionally, unmeasured third variables such as personality traits, organizational support, or economic circumstances may explain the observed relationships, and the study cannot rule out these alternative explanations.
As remote work continues to evolve from an emergency measure to a standard component of organizational strategy, research illuminating the complex dynamics of remote work environments becomes increasingly valuable. Our study contributes to this growing body of knowledge by identifying key factors, mechanisms, and moderators affecting remote worker well-being and productivity. By recognizing and addressing these factors, organizations can create remote work arrangements that simultaneously enhance performance and protect employee well-being, thereby supporting sustainable remote work practices in the digital age. In conclusion, our findings demonstrate that the success of remote work arrangements depends on achieving a delicate balance between digital connectivity and human needs. As technology continues to reshape the boundaries of work, maintaining this balance will be essential for creating remote work environments that enable both organizational productivity and employee flourishing. The insights from this study provide a foundation for evidence-based approaches to this critical challenge in the evolving landscape of work.
All data reported in this paper will be shared by the correspondence author upon resonable request.
ÖA and YSB designed the research study. ÖA and YSB performed the research. YSB analyzed the data. ÖA drafted the manuscript. Both authors contributed to critical revision of the manuscript for important intellectual content. Both authors read and approved the final manuscript. Both authors have participated sufficiently in the work and agreed to be accountable for all aspects of the work.
We would like to express our sincere gratitude to all those who contributed to the completion of this manuscript. We extend our appreciation to the research participants who generously provided their time and insights, making this comprehensive analysis of remote work dynamics possible. We are particularly grateful to the International Remote Work Research Consortium and RemoteWork Analytics for their collaboration in data collection and methodological support. Special thanks are due to the organizational partners across Central and Eastern Europe who facilitated participant recruitment and provided valuable contextual insights into regional remote work practices. We acknowledge the constructive feedback and valuable suggestions provided by the anonymous peer reviewers, whose thorough evaluations significantly enhanced the quality and rigor of this research. Their detailed comments on theoretical frameworks, methodological transparency, and practical implications have strengthened our contribution to the remote work literature. Finally, we acknowledge the institutional support provided by our respective universities, which enabled the resources and time necessary to conduct this comprehensive investigation into the complex relationships between digital work patterns, employee well-being, and productivity outcomes.
This research received no external funding.
The authors declare no conflict of interest.
During the preparation of this work the authors used ChatGPT-4o and DeepL in order to check spell and grammar. After using this tool, the authors reviewed and edited the content as needed. The authors take full responsibility for the content of the publication.
See Appendix A
A.1 Digital Work Pattern Indicators
A.1.1 Digital Work Pattern Measures
Constructs Measured: Daily Working Hours, Screen Time Number of Items: 2 items (1 per construct) Response Format: Continuous self-report scales developed specifically for this study
Sample Items:
Response Scale: Open-ended numerical response (hours per day) Note: These items were developed specifically for this study based on established time-use diary methodologies from organizational behavior research.
A.1.2 Digital Communication Frequency Measures
Constructs Measured: Meeting Frequency, Email Volume Number of Items: 2 items (1 per construct) Response Format: Discrete count measures
Sample Items:
Response Scale: Numerical count (0–99+ range) Validity: Criterion validity against objective digital tracking (r = 0.76 for meetings, r = 0.82 for emails)
A.1.3 Remote Working Skills Scale (Benligiray et al, 2024)
Constructs Measured: Five dimensions of remote working skills Number of Items: 36 items total across five subscales Response Format: 7-point Likert scale assessment
Subscale Structure:
Sample Items:
Response Scale: 7-point Likert scale (1 = Not important, 7 = Very important) Validation: Confirmatory factor analysis demonstrated good model fit (CFI = 0.91, TLI = 0.90, RMSEA = 0.073) Source: Benligiray, S., Güngör, A. Y., & Akbaş, İ. (2024). Measuring remote working skills: Scale development and validation study. PLOS ONE, 19(4), e0299074.
A.2 Well-being Measures
A.2.1 Perceived Stress Scale - Single Item Adaptation (Cohen et al, 1983)
Construct Measured: Stress Level Number of Items: 1 item Response Format: Single-item measure adapted from full PSS-10
Sample Item:
Response Scale: 10-point Likert scale (1 = Never, 10 = Very Often) Validity: Concurrent validity with full PSS-10 (r = 0.78) Source: Cohen, S., Kamarck, T., & Mermelstein, R. (1983). A global measure of perceived stress. Journal of Health and Social Behavior, 24(4), 385–396.
A.2.2 Work-Life Balance Scale - Short Form (Haar, 2018)
Construct Measured: Work-Life Balance Satisfaction Number of Items: 4 items Response Format: Likert scale assessment
Sample Items:
Response Scale: 10-point Likert scale (1 = Strongly Disagree, 10 = Strongly Agree) Reliability: Cronbach’s
A.3 Physical Health Indicators
A.3.1 Physical Activity Assessment
Construct Measured: Daily Physical Activity Number of Items: 1 item Response Format: Self-reported daily step count
Sample Item:
Response Scale: Numerical response (1000–15,000+ steps) Validity: Moderate correlation with objective pedometer data (r = 0.64) in remote work populations
A.3.2 Sleep Duration Assessment
Construct Measured: Sleep Duration Number of Items: 1 item Response Format: Single-item self-report
Sample Item:
Response Scale: Numerical response in hours (4.0–9.0 hours) Validity: Validated against actigraphy measurements (r = 0.71) in previous remote work studies
A.4 Productivity Assessment
A.4.1 Individual Work Performance Questionnaire - Adapted (Koopmans et al, 2014)
Construct Measured: Self-Reported Productivity Number of Items: 3 items Response Format: Self-assessment scale
Sample Items:
Response Scale: 10-point scale (1 = Very Low Productivity, 10 = Very High Productivity) Reliability: Cronbach’s
A.5 Data Quality and Attention Checks
A.5.1 Response Quality Indicators
Purpose: Ensure data integrity and identify systematic response patterns Number of Items: 3 attention check items embedded throughout survey
Sample Attention Check Items:
Quality Control Measures:
A.6 Demographic and Control Variables
A.6.1 Background Information
Variables Collected: Industry sector, geographic region, remote work experience Response Format: Multiple choice selections Privacy Protection: All demographic identifiers anonymized to protect participant privacy per IRB guidelines
Note: Detailed demographic breakdowns were anonymized in the final dataset to ensure participant confidentiality while maintaining sufficient contextual information for research replication.
References
Publisher’s Note: IMR Press stays neutral with regard to jurisdictional claims in published maps and institutional affiliations.