


 , Sandro Radovanović 2, Danica Lečić-Cvetković 1, Milija Suknović 2
1 Department for Production and Services Management, Faculty of Organizational Sciences, University of Belgrade, 11000 Belgrade, Serbia
2 Department of Business Systems Organization, Faculty of Organizational Sciences, University of Belgrade, 11000 Belgrade, Serbia
Abstract
The main objective of this paper is to identify key determinants that impact the intention to adopt the most widely used digitalization and automation technologies in manufacturing companies—namely, the Internet of Things, Artificial Intelligence, and Big Data. An Expanded Unified Theory of Acceptance and Use of Technology (UTAUT) model was used, based on which tailored strategies for specific technology adoption can be defined. The data were collected through a survey conducted in manufacturing companies in the Republic of Serbia and analyzed using Structural Equation Modeling. The results show that the main drivers of intention to use these three technologies are performance expectancy, facilitating conditions, and the current level of digitalization and automation. All three determinants exhibit statistically significant and positive effects on adoption intentions. The main findings are valuable for decision-makers and practitioners, offering insights into the factors that enable technology adoption and providing support for the development of effective implementation strategies based on the key determinants. Also, these results are relevant for other emerging and post-transitional economies in the Balkans and Eastern Europe, as they face similar infrastructural, institutional and digital challenges, as well as similar levels of industrialization and technological development.
Keywords
- digitalization
- digital technologies
- expanded UTAUT
- manufacturing
- conceptual model
- technology adoption
Digitalization and Automation (D&A) of the production process enable the maintenance of real-time decision-making and implementation, from planning to realization (Osmolski and Kolinski, 2020), where minor changes in predictive performance led by automation can result in significant improvements that have different impact (Radovanović et al, 2020). Investments in technologies for D&A can reduce labor costs (OECD, 2017) and enable the efficiency of manufacturing companies (Rajković et al, 2023). Industry 4.0 (I4.0) is characterized by advanced D&A, with the use of electronics and various technologies in manufacturing processes (Lu, 2017), while the application of advanced technologies enables digital production (Rakićević et al, 2023). I4.0 can enhance the company’s process performances and drive innovation (Glogovac et al, 2022), where “smart” innovation management presents a prerequisite for better results and better acceptance of innovations, leading to better economic business results (Likar et al, 2023). Authors Pfohl et al (2017) believe that the digitalization of products and processes is a key driver of I4.0.
Industrial development of the Republic of Serbia impacts the rise of living standards and economic progress of the country, as well as competitiveness on the market (Đaković, 2024). The Digital Transformation Centre at the Serbian Chamber of Commerce and Industry of Commerce is responsible for the digital transformation of the economy in the Republic of Serbia, as well as for supporting businesses. So far, it has already implemented three programs for companies in the Republic of Serbia to improve their businesses through digital means: “Support Program for the Digital Transformation of Small and Medium-sized Enterprises (MSMEs) 2019/2020” (Chamber of Commerce and Industry of Serbia, 2019), as well as programs aimed at mitigating the consequences caused by the COVID-19 pandemic, SPEED 1.0 and SPEED 2.0 (Chamber of Commerce and Industry of Serbia, 2020). One of the Republic of Serbia’s developmental objectives is to improve the competitive potential of the industry by implementing reform processes and transition that impact the development of the industrial potential, higher investments and faster development of domestic and private sectors (Jakopin and Bajec, 2009). Digital transformation in the Republic of Serbia is of high importance in creating conditions for accelerated economic development, as well as preserving creative potential (Stefanović et al, 2021). According to Đaković (2024), in the Republic of Serbia, the connection between the traditional industry and the Information-Communication Technologies (ICT) sector is not strong, while companies invest five times less in ICT than the world average. Results from the latest available report from the Statistical Office of the Republic of Serbia regarding the application of ICT in the Republic of Serbia for 2023 (Statistical Office of the Republic of Serbia, 2023) show that 100% of the companies have a broadband Internet connection. One-fifth of the companies employ ICT experts and use the software for Enterprise Resource Planning (ERP), 10.7% of the companies use the software for Customer Relationship Management (CRM), while 5.1% use the Business Intelligence software. Cloud services are used by 37% of the companies. This indicates the company’s readiness and openness towards digital transformation.
The Ministry of Economy has developed a new strategic framework aimed at achieving improved competitiveness of the Serbian industry and strengthening its position in the international market. The framework focuses on improving coordination of industrial development policy and increasing the efficiency of instruments for its implementation (Đaković, 2024). It requires the application and design of a balanced industrial policy that will enable or improve comparative advantage with lower prices and costs for standard products (Đuričin and Vuksanović Herceg, 2018).
According to the International Monetary Fund (2023), the Republic of Serbia is one of the emerging economies and it is classified a slower-middle-income economies by the World Bank (n.d.). The main characteristics of the emerging economies are a weak commercial and industrial base, low gross national income per capita, poor infrastructure and low living standards (Roztocki and Weistroffer, 2011), as well as higher poverty prevalence than in developed economies and limited access to essential services (Hossain et al, 2023). Studying the past successes and failures can help avoid future mistakes and guide more effective technology implementation. After the dissolution of Yugoslavia, the Republic of Serbia has been undergoing a prolonged post-transition process. The consequences of unfinished and ineffectively implemented reforms impact the shaping of its institutional and economic system. Key features of this legacy include fragmented policies, institutional gaps, limited infrastructural capacities and relatively weak administrative efficiency (Stamenović, 2019). In such a context, the possibility of implementing digital transformation depends primarily on factors such as facilitating conditions and the existing level of digitalization, while individual user perceptions (e.g., social influence or effort expectancy) have a secondary role (Al-Debei and Al-Lozi, 2012; Astuti and Ayinde, 2025; Sabiteka et al, 2025). This pattern is also characteristic of other post-transition countries of the Balkans and Eastern Europe, where institutional vacuums, lack of resources and poorly developed infrastructure are the main obstacles to digital transformation (World Bank Group, 2022; Zhang et al, 2023). However, due to limited academic research on technologies and their application in the developing and emerging countries, practical experience offers valuable lessons. The research presented in this paper fills the research gap regarding the application of Industry 4.0 technology in the manufacturing companies in the Republic of Serbia. On account of all these factors, it is important to define the main determinants that impact the adoption of Industry 4.0 technology in these companies as they may reflect trends observed in other emerging economies that are similar in terms of industrialization and technological development level with the Republic of Serbia, especially in Eastern Europe and the Balkan region (such as Bosnia and Herzegovina, Montenegro, North Macedonia, a part of Croatia, Slovenia, Greece, Romania and others). Understanding the determinants that impact technology adoption in the emerging economies is essential, as they differ from developed countries due to variations in digital literacy, infrastructure, social impacts and trust levels (Dwivedi et al, 2020).
The main technologies and concepts that are the most important for D&A are, among others: Internet of Things (IoT), Artificial Intelligence (AI) and Big Data (BD) (Abdallah et al, 2021). All these technologies increase the level of manufacturing companies’ D&A, where these technologies are mostly applied in finance and accounting (60.5%), planning and control (56.5%) and production (50.8%) (Čater et al, 2021). The production capacity and ability to store and share information are enabled by the application of IoT, AI and other technologies (OECD, 2017). IoT presents a technology that connects physical devices and different industrial objects to exchange data with other devices, widely applied in different industries and is considered one of the most applied technologies under I4.0 (Khang et al, 2024). In recent years, AI has been recognized as a strategically important technology of I4.0 that enhances and increases productivity (Zhang and Peng, 2025) and has been adopted by many industries, mostly in manufacturing, for business performance improvement (Dinmohammadi, 2023). The integration of AI and IoT enables “smart” applications that automate actions, monitor activities, manage tasks, predict outcomes and enhance decision-making in manufacturing and other sectors (Khang et al, 2024).
I4.0 involves equipment and machines that generate large and complex data. BD encompasses rapidly growing datasets that are difficult to manage with conventional database systems and tools while considering data volume, velocity and variety (Obitko and Jirkovský, 2015). The growing demand for safe and efficient “smart” manufacturing, along with new technological advancements, drives the adoption of IoT, AI and BD in companies, leading to the introduction of these technologies into “smart” manufacturing companies (Jagatheesaperumal et al, 2021). The benefits of implementing these technologies in manufacturing are undeniable. However, a question emerges: What are the factors that impact the adoption of these technologies in manufacturing companies? Due to the aforementioned reasons, this paper deals with these three technologies (IoT, AI and BD) for which an expanded Unified Theory of Acceptance and Use of Technology (UTAUT) model is proposed and tested. The UTAUT model is expanded by adding more determinants that more precisely quantify the technology adoption. Having in mind the specificities of each of these technologies, the expanded UTAUT model is tested on each of the three selected technologies to provide technology-specific insights. All three models are validated and compared. The ensuing conclusions are drawn, followed by the recommendations for the implementation of each technology. The data on which the models were tested was gathered from the manufacturing companies in the Republic of Serbia. Therefore, the main research question (RQ) of this paper is: Which determinant(s) impact technology (IoT, AI and BD) adoption and application in the manufacturing companies in the Republic of Serbia? Various stakeholders would gain benefits from the provided insights into technology adoption.
The paper consists of seven sections. After the introductory section, the second section outlines the devised and widely applied models for technology acceptance, focusing on their shortcomings. The third section presents the hypotheses development. The fourth section presents the research background and the instrument development. The fifth section presents the research results, survey and hypotheses results, for each technology. The sixth section presents the discussion of results, practical and theoretical contributions of the paper, hypotheses results, per hypothesis, and the response to the RQ. The seventh section outlines the conclusion, limitations and implications for future research.
To achieve success and reach defined objectives, companies need to use modern technologies and information systems. These technologies impact employees (Xu and Suzuki, 2025). To analyze technology adoption and factors that impact their implementation and acceptance, many different models and theories have been defined. Some of them are focused on factors that impact acceptance and technology adoption, while authors Venkatesh et al (2003) have created a specific UTAUT model that integrates elements of eight models for user acceptance. This model includes Performance Expectancy (PE), Effort Expectancy (EE) and Social Influence (SI)—three direct determinants of the intention to use that determine Behavioral Intention (BI), which are essential in the determination of user acceptance and user behavior, and two direct determinants of usage behavior, such as BI and Facilitating Conditions (FC) (Venkatesh et al, 2003).
Following the main objective of the paper and focusing on the impacts of technology acceptance to define key determinants, the authors had to determine which model is more appropriate for the analysis—the Technology Acceptance Model (TAM) or UTAUT. Both models were developed to better understand the reasons behind users’ acceptance or rejection of technology and to predict the adoption or rejection of new technology (Ammenwerth, 2019). TAM was designed to explain user acceptance in the context of organizational and task-oriented information technology, while its application for non-organizational and non-task-oriented circumstances is questionable, leading to the creation of the UTAUT, a new, improved model for technology acceptance (Kim, 2014). Even though the primary goal of TAM is to understand users’ perceptions and adoption of technology (Buabeng-Andoh and Baah, 2020), TAM was criticized for simplicity (Bagozzi, 2007), inability to incorporate external variables (Dishaw and Strong, 1999) and the omission of human and social factors (Davis, 1989b). Compared to TAM, UTAUT has superior predictive ability and a more comprehensive theory (Okumus et al, 2018). TAM was designed in 1986 (Davis, 1989a), while UTAUT was created in 2003 (Venkatesh et al, 2003), based on eight already existing models for technology acceptance. The UTAUT is widely used for the evaluation of technology usage, explaining 70% of usage (Tosuntaş et al, 2015). Additionally, the authors Ling et al (2011) conducted research through comparative analysis of TAM and UTAUT models and concluded that the UTAUT provides more accurate predictions compared to TAM.
However, the main limitations of both models should be mentioned. TAM is considered a simplified model that focuses on perceived usefulness and perceived ease of use, leading to the omission of complex variables that impact technology adoption (Lee et al, 2025), as well as the omission of determinants such as education or age, that could impact the technology acceptance (Zahid et al, 2013). The model is inadequate for practical use in companies with defined rules and regulations (Ajibade, 2018). The UTAUT model is considered to be too complex because it lacks individual characteristics, i.e., the characteristics that participate in the behavior and describe the dispositions of users that could be significant in explaining their behavior; moreover, that determinants of the original UTAUT model may lack universal applicability (Dwivedi et al, 2017). The UTAUT model can consist of some irrelevant determinants (Bervell and Umar, 2017) and some original UTAUT determinants become less significant by introducing new determinants (Blut et al, 2022).
Considering both advantages and limitations of these models, the authors of this paper concluded that the UTAUT model, i.e., its expanded version with the incorporated new determinants to predict behavioral intention and technology application (Venkatesh et al, 2016), is more suitable for the analysis in this paper than TAM. The UTAUT model is a widely accepted model that can be used as a supporting tool for strategy creation and decision-making (Al-Saedi et al, 2020).
Due to the limited academic research on information technology (IT) in developing and emerging countries, practical experience offers valuable lessons, while studying past successes and failures can help avoid future mistakes and guide more effective IT implementation (Roztocki and Weistroffer, 2011). The following will present the hypotheses (H) for all determinants that impact the intention to use the selected technologies (IoT, AI and BD) in the manufacturing companies in the Republic of Serbia. Additional determinants used for the expansion of the UTAUT model have been identified in other research as significant determinants in the process of technology adoption. For this reason, their inclusion in the model is empirically and theoretically justified. Because the results of the three UTAUT models will be presented, distinguished by technology, “name” in the defined hypotheses will be changed into the name of technology, i.e., IoT, AI or BD.
PE is defined as “the degree to which an individual believes that using the system will help him or her to attain gains in job performance” (Venkatesh et al, 2003) and is considered to be the main predictor of BI for technology adoption. PE highlights the significance of usefulness and benefits as the main factors of technology adoption and presents a determinant that determines the usage and adoption of technology (Venkatesh et al, 2003). Previous studies regarding technologies IoT (Ronaghi and Forouharfar, 2020), BD (Cabrera-Sánchez and Villarejo-Ramos, 2020) and AI (Li et al, 2024), argued that PE positively impacts adoption, application and the intention to use these technologies. Therefore, H1 can be defined: H1. PE has a positive impact on the BI to use “name” technology in manufacturing companies.
EE is defined as “the degree of ease associated with the use of the system” (Venkatesh et al, 2003) and is considered one of the most important determinants for BI examination (Kessler and Martin, 2017). The technology’s ease of use impacts its acceptance, especially in the initial stages of introducing or adopting innovation (Cimperman et al, 2016). A higher level of EE indicates that technology requires less energy and effort to use and manage (Or et al, 2011). EE positively impacts BI to use technology for users with little experience (Venkatesh et al, 2003). In the previous studies on technologies IoT (Xu and Suzuki, 2025), BD (Queiroz and Pereira, 2020) and AI (Li et al, 2024) it is argued that their EE positively impacts adoption, application and the intention to use technologies. Therefore, H2 can be defined: H2. EE has a positive impact on the BI to use “name” technology in manufacturing companies.
SI is defined as “the degree to which an individual perceives that important others believe he or she should use the new system” (Venkatesh et al, 2003). This determinant is crucial for technology adoption (Högg et al, 2010). The significance of SI shows that other people have a significant impact on an individual’s adoption behavior (Kessler and Martin, 2017). In the previous studies on technologies IoT (Xu and Suzuki, 2025), BD (Brünink, 2016) and AI (Gohil, 2023) it is argued that SI positively impacts adoption, application and the intention to use technologies. It can be inferred that a positive recommendation from other users can positively impact the implementation and the use of technologies. Therefore, H3 can be defined: H3. SI has a positive impact on the BI to use “name” technology in manufacturing companies.
FC is defined as “the degree to which an individual believes that an organizational and technical infrastructure exists to support the use of the system” (Venkatesh et al, 2003). It refers to how consumers or potential consumers perceive the resources and available support to engage in behavior (Brown and Venkatesh, 2005) and presents requirements and resources, as well as support the users’ need to adopt and use new technology effectively (Kessler and Martin, 2017). The access to technical support and its availability significantly impact BI (Or et al, 2011). In the previous studies on technologies IoT (Ronaghi and Forouharfar, 2020), BD (Cabrera-Sánchez and Villarejo-Ramos, 2020) and AI (Li et al, 2024) it is argued that their FC positively impacts adoption, application and the intention to use technologies. Therefore, H4 can be defined: H4. FC has a positive impact on the BI to use “name” technology in manufacturing companies.
A positive attitude towards digitalization and automation can enable faster and easier technology acceptance and use (Gillenson and Sherrell, 2002), and has a positive impact on implementation and technology adoption (Khalilzadeh et al, 2017; Nysveen and Pedersen, 2016). As people are more aware that D&A improves traditional business, it is possible to easily accept technology implementation. Therefore, H5 can be defined: H5. Attitudes to ADA of production processes have a positive impact on BI to use technologies for D&A in manufacturing companies.
When a company is oriented towards innovation and the management supports it, when employees believe that technologies can help them in their current work and improve existing processes, as well as to reduce or eliminate errors in work, when there is technical possibility to implement technologies, when some of the processes are already digitalized and automated, even at a low level, it is easier in such an environment to introduce and implement technologies for D&A of the production process (Zheng et al, 2020). Therefore, H6–H8 can be defined: H6. Awareness and Support (AS) of the management of the company have a positive impact on the BI to use technologies for D&A in manufacturing companies; H7. The Current Level of Digitalization and Automation (CLDA) in production processes in a manufacturing company has a positive impact on BI to use technologies for D&A in manufacturing companies; H8. Customer, Supplier and Warehouse Digitalized and Automated Activities (CSWDAA) have a positive impact on the BI to use technologies for D&A in manufacturing companies.
EF and IF are important and lead to changes. EF can impact the introduction of changes in companies (Hirzallah and Alshurideh, 2023), such as changes in market conditions, competitors, customers, suppliers and government regulations. The initiative for changes can arise from the company’s management, from the need for innovation of existing products or the introduction of new products, as well as from employees (Hirzallah and Alshurideh, 2023). EF and IF can impact changes (Damanpour et al, 2018). Information from different sources, e.g., internal (from the company, employees, and management) and external (from other business associations, customers, suppliers and others) can positively impact technology adoption (Fu et al, 2018). Therefore, H9 and H10 can be defined: H9. External factors (EF) have a positive impact on the BI to use technologies for D&A in manufacturing companies; H10. Internal factors (IF) have a positive impact on the BI to use technologies for D&A in manufacturing companies.
There are many barriers that negatively impact the adoption of technologies for D&A in production processes, such as financial costs and regulatory uncertainty (Fu et al, 2018), disapproval by employees, lack of recognition for construction, limited involvement of employees in decision-making, the cost of investments in machines and equipment (Ediriweera and Wiewiora, 2021), the lack of user knowledge, engagement, participation, training, technical skills and expertise, as well as dissatisfaction and resistance to change (Chouki et al, 2020). Therefore, H11 can be defined: H11. Barriers (B) have a negative impact on the BI to use technologies for D&A in manufacturing companies.
The expanded UTAUT model for this research, with hypotheses, is presented in Fig. 1, where “plus” (+) presents a positive, while “minus” (–) presents a negative impact of the determinant on the BI. Also, since all three technologies are digital technologies that can be applied to the D&A of production processes, hypotheses H5–H11 refer to all these technologies. To verify the proposed conceptual model, Structural Equation Modelling (SEM) will be employed. SEM is the widely used and acknowledged analysis for conceptual model verification (Kline, 2023). Having in mind the sample size and model complexity, Covariance-Based (CB-SEM) modelling was employed using AMOS 22 (IBM AMOS, Version 22.0, IBM Corporation, Armonk, NY, USA). Descriptive statistics and scale reliability were explored using SPSS 25 (IBM SPSS Statistics, Version 25.0, IBM Corporation, Armonk, NY, USA).
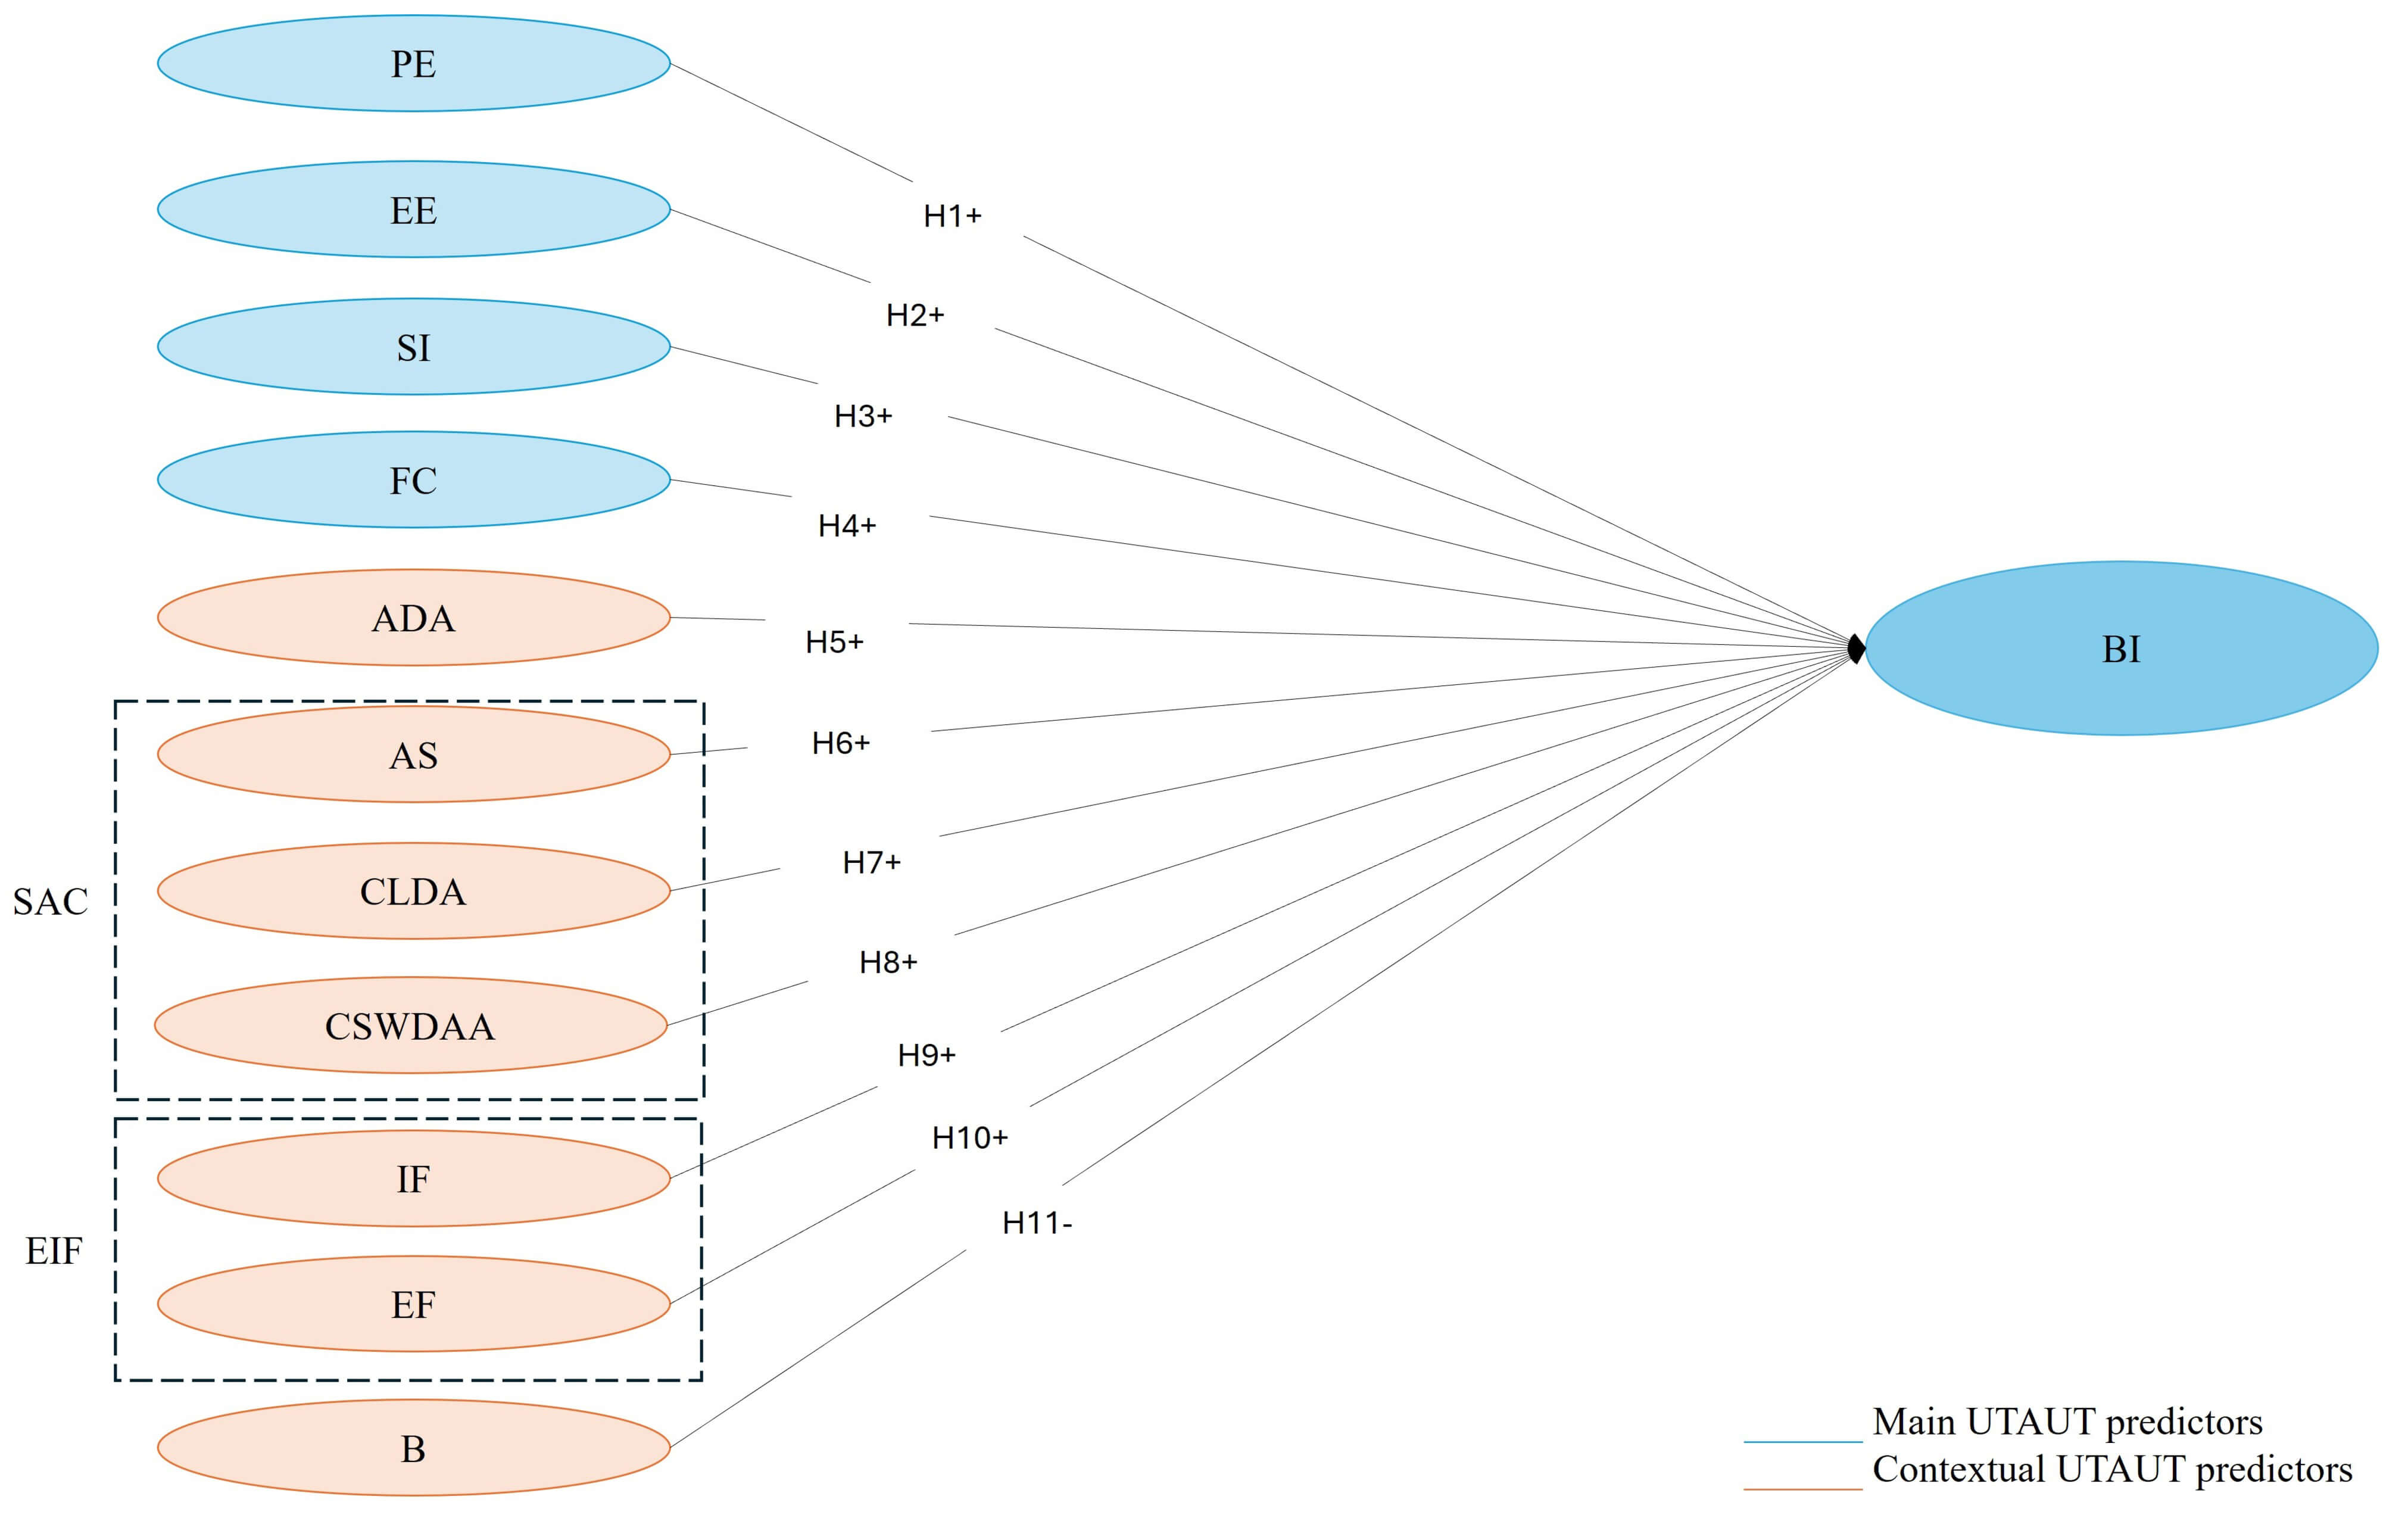 Fig. 1.
Research model - expanded UTAUT model with hypotheses for technology adoption in manufacturing companies. UTAUT, Unified Theory of Acceptance and Use of Technology; PE, Performance Expectancy; EE, Effort Expectancy; SI, Social Influence; FC, Facilitating Conditions; ADA, Attitudes towards Digitalization and Automation; AS, Awareness and Support; CLDA, Current Level of Digitalization and Automation; CSWDAA, Customer, Supplier and Warehouse Digitalized and Automated Activities; SAC, Support and Abilities to Change; EIF, External and Internal Factors; IF, Internal Factors; EF, External Factors; B, Barriers; BI, Behavioral Intention. “plus” (+) presents positive impact of the determinant on the BI; “minus” (–) presents a negative impact of the determinant on the BI.
This section presents a research background regarding manufacturing companies and D&A in the Republic of Serbia, as well as the development of the research instrument used in this research—a survey.
According to the results presented in Gligorijević et al (2020), in the Republic of Serbia, the industries with low technology development are dominant, while their share is significantly higher compared to the global averages. The current status of D&A processes in the Republic of Serbia is at a low level, where nearly one in three manufacturing companies have not implemented any digital technologies (Palčić et al, 2022). Despite the ongoing D&A in the manufacturing sector in the Republic of Serbia, there are many challenges, such as poor company structure and slow export growth (Ćorović et al, 2019), while the main challenge is the awareness that D&A can be achieved only by purchasing and installing software, with insufficient focus on the proper application and the restricted use of technologies (Rejman Petrovic et al, 2024), as well as by slow introduction of new and technologically advanced products (Trajkovic and Mihajlovic, 2021). By implementing technologies for D&A that lead to total digitalization of production, there is the possibility to improve the economic and export growth of the Republic of Serbia and to create new job positions (Prokopović et al, 2020). However, in recent years, this country has made significant progress in digitalization, where the government recognized its importance and adopted a Digital Agenda to strengthen the digital economy of the country (Rajković et al, 2024). Therefore, this paper focuses on the research about technologies for D&A, their implementation level and the factors that impact their application in the manufacturing companies in the Republic of Serbia.
For this research, an online anonymous survey was conducted using Google Forms in the Republic of Serbia in October and November 2024. A survey presents a method used to collect data or information in a structured and systematic manner (Krishnan and Poulose, 2016). The survey was conducted in mother tongue—Serbian—to ensure the reliability and accuracy of the results, as well as to ensure that respondents clearly understood the questions and are able to provide the most accurate responses. To ensure the validity of the results and prevent double entries, the survey settings limited one entry per respondent. Determinants’ measurement was performed using a five-point Likert scale where: 1 (Strongly disagree), 2 (Disagree), 3 (Neutral), 4 (Agree) and 5 (Strongly agree). Likert scale is a method for measuring attitudes (Batterton and Hale, 2017) that can “quantify subjective preferential thinking, feeling and action in a validated and reliable manner” (Joshi et al, 2015). This method measures the level of agreement of respondents with the given statements on some scale. For the measurement of determinants PE, EE, SI and FC, the standard questions for the UTAUT model were used, following the examples from Al-Saedi et al (2020) and Khalilzadeh et al (2017). The main objective of these questions is to examine whether respondents believe that the use of technology will increase work efficiency (PE), whether they believe that the technology is easy to use (EE), whether other people or environment impact technology acceptance (SI), whether company has adequate structure and resources to implement such technology (FC) (Venkatesh et al, 2003) and to examine how it will impact the intention to use such technologies. The respondents were selected to be relevant for the survey in terms of their roles and positions, knowledge and experience, so that they could provide more accurate and relevant responses requested by this survey. These respondents can be considered as the key informants, who provide high-quality and technically precise information because they use the selected technologies in their everyday work within the manufacturing company they work for (Hughes and Preski, 1997; Marshall, 1996). For this research, it was important to examine the opinions, perceptions and attitudes of key informants within the company, to analyze the personal attitude of employees towards technology acceptance. Focusing on individual employees, instead of the company as a whole, enables identification of real motivations and obstacles, a precise understanding of perceptions and personal attitudes towards technology, as well as obtaining valid data that can be directly applied to the successful implementation of innovations. For this reason, an individual employee is selected rather than the company as a whole.
This section presents the results of the survey conducted in the manufacturing companies in the Republic of Serbia, descriptive statistics and sample analysis, as well as the results from the expanded UTAUT model applied to the three selected technologies. The sample size was 330 people, i.e., 330 companies, given that one person per company was contacted. A total of 228 out of 330 people, i.e., companies, participated in the anonymous online survey, that is a 69.09% response rate. This can be considered a high response rate, since “the average online survey response rate is 44.1%” (Wu et al, 2022). The published articles on the topic of the application of digital technologies in manufacturing companies had a smaller number of surveyed manufacturing companies, with 100 manufacturing companies and scientific research institutes in Poland (Woźniak et al, 2021), 103 manufacturing companies in Italy (Zheng et al, 2020), 219 manufacturing companies from automotive and allied industries in South Africa (Bag et al, 2021), and others. The results of the research presented in this paper can be considered relevant, given that the representativeness of the sample is high, above the average response rate.
The questions in the survey were divided into four sections. The first section was related to the respondents’ personal information. The second section was related to the companies’ information. The third section was related to the respondents’ opinions and knowledge regarding these three technologies. The fourth section was related to the technologies and questions about technology adoption for the expanded UTAUT models. The survey results will be displayed in this order.
The results regarding the respondents’ characteristics are presented in Table 1. For each characteristic, the category values, the frequency and the sample percentage are provided.
| Characteristics | Values | Frequency | Percentage |
| Gender | Male | 137 | 60.09% |
| Female | 91 | 39.91% | |
| Age | Range—from 21 to 70 years, mean—38.36 years, std.—10.57 | ||
| No. of years working in the manufacturing sector | Range—from 1 to 40 years, mean—10.83 years, std.—8.89 | ||
| No. of years working in current company | Range—from 0 to 40 years, mean—7.5 years, std.—7.51 | ||
| Educational attainment | High School or Gymnasium | 34 | 14.91% |
| Three-year Education | 32 | 14.04% | |
| Undergraduate Education | 63 | 27.63% | |
| Graduate Education | 96 | 42.11% | |
| Doctoral Education | 3 | 1.32% | |
No., number; std., standard deviation.
Regarding gender, a slight disproportion can be noticed. This was not perceived as an issue, as in the Republic of Serbia, there are more males than females employed (Statistical Office of the Republic of Serbia, 2024). Although the age range is high, most of the respondents are middle-aged (38.36 years), indicating a certain level of work experience. The result regarding the range and average number of years that respondents work in the manufacturing sector additionally confirms that the respondents are experienced workers in the manufacturing sector. The similar range applies to the next question. One possible reason is that the respondents with the highest number of years of experience have remained with the same company since the start of their professional careers. Regarding the question of the highest completed education level, the highest percentage of respondents have completed Graduate education. Such a result indicates that the sample covers highly educated and experienced workers in manufacturing. Most respondents work in Production (43.86%), Logistics (8.77%) and Quality Control (7.02%) departments. They also work in other departments, but at a significantly lower percentage.
Besides providing information on the respondents, it is of interest to observe the companies’ information as well. The companies whose respondents took part in the survey are mostly located in the cities: Belgrade (16.23%), Arandjelovac (10.09%), Subotica (4.39%) and Novi Sad (3.95%). Concerning the number of years the surveyed companies have been active in the market of the Republic of Serbia, the majority of them have been operating for 51 or more years (20.18%), while the minority have been in operation for 41–50 years (4.39%). Regarding the number of employees and the size of the company, most companies are large companies, with more than 250 employees (54.82%), and medium-sized companies with between 51 and 250 employees (25.44%). This result indicates that more than half of the sample consists of large companies. Since the intention to adopt technology increases with company size, large companies have a greater need and willingness to implement and adopt technologies in production (Cirillo et al, 2023) and are more prone to adopting innovations, especially when setting up new equipment (Bellas and Nentl, 2007). A total of 95.61% of respondents work in privately owned companies, 2.63% work in combined (government and private ownership) and only 1.8% in state-owned enterprises. Based on the Regulation on the classification of activities, under the Law of the Republic of Serbia (Paragraph, 2010), the industrial production sector to which the company belongs is presented in the following: the most belongs to 10 Food product manufacturing (21.05%), 11 Beverage manufacturing (15.35%), 32 Other manufacturing activities (15.35%) and 25 Manufacture of fabricated metal products, except machinery and equipment (14.47%). Other categories are presented by a significantly lower percentage. The two-digit number presents the code of the industrial production sector in the observed regulation. The question related to the market type where the company that operates in the Republic of Serbia sells its products was a multiple-choice question. The responses show the following: 68.9% of companies operate on the international market, 41.2% on the regional market, 32.5% on the local market, while the least 31.6% operate on the national market. Almost half of the surveyed companies have 51 or more different products from the company’s assortment (46.9%), 21.9% have between 1 and 10 different products and the least (4.8%) have between 31 and 40 different products. The dominant type of production is serial production (54.8%), while 28.9% is mass production and 16.2% is individual production.
Before the list of questions regarding the UTAUT model and its expanding determinants, the authors of this paper sought to observe the respondents’ perceptions of familiarity, current level of application and perceived importance of application of each of these technologies in the manufacturing process. The three questions (Q) were asked per technology on a Likert scale from 1 (I am not familiar at all/It is not implemented at all/Technology implementation is irrelevant) to 5 (I am completely familiar/It is fully implemented/Technology implementation is of utmost importance). The results per technology are presented in Table 2.
| Technology | Familiarity | Level of implementation | Importance of implementation | |||
| Mean | Std. | Mean | Std. | Mean | Std. | |
| IoT | 2.98 | 1.30 | 2.52 | 1.42 | 3.45 | 1.61 |
| BD | 3.00 | 1.28 | 2.90 | 1.45 | 3.94 | 1.60 |
| AI | 2.52 | 1.18 | 1.91 | 1.18 | 3.06 | 1.56 |
| Mean | 2.83 | 2.44 | 3.48 | |||
| Std. | 0.27 | 0.5 | 0.44 | |||
Std., standard deviation; IoT, Internet of Things; BD, Big Data; AI, Artificial Intelligence.
The responses to Q1. How familiar respondents are with the technologies that are applied for business digitalization and process automation in manufacturing companies show that the respondents are the most familiar with BD technology (3.00), and the least with AI (2.52). The responses to Q2. Respondents indicate the current level of application of technologies for the D&A of production processes in the observed company shows that respondents mostly use BD (2.90), while AI is the least used technology (1.91). Finally, the responses to Q3. The importance of the implementation of technologies in the observed company for raising the level of D&A of production processes for the improvement of production management shows that, according to the respondents, among the three technologies, the most important is BD (3.94), while the least important is AI (3.06). The results indicate that the respondents are somewhat acquainted with the three technologies that are not highly implemented in the companies, and that the perception of their importance for the production process is highly positive.
The proposed expanded UTAUT model contains two parts: the part specific to each technology (UTAUT model) and the situational determinants that refer to general perceptions. Therefore, for the three models, the additional seven determinants whose impact on the BI was explored in this research (ADA, AS, CLDA, CSWDAA, IF, EF and B) are the same. Before exploring the validity of each expanded UTAUT model, Table 3 presents the additional determinants’ scale reliability and validity, with the associated values of Cronbach’s Alpha, Average Variance Explained (AVE), Composite Reliability (CR), mean and variance per scale.
| Determinants | No. of questions | Cronbach’s Alpha | AVE | CR | Mean | Variance |
| ADA | 8 | 0.924 | 0.661 | 0.940 | 4.156 | 0.022 |
| AS | 5 | 0.893 | 0.708 | 0.923 | 3.631 | 0.057 |
| CLDA | 6 | 0.807 | 0.518 | 0.861 | 2.931 | 0.088 |
| CSWDAA | 3 | 0.844 | 0.766 | 0.907 | 2.851 | 0.039 |
| EF | 5 | 0.799 | 0.564 | 0.865 | 3.583 | 0.030 |
| IF | 4 | 0.790 | 0.615 | 0.864 | 3.680 | 0.035 |
| B | 12 | 0.850 | 0.582 | 0.880 | 3.229 | 0.203 |
No., number; AVE, Average Variance Explained; CR, Composite Reliability; ADA, Attitudes Towards Digitalization and Automation; AS, Awareness and Support; CLDA, Current Level of Digitalization and Automation; CSWDAA, Customer, Supplier and Warehouse Digitalized and Automated Activities; EF, External Factors; IF, Internal Factors; B, Barriers.
High Cronbach’s Alpha (
The first SEM model that will be verified is for IoT technology. As the proposed conceptual model encompasses elements and perceptions that are related to technology, Appendix Table 8 presents the original UTAUT scale reliability for IoT. The measured Cronbach’s Alpha ranges from 0.719 (FC) to 0.948 (PE), that shows that the scales are reliable without the need for altering structures, since Cronbach’s Alpha is above 0.71, ranging from good to excellent (Taber, 2017). All measured AVEs and CRs are also above the defined thresholds, indicating convergent validity and internal consistency of the scales (Hair et al, 2010). Besides the scale’s reliability, Appendix Table 8 also presents the scale’s descriptive statistics. The scale with the highest mean value is EE (3.914), indicating that the respondents vastly agree with the statements. At the same time, the scale FC has the highest standard deviation (0.378), suggesting that the answers within this scale vary.
Harman’s Single-Factor Test was used to assess common method bias (CMB). This test is based on exploratory factor analysis (EFA) using principal axis factoring to identify the proportion of variance attributed to a single factor (Aguirre-Urreta and Hu, 2019). If the one retained factor explains less than 50% of variance, there is no CMB in the data (Podsakoff et al, 2003). The obtained result for the IoT model indicates that the first factor accounts for 12.894% of the total variance, which is visibly below the threshold of 50% (Podsakoff et al, 2003). Therefore, common method bias is not a significant issue in this model.
Discriminant validity was assessed using the Fornell–Larcker criterion (Fornell and Larcker, 1981). Due to the size and complexity of the correlation matrix, only the final interpretation is presented here. The square root of the Average Variance Extracted (AVE) for each construct was greater than its correlations with all other constructs, indicating that each construct shares more variance with its own indicators than with any other construct. Thus, the Fornell–Larcker criterion for discriminant validity was satisfied.
Besides Harman’s Single-Factor Test and Fornell–Larcker criterion, Common latent factor (CLF) analysis was employed to assess CMB. CLF is a structural equation modeling technique employed to assess and control for CMB by specifying a latent factor that loads on all observed variables. The CLF accounts for systematic variance attributable to measurement artefacts, such as response tendencies or social desirability, rather than the theoretical constructs under investigation. Substantial improvements in model fit or notable shifts in factor loadings following the inclusion of the CLF provide evidence of CMB (MacKenzie and Podsakoff, 2012). To provide a clearer overview of the findings, the outcomes and conclusions of the CLF analysis are reported alongside the Confirmatory Factor Analysis (CFA) results. The same procedure was done for the AI and BD models.
As an additional pretest, the CFA was conducted and the following results were
obtained: Chi square = 2965.608, Degrees of Freedom (df) = 1473, Comparative Fit Index (CFI) = 0.836,
Tucker-Lewis Index (TLI) = 0.822, Root Mean Square Error of Approximation (RMSEA)
= 0.067. The results show a solid fit, considering the model complexity. The only
construct which showed factor loadings close to the 0.5 threshold is B. Such a
result could have been expected as various barriers have been considered.
Therefore, we did not observe the results as an obstacle for further modelling. A
similar approach was proposed by Trimmer (2014) in the case when the measured
loadings were close to the threshold. When a CLF was introduced to account for
potential common method bias, the model fit deteriorated (Chi square = 3288.262,
CFI = 0.806, TLI = 0.797, RMSEA = 0.071). The decreases in CFI (
The quality of the initial SEM model is the following: Chi square = 3798.861, df = 1528, CFI = 0.749, TLI = 0.738, RMSEA = 0.081. The high value of the Chi square statistics can be explained by discrepancies between data and the suggested model, as well as the sample size. CFI and TLI indices are below the suggested threshold, indicating a place for model improvement. The RMSEA is below the 0.1 threshold, indicating a satisfactory result. Therefore, the initial model was modified. Non-latent variable structures were not changed, as all statements/items were statistically significant. As a guide to model improvement, modification indices were used. The quality of the final model is the following: Chi square = 2790.493, df = 1497, CFI = 0.857, TLI = 0.848, RMSEA = 0.062, 90% Confidence Interval (CI) [0.058, 0.065], Standardized Root Mean Square Residual (SRMR) = 0.101. The value of the Chi square statistics decreased, while the CFI and TLI were closer to the 0.9 thresholds. Still, the CFI (0.857) and TLI (0.848) were below the commonly recommended thresholds of 0.95 for confirmatory models (Hu and Bentler, 1999). The value of the RMSEA was additionally lowered and is below the 0.08 cutoff (Browne et al, 1993). The cutoff is not covered by the RMSEA confidence interval as well. The measured SRMR is above the cutoff of 0.08, however, SRMR is known to inflate in complex models (Goretzko et al, 2024). The value of the RMSEA was additionally lowered. Having in mind the model complexity and the sample size, this model is of solid quality and can be interpreted (Table 4).
| Dependent | Predictors | UnStd. coeff | Std. coeff | C.R. | p-value | R2 |
| BI | PE | 0.328 | 0.311 | 5.016 | 0.000* | 46.3% |
| EE | –0.114 | –0.095 | –0.944 | 0.345 | ||
| SI | 0.145 | 0.109 | 1.426 | 0.154 | ||
| FC | 0.815 | 0.527 | 5.202 | 0.000* | ||
| ADA | –0.044 | –0.030 | –0.504 | 0.614 | ||
| AS | –0.125 | –0.129 | –1.300 | 0.193 | ||
| CLDA | 1.327 | 0.453 | 3.004 | 0.003* | ||
| CSWDAA | –0.007 | –0.006 | –0.080 | 0.936 | ||
| EF | –0.065 | –0.042 | –0.487 | 0.626 | ||
| IF | –0.050 | –0.026 | –0.292 | 0.770 | ||
| B | 0.085 | 0.059 | 0.992 | 0.321 |
UnStd. coeff, Unstandardized coefficient; Std. coeff, Standardized coefficient; C.R., Critical Ratio; *, statistically significant; R2, Coefficient of determination; PE, Performance Expectancy; EE, Effort Expectancy; SI, Social Influence; FC, Facilitating Conditions; ADA, Attitudes Towards Digitalization and Automation; AS, Awareness and Support; CLDA, Current Level of Digitalization and Automation; CSWDAA, Customer, Supplier and Warehouse Digitalized and Automated Activities; EF, External Factors; IF, Internal Factors; B, Barriers; BI, Behavioral Intention.
Out of 11 predictors, three are statistically significant: PE, FC and CLDA. All three of them have a positive impact on BI, indicating, for example, that a rise in PE leads to increased BI. The model explains 46.3% of the variability of BI, that can be considered solid. Other determinants are not statistically significant. Based on their values, the results support H1, H4 and H7 and not support H2, H3, H5, H6, H8, H9, H10 and H11.
As a robustness check, we performed the Split-Half Validation (Munkholm et al, 2012). Split-Half Validation randomly divides the sample in two groups,
estimates the model on each and compares it. The model demonstrates acceptable
stability across the two subsamples, with only minor differences in fit indices
(
The second SEM model that will be verified is the model for AI technology. As the proposed conceptual model encompasses elements and perceptions that are related to technology, Appendix Table 9 presents the original UTAUT scale reliability for AI. The measured Cronbach’s Alpha ranges from 0.7629 (FC) to 0.961 (PE), that shows that the scales are reliable without the need for altering structures, since Cronbach’s Alpha is above 0.7 (Taber, 2017). All measured AVEs and CRs are also above the defined thresholds, indicating convergent validity and internal consistency of the scales (Hair et al, 2010). Besides the scale’s reliability, Appendix Table 9 also presents the scale’s descriptive statistics. The scale with the highest mean value is EE (3.730), indicating that the respondents vastly agree with the statements. At the same time, the scale FC has the highest standard deviation (0.197), suggesting that the answers within this scale vary.
The obtained result for the Harman’s Single-Factor Test for the AI model indicates that the first factor accounts for 13.341% of the total variance, which is visibly below the threshold of 50% (Podsakoff et al, 2003). Therefore, common method bias is not a significant issue in this model as well.
The Fornell–Larcker criterion for discriminant validity was satisfied as the square root of the AVE for each construct was greater than its correlations with all other constructs, indicating that each construct shares more variance with its own indicators than with any other construct.
Next, the CFA was conducted and the following results were obtained: Chi square
= 2894.964, df = 1473, CFI = 0.856, TLI = 0.844, RMSEA = 0.065. Again, the only
construct which showed factor loadings close to the 0.5 threshold is B. As in the
previous model, we did not observe the results as an obstacle for further
modelling. Incorporating a common latent factor to account for potential common
method bias resulted in slightly poorer fit indices (Chi square = 3259.344, CFI =
0.823, TLI = 0.815, RMSEA = 0.071), with
The quality of the initial SEM model is the following: Chi square = 3804.464, df = 1528, CFI = 0.769, TLI = 0.758, RMSEA = 0.081. The initial model quality is similar to the initial model quality for IoT. Therefore, the initial model was modified. Non-latent variable structures were not changed, as all statements/items were statistically significant. As a guide to model improvement, modification indices were used. The quality of the final model is the following: Chi square = 3019.337, df = 1510, CFI = 0.847, TLI = 0.838, RMSEA = 0.066, 90% CI [0.063, 0.070], SRMR = 0.116. The value of the Chi square statistics decreased, while the CFI and TLI were closer to the 0.9 thresholds. The value of the RMSEA was additionally lowered and is below the 0.08 cutoff (Browne et al, 1993). The value of the RMSEA was additionally lowered. Having in mind the model complexity, which inflated the SRMR to an extent, and the sample size, our model is of solid quality and can be interpreted (Table 5).
| Dependent | Predictors | UnStd. coeff | Std. coeff | C.R. | p-value | R2 |
| BI | PE | 0.332 | 0.329 | 4.856 | 0.000* | 58.3% |
| EE | –0.157 | –0.130 | –1.373 | 0.170 | ||
| SI | 0.326 | 0.274 | 3.573 | 0.000* | ||
| FC | 0.802 | 0.572 | 5.634 | 0.000* | ||
| ADA | –0.128 | –0.084 | –1.717 | 0.086 | ||
| AS | –0.152 | –0.148 | –1.686 | 0.092 | ||
| CLDA | 0.649 | 0.229 | 2.258 | 0.024* | ||
| CSWDAA | 0.167 | 0.122 | 2.464 | 0.014* | ||
| EF | 0.234 | 0.141 | 1.944 | 0.052 | ||
| IF | –0.327 | –0.173 | –2.274 | 0.023* | ||
| B | 0.037 | 0.022 | 0.431 | 0.666 |
UnStd. coeff, Unstandardized coefficient; Std. coeff, Standardized coefficient; C.R., Critical Ratio; *, statistically significant; R2, Coefficient of determination; PE, Performance Expectancy; EE, Effort Expectancy; SI, Social Influence; FC, Facilitating Conditions; ADA, Attitudes Towards Digitalization and Automation; AS, Awareness and Support; CLDA, Current Level of Digitalization and Automation; CSWDAA, Customer, Supplier and Warehouse Digitalized and Automated Activities; EF, External Factors; IF, Internal Factors; B, Barriers; BI, Behavioral Intention.
Out of 11 predictors, six are statistically significant: PE, SI, FC, CLDA, CSWDAA and IF. Five of them (PE, SI, FC, CLDA and CSWDAA) have a positive impact on BI, indicating, for example, that a rise in PE leads to increased BI. The lowest negative impact on BI has IF, indicating that the rise of IF decreases BI. The model explains 58.3% of the variability of BI, that can be considered solid. Other determinants are not statistically significant. Based on their values, the results support H1, H3, H4, H7 and H8 and not support H2, H5, H6, H9, H10 and H11.
Split-Half Validation showed that the model demonstrates acceptable stability
across the two subsamples, with negligible differences in fit indices
(
The third SEM model that will be verified is the model for BD technology. As the proposed conceptual model encompasses elements and perceptions that are related to technology, Appendix Table 10 presents the original UTAUT scale reliability for the BD. The measured Cronbach’s Alpha ranges from 0.773 (FC) to 0.985(BI), that shows that the scales are reliable without the need for altering structures, since Cronbach’s Alpha is above 0.7 (Taber, 2017). All measured AVEs and CRs are also above the defined thresholds, indicating convergent validity and internal consistency of the scales (Hair et al, 2010). Besides the scale’s reliability, Appendix Table 10 also presents the scale’s descriptive statistics. The scale with the highest mean value is PE (3.728), indicating that the respondents vastly agree with the statements. At the same time, the scale FC has the highest standard deviation (0.090), suggesting that the answers within this scale vary.
The obtained result for the Harman’s Single-Factor Test for the BD model indicates that the first factor accounts for 13.257% of the total variance, which is visibly below the threshold of 50% (Podsakoff et al, 2003). Therefore, common method bias is not a significant issue in this model as well.
The Fornell–Larcker criterion for discriminant validity was satisfied as the square root of the AVE for each construct was greater than its correlations with all other constructs, indicating that each construct shares more variance with its own indicators than with any other construct.
Next, the CFA was conducted and the following results were obtained: Chi square
= 2964.627, df = 1473, CFI = 0.855, TLI = 0.843, RMSEA = 0.067. Again, the only
construct which showed factor loadings close to the 0.5 threshold is B. As in the
previous model, we did not observe the results as an obstacle for further
modelling. When a CLF was introduced to control for potential common method bias,
the overall model fit decreased (Chi square = 3230.935, CFI = 0.816, TLI = 0.807,
RMSEA = 0.075). The reductions in CFI (
The quality of the initial model is the following: Chi square = 4130.599, df = 1529, CFI = 0.746, TLI = 0.735, RMSEA = 0.087. The initial model quality is similar to the initial model quality for IoT and AI. Therefore, the initial model was modified. Non-latent variable structures were not changed, as all statements/items were statistically significant. As a guide to model improvement, modification indices were used. The quality of the final model is the following: Chi square = 3333.771, df = 1518, CFI = 0.847, TLI = 0.838, RMSEA = 0.066, 90% CI [0.069, 0.076], SRMR = 0.118. The value of the Chi square statistics decreased, while the CFI and TLI were closer to the 0.9 thresholds. The value of the RMSEA was additionally lowered and is below the 0.08 cutoff (Browne et al, 1993), and the RMSEA confidence interval does not cover the cutoff. Having in mind the model complexity and the sample size, this model is of solid quality and can be interpreted (Table 6).
| Dependent | Predictors | UnStd. coeff | Std. coeff | C.R. | p-value | R2 |
| BI | PE | 0.596 | 0.499 | 6.585 | 0.000* | 60.3% |
| EE | –0.252 | –0.240 | –3.560 | 0.000* | ||
| SI | 0.172 | 0.147 | 2.725 | 0.006* | ||
| FC1 | 0.003 | 0.003 | 0.046 | 0.963 | ||
| FC2 | 0.517 | 0.564 | 9.771 | 0.000* | ||
| ADA | 0.028 | 0.020 | 0.393 | 0.694 | ||
| AS | –0.077 | –0.076 | –1.433 | 0.152 | ||
| CLDA | 0.401 | 0.137 | 2.415 | 0.016* | ||
| CSWDAA | 0.003 | 0.002 | 0.043 | 0.966 | ||
| EF | 0.174 | 0.112 | 1.619 | 0.105 | ||
| IF | –0.399 | –0.228 | –3.134 | 0.002* | ||
| B | 0.006 | 0.004 | 0.046 | 0.963 |
UnStd. coeff, Unstandardized coefficient; Std. coeff, Standardized coefficient; C.R., Critical Ratio; *, statistically significant; R2, Coefficient of determination; PE, Performance Expectancy; EE, Effort Expectancy; SI, Social Influence; FC1, Facilitating Conditions 1; FC2, Facilitating Conditions 2; ADA, Attitudes Towards Digitalization and Automation; AS, Awareness and Support; CLDA, Current Level of Digitalization and Automation; CSWDAA, Customer, Supplier and Warehouse Digitalized and Automated Activities; EF, External Factors; IF, Internal Factors; B, Barriers; BI, Behavioral Intention.
Given that FC had a negative variance in the model assessment analysis, it had to be divided into two predictors, where one has (FC2) and the other has no significance (FC1). The issue encountered was not observed as an issue. Namely, the same situation was noted in previous research using UTAUT and UTAUT2 models (Amalia, 2019; Rudhumbu, 2022). It is especially worth mentioning that according to Park et al (2011), “the facilitating conditions scale of the UTAUT model is not unidimensional even with the original measurement items”. Led by the listed literature on the UTAUT and issues in its modeling, we decided to continue with modeling and model interpretation.
Out of 11 predictors, six are statistically significant: PE, EE, SI, FC2, CLDA and IF. Four of them (PE, SI, FC2 and CLDA) have a positive impact on BI, indicating, for example, that a rise in PE leads to increased BI, while two of them (EE and IF), have a negative impact on BI, i.e., a rise of them leads to a decrease in BI. The model explains 60.3% of the variability of BI, that can be considered solid. Other determinants are not statistically significant. Based on their values, the results support H1, H3, H4 and H7 and not support H2, H5, H6, H8, H9, H10 and H11.
Split-Half Validation showed that the model demonstrates acceptable stability
across the two subsamples, with negligible differences in fit indices
(
A list of all determinants of the proposed extended UTAUT model with corresponding items and sources is presented in Appendix Table 11. Final results with hypothesis status for all three technologies are presented in Table 7.
| Hypothesis (H) | Relationship | Technologies | Final | ||
| IoT | AI | BD | |||
| H1 | PE |
Supported | Supported | Supported | Supported |
| H2 | EE |
Not supported | Not supported | Not supported | Not supported |
| H3 | SI |
Not supported | Supported | Supported | Supported |
| H4 | FC |
Supported | Supported | Supported (FC2) | Supported |
| H5 | ADA |
Not supported | Not supported | Not supported | Not supported |
| H6 | AS |
Not supported | Not supported | Not supported | Not supported |
| H7 | CLDA |
Supported | Supported | Supported | Supported |
| H8 | CSWDAA |
Not supported | Supported | Not supported | Not supported |
| H9 | EF |
Not supported | Not supported | Not supported | Not supported |
| H10 | IF |
Not supported | Not supported | Not supported | Not supported |
| H11 | B |
Not supported | Not supported | Not supported | Not supported |
| Overall | 3 supported, | 5 supported, | 4 supported, | 4 supported, | |
| 8 not supported | 6 not supported | 7 not supported | 7 not supported | ||
PE, Performance Expectancy; EE, Effort Expectancy; SI, Social Influence; FC, Facilitating Conditions; ADA, Attitudes Towards Digitalization and Automation; AS, Awareness and Support; CLDA, Current Level of Digitalization and Automation; CSWDAA, Customer, Supplier and Warehouse Digitalized and Automated Activities; EF, External Factors; IF, Internal Factors; B, Barriers; BI, Behavioral Intention.
This study, based on the three expanded UTAUT models, provides a deeper understanding of how various determinants impact the adoption of three technologies for D&A of production processes (IoT, AI and BD) in the manufacturing companies in the Republic of Serbia. The results from 228 surveyed manufacturing companies in the Republic of Serbia show that PE, FC and CLDA had a significantly positive impact on BI to use all these technologies. The research findings are discussed in detail, per hypothesis. The research results in this paper have provided practical and theoretical contributions. Regarding the theoretical contributions, the first is a presentation of the theoretical background of D&A, I4.0, their connection and related technologies. The second is an explanation of models for technology acceptance, pointing out differences between the UTAUT and TAM models, as the two most applied models that are mostly used for the measurement of technology acceptance. Regarding practical contribution, the first is that this paper presents the results of the survey conducted in 228 manufacturing companies in the Republic of Serbia, with a very high response rate (almost 70%) that indicates the significance of the results and the current situation in the manufacturing companies in this country. The second is that, based on the survey, the additional determinants of the expanded UTAUT model for the adoption of three technologies are defined. The third is that this paper points out the main determinants that positively and negatively impact the intention to use these technologies. The following are presented hypotheses results and suggestions for improving the impact of determinants on BI, for all three technologies. H1. PE has a positive impact on the BI to use “name” technology in manufacturing companies. The first hypothesis for all three technologies is supported, i.e., PE has a significant positive impact on BI to use IoT, AI and BD, while it has the strongest impact on BI of BD. This supports the results in previous studies, i.e., for IoT (Xu and Suzuki, 2025), AI (Gansser and Reich, 2021) and BD (Cabrera-Sánchez and Villarejo-Ramos, 2020) supporting H1. The higher the PE, i.e., performance efficiency of technologies, the higher the BI to use these technologies. This result shows that the respondents believe that the implementation of these technologies will provide strong performance and that they are aware that focusing on the implementation of IoT, AI and BD will improve performance in production processes. H2. EE has a positive impact on the BI to use “name” technology in manufacturing companies. The impact of the determinant EE on BI was not supported in all three models. The higher the EE, i.e., ease of using BD, the lower the BI to use such technology, that supports the results in previous studies, IoT (Li et al, 2024), AI (Gohil, 2023) and BD (Brünink, 2016). This does not support H2, showing that respondents consider the application of these technologies complicated and complex. Therefore, the ease of using these technologies should be highlighted, enabling simplified instructions, as well as improved training, so the employees in the manufacturing companies in the Republic of Serbia could understand that without big effort they can use IoT, AI and BD in production processes. H3. SI has a positive impact on the BI to use “name” technology in manufacturing companies. The results supported hypothesis H3 for AI and BD, but not for IoT. The results show that SI has a positive impact on BI to use AI and BD, that supports the results of previous studies, i.e., for AI (Gohil, 2023) and BD (Cabrera-Sánchez and Villarejo-Ramos, 2020). For IoT this supports the results from (Li et al, 2024). The higher the SI, i.e., social influence, the higher the BI to use AI and BD. For technologies AI and BD, this supports H3, showing that the respondents would implement these technologies if they had a recommendation or influence from different social groups, such as colleagues, friends or other companies. Word of mouth or previous experience from other people, colleagues or companies, cooperation within an industry or with other manufacturing companies and group motivation for technology application could increase BI to use such technologies (Ronaghi and Forouharfar, 2020). However, this does not apply to the IoT. By increasing transparency, organizing training, enabling implementation support and exchanging experiences with IoT users, it will positively impact on increase of BI to use such technology. H4. FC has a positive impact on the BI to use “name” technology in manufacturing companies. The FC is the second determinant whose impact on BI was confirmed in all three models. The results show that FC has a positive impact on BI to use IoT, AI and BD, which is consistent with the results of the previous studies, i.e., IoT (Ronaghi and Forouharfar, 2020), AI (Li et al, 2024) and BD (Brünink, 2016), while it has the strongest positive impact on BI of AI. This supports H4, showing that the respondents believe that providing facilitating conditions enables the application of these technologies. The higher the FC, i.e., facilitating conditions to use these technologies, the higher the BI to use them. Therefore, companies should provide all the necessary conditions, resources and support to use such technologies. H5. Attitudes to Digitalization and Automation (ADA) of production processes have a positive impact on BI to use technologies for D&A in manufacturing companies. The first determinant whose impact was not detected in any of the models is ADA. The attitudes towards D&A do not have an impact on the BI to use IoT, AI and BD, showing that employees might not be aware of the possibilities that these technologies could bring. They should be more open to introducing new technologies in the production processes, as well as be aware of the improvements they bring. Improved and more frequent information, education, knowledge sharing and management engagement about the opportunities that D&A can bring to manufacturing companies could positively impact BI to use these technologies. A possible reason for this result might be that the majority of the surveyed companies in the Republic of Serbia are not the users of digital technologies, therefore, they lack knowledge of their possible benefits (Kutlača et al, 2020). Companies can believe that they do not need any more D&A because their current level of D&A is sufficient. Also, the fear of making systems more complex, replacing employees with technology, increasing the complexity of processes, as well as focusing on current objectives and strategies, can decrease the intention to use these technologies. D&A levels of the manufacturing companies in the Republic of Serbia should be increased to enhance awareness and an open attitude toward their application. H6. Awareness and Support (AS) of the management of the company have a positive impact on the BI to use technologies for D&A in manufacturing companies. Determinant whose impact was not supported by models is AS. The higher AS, i.e., awareness and support of the management of the company, the lower BI to use IoT, AI and BD and the measured impact is not statistically significant. Such a result was not expected. The companies whose management is unaware of the potential improvements that the application of technologies for D&A could bring are unlikely to support their implementation. Expanding on the reasons mentioned in the previous determinant, some of the additional reasons could be the fear of high implementation costs, the lack of state support, infrastructure and connection problems, the fear of nonacceptance by employees and others. Better information gathering, information exchange with market competitors and better market insights should lead to improved AS, that could impact an increase in BI to use these technologies. H7. The Current Level of Digitalization and Automation (CLDA) in production processes in a manufacturing company has a positive impact on BI to use technologies for D&A in manufacturing companies. The third determinant, whose impact was supported in all three models, is CLDA. The results show that CLDA has a positive impact on BI to use IoT, AI and BD, while it has the strongest impact on BI of IoT. The higher the CLDA, i.e., the current level of D&A in manufacturing companies, the higher the BI to use them. This supports H7. Therefore, companies that have already turned towards D&A and have processes that can be digitalized and automated are more open to applying technologies and are aware of the improvements these technologies bring. H8. Customer, Supplier and Warehouse Digitalized and Automated Activities (CSWDAA) have a positive impact on the BI to use technologies for D&A in manufacturing companies. The results show that the impact of CSWDAA was only supported in the model for AI. The higher CSWDAA, i.e., customer, supplier and warehouse digitalized and automated activities, the higher the BI to use AI. A positive result was expected since the main stakeholders with everyday communication and collaboration can push innovations in the manufacturing companies and processes. Automated activities in warehouses can decrease mistakes, reduce time, improve inventory management, decrease the number of employees responsible for warehouse monitoring and organizing and enable quality standards. Customers can request changes and improved products that lead to the implementation of technologies, as well as suppliers that have already implemented technologies that lead to faster order fulfilment, showing positive technology implementation results. Customers and suppliers, as part of the supply chain, can have a great impact on manufacturing companies, pushing for changes and improvements with enhanced information sharing and exchange (Pfohl et al, 2017). The reasons for not supporting H8 for IoT and BD are linked to the reasons for determinants ADA and AS. Companies should strive to have automated warehouse management activities and digitalized and automated communication with customers and suppliers, to prevent or reduce mistakes, failures and time and enable data integration and real-time data monitoring with accurate and precise data. H9. External factors (EF) have a positive impact on the BI to use technologies for D&A in manufacturing companies. The hypothesis H9 is not confirmed, as there was no statistically significant impact of EF on BI on any of the models. External factors such as market conditions, competitors, state encouragement and support, and the impact of customers and suppliers, should lead to the initiatives to introduce innovations in production processes. The non-significant impact on all three models can be explained by the lack of technology applications at customers and suppliers, that cannot impact the company to use such technology. The absence of subsidies cannot impact the company from introducing and using such technology. There is also a possibility that competitors do not use such technologies or do not consider them useful for a manufacturing company, so they do not push their implementation in other companies. H10. Internal factors (IF) have a positive impact on the BI to use technologies for D&A in manufacturing companies. The impact of IF was only detected in the model of BD. The higher IF, i.e., internal factors in the company, the lower BI to use BD, that conflicts with (Damanpour et al, 2018), where IF had a positive impact. The observed results can be explained as follows. The management of the company can fear changes or cannot motivate employees enough to use such technologies, while the employees are usually afraid of the unknown and new, as well as of being replaced, leading to them not having a willingness to learn new technologies, especially in situations when they are used to their standard way of working (Prentice, 2022). Employees are afraid of losing control or even losing their jobs, they are resistant to changes, considering that technology implementation is highly costly, complex and takes a long implementation time (Ivanov et al, 2020). These are the reasons why the internal factors do not impact positively on BI, i.e., H10 is not supported. Changing some of them should positively impact the BI to use these technologies. IF such as employees, management of the company, innovations and changes in production products should lead to innovations in production processes. H11. Barriers (B) have a negative impact on the BI to use technologies for D&A in manufacturing companies. The final hypothesis H11 is not confirmed, as there was no statistically significant impact of B on BI in any of the models. It was not expected, since barriers such as high implementation costs, the lack of financial support and standardization, the problems with the Internet and electricity supply, employees’ resistance to change, missing support from the state and government, the problems with data security or leaking data outside the organization and others, usually prevent the use and implementation of technology and have a negative impact on technology application (Jones et al, 2021). Different types of challenges require different methods of prevention, such as (Albukhitan, 2020): traditional processes—introducing a modern digital solution that will convert paper-based processes into digital; resistance to change—companies should reduce stress and time-consuming processes, improve efficiency, enable remote work and transparent communication about technology to all employees; budget restrictions—planning of investment processes; absence of relevant knowledge—if existing knowledge is insufficient, engagement of new employees or external consultants, not limited knowledge only to some employees, but to the whole organization; security—protection layers and mechanisms must be set to protect and secure the leaks of data, recognition and document vulnerability issues and others. By applying some prevention methods, it could be possible to decrease or completely remove some of the barriers that impact the adoption of these technologies.
Overall, the supported hypotheses for all three technologies are: H1, H4 and H7, while H2, H5, H6, H9, H10 and H11 are not supported. The hypothesis H3 can be considered as supported, since it is supported for two technologies, while H8 can be considered as not supported, because it is supported only for one out of the three technologies. These insights are presented in Table 7. Observing the determinants and their importance on technology adoption, the determinant PE is significant for all three technologies, while EE is insignificant for those technologies, SI is significant for the adoption of AI and BD technologies, but not for IoT; FC is significant for all three technologies, ADA and AS are not significant for any technology, CLDA is significant for all three technologies, CSWDAA is significant for AI, but not for IoT and BD, while the determinants EF, IF and B are not significant for the adoption of any of these three technologies.
Based on the results presented in this paper, the response to RQ Which determinant(s) impact technology (IoT, AI and BD) adoption and application in the manufacturing companies in the Republic of Serbia? can be given. According to the results from the expanded UTAUT models, applied for the three technologies (IoT, AI and BD) separately, the positive impact on these three technologies’ adoption and application was found from three determinants: PE, FC and CLDA. The highest positive impact on BI to use all three technologies had the FC determinant, which indicates that the company should provide the necessary resources (knowledge, technology, tools, devices) to use these technologies. Regarding the negative impacts, two determinants differ by technology, EE and IF. Regarding IoT technology, none of the determinants had a negative impact. When it comes to the AI, the most negative impact on BI to use this technology has determinant IF. This can be caused because of uncertainty in working with technologies, insufficient familiarity with technologies and readiness to use them, fear that technologies will replace people in production processes, as well as that they will impact the reduction of human labor. To decrease the negative impact of this determinant some of the recommendations could be that the management work towards motivating employees, enabling training and support within the introduction and even implementation of these technologies, as well as the gradual introduction of technology, being realistic and open-minded regarding the complexity of use, but also focused on positive and improved business results that these technologies could contribute to. The most negative impact on BI of BD to use this technology had determinant EE. This can be caused by technological complexity, the lack of required knowledge and skills, missing introduction of how to apply this technology in everyday work, and technical barriers. To decrease the negative impact, similar recommendations as for the previous determinant can be applied, as well as the introduction of simplified solutions, technologies and software that would lead to an easier and more accepted introduction of BD in the production process.
Based on the presented results, different strategies for technology adoption can be defined. For all three technologies, strategies for technology adoption should be an investment in the infrastructure of the company, enabling support and resources (equipment, hardware, software, devices and others), introducing Key Performance Indicators (KPIs) and benchmarking to follow and improve performance, enabling training, demonstrations and real experiences for employees to become better acquainted with technologies as well as to understand the numerous and significant improvements these technologies can introduce into daily operations. Additionally, for the IoT technology, a strategy should be leaning toward more digitalized and automated processes and solutions that enable the connection with IoT. Regarding BD and AI, the strategies should focus on connecting employees and their networking, in person or online, organizing mentoring sessions, presentations and experience sharing, where more experienced colleagues can present their knowledge and advice regarding the application of these technologies, presentations of real case studies. Additionally, strategies should be focused on alleviating employees’ resistance to change and not creating pressure to use such technologies from other employees or superiors. They should have transparent communication and support towards changes and be involved in changes. To ensure a more successful adoption of BD technology, employees should be more motivated, interested and included in technology implementation, so the strategies should be developed in that direction.
The main objective of this paper is to identify key determinants that influence the use of widely adopted technologies for D&A (I4.0) in manufacturing companies, through the expanded UTAUT model. The herein proposed extended UTAUT model, with the specific determinants, to the best of our knowledge, was not previously applied, leading to the originality of the research and its results. Each of the chosen three technologies has its specificities, where different determinants can have positive or negative impact on their acceptance in manufacturing and digitalization. This paper presents empirical evidence confirming the validity of the expanded UTAUT model in explaining the adoption of three technologies within manufacturing companies and pointing out PE, FC and CLDA, as the determinants that positively impact the BI to use these three technologies, where determinant FC has the highest impact. Since the institutional vacuums, poorly developed infrastructure and problems regarding the lack of resources are the main obstacles to digital transformation in post-transition countries (World Bank Group, 2022; Zhang et al, 2023), the findings of this paper can be generalized and applied to other post-transition countries of the Balkans and Eastern Europe, because of the similar infrastructural, institutional and digital challenges with the Republic of Serbia. This paper is of high value for decision-makers in manufacturing companies and provides information on the factors that mostly impact technology acceptance for IoT, AI and BD. Additionally, it presents the current level of application and implementation of these technologies in the Republic of Serbia. The main results of this research can be used by managers, decision-makers and practitioners in the manufacturing companies in the Republic of Serbia. These findings highlight the key determinants that impact technology adoption, helping them make decisions about which technologies to implement and how to design the most effective implementation strategy based on the determinants that impact the intention to use IoT, AI and BD technologies.
However, there are some limitations of this study. The first limitation is that the survey was conducted in the Republic of Serbia, so the results can be compared only with the results from the countries that have similar economic and social status and market conditions, i.e., developing countries. The second limitation which might arise is the number of determinants with which the UTAUT model is extended. As several added determinants (e.g., ADA, AS, EF, IF, B) consistently show no statistical significance, one might consider their removal in the future model alterations. It is possible to add other determinants that can more effectively impact the BI or explain the adoption of these technologies or even simplify the model by excluding the non-significant determinants or combine or regroup the existing ones. This would enable the model to focus more on core determinants to improve the interoperability of the results. Having in mind that no similar studies have been conducted in the region, a complex model has been proposed as a starting point that can be modified and simplified as needed. The third limitation is that some of the determinants were not statistically significant in the model. Even if some determinants were initially statistically insignificant, they may indicate directions for future expansion of the model. The future research directions would be to compare the results from this study with similar studies. This would lead to the conclusion of which technology would have the highest adoption and acceptance rate, pointing out which determinants impact adoption and acceptance the most. Another future research direction is to conduct a survey in the surrounding countries, to explore the application of technologies and technology acceptance in the countries with similar social, cultural and economic factors, such as countries in the Balkan region and to generalize the model to be used in other countries. The third direction for future research is to focus on the empirical testing and further development of additional determinants that could improve the explanatory power of the UTAUT model in the context of production management. The fourth direction for future research is to focus more on the organizational level, leading to a smaller sample and a less complex model.
The datasets used and analyzed during the current study are available from the corresponding author on reasonable request.
TR designed the research study, performed the research and wrote the initial version of the manuscript. TR and SR analyzed the data and did a discussion structure. DLC and MS contributed to the analysis and interpretation of the results. All authors have read, critically reviewed and approved the final manuscript. All authors contributed to editorial changes in the manuscript. All authors have participated sufficiently in the work and agreed to be accountable for all aspects of the work.
This paper was supported by the University of Belgrade, Faculty of Organizational Sciences, Belgrade, Serbia. The authors gratefully acknowledge the assistance and instruction from Professor Milica Maričić, PhD, from the University of Belgrade, Faculty of Organizational Sciences. The authors express their gratitude to the companies that participated in the research.
This research received no external funding.
The authors declare no conflict of interest.
| Determinants | No. of questions | Cronbach’s Alpha | AVE | CR | Mean | Variance |
| PE | 3 | 0.948 | 0.907 | 0.967 | 3.864 | 0.000 |
| EE | 3 | 0.936 | 0.887 | 0.959 | 3.914 | 0.095 |
| SI | 3 | 0.877 | 0.809 | 0.927 | 3.591 | 0.295 |
| FC | 2 | 0.719 | 0.783 | 0.878 | 3.693 | 0.378 |
| BI | 3 | 0.969 | 0.941 | 0.980 | 3.165 | 0.045 |
No., number; AVE, Average Variance Explained; CR, Composite Reliability; PE, Performance Expectancy; EE, Effort Expectancy; SI, Social Influence; FC, Facilitating Conditions; BI, Behavioral Intention.
| Determinants | No. of questions | Cronbach’s Alpha | AVE | CR | Mean | Variance |
| PE | 3 | 0.961 | 0.928 | 0.975 | 3.558 | 0.000 |
| EE | 3 | 0.961 | 0.928 | 0.975 | 3.730 | 0.004 |
| SI | 3 | 0.932 | 0.883 | 0.958 | 3.371 | 0.052 |
| FC | 2 | 0.762 | 0.808 | 0.894 | 3.586 | 0.197 |
| BI | 3 | 0.985 | 0.874 | 0.954 | 3.025 | 0.001 |
No., number; AVE, Average Variance Explained; CR, Composite Reliability; PE, Performance Expectancy; EE, Effort Expectancy; SI, Social Influence; FC, Facilitating Conditions; BI, Behavioral Intention.
| Determinants | No. of questions | Cronbach’s Alpha | AVE | CR | Mean | Variance |
| PE | 3 | 0.965 | 0.935 | 0.977 | 3.728 | 0.005 |
| EE | 3 | 0.961 | 0.927 | 0.975 | 3.718 | 0.003 |
| SI | 3 | 0.930 | 0.882 | 0.957 | 3.402 | 0.046 |
| FC | 2 | 0.773 | 0.817 | 0.899 | 3.612 | 0.090 |
| BI | 3 | 0.985 | 0.971 | 0.990 | 3.113 | 0.001 |
No., number; AVE, Average Variance Explained; CR, Composite Reliability; PE, Performance Expectancy; EE, Effort Expectancy; SI, Social Influence; FC, Facilitating Conditions; BI, Behavioral Intention.
| Determinants | Item No. | Items | Sources |
| PE | 1 | “Name” technology is useful in my daily work | Brünink, 2016; Li et al, 2025; Nysveen and Pedersen, 2016; Venkatesh et al, 2003; Xu and Suzuki, 2025 |
| 2 | “Name” technology allows me to complete tasks faster | ||
| 3 | “Name” technology enables me to perform tasks more easily | ||
| EE | 1 | It would be easy for me to master the use of “name” technology | Khalilzadeh et al, 2017; Li et al, 2025; Nysveen and Pedersen, 2016; Venkatesh et al, 2003; Xu and Suzuki, 2025 |
| 2 | “Name” technology is easy to use | ||
| 3 | I believe that I would easily learn to use “name” technology | ||
| SI | 1 | I would use “name” technology if my colleagues recommend it to me | Khalilzadeh et al, 2017; Li et al, 2025; Nysveen and Pedersen, 2016; Venkatesh et al, 2003 |
| 2 | I would use “name” technology if my friends recommend it to me | ||
| 3 | I would use “name” technology if I saw or heard about it on social networks | ||
| FC | 1 | I have the necessary resources to use “name” technology (computer, Internet) | Li et al, 2025; Nysveen and Pedersen, 2016; Ronaghi and Forouharfar, 2020; Venkatesh et al, 2003 |
| 2 | I have the necessary knowledge to use “name” technology | ||
| ADA | 1 | Digitalization and automation of production processes will facilitate and improve the production management process | Khalilzadeh et al, 2017; Nysveen and Pedersen, 2016 |
| 2 | Digitalization and automation of production processes will improve production performance | ||
| 3 | Digitalization and automation of production processes will achieve greater production efficiency | ||
| 4 | Digitalization and automation of production processes will reduce production errors | ||
| 5 | Digitalization and automation of production processes will reduce production costs | ||
| 6 | Digitalization and automation of production processes will increase revenues | ||
| 7 | By digitalizing and automating production processes, companies will become more competitive on the market | ||
| 8 | By digitalizing and automating production processes, the inventory management process will become more efficient | ||
| AS | 1 | The company strives to innovation | Zheng et al, 2020 |
| 2 | The company has enough financial resources to fully digitize operations and automate processes | ||
| 3 | The company’s management and employees are familiar with the concept of digitalization of business and automation of production processes | ||
| 4 | The management of the company supports the digitization of operations and the automation of production processes | ||
| 5 | The management of the company is currently thinking about the digitization of business and the automation of production processes | ||
| CLDA | 1 | All production processes in the company can be reengineered, to become automated, as well as to apply modern digital technologies | |
| 2 | The production flow is automated and can be fully monitored through digital technologies | ||
| 3 | Errors in the production process are reported electronically and transferred to the responsible person | ||
| 4 | In the production plant, communication between employees is carried out exclusively electronically (via computers, ERP software, other digital technologies) | ||
| 5 | The process of implementing some of the technologies for digitization and automation in production is underway | ||
| 6 | The process of training employees for the application of some of the technologies for digitalization and automation of production processes is currently ongoing | ||
| CSWDAA | 1 | Warehouse management activities are fully automated | |
| 2 | Communication with suppliers is completely digitalized and automated | ||
| 3 | Communication with customers is fully digitalized and automated | ||
| EF | 1 | Market conditions | Damanpour et al, 2018; Fu et al, 2018; Hirzallah and Alshurideh, 2023 |
| 2 | State incentives and support | ||
| 3 | Competition | ||
| 4 | Customer influence | ||
| 5 | Supplier influence | ||
| IF | 1 | Changes in the vision of the company | |
| 2 | Changes in the organizational structure of the company | ||
| 3 | The impacts and aspirations of employees in the company towards changes | ||
| 4 | Innovations and changes in the company’s products | ||
| B | 1 | Lack of support and encouragement from the state | Chouki et al, 2020; Ediriweera and Wiewiora, 2021 |
| 2 | High costs of acquisition, implementation and maintenance of technologies | ||
| 3 | Complexity of technology application | ||
| 4 | Data security and privacy issues | ||
| 5 | Insufficient information about technologies and the possibilities of their application | ||
| 6 | The idea of applying some of the technologies for digitalizing business and automating production processes is not supported by the company’s management | ||
| 7 | Lack of financial resources of the company | ||
| 8 | Lack of standardization of processes in the company | ||
| 9 | Problems with constant electricity supply | ||
| 10 | Internet access problems | ||
| 11 | High costs of employee training | ||
| 12 | Employee resistance to change | ||
| BI | 1 | I intend to use “name” technology in the next 12 months | Davis, 1989b; Nysveen and Pedersen, 2016; Ronaghi and Forouharfar, 2020; Venkatesh et al, 2003 |
| 2 | I consider that I will be using “name” technology in the next 12 months | ||
| 3 | I plan to use “name” technology in the next 12 months |
No., number; PE, Performance Expectancy; EE, Effort Expectancy; SI, Social Influence; FC, Facilitating Conditions; ADA, Attitudes Towards Digitalization and Automation; AS, Awareness and Support; CLDA, Current Level of Digitalization and Automation; CSWDAA, Customer, Supplier and Warehouse Digitalized and Automated Activities; EF, External Factors; IF, Internal Factors; B, Barriers; BI, Behavioral Intention.
References
Publisher’s Note: IMR Press stays neutral with regard to jurisdictional claims in published maps and institutional affiliations.