
- Academic Editor
†These authors contributed equally.
Background: Breast cancer is the most common cancer in women worldwide. Here we aimed to develop an effective non-invasive method to screen for breast cancer and reduce mortality while still being curable. Methods: Here we propose a method that leverages the available data by incorporating information on copy number variations, mutation signature, and fragment size. Our approach adopted principal component analysis and a generalized linear model algorithm to distinguish between breast cancer and normal samples. Results: A total of 100 samples (85 tumor, 15 controls) were used for training, and 44 samples (37 tumor, 7 controls) were used to validate the proposed method based on whether the sample originated from breast cancer. Our model reached an area under the receiver operating characteristic curve reached 1.0 and 0.690 in the training set and in the validation set, respectively. Conclusions: Our method can differentiate between breast cancer patients and controls using non-invasive, cost-effective, low-coverage whole-genome sequencing technology that may provide new ideas for future breast cancer screenings.
Breast cancer (BC) has become the leading cause of cancer-related death among women worldwide, with an estimated more than 2 million new cases annually [1]. The incidence of BC has increased in China and the US [2, 3]. Considering population expansion, experts estimate that by 2050, there will be roughly 3.2 million additional BC cases annually worldwide [4]. More importantly, the average age at the diagnosis of BC is decreasing worldwide [5]. Many factors may contribute to the increasing number and increasingly younger trend of patients with BC, including family history, individual differences, and living environment [6]. In order to reduce the mortality rate of breast cancer, early diagnosis and treatment are urgently needed, as breast cancer is prone to dissemination in the middle and late stages [7].
Most BC patients are not diagnosed until the disease has spread throughout their bodies [8]. However, breast tumours can concentrate in certain parts of the human body during their natural cycle, allowing them to be diagnosed and treated earlier [9]. BC mortality can be reduced by 40% in medium-risk women who undergo early screening, resulting in improved survival [10]. Based on these reports, the death rate from BC decreased by 40% from 1989 to 2017 [3], which can be attributed to advancements in treatment and early detection [11]. The purpose of early screening for breast tumours is to discover them at a stage when therapy is more likely to be effective, giving patients a greater possibility of long-term survival [12]. In addition, both traditional and novel therapeutic approaches, including resection, irradiation, and pharmacological treatments, are more effective when breast tumour density is minimal [7, 8, 9].
Early screening methods have been examined as possible strategies to address this clinical gap. Among the most common screening methods, modern screening digital mammography has a sensitivity of 86.9%; however, not all types of BC are detectable on mammography [13], while certain breast tumours grow along with the natural breast architecture, making them difficult to detect using mammography [14]. The high false positive rate of mammography, particularly in women who are young or have thick breasts, results in unnecessary additional testing such as biopsies [15, 16]. According to recent reports, indicators based on methylation analysis have been used for the early diagnosis of BC [17]. However, numerous methylation-based methods use distinct locus or Cytosine-phosphate-Guanine (CpG) site mechanization with a group of non-restrictive controls in which the methylation features of benign and cancerous tumours are mainly revealed [18]. Circulating tumour DNA (ctDNA) analysis based on whole-genome mutations with next-generation sequencing (NGS) has been used to predict early recurrence and guide drug treatment of a variety of malignancies. Unfortunately, the reliability of mutation-based ctDNA identification in BC is hindered by the lack of common variants [19]. Thus, an effective, fast, and economical method for the early detection of BC is urgently needed.
To address these problems, we attempted to develop a cost-effective early screening method for BC. In general, whole-genome sequencing (WGS) was performed on the patient’s peripheral blood and the principal component analysis (PCA)–based method was applied to discriminate between tumour and normal cells. Specifically, for each sample, we built a vector that contained copy number variation (CNV) indications, error rates, and fragment sizes and used it for PCA training in which we extracted the first five principal components for each sample and used them to classify normal and tumour cells. The experimental results showed that our early screening algorithm performed well for BC.
In this study, 144 samples (122 BC, 22 normal controls) were analysed. All participants were recruited from the Peking Union Medical College Hospital from April 2018 to June 2018. BC was diagnosed according to the National Comprehensive Cancer Network Clinical Practice Guidelines in Oncology for BC. Age, pathological type, and clinical stage information of BC cases were obtained from medical records (Table 1). Written informed consent was obtained from all patients. This study was approved by the Ethics Committee of Peking Union Medical College Hospital (HS-1949) and conducted according to the principles of the Declaration of Helsinki.
| Characteristic | N (%) | |
| Age (years) | ||
| 25 (20.49) | ||
| 40–60 | 63 (51.64) | |
| 34 (27.87) | ||
| Pathological type | ||
| Benign | 65 (53.28) | |
| Luminal A | 19 (15.57) | |
| Luminal B | 26 (21.31) | |
| Her2+ | 7 (5.74) | |
| TNBC | 5 (4.10) | |
| Clinical stage | ||
| Benign | 65 (53.28) | |
| I | 27 (22.13) | |
| II | 19 (15.57) | |
| III | 5 (4.10) | |
| NA | 6 (4.92) | |
TNBC, triple negative breast cancer; NA, not available.
Patients were selected based on the following criteria: (1) age of 18 or above; (2) diagnosed as breast cancer; (3) a peripheral blood sample of 14–20 mL can be collected; (4) voluntary informed consent. Patients were excluded according to the following criteria: (1) with unqualified nucleic acid quality after DNA extraction; (2) diagnosed with a second primary malignant tumor; (3) who had previously received transplant surgery; (4) who had received an allogeneic blood transfusion or immunotherapy that may introduce foreign DNA.
Peripheral blood was collected in Streck tubes (Streck, Inc., Omaha, NE, USA)
and processed within 72 h of sample collection. The plasma was then isolated by
centrifugation at 4 °C for 10 min at 1600
The cfDNA from each sample was used for the library construction using a KAPA Hyper Prep Kit (KK8504, KAPA Biosystems, Wilmington, MA, USA) according to the manufacturer’s instructions. The final polymerase chain reaction (PCR) products were analysed using an Agilent 2100 Bioanalyzer (Agilent Technologies, Palo Alto, CA, USA), Library Quant Kit (KK4824, Illumina GA revised primers-SYBR Fast Universal, KAPA Biosystems, Wilmington, MA, USA), and an ABI 7500 real-time PCR system (Life Technologies, Paisley, UK) to estimate insert size and concentration.
After quality control, the pooled library was sequenced using a NextSeq500
analyser (Illumina, San Diego, CA, USA) to generate 75-bp paired-end reads. The
read depth of the entire genome was nearly 1
The FASTQ files were generated using bcl2fastq2 (v.2.17.1.14, Illumina, San
Diego, CA, USA). Raw reads containing the P5/P7 adapters were trimmed. Reads that
contained more than one N or five consecutive nucleotides with an average Phred
score of
We used 100 Kb as the optimal bin size and overlapping bins with two adjoining bins overlapped by 50 Kb. Bins that carried putative CNV at the population level were removed. We controlled for GC and chromosomal biases. We applied a smoothing spline method to remove the GC bias. We then used 15 samples from healthy people to compute the mean and variance of the GC-corrected read number in each bin and regressed out the mean using weighted linear regression, with the inverse of the variance as the weight to obtain the bin dosages of the reference and test samples. After normalization, the bin dosages were used as the CNV vector.
Several studies have shown that rearrangement mutational signatures are
correlated with clinical characteristics, such as C
In addition, several studies have shown that plasma cfDNA concentrations and fragment sizes can be used to differentiate between cancer and normal samples and thus be reflected in clinical characteristics. As our data were obtained from low-coverage WGS, it was difficult to deduce the cfDNA concentrations. Thus, we considered only cfDNA fragment size. As previous studies demonstrated, the main difference in the fragment size distribution between cancer and control samples was the second peak. Therefore, we computed the fragment size density among the second peaks (approximately 251–450 bp) as the fragment size vector.
We combined the CNV, mutation signature, and fragment size vectors as the entire sample vector. The range of each feature varies significantly. We normalized the data and considered only the degree of feature deviation to make the features of the vector comparable to one another (Fig. 1).
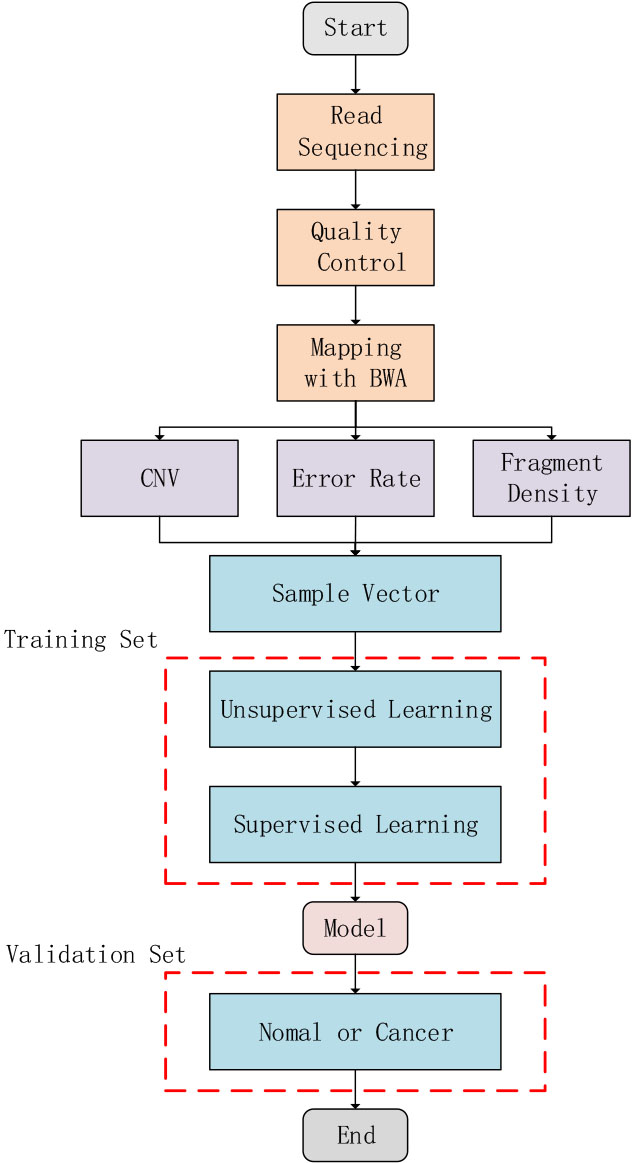 Fig. 1.
Schematic illustration of study design. Three different feature types, including fragment size ratio, error rate, and copy number variation (CNV), were calculated using mapped sequencing reads. The most important five principal components were chosen, which was subsequently used by a general linearized model (GLM) algorithm to train the final model.
To maximize training input, we used a combination of unsupervised and supervised learning.
Between the observations (samples), some informative factors of the vectors were expected to indicate whether a sample originated from a healthy person or a BC patient. PCA is a technique that orthogonally transforms observed variances to convert the original informative variables into new linearly uncorrected parameters called principal components (PCs). We trained 22 healthy individuals and 40 patients with BC using PCA and obtained 61 PCs. These PCs were ranked by the variance they could explain, and the five most important PCs were selected as they accounted for a large portion of the non-random variance, which we considered correlated with information on whether samples were incorporated with cancer. The five most important PCA rotations were used to calculate the five PCs of the 61 samples in the training set for supervised learning.
The general linearized model (GLM) algorithm was used to fit GLM specified by
providing a symbolic description of the linear predictor and a description of the
error distribution. We used the GLM algorithm to model the correlation between
the five most important PCs and the training set and obtained a BC risk score to
indicate whether the sample came from a BC patient. We used the following
formula: y = 0.6063
The clinical characteristics of the BC and control participants are summarized
in Table 1. All patients with BC were women with a mean age of 47.9 (20–80)
years. Of the 122 patients, 34 (27.9%) were aged
We obtained 22 control and 122 BC samples. We randomly selected 70% of the samples (15 controls, 85 BC samples) as the training set and the remaining samples (7 controls, 37 BC) as the validation set. Our model worked well in the training set, reaching an area under the receiver operating characteristic curve (AUC) of 1.0 in the training set and 0.690 in the validation set (Fig. 2A,B).
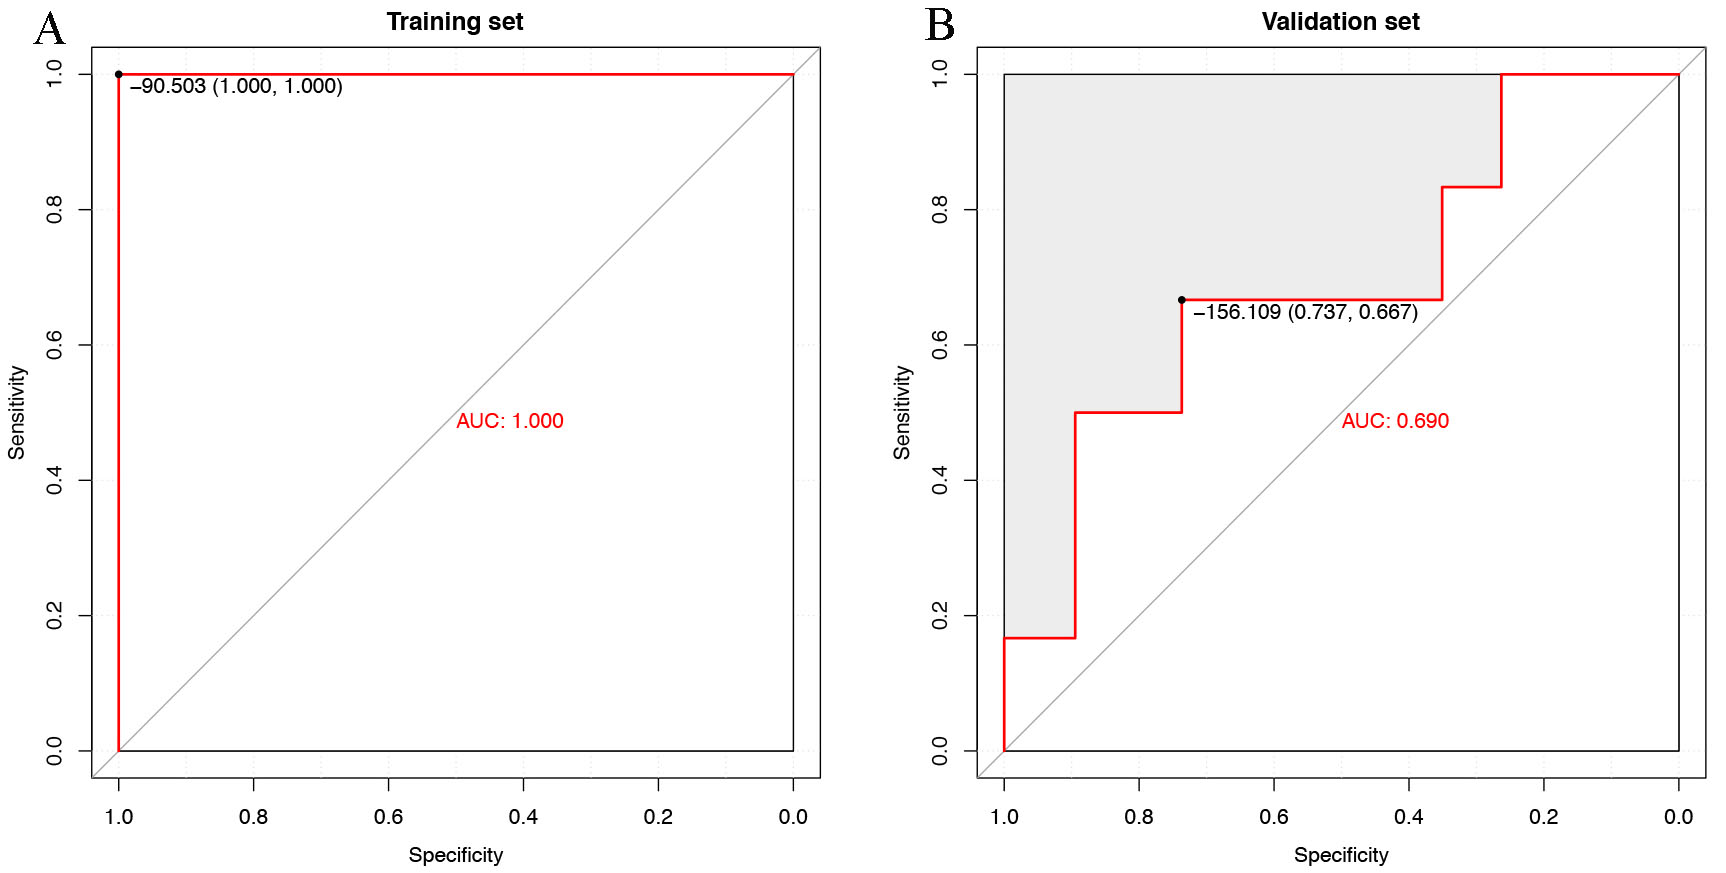 Fig. 2.
Evaluation of the breast cancer (BC) risk score. (A) Receiver operating characteristic (ROC) curves evaluating the overall performance of the predictive model for distinguishing BC patients from healthy controls in the training set. (B) ROC curves evaluating the overall performance of the predictive model for distinguishing BC patients from healthy controls in the validation set. AUC, area under the receiver operating characteristic curve.
As our model aimed to identify cancer patients at an early stage, we attempted to differentiate between benign patients and controls to determine the performance. The model obtained an AUC of 0.903, similar to that differentiating between cancer patients and controls (AUC, 0.911; Fig. 3A,B). The median risk scores were –197.98 (Q25–75, –264.35 to –153.81), –190.239 (Q25–75, –301.95 to –151.36), –67.69 (Q25–75, –98.51 to –60.22) for the benign, cancer, and healthy sets, respectively (Fig. 4).
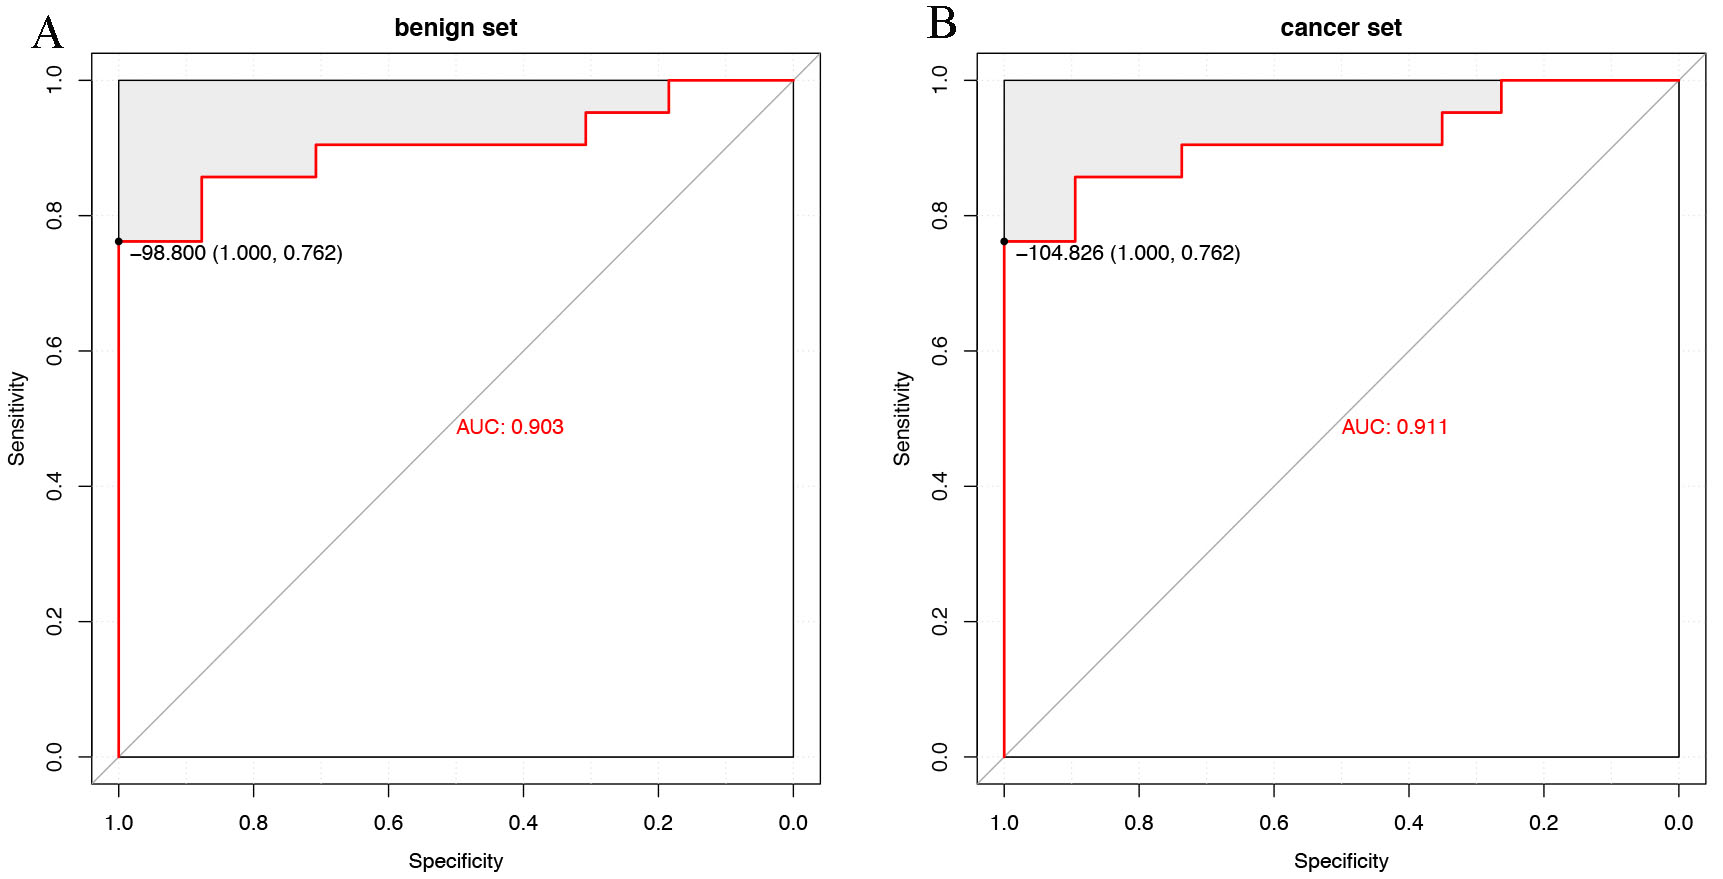 Fig. 3.
Evaluation of the breast cancer risk score. (A) ROC curves evaluating the overall performance of the predictive model in distinguishing benign patients from healthy controls. (B) ROC curves evaluating the overall performance of the predictive model in distinguishing BC patients from healthy controls. AUC, area under the receiver operating characteristic curve; ROC, receiver operating characteristic.
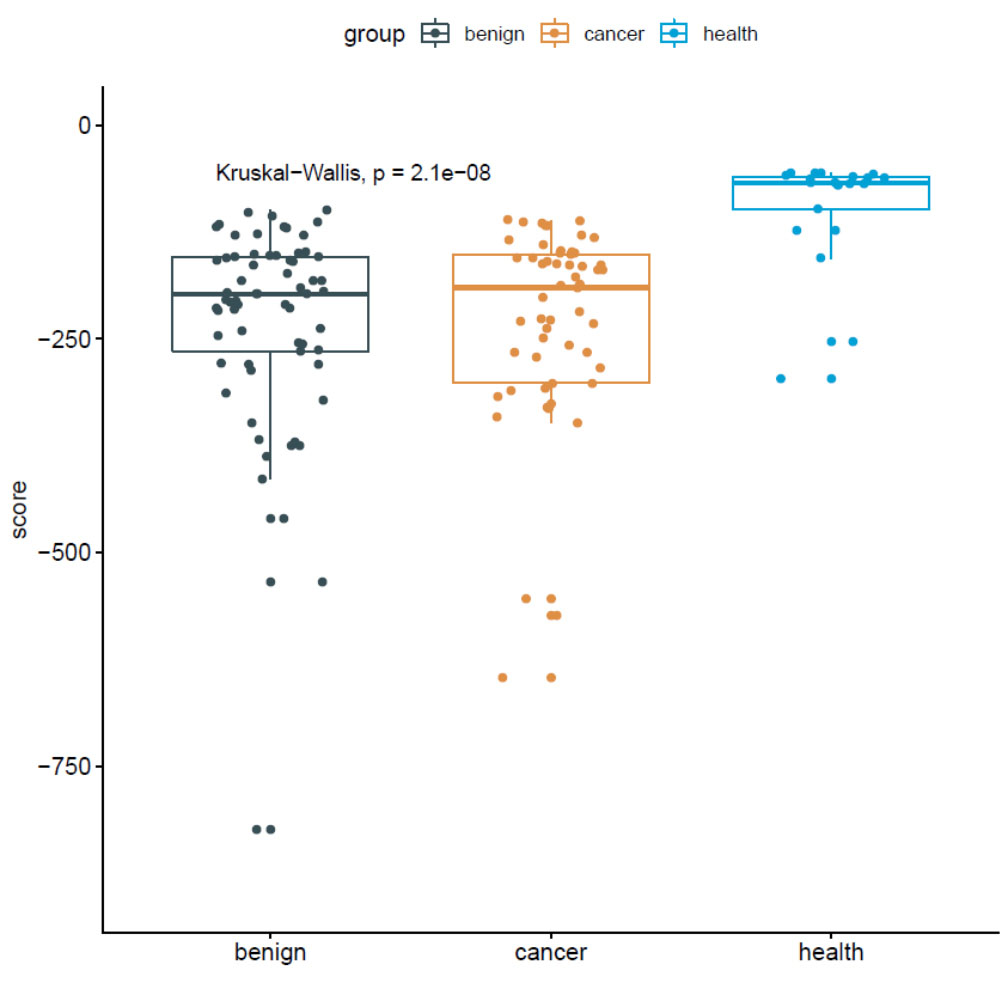 Fig. 4.
Distribution of breast cancer risk scores for benign, cancer, and healthy samples.
Associations among BC risk score, stage, and pathological type were studied. The median risk scores were –227.90 (Q25–75, –324.38 to –158.28), –185.73 (Q25–75, –269.17 to –160.02), and –164.71 (Q25–75 –238.38 to –147.42) for stages I, II and III, respectively. Moreover, there was no statistically significant difference between BC risk score and clinical stage. The median risk scores were –163.23 (Q25–75, –314.17 to –140.96), –195.95 (Q25–75, –266.19 to –158.40), –232.57 (Q25–75 –284.78 to –176.14), and –185.73 (Q25–75 –310.77 to –150.02) for Luminal A, Luminal B, Her2+, and triple negative breast cancer (TNBC), respectively. There was no correlation between BC risk score and pathological type (Fig. 5).
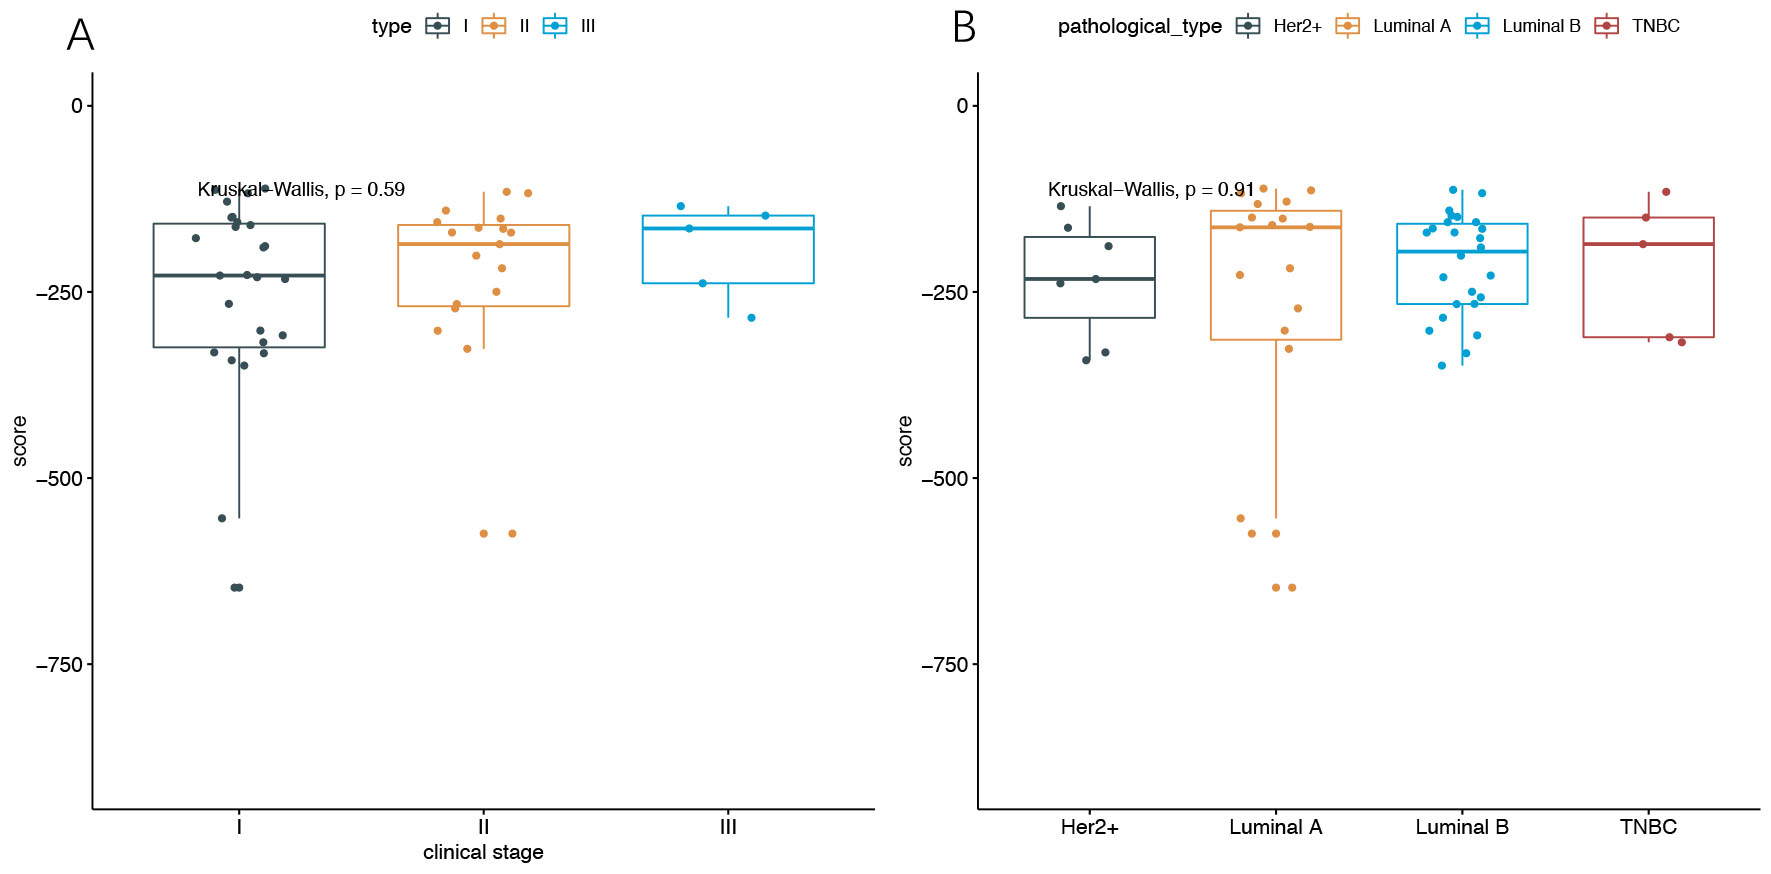 Fig. 5.
Distribution of BC risk scores. (A) Distribution of BC scores of stage I, II, III samples. (B) Distribution of BC scores of Luminal A, Luminal B, Her2+, and TNBC samples. BC, breast cancer; TNBC, triple negative breast cancer.
BC is the most common cancer affecting women worldwide. In 2017, 255,180 new cases of BC were diagnosed in the USA; in 2018, the number of deaths due to BC reached 627,000 [3, 4]. The goal of early screening is to detect BC early while it is still curable to decrease mortality rates. Previous studies demonstrated that early detection with screening mammography significantly reduces BC deaths by 20–40% [16, 17, 18, 19, 20], which might be very useful in the diagnosis of BC.
Several studies have reported that certain factors may contribute to the early detection of cancer. Urothelial carcinoma can be detected in a sample as it has more CNV than a control sample [17, 18, 19]. Based on this information, Urine Exfoliated Cells Copy Number Aberration Detector (UroCAD) was developed [17, 18, 19]. In the current study, a clear correlation was observed in the fragment size distribution determined by the paired ends generated by NGS. In addition, the second peak exhibited the most distinct distribution. Thus, we also considered a second peak (251–450 bp). In addition, patients with BC are likely to have loss of heterozygosity, so it may be helpful to add the mutation signature to our model. To enhance the performance of our model, we included all three factors.
We considered three factors to construct the vector for the samples and then used PCA and the GLM algorithm for the following analysis. Sample quality and selection were assessed. We randomly selected approximately 70% (15 healthy, 85 cancer) of the samples as the training set and the remaining samples as the validation set. Our model achieved an AUC of 1.0 in the training set and an AUC of 0.690 in the validation set. We also tested whether our model could differentiate benign samples from controls and obtained an AUC of 0.903. Consistent with previous studies of non-small cell lung, gastric, ovarian, and pancreatic cancer, this proof-of-concept study of low-coverage plasma WGS provides insight into circulating signatures in plasma DNA and their potential utility for diagnosing cancer [20, 21].
Moreover, we also attempted to observe the distribution of BC risk scores among patients with BC of clinical stages I, II, and III. We found no statistically significant differences between BC risk scores and clinical stages. We also found no statistical significance between BC risk score and pathological characteristics, consistent with the results of previous studies [21]. This study has the disadvantages of including a limited sample size and a large number of raw features before the PCA analysis, which may have resulted in model overfitting. Future studies using deep sequencing in plasma and the features from matched samples are needed to fully characterize the circulating signatures.
In conclusion, here we introduced the BC risk score, which incorporates the effects of CNV, mutation signature, and fragment size, and analysed its performance at screening for BC in a Chinese population. Our study showed that the BC risk score could differentiate among BC patients and controls using a non-invasive, cost-effective, and low-coverage WGS technology, which may provide new ideas for future BC screening.
The datasets used and/or analyzed during the current study are available from the corresponding author on reasonable request.
YDZ designed, performed, and interpreted the experiments and wrote the manuscript, LP, RY and SHG are responsible for sample collection and experiments, YQ, LQ, JBZ headed all computational and analytical aspects, and all authors participated in proofreading. All authors contributed to editorial changes in the manuscript. All authors read and approved the final manuscript. All authors have participated sufficiently in the work to take public responsibility for appropriate portions of the content and agreed to be accountable for all aspects of the work in ensuring that questions related to its accuracy or integrity.
Approved by the Ethics Review Committee of Peking Union Medical College Hospital, Chinese Academy of Medical Sciences, ethics review number: HS-1949. Written informed consent was obtained from all patients.
Thanks to all the peer reviewers for their opinions and suggestions. We thank the study subjects for their participation for their assistance in conducting the studies. We would like to thank Editage (https://www.editage.cn) for English language editing.
This project was Supported by the Non-profit Central Research Institute Fund of Chinese Academy of Medical Sciences (Grant No. 2019XK320019).
The authors declare no conflict of interest.
Publisher’s Note: IMR Press stays neutral with regard to jurisdictional claims in published maps and institutional affiliations.