


1 Department of Obstetrics and Gynecology, Inje University College of Medicine, Haeundae Paik Hospital, 48108 Busan, Republic of Korea
2 Inje University College of Medicine, 47392 Busan, Republic of Korea
Abstract
Background: Insulin resistance and compensatory hyperinsulinemia play a
critical role in the development of hyperandrogenism (HA) in polycystic ovary
syndrome (PCOS) patients. To the best of our knowledge, however, few studies have
determined the optimal fasting insulin cutoff value to predict HA in PCOS
patients. Through this study, we aimed to investigate the optimal cutoff values
for insulin and homeostatic model assessment for insulin resistance (HOMA-IR) to
predict HA in women with PCOS. Methods: One hundred forty-eight women
whose menarche occurred over eight years ago and were newly diagnosed with PCOS
with irregular menstrual cycles (IM) and polycystic ovaries (PCO) using
ultrasound after ruling out other etiologies were enrolled in this study. In this
study, participants were categorized into two groups: those with clinical or
biochemical HA (the IM/PCO/HA group) and those without HA (the IM/PCO group). To
assess the relationship between androgen levels, including total testosterone
(TT) and free testosterone (FT), and fasting glucose and insulin levels and
HOMA-IR values, we performed correlation analysis using Spearman’s rank
correlation coefficient. We used receiver operating characteristic (ROC) analysis
to identify the optimal cutoff values for fasting insulin and HOMA-IR to predict
HA in PCOS patients. Results: Fasting glucose and insulin levels and
HOMA-IR values were significantly different between the IM/PCO/HA and IM/PCO
groups. TT and FT levels exhibited significant correlations with fasting glucose
and insulin levels and HOMA-IR values. The ROC analysis identified the most
suitable fasting insulin cutoff value of 9.85 µU/mL with an area
under the ROC curve (AUC) of 0.817 (60.7% sensitivity and 91.3% specificity)
for predicting HA in women with PCOS. The ROC analysis also showed a HOMA-IR
value of 2.22 as the optimal cutoff value for predicting HA (AUC, 0.820; 60.7%
sensitivity, and 92.4% specificity). Conclusions: Our results support
the classical concept that hyperinsulinemia contributes to HA in PCOS patients.
Women with PCOS with fasting insulin levels of 9.85 µU/mL or higher
(approximately
Keywords
- insulin resistance
- hyperinsulinemia
- hyperandrogenism
- polycystic ovary syndrome
Polycystic ovary syndrome (PCOS) is a prevalent metabolic and endocrine disorder that predominantly affects women of reproductive age [1]. It is characterized by hyperandrogenism (HA), chronic anovulation, and/or polycystic ovary (PCO), as shown by ultrasound [2].
Although no single etiological factor fully explains the range of abnormalities associated with PCOS, insulin sensitivity has been identified as an important factor in the pathophysiology of PCOS [3, 4, 5, 6]. There are numerous factors that influence fasting insulin levels: medical conditions (diabetes mellitus (DM), insulinoma, pancreatic disease, Cushing’s syndrome, acromegaly, etc.), obesity, and medication use (corticosteroids, sulfonylurea, oral contraceptives, etc.). According to a systemic review, insulin sensitivity was lower in women with PCOS than in controls [7]. It is widely acknowledged that obesity contributes to insulin sensitivity, and it is known that the prevalence of obesity and overweight is relatively high in women with PCOS [8].
Insulin resistance (IR) is the opposite of insulin sensitivity, meaning that decreased insulin sensitivity corresponds to increased IR, which means that IR can be confirmed by evaluating insulin sensitivity [9]. Although the hyperinsulinemic-euglycemic clamp (HEC) is considered the gold standard for evaluating insulin sensitivity/resistance, its application in clinical settings is often hindered by practical challenges related to cost and technical requirements. Therefore, several insulin sensitivity assessment indices (ISAIs) have been employed as surrogate indicators for evaluating insulin sensitivity and resistance [9, 10]. Among these ISAIs, homeostatic model assessment for insulin resistance (HOMA-IR) stands as the predominant surrogate marker used in clinical research, offering the advantage of decreased time and cost while maintaining a reasonable level of accuracy [10].
Several studies have investigated the relationship between IR and HA in PCOS patients, providing evidence that hyperinsulinemia contributes to the development of HA [3, 6, 11, 12, 13]. Compensatory hyperinsulinemia following IR stimulates ovarian theca cells to produce and secrete higher amounts of androgens, and in addition, IR/hyperinsulinemia also promotes androgen synthesis in the adrenal gland and inhibits follicular maturation, which induces anovulation and HA, both of which are characteristic features of PCOS. Furthermore, insulin increases the concentration of free testosterone (FT) in the blood by inhibiting the production of sex hormone binding globulin (SHBG) in the liver [3, 6, 11, 12, 13]. HA is one of the key diagnostic criteria for PCOS, and it acts as both a cause and effect of the various major clinical features of PCOS. Various markers to assess androgen status, such as SHBG, total testosterone (TT), and the free androgen index (FAI), have been used to reveal the association between IR and HA in PCOS patients, and it is suggested that these markers can predict IR in women with PCOS [14, 15, 16, 17, 18]. However, since hyperinsulinemia contributes to HA, it seems more reasonable to identify an insulin cutoff value to predict HA than to determine an androgen cutoff value to indicate IR. To the best of our knowledge, studies on the optimal fasting insulin cutoff value for predicting HA in PCOS patients are still lacking.
In this research, we aimed to identify optimal cutoff values for IR, particularly for fasting insulin and HOMA-IR, as a means of predicting HA in women with PCOS.
This study, which was conducted at Inje University Haeundae Paik Hospital,
recruited Korean women aged 21 to 35 years who were newly diagnosed with PCOS
based on ultrasound examination showing PCO and irregular menstrual cycles (IM).
The research was carried out from January 2010 to December 2013. It had been 8 or
more years since menarche for the participants. PCOS was diagnosed according to
the international guidelines for PCOS, excluding other etiologies [2, 19].
Clinical HA was diagnosed when hirsutism with a modified Ferriman–Gallwey score
of 6 or higher, which is a standard examination, was present [19]. Biochemical HA
was defined when serum androgen levels were beyond the upper level of the 95%
confidence interval of the normal population using the results of previous
studies conducted in Korean women (FT level
Patients were excluded from this research for the following reasons: a current or previous diagnosis of diabetes or treatment with antidiabetic medications; current or past diagnoses of hyperprolactinemia or thyroid disease; underwent ovarian surgery; and using medications known to impact gonadotropin levels or sex hormones within 6 months before enrollment, such as glucocorticoids, oral contraceptives, antiandrogens, or ovulation induction agents [21, 22, 23, 24, 25]. According to the above criteria, a total of one hundred forty-eight PCOS patients were included in this research. The participants were categorized into two groups: the group with clinical or biochemical HA (IM/PCO/HA group) and the group without HA (IM/PCO group). This retrospective cohort study was approved by the institutional review board of the university hospital, which waived the need to obtain patient informed consent for the present research.
All study participants underwent pelvic ultrasound imaging in accordance with
international guideline [26], and the definition of PCOS in this study was 20 or
more follicles measuring 2–9 mm per ovary and/or an ovarian volume
Blood samples from all participants were collected in the early follicular phase after overnight fasting, following the guidelines of the Helsinki Declaration. Serum total testosterone (TT) levels were measured using the Elecsys Testosterone II assay (Roche, Indianapolis, IN, USA), while free testosterone (FT) levels were measured using the Free Testo-RIA-CT test (DIA Source, Louvain, Belgium). Serum glucose was evaluated using the L-Type GluI device (Wako, Osaka, Japan), and insulin levels were measured using the Elecsys Insulin assay (Roche, Basel, Switzerland) [23, 24, 25]. The intra- and interassay coefficients of variation for all analyses were less than 8%.
HOMA-IR was calculated as follows: insulin value (µU/mL)
The values of variables are presented as the mean
Table 1 compares the baseline laboratory and clinical parameters between the IM/PCO/HA and IM/PCO groups. The comparative analysis utilizing unpaired t tests revealed significant differences between the two groups in terms of fasting glucose levels, insulin levels, and HOMA-IR values.
| Group 1 | Group 2 | p value | |
| (n = 92) | (n = 56) | ||
| Age (years) | 26.79 |
26.00 |
0.243 |
| Parity | 0.14 |
0.14 |
0.983 |
| Height (cm) | 162.98 |
161.40 |
0.106 |
| Body weight (kg) | 57.34 |
62.92 |
0.037* |
| Body mass index (kg/m |
21.56 |
24.02 |
0.007** |
| Waist to hip ratio | 0.77 |
0.82 |
0.001** |
| Fasting glucose (mg/dL) | 88.53 |
95.07 |
0.002** |
| Fasting insulin (µU/mL) | 6.13 |
20.33 |
|
| HOMA-IR (fasting) | 1.35 |
5.08 |
|
| Total testosterone (ng/mL) | 0.33 |
0.55 |
|
| Free testosterone (pg/mL) | 0.61 |
2.40 |
Values are presented as mean
HOMA-IR, homeostasis model assessment of insulin resistance.
All clinical parameters, i.e., HOMA-IR values, fasting glucose levels, and insulin levels, except for age were significantly correlated with TT and FT levels (Table 2 and Fig. 1). Even after considering adjustments for other anthropometric covariates, such as waist-to-hip ratio (WHR) and body mass index (BMI), these findings remained consistent (data not shown).
| Total testosterone | Free testosterone | |||
| r | p | r | p | |
| Age | –0.011 | 0.893 | –0.147 | 0.074 |
| Body mass index | 0.245 | 0.003** | 0.254 | 0.002** |
| Waist-to-hip ratio | 0.258 | 0.004** | 0.221 | 0.015* |
| Fasting glucose (mg/dL) | 0.290 | 0.355 | ||
| Fasting insulin (µU/mL) | 0.360 | 0.541 | ||
| HOMA-IR (fasting) | 0.366 | 0.547 | ||
r, Spearman’s rank correlation coefficient. *, 0.01
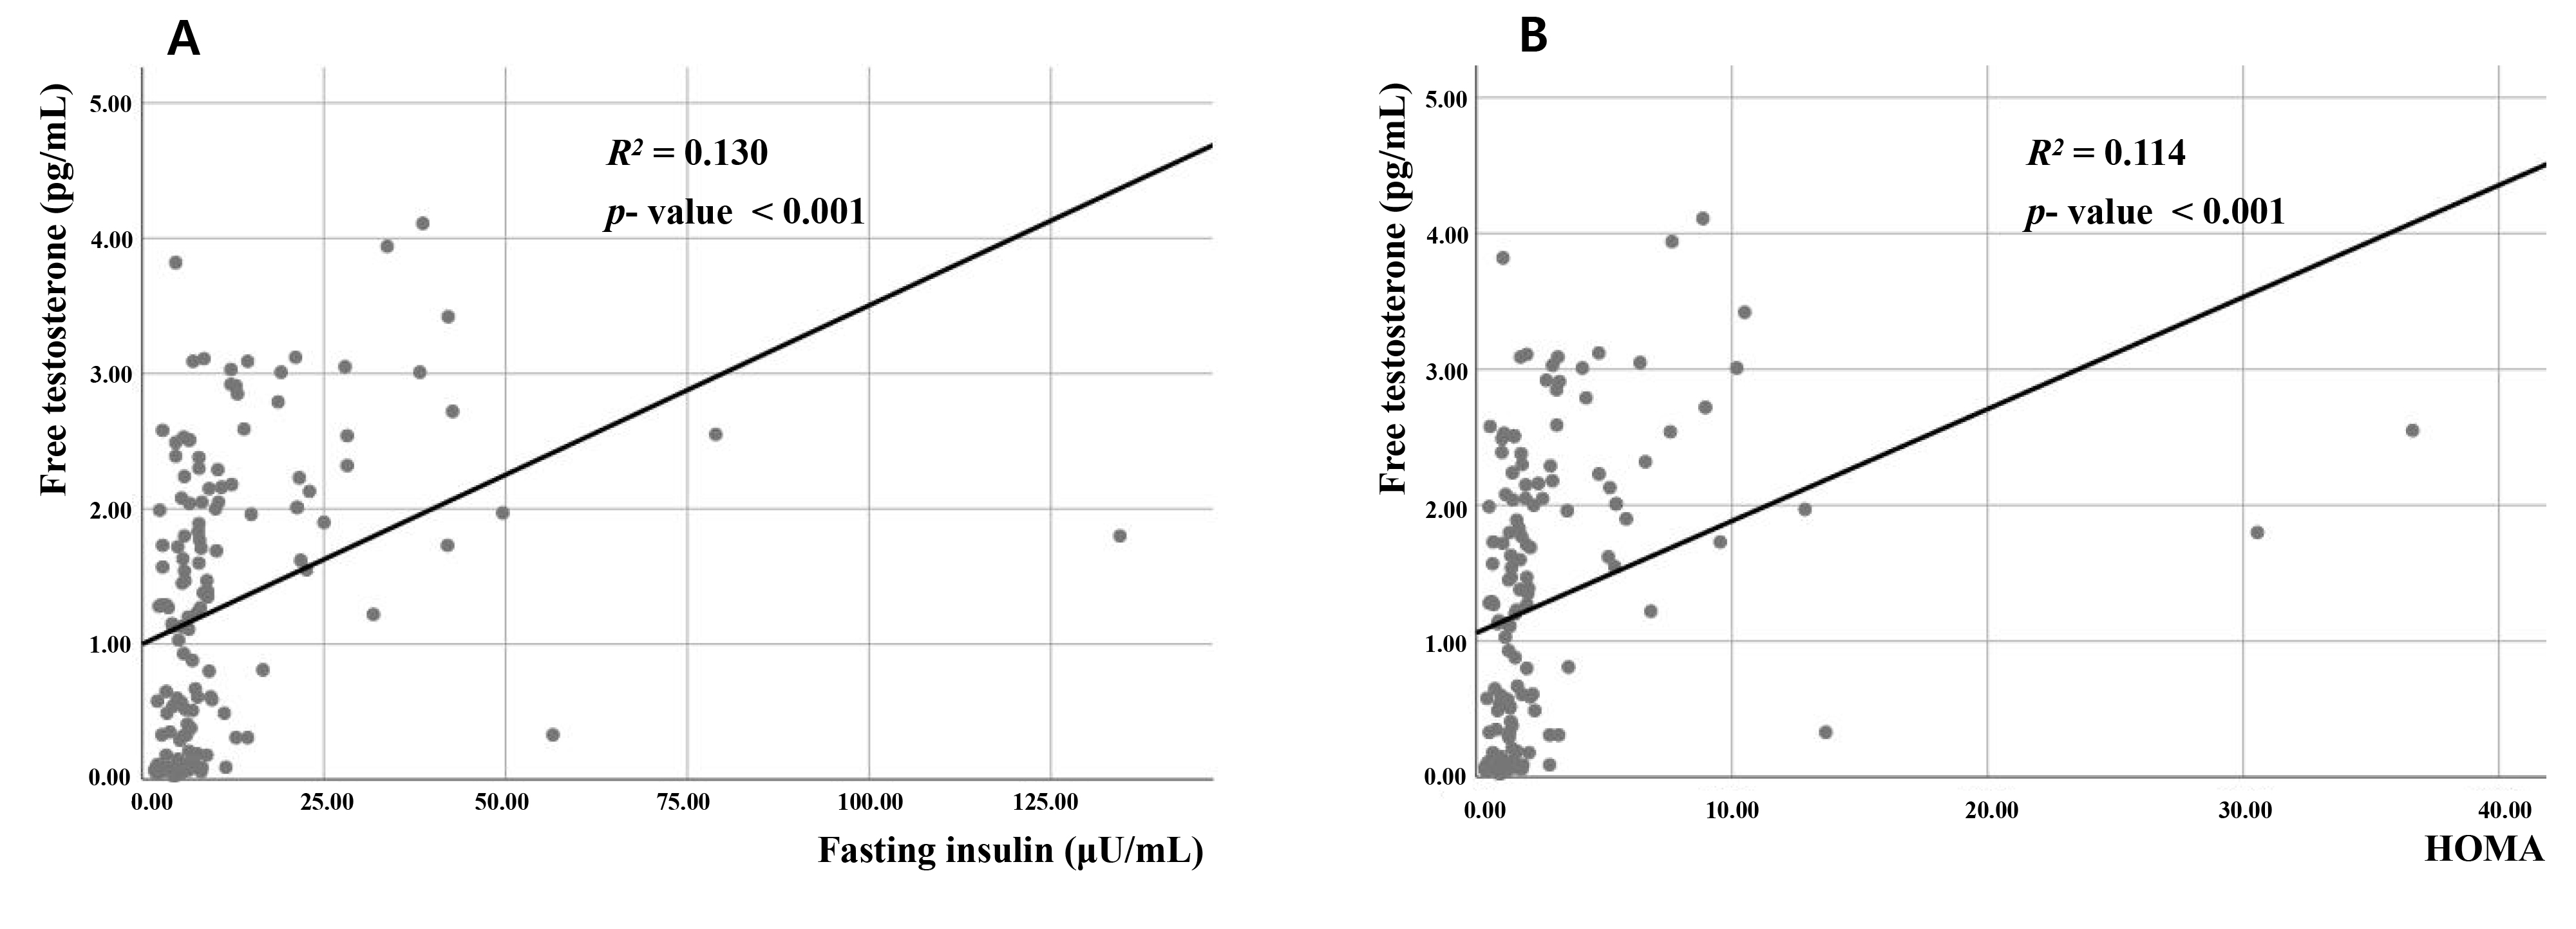 Fig. 1.
Correlations between free testosterone and (A) fasting insulin level and (B) homeostatic model assessment for insulin resistance in women with polycystic ovary syndrome. R
The ROC analysis identified the optimal fasting insulin cutoff point to be 9.85 µU/mL with an area under the ROC curve (AUC) of 0.817 (60.7% sensitivity and 91.3% specificity) for predicting HA in women with PCOS (Fig. 2). The ROC analysis revealed that a HOMA-IR value of 2.22 was identified as the optimal threshold for predicting HA (AUC, 0.820; 60.7% sensitivity and 92.4% specificity).
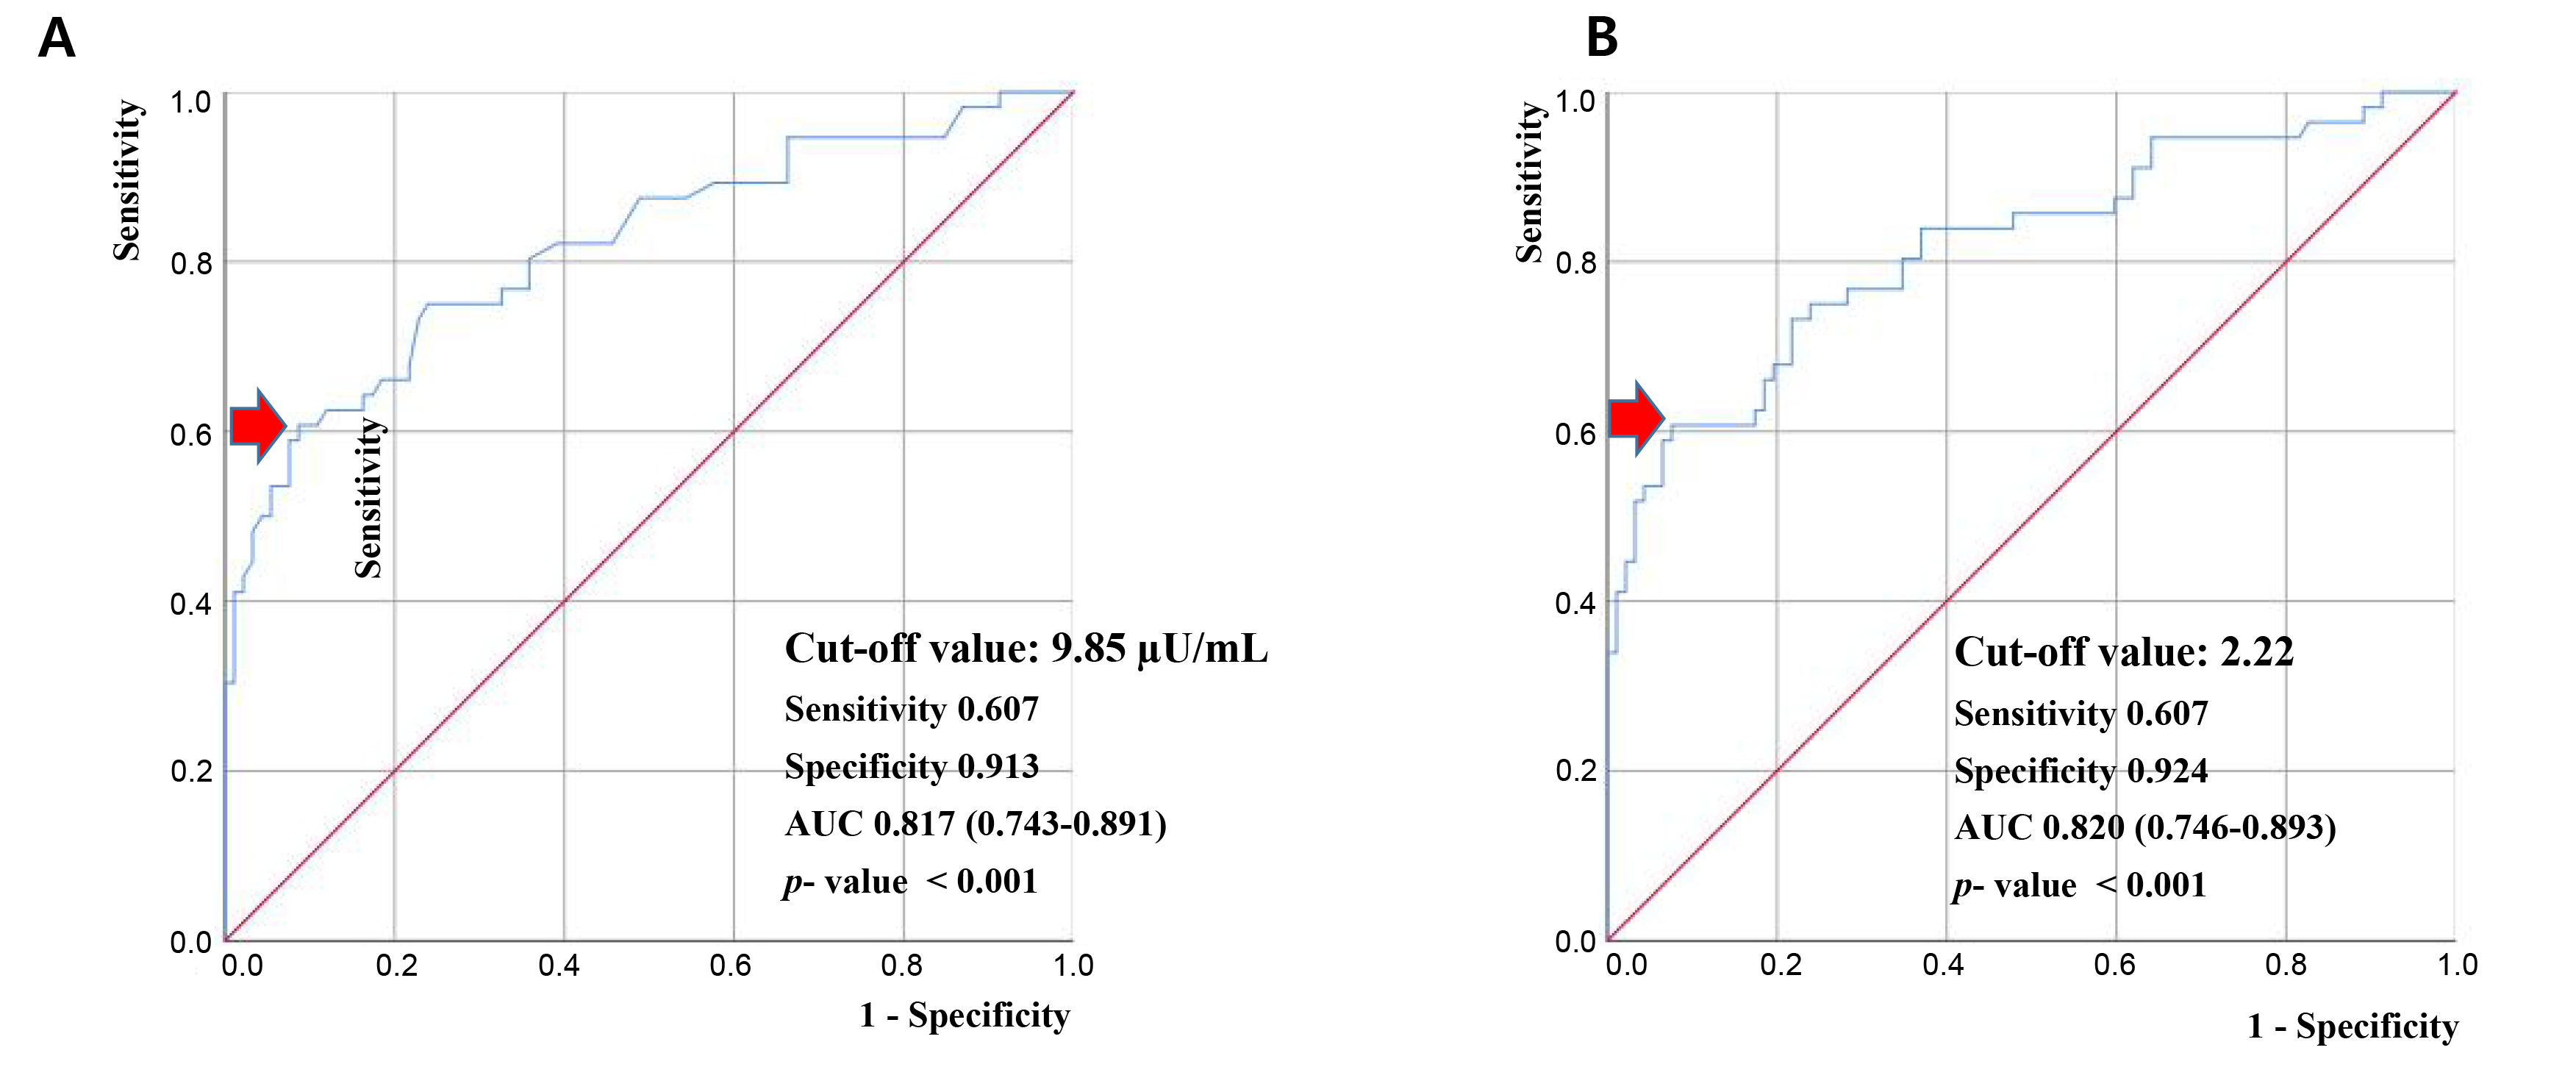 Fig. 2.
Receiver operating characteristic curve analysis to evaluate the accuracy of fasting insulin levels and homeostatic model assessment for insulin resistance values for predicting hyperandrogenism in patients with polycystic ovary syndrome. (A) Fasting insulin level. (B) Homeostatic model assessment for insulin resistance. AUC, area under the receiver operating characteristic curve. Red arrow means cutoff values for predicting hyperandrogenism.
Group 1 included patients who were diagnosed with polycystic ovary syndrome (PCOS) with irregular menstrual cycles and polycystic ovaries on ultrasound but without hyperandrogenism, and Group 2 included patients who were diagnosed with PCOS with irregular menstrual cycles and polycystic ovaries on ultrasound and hyperandrogenism.
In patients with PCOS, HA is not only the cause of clinical symptoms such as hirsutism, acne, and alopecia but also a key etiological cause of characteristic symptoms of PCOS such as anovulation and metabolic disorders. In addition, IR is a common metabolic characteristic in PCOS patients and can directly or indirectly contribute to HA [3, 6]. IR has been identified as a major contributor to the pathophysiology of PCOS, and IR plays a pivotal role in the development of HA in PCOS patients. However, studies on the optimal insulin cutoff value to predict HA in PCOS patients are still insufficient. We aimed to confirm the positive correlation between HA and IR and to investigate the optimal cutoff values of insulin and HOMA-IR, a representative ISAI, to predict HA in women with PCOS. We determined that the optimal cutoff values for predicting hyperandrogenism in women with PCOS were 9.85 µU/mL (approximately 10 µU/mL) for fasting insulin and 2.22 for HOMA-IR.
A single fasting insulin level test is a commonly used method for discriminating IR. However, fasting insulin levels may not reflect the severity of IR [27]. In the diabetic state with fasting hyperglycemia, an inappropriately low level of fasting insulin is not sufficient to maintain euglycemia, and it has been suggested that more useful surrogate indices, rather than fasting insulin only, should be taken into account [27]. In the present study, we made efforts to mitigate the impact of other medical conditions and the use of medications on fasting insulin levels, and specifically, we excluded patients with diabetes who were taking antidiabetic medications.
As mentioned above, IR and HA are the key pathophysiological factors that can elucidate the various clinical manifestations of PCOS [3, 4, 5, 6]. Several studies have suggested that insulin exerts both direct and indirect effects on the development of HA in PCOS patients [3, 6]. Women with PCOS face an elevated risk of developing glucose intolerance and type 2 diabetes mellitus and IR is a common feature in these patients, leading to compensatory hyperinsulinemia [5, 6]. Hyperinsulinemia stimulates the production of androgens in the ovaries, increases androgen bioavailability, and hinders the synthesis of SHBG, leading to elevated levels of FT, thus contributing to the development and exacerbation of HA in PCOS patients [3, 6, 11, 12, 13]. IR/hyperinsulinemia also promotes androgen synthesis in the adrenal gland and inhibits follicular maturation. Additionally, IR/hyperinsulinemia results in an increase in the serum luteinizing hormone to follicle-stimulating hormone (LH/FSH) ratio by increasing LH secretion from the pituitary gland [3, 4, 6]. Through the aforementioned mechanisms, IR/hyperinsulinemia induces anovulation and HA. At high concentrations, insulin can mimic the actions of insulin-like growth factor-1 (IGF-1) by binding to the IGF-I receptor, which has been suggested as another possible explanation for insulin’s role in causing HA [13, 28, 29]. Furthermore, other studies have demonstrated that insulin exerts distinct effects on steroidogenesis through its own receptor, even in states of insulin resistance [13, 30, 31]. These findings support the existing concept that there is a strong association between HA and IR in PCOS patients.
Recently, one study estimated the cutoff value for HOMA-IR to evaluate IR based on the SHBG level in PCOS patients [32]. In a study of 854 Caucasian women by Biernacka-Bartnik et al. [32], an empirical optimal cutoff value of 2.1 for HOMA-IR was suggested to predict circulating SHBG levels below the normal range (26.1 nmol/L) (AUC value of 0.73 with a sensitivity of 72.3% and a specificity of 63.1%), which is partially consistent with our results. However, the study of Biernacka-Bartnik et al. [32] differs from ours in that it did not measure the insulin cutoff value for actual androgens such as TT or FT but rather the value of HOMA-IR for SHBG, an indirect indicator for evaluating androgens.
In contrast, some studies have been conducted to determine the cutoff values of
androgen-related indicators to predict IR. Yetim Şahin et al. [17]
conducted a study investigating the association between PCOS and obesity and IR
with all factors that may impact IR. They found that the FAI can be used as a
supporting IR marker in PCOS with an FAI cutoff value of 5.93 [17]. Banu
et al. [14] suggested that the TT level significantly correlated with IR
(defined fasting glucose level), whereby the cutoff value of TT that may predict
IR was 46.25 ng/dL (sensitivity 43.6% and specificity 70.6%). Additionally,
SHBG has also been shown to have a strong association with IR [15, 16]. Kajaia
et al. [15] suggested that SHBG can serve as a predictive marker of IR
in women with HA. Chen et al. [16] showed that SHBG can be used as an
independent predictive marker for IR in PCOS patients, especially
obese/overweight patients. In the study, the optimal SHBG cutoff value to predict
IR (defined as a HOMA-IR value
It is difficult to explain why there have been few studies on the cutoff value of insulin to predict HA to date. One possible explanation is that while insulin resistance is prevalent among women with PCOS, it does not seem to be universal across all cases [8, 20], and hyperinsulinemia or IR is not included in the diagnostic criteria for PCOS. Hence, insulin tests are not routinely performed for all PCOS patients, and they are not regarded as essential to evaluate blood glycemic status in patients with PCOS [2, 19]. Additionally, there may be limitations for insulin tests in terms of cost and setting, and some countries may not have the facilities or equipment necessary for such testing.
There are several limitations in our research. Because this study included only Korean women with PCOS, the possibility of different results in other ethnic groups cannot be ruled out. As mentioned, we were unable to use the HEC, which is considered the gold standard for assessing insulin sensitivity/resistance, due to practical limitations in clinical settings [9]. However, it would have been more comprehensive to incorporate postprandial ISAIs, such as the Matsuda index derived from insulin levels and postprandial glucose, for evaluating insulin sensitivity/resistance in our research [2, 9, 10]. In addition, SHBG is an emerging biomarker for predicting HA and IR. However, we were unable to evaluate the FAI using SHBG because there was no commercial test kit to evaluate SHBG at the university hospital where this study was conducted, which could be another drawback of this research.
The relatively small sample size of the number of participants also seems to be
a limitation of our research. However, when the sample size was calculated using
RStudio 4.4.2 (R Foundation for Statistical Computing, Vienna, Austria) with
reference to a previous study [32], the sample size was calculated as 46
participants with a significance level
In conclusion, our results support the classical concept that hyperinsulinemia
contributes to HA in PCOS patients. Women with PCOS with fasting insulin levels
of 9.85 µU/mL or higher (approximately
The datasets used and/or analyzed during the current study are available from the corresponding author on reasonable request.
These should be presented as follows; Conceptualization: SL, HA, SC. Data curation: HA, SC. Formal analysis: SC. Methodology: SL, HA, SR, SC. Project administration: SC. Visualization: SC. Writing—original draft: SL. Writing—review & editing: SC. All authors contributed to editorial changes in the manuscript. All authors read and approved the final manuscript. All authors have participated sufficiently in the work and agreed to be accountable for all aspects of the work.
The study was conducted in accordance with the guidelines of the Declaration of Helsinki. This study was approved by the Institutional Review Board (IRB) of Inje University Haeundae Paik Hospital (IRB No. 129792-2014-035), which waived the requirement for written consent for subjects in the present study.
Not applicable.
This research received no external funding.
The authors declare no conflict of interest.
References
Publisher’s Note: IMR Press stays neutral with regard to jurisdictional claims in published maps and institutional affiliations.