
- Academic Editors
†These authors contributed equally.
Background: Progressive ischemic brain injury after cardiac arrest can cause damage to the hypothalamic-pituitary axis, particularly the pituitary gland. This may impact serum osmolality (SOsm) and urine osmolality (UOsm) in patients who have experienced out-of-hospital cardiac arrest (OHCA). We assumed that a low ratio of UOsm to SOsm (USR) is related to poor outcomes among OHCA patients. Therefore, the present study was designed to evaluate the association between the USR within 72 h after the restoration of spontaneous circulation (ROSC) and 6-month neurological outcomes in OHCA patients. Methods: This prospective, observational study included OHCA patients with targeted temperature management at Chonnam National University Hospital in Gwangju, Korea, between January 2016 and December 2022. We collected SOsm and UOsm data at admission (T0) and 24 (T1), 48 (T2), and 72 h (T3) after ROSC. The primary outcome was a poor neurological outcome at 6 months defined by cerebral performance categories 3, 4, or 5. Results: This study included 319 patients. The mean UOsm and USRs at T0, T1, T2, and T3 of patients with poor outcomes were lower than those of patients with good outcomes. Multivariable analysis indicated that the USRs at T1 (odds ratio [OR], 0.363; 95% confidence interval [CI], 0.221–0.594), T2 (OR, 0.451; 95% CI, 0.268–0.761), and T3 (OR, 0.559; 95% CI, 0.357–0.875) were associated with a poor outcome. The areas under the receiver operating characteristic curves of USRs at T0, T1, T2, and T3 for predicting poor outcomes were 0.615 (95% CI, 0.559–0.669), 0.711 (95% CI, 0.658–0.760), 0.724 (95% CI, 0.671–0.772), and 0.751 (95% CI, 0.699–0.797), respectively. Conclusions: The USRs within 72 h of ROSC were associated with poor neurological outcomes at 6 months in OHCA patients.
Most cardiac arrests are associated with permanent neurological injury even after the restoration of spontaneous circulation (ROSC); these sequelae can be life-threatening [1]. For patients who experience out-of-hospital cardiac arrest (OHCA) leading to coma after ROSC, neurological prognostication is necessary to inform patients’ families and to help clinicians target treatment to patients with neurological potential for recovery. Additionally, since unnecessary medical resource consumption may increase for patients with poor neurological outcomes, it is important to accurately predict neurological outcomes to efficiently use limited medical resources. Current guidelines recommend a combination of multiple diagnostic tests to predict neurological outcomes in OHCA patients, as accuracy of prognostication by any single predictor is not guaranteed [2].
Progressive hypoxic brain injury can affect a patient’s homeostasis by causing hypothalamic dysfunction, which can lead to problems with regulating electrolytes and total body water [3]. Electrolyte and fluid imbalances can affect serum osmolality (SOsm) and urine osmolality (UOsm) in OHCA patients. Several studies have used SOsm and UOsm to diagnose central diabetes insipidus (CDI) and have shown that CDI is associated with prognosis, including in terms of neurological outcomes and mortality among OHCA patients [4, 5]. These studies reported that 11–21% of OHCA patients were diagnosed as CDI, and all patients with CDI had poor neurological outcomes, while no patients with favorable prognoses developed CDI [4, 5]. Since the proportions of patients diagnosed with CDI did not exceed the proportions of patients with poor prognoses in these previous studies, the effectiveness of CDI for predicting prognosis is limited. Moreover, these previous studies required 7–8 days after ROSC to define the occurrence of CDI after ROSC [4, 5]. It is inefficient to predict a patient’s prognosis with a CDI diagnosis in that the relevant guideline recommends predicting prognosis at least 72 h after the return to normothermia [2]. Additionally, hyponatremia was more prevalent than hypernatremia after ROSC [6], complicating the diagnosis of CDI, as hypotonic polyuria is not typically suspected, making water deprivation tests or desmopressin administration tests challenging. However, previous research has indicated that high SOsm and low UOsm are useful for predicting CDI [4, 5]. Thus, the ratio between UOsm and SOsm within 3 days after ROSC may be associated with prognosis after cardiac arrest. To our knowledge, no published studies have investigated the relationship between SOsm and UOsm for its prognostic value in the context of OHCA.
We hypothesized that a low ratio of UOsm to SOsm (USR) is related with poor outcomes in OHCA patients. Therefore, the present study was designed to evaluate the association between the USR within 72 h after ROSC and 6-month neurological outcomes in OHCA patients.
This prospective, observational study included OHCA patients with targeted
temperature management (TTM) at Chonnam National University Hospital in Gwangju,
Korea, between January 2016 and December 2022. We included adult (
We maintained blood glucose levels within 80–200 mg/dL using intravenous
glucose or insulin. If severe hyperglycemia (
Data related to the following variables were obtained from the patients’
hospital records: sex, age, preexisting illness, body mass index, first on-scene
monitored rhythm, bystander cardiopulmonary resuscitation, witnessed collapse,
interval from collapse to ROSC, laboratory findings at admission (glucose level,
lactate level, partial pressure of carbon dioxide [PaCO
SOsm and UOsm measurements were taken at admission (T0) and 24 (T1), 48 (T2),
and 72 h (T3) after ROSC. The SOsm was measured using the OSMO STAION OM 6060
(Arkray Inc., Kyoto, Japan) and UOsm was measured using the Multi-Osmette 2430
(Precision Systems Inc., Natick, MA, USA). USRs were calculated by dividing UOsm
by SOsm. We collected levels of glucose, sodium, potassium, and blood urea nitrogen (BUN) at T0, T1,
T2, and T3. We investigated the presence of central diabetes insipidus. Central
diabetes insipidus was defined when all of the following criteria were met: urine
volume
One investigator measured the gray-to-white matter ratio (GWR) on brain computed
tomography (CT) scans at admission. A board-certified neuroradiologist, blinded
to the clinical outcomes, measured the hounsfield units of the corpus callosum,
caudate nucleus, putamen, and posterior limb of the internal capsule. The regions
were measured in circular shapes, approximately 9–12 mm
We assessed neurological outcomes 6 months after ROSC through phone interviews using the cerebral performance category (CPC) scale (CPC 1, good cerebral performance; CPC 2, moderate cerebral disability; CPC 3, severe cerebral disability; CPC 4, coma or vegetative state; or CPC 5, brain death or death) [8]. The primary outcome was a poor neurological outcome defined as CPC 3, 4, or 5.
We evaluated categorical variables as frequencies and percentages, whereas
continuous variables were evaluated as medians and interquartile ranges,
depending on the Shapiro-Wilk test results. Categorical group data were
comparatively analyzed using the
We conducted multivariable logistic regression analysis to identify the
predictive force of SOsm and UOsm on 6-month CPC outcomes. Variables with
p-values
A total of 414 OHCA patients treated with TTM were identified during the study
period. Of these, 319 patients met the inclusion criteria (Fig. 1). The median
age of the OHCA patients was 61.0 years, and 241 men (75.5%) were included. In
total, 210 collapses (65.8%) were witnessed by bystanders; 139 patients (43.6%)
had shockable rhythms at the time of OHCA, and the mean interval from cardiac
arrest to ROSC was 26.0 minutes (18.0–42.0 minutes). Patients with poor
neurological outcomes had lower body mass indices, older age, and higher rates of
chronic lung disease, diabetes, and hypertension than those with good
neurological outcomes (Table 1). In addition, patients with poor neurological
outcomes had lower rates of shockable rhythm and witnessed collapse; they also
had a longer mean interval to ROSC. After ROSC, patients with poor outcomes had a
lower mean Glasgow Coma Scale (GCS) score and GWR than those with favorable outcomes. The patients
with poor outcomes also had a higher mean serum lactate level, mean PaCO
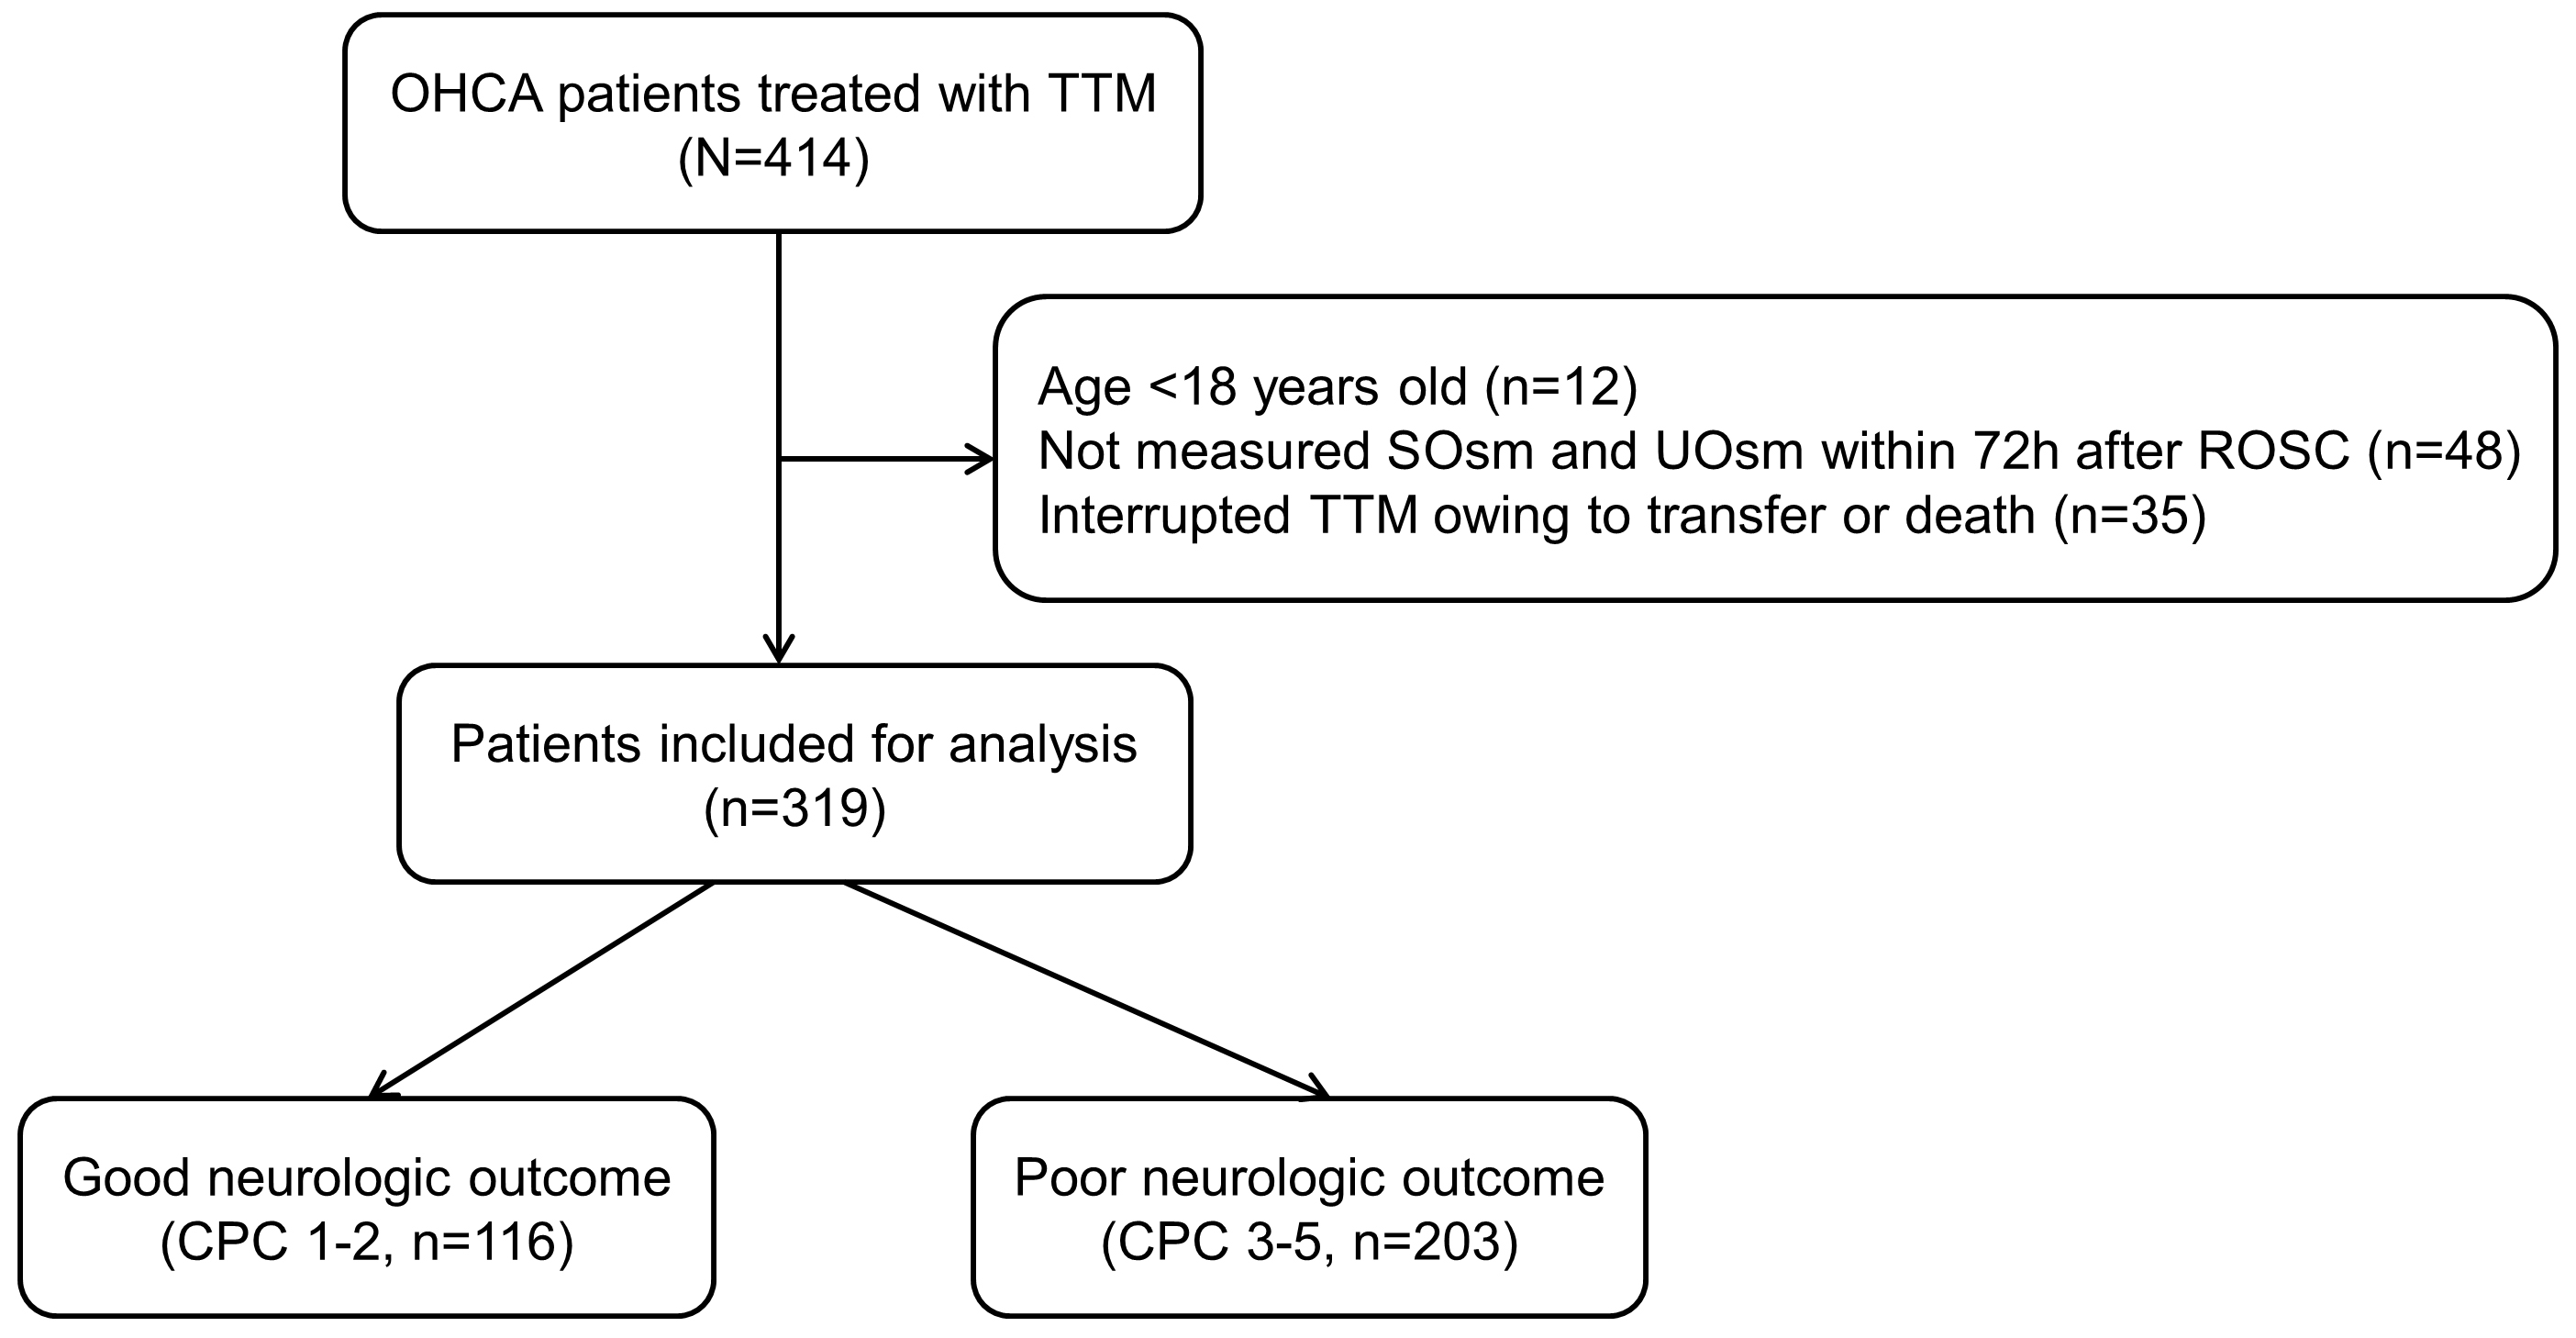 Fig. 1.
Flow diagram of patient inclusion. OHCA, out-of-hospital cardiac arrest; SOsm, serum osmolality; UOsm, urine osmolality; TTM, targeted temperature management; CPC, cerebral performance category; ROSC, restoration of spontaneous circulation.
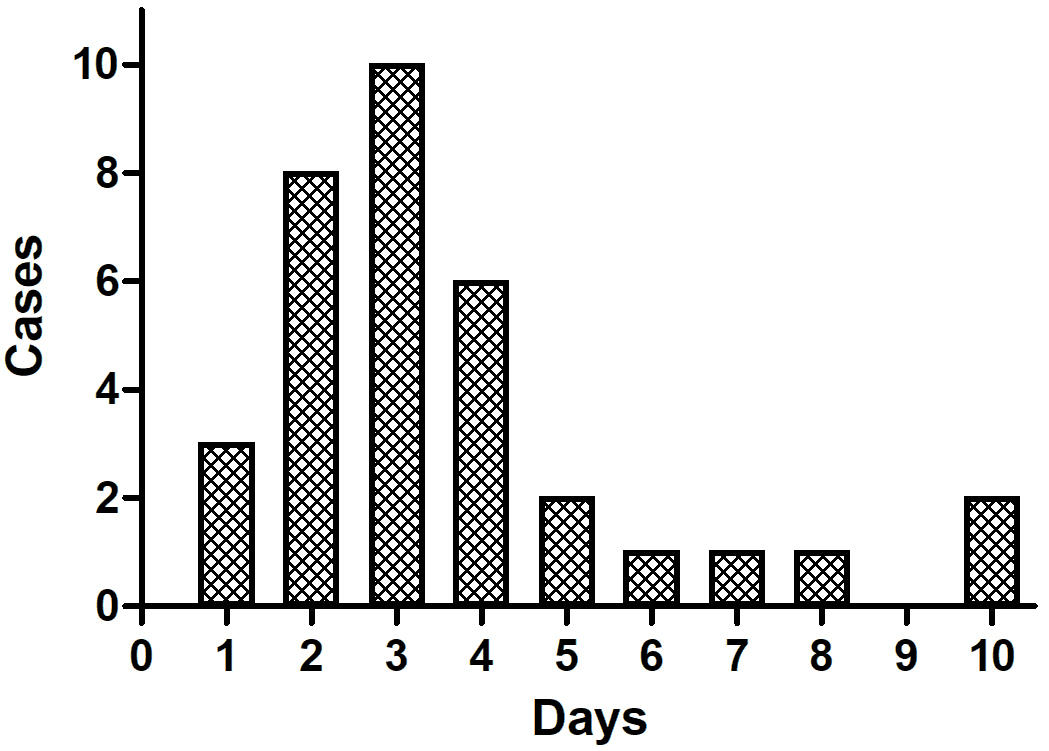 Fig. 2.
CDI occurrence time after ROSC. Among CDI cases, 61.7% occured within 3 days, and 38.3% occured more than 3 days after ROSC. CDI, central diabetes insipidus; ROSC, restoration of spontaneous circulation.
| Variable | Total (n = 319) | Good (n = 116) | Poor (n = 203) | p | |
| Demographics | |||||
| Age, years | 61.0 (49.0–71.0) | 56.0 (45.0–66.0) | 64.0 (53.0–74.0) | ||
| Male, n (%) | 241 (75.5) | 91 (78.4) | 150 (73.9) | 0.438 | |
| Body mass index, kg/m |
23.4 (21.0–25.7) | 24.2 (22.0–26.4) | 22.8 (20.4–24.8) | ||
| Preexisting illness, n (%) | |||||
| Coronary artery disease | 56 (17.6) | 19 (16.4) | 37 (18.2) | 0.792 | |
| Congestive heart failure | 15 (4.7) | 6 (5.2) | 9 (4.4) | 0.980 | |
| Hypertension | 140 (43.9) | 38 (32.8) | 102 (50.2) | 0.004 | |
| Diabetes | 86 (27.0) | 16 (13.8) | 70 (34.5) | ||
| Chronic lung disease | 30 (9.4) | 3 (2.6) | 27 (13.3) | 0.003 | |
| Renal impairment | 17 (5.3) | 4 (3.4) | 13 (6.4) | 0.383 | |
| Cerebrovascular accident | 25 (7.8) | 5 (4.3) | 20 (9.9) | 0.120 | |
| Malignancy | 24 (7.5) | 10 (8.6) | 14 (6.9) | 0.733 | |
| Cardiac arrest characteristics | |||||
| Witnessed collapse, n (%) | 210 (65.8) | 90 (77.6) | 120 (59.1) | ||
| Bystander CPR, n (%) | 200 (62.7) | 81 (69.8) | 119 (58.6) | 0.061 | |
| Shockable rhythm, n (%) | 139 (43.6) | 93 (80.2) | 46 (22.7) | ||
| Interval from collapse to ROSC, min | 26.0 (18.0–42.0) | 19.0 (14.3–27.0) | 33.0 (21.0–45.0) | ||
| Clinical characteristics after ROSC | |||||
| Lactate, mmol/L | 7.7 (5.2–11.2) | 6.4 (3.4–8.9) | 9.1 (6.1–12.4) | ||
| Glucose, mg/dL | 260 (186–326) | 244 (172–303) | 270 (189–333) | 0.027 | |
| PaO |
141.0 (89.0–233.0) | 137.7 (81.1–222.5) | 157.4 (92.3–248.0) | 0.059 | |
| PaCO |
43.0 (33.5–59.9) | 38.6 (32.1–45.0) | 49.6 (35.0–68.8) | ||
| SOFA score | 11 (9–12) | 10 (7–11) | 11 (10–13) | ||
| Target temperature of TTM | 0.366 | ||||
| 33 °C, n (%) | 305 (95.6%) | 113 (97.4%) | 192 (94.6%) | ||
| 36 °C, n (%) | 14 (4.4%) | 3 (2.6%) | 11 (5.4%) | ||
| Gray-white matter ratio | 1.29 (1.19–1.38), 310 |
1.35 (1.26–1.43), 112 |
1.24 (1.15–1.35), 198 |
||
| CDI, n (%) | 34 (10.7) | 0 (0.0) | 34 (16.7) | ||
Data are presented as median (25th–75th percentile) or number (%) of patients.
CPR, cardiopulmonary resuscitation; ROSC, restoration
of spontaneous circulation; SOFA, Sequential Organ Failure Assessment; TTM,
targeted temperature management; CDI, central diabetes insipidus; PaCO
According to neurological outcomes at 6 months, SOsm at T0, T1, T2, and T3 among patients with poor outcomes were higher than those among patients with good outcomes. UOsm and USRs at T0, T1, T2, and T3 among patients with poor outcomes were lower than those among patients with good outcomes (Table 2). Our analysis of SOsm, UOsm, and USR values according to the target TTM temperature showed no significant differences between the target temperatures of 33 °C and 36 °C.
| Variable | Total (n = 319) | Good (n = 116) | Poor (n = 203) | p | 33 °C (n = 305) | 36 °C (n = 14) | p |
| SOsm at T0, mOsm/L | 300 (293–309) | 299 (292–304) | 303 (294–313) | 0.003 | 300 (294–309) | 301 (290–325) | 0.845 |
| SOsm at T1, mOsm/L | 296 (290–303) | 293 (289–298) | 298 (291–305) | 296 (290–303) | 296 (289–304) | 0.720 | |
| SOsm at T2, mOsm/L | 295 (289–302) | 292 (288–298) | 297 (290–305) | 295 (289–302) | 295 (290–298) | 0.752 | |
| SOsm at T3, mOsm/L | 297 (290–305) | 293 (290–299) | 300 (292–309) | 297 (291–305) | 293 (287–303) | 0.136 | |
| UOsm at T0, mOsm/L | 389 (340–481) | 428 (354–520) | 381 (330–456) | 0.002 | 392 (341–484) | 369 (330–415) | 0.244 |
| UOsm at T1, mOsm/L | 415 (310–593) | 514 (394–671) | 355 (265–527) | 415 (311–582) | 358 (298–694) | 0.814 | |
| UOsm at T2, mOsm/L | 429 (322–606) | 541 (398–710) | 363 (303–519) | 431 (321–608) | 424 (328–598) | 0.954 | |
| UOsm at T3, mOsm/L | 457 (314–655) | 582 (455–733) | 368 (292–540) | 452 (310–651) | 471 (332–672) | 0.735 | |
| USR at T0 | 1.29 (1.10–1.64) | 1.44 (1.17–1.78) | 1.24 (1.08–1.54) | 1.30 (1.11–1.64) | 1.18 (1.03–1.38) | 0.108 | |
| USR at T1 | 1.39 (1.05–1.98) | 1.78 (1.35–2.30) | 1.18 (0.91–1.74) | 1.40 (1.05–1.97) | 1.18 (1.02–2.40) | 0.822 | |
| USR at T2 | 1.44 (1.08–2.07) | 1.85 (1.35–2.46) | 1.21 (1.01–1.74) | 1.44 (1.08–2.07) | 1.42 (1.12–2.02) | 0.954 | |
| USR at T3 | 1.54 (1.05–2.23) | 1.99 (1.54–2.56) | 1.22 (0.99–1.86) | 1.54 (1.04–2.22) | 1.60 (1.14–2.32) | 0.663 |
Data are presented as median (25th–75th percentile).
SOsm, serum osmolality; UOsm, urine osmolality; USR, ratio of UOsm to SOsm.
After confounders were adjusted for, the UOsm values at T1 (OR, 0.997; 95% CI, 0.995–0.998), T2 (OR, 0.997; 95% CI, 0.996–0.999), and T3 (OR, 0.998; 95% CI, 0.997–1.000) were independently associated with poor outcomes (Table 3). The USRs at T1 (OR, 0.363; 95% CI, 0.221–0.594), T2 (OR, 0.451; 95% CI, 0.268–0.761), and T3 (OR, 0.559; 95% CI, 0.357–0.875) were independently associated with poor outcomes (Table 3). For SOsm, only the measurement at T3 was associated with poor outcomes (OR, 1.048; 95% CI, 1.012–1.085).
| Variable | Adjusted OR (95% CI) |
p |
| SOsm at T0, mOsm/L | 0.994 (0.978–1.010) | 0.443 |
| SOsm at T1, mOsm/L | 1.030 (0.994–1.068) | 0.108 |
| SOsm at T2, mOsm/L | 1.036 (0.998–1.076) | 0.065 |
| SOsm at T3, mOsm/L | 1.048 (1.012–1.085) | 0.008 |
| UOsm at T0, mOsm/L | 1.000 (0.997–1.002) | 0.719 |
| UOsm at T1, mOsm/L | 0.997 (0.995–0.998) | |
| UOsm at T2, mOsm/L | 0.997 (0.996–0.999) | 0.004 |
| UOsm at T3, mOsm/L | 0.998 (0.997–1.000) | 0.016 |
| USR at T0 | 1.029 (0.459–2.306) | 0.944 |
| USR at T1 | 0.363 (0.221–0.594) | |
| USR at T2 | 0.451 (0.268–0.761) | 0.003 |
| USR at T3 | 0.559 (0.357–0.875) | 0.011 |
Each of SOsm, UOsm, and USR at the respective time points was entered into the final model and analyzed.
SOsm, serum osmolality; UOsm, urine osmolality; USR, ratio of UOsm to SOsm;
SOFA, Sequential Organ Failure Assessment; ROSC, restoration of spontaneous
circulation; OR, odds ratio; PaCO
The areas under the receiver operating characteristic curves (AUCs) for the SOsm, UOsm, and USRs at T0, T1, T2, and T3 for predicting poor neurological outcomes at 6 months are presented in Fig. 3. The AUCs for SOsm at T0, T1, T2, and T3 for poor outcomes were 0.601 (95% CI, 0.545–0.655), 0.666 (95% CI, 0.611–0.718), 0.628 (95% CI, 0.573–0.682), and 0.669 (95% CI, 0.614–0.720), respectively (Fig. 3A). The AUCs for UOsm at T0, T1, T2, and T3 were 0.605 (95% CI, 0.549–0.659), 0.702 (95% CI, 0.649–0.752), 0.717 (95% CI, 0.665–0.766), and 0.738 (95% CI, 0.686–0.785), respectively (Fig. 3B). The AUCs for USRs at T0, T1, T2, and T3 were 0.615 (95% CI, 0.559–0.669), 0.711 (95% CI, 0.658–0.760), 0.724 (95% CI, 0.671–0.772), and 0.751 (95% CI, 0.699–0.797), respectively (Fig. 3C). The AUC of the USR at T3 was significantly different from those of the SOsm and UOsm at T3 after ROSC.
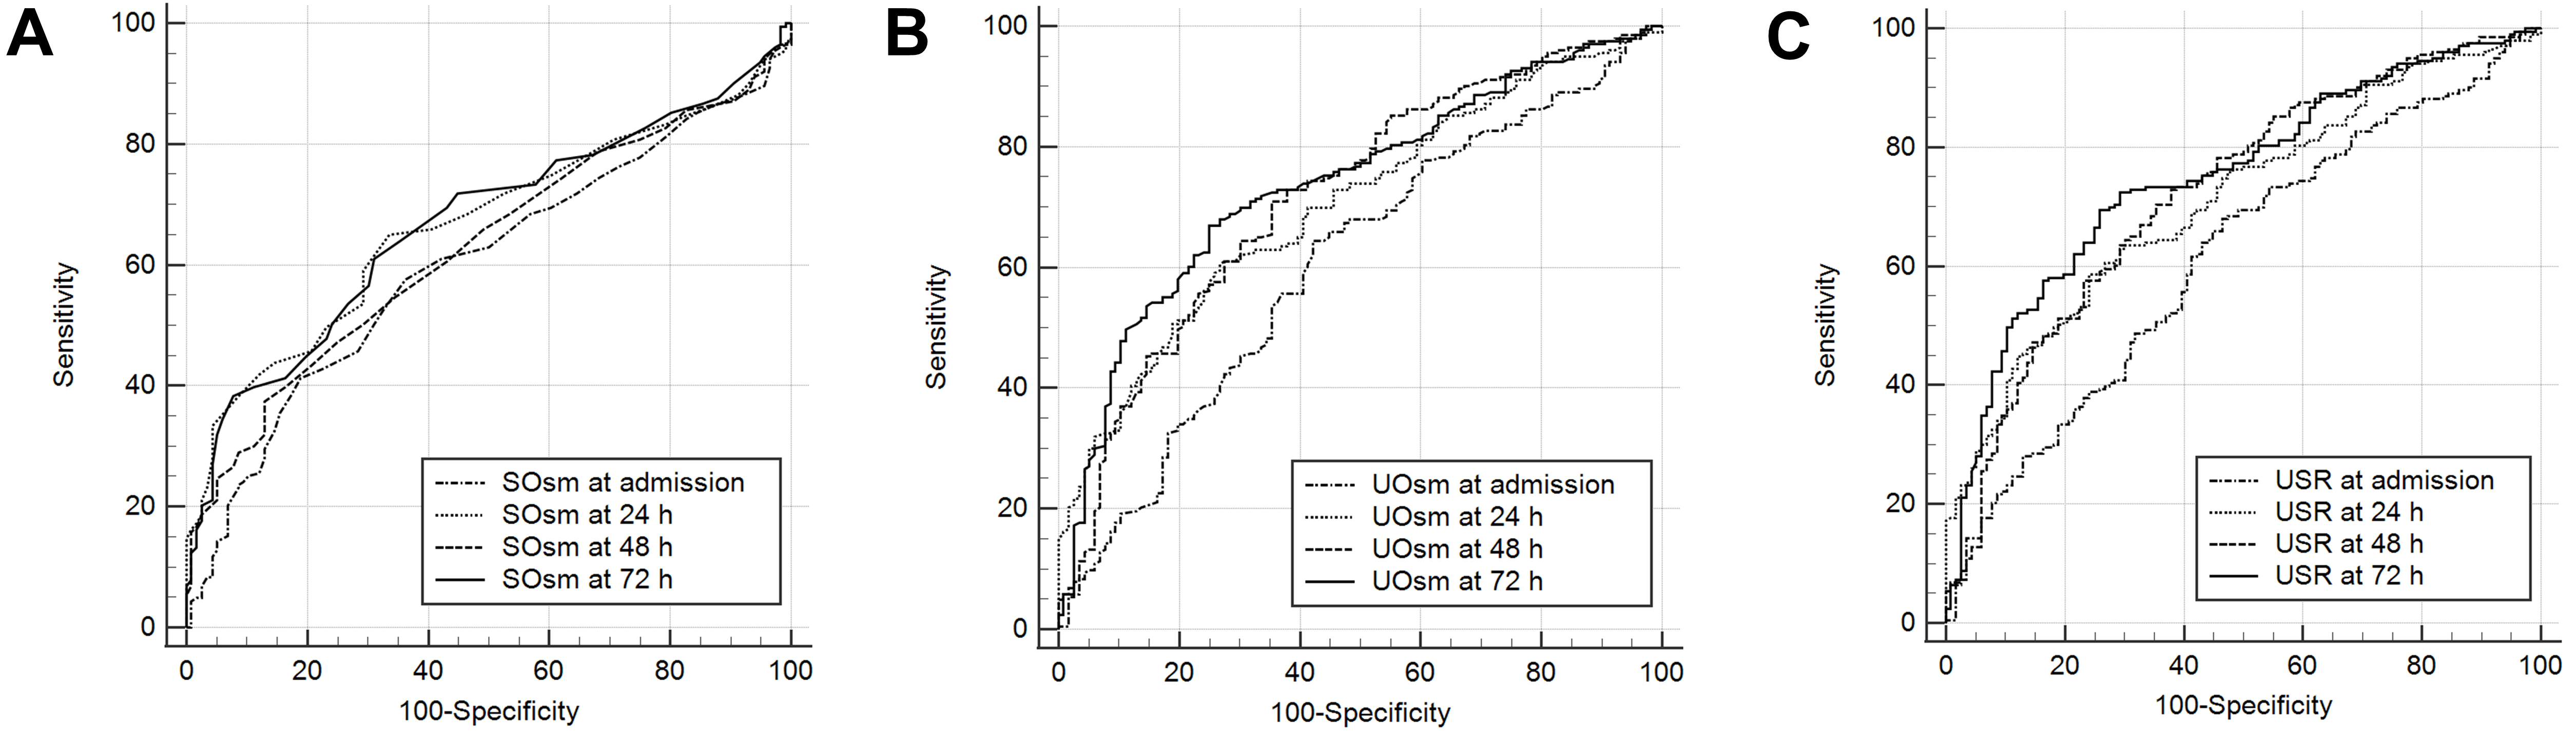 Fig. 3.
AUCs for SOsm (A), UOsm (B), and USR (C) for predicting poor outcomes. The AUC for USR at 72 h after ROSC was significantly different from those for SOsm and UOsm at the same time point. AUCs, areas under the receiver operating characteristic curves; SOsm, serum osmolality; UOsm, urine osmolality; USR, ratio of urine osmolality to serum osmolality; ROSC, restoration of spontaneous circulation.
The patients with CDI had a higher mean SOsm, as well as lower mean UOsm and USR values than the patients without CDI (Table 4). The patients with CDI had a lower mean GWR on CT at T0 than the patients without CDI (Table 4). The patients with CDI had higher mean glucose levels at T2 and T3 than patients without CDI (Supplementary Table 2). The patients with CDI had higher mean sodium levels at T1, T2, and T3 than patients without CDI (Supplementary Table 2). Potassium and BUN levels did not differ between the patients with CDI and patients without CDI, significantly.
| Variable | No CDI (n = 285) | CDI (n = 34) | p |
| SOsm at T0, mOsm/L | 300 (292–308) | 308 (301–323) | 0.001 |
| SOsm at T1, mOsm/L | 295 (290–302) | 305 (300–314) | |
| SOsm at T2, mOsm/L | 294 (289–300) | 307 (299–316) | |
| SOsm at T3, mOsm/L | 295 (290–303) | 313 (302–329) | |
| UOsm at T0, mOsm/L | 395 (343–491) | 358 (310–425) | 0.017 |
| UOsm at T1, mOsm/L | 417 (320–602) | 334 (177–528) | |
| UOsm at T2, mOsm/L | 443 (329–624) | 358 (194–490) | |
| UOsm at T3, mOsm/L | 488 (325–668) | 306 (189–384) | |
| USR at T0 | 1.31 (1.11–1.67) | 1.16 (1.00–1.40) | |
| USR at T1 | 1.42 (1.06–2.03) | 1.11 (0.58–1.74) | |
| USR at T2 | 1.52 (1.11–2.09) | 1.12 (0.65–1.66) | |
| USR at T3 | 1.64 (1.09–2.27) | 0.98 (0.58–1.26) | |
| Gray-to-white matter ratio | 1.30 (1.20–1.39), 197 |
1.21 (1.14–1.35), 113 |
0.011 |
Data are presented as median (25th–75th percentile).
SOsm, serum osmolality; UOsm, urine osmolality; USR, ratio of UOsm to SOsm; CDI, central diabetes insipidus; GWR, gray-to-white matter ratio.
In this prospective cohort study, the patients with poor neurological outcomes who underwent TTM after ROSC had higher SOsm, as well as lower UOsm and USRs than the patients with good neurological outcomes. USRs at T1, T2, and T3 were robustly associated with poor neurological outcomes. AUC analysis indicated that while USR at T0 was a poor predictor, USRs at T1, T2, and T3 were fair predictors of poor neurological outcomes. Among these, USR at T3 exhibited the highest performance for predicting poor outcomes.
Several studies showed CDI to be associated with mortality and poor neurological outcomes after cardiac arrest [4, 5]. The diagnosis of CDI typically requires a urine output exceeding 300 mL/h and the administration of desmopressin, a synthetic analogue of antidiuretic hormone [4, 5]. However, two previous studies [4, 5] demonstrated that the diagnosis of CDI can be confirmed through observation up to 7 days after ROSC, whereas the time required to assess the neurological status of OHCA patients is generally 72 h after the return to normothermia following ROSC. Thus, CDI diagnosis may be delayed relative to the determination of neurological prognosis. Additionally, acute kidney injury or cardiogenic shock may occur during the post-resuscitation period in OHCA patients, which may make it difficult to measure urine output for diagnosing CDI due to anuria or oliguria. However, as shown in the present study, if USR is used in the early stages rather than for confirming the presence or absence of CDI, it can provide more information for determining neurological outcomes and help medical staff make treatment decisions.
In the present study, the mean SOsm values at T1, T2, and T3 of patients with poor neurological outcomes were higher than those of patients with good neurological outcomes. Elevated osmolality has been associated with a poor prognosis in association with many conditions, such as heart failure and traumatic brain injury [10, 11, 12]. In a study investigating OHCA, the mean SOsm of patients with poor neurological outcomes was higher than that of patients with good neurological outcomes, which was consistent with our study (at 0 h, 303.5 vs. 297.3 milliosmoles (mOsm)/L; 24 h, 300.5 vs. 288.4 mOsm/L) [13]. In that study, the investigators speculated that blood–brain barrier breakdown after cardiac arrest causes sodium leakage from blood vessels into the interstitial space, ultimately aggravating cerebral edema in OHCA survivors [13]. Although that study showed a relationship between SOsm and neurological outcomes within 24 h after ROSC, in the present study, this relationship persisted until 72 h; multivariate analysis indicated that only SOsm at T3 was associated with poor neurological outcomes.
The univariate analysis revealed that SOsm, UOsm, and USR were related to poor neurological outcomes at all periods within 72 h after ROSC. However, the multivariate analysis revealed that sOsm, UOsm, and USR at admission were not associated with poor outcomes, and SOsm was associated with poor outcomes only at 72 h after ROSC. It is suggested that SOsm, UOsm, and USR may not exert a significant influence on outcomes upon admission when only ischemic injury was reflected. Their effect on outcomes becomes evident only when reperfusion injury is present in addition to ischemic injury. Furthermore, SOsm is affected by various factors, including electrolytes or blood glucose levels, and can be a target for fluid resuscitation. Thus, it would not be related to outcomes other than at 72 h after ROSC, when reperfusion injury is a prominent neurological outcome. Additionally, SOsm and UOsm at T3 were associated with poor neurological outcomes, with their predictive power enhanced when combined with USR. The AUC for USR at T3 was superior to those of SOsm and UOsm at the same time point.
Cardiac arrest induces damage to the hypothalamic–pituitary axis, and the pituitary gland is particularly vulnerable to ischemia [14], so it is expected that CDI will occur due to severe brain damage after cardiac arrest. The most typical phenomenon among CDI features is reduced UOsm. In this regard, although two previous studies did not indicate exact UOsm values corresponding to specific neurological outcomes in the post-resuscitation period [4, 5], a poor neurological prognosis can be inferred from a low UOsm. Additionally, several case reports have indicated low UOsm in patients with severe brain damage after cardiac arrest [15, 16, 17]. In our study, the median UOsm of patients with poor outcomes was lower than that of patients with good outcomes within 72 h after ROSC, and in the multivariate analysis, UOsm at T1, T2, and T3 was associated with poor neurological outcomes. Elevated serum sodium levels, another characteristic of CDI, were observed in our study, with hypernatremia (defined as a serum sodium concentration above 145 mmol/L) present at T1, T2, and T3.
Normal UOsm values may vary depending on the condition of patients, but the normal range is approximately 500–800 mOsm/L [18, 19, 20], and the mean UOsm of 380 mOsm/L immediately after ROSC in the present study was lower than normal. We thought that brain damage secondary to ischemia during cardiac arrest would lead to hypothalamic–pituitary axis compromise in most patients after ROSC. However, UOsm of patients with good outcomes gradually increased over time, whereas that of patients with poor outcomes had little change after ROSC. In other words, patients with good neurological outcomes recovered from the initial brain injury, but patients with poor neurological outcomes did not.
The present study had several limitations. First, this was a single-center observational study. Therefore, its results cannot be widely generalized. Further prospective multicenter studies are needed to complement our findings. Second, we excluded patients who discontinued TTM due to death or transfer to other hospitals. This might have led to selection bias and influenced the study outcomes. Third, given that we examined SOsm and UOsm within 72 h after ROSC in the present study, we could not evaluate the relationship between SOsm and UOsm beyond 72 h and neurological prognoses. Fourth, the effects of fluids and drugs on SOsm and UOsm during the post-resuscitation period were not considered. Although efforts were made to keep glucose levels within an optimal range, the administration of glucose-containing fluids or insulin could alter SOsm and UOsm. Additionally, desmopressin, an antidiuretic medication, may be administered based on clinical suspicion of CDI, further influencing osmolality measurements. Future research should investigate the relationships between these medications and osmolality.
USRs within 72 h of ROSC were associated with poor neurological outcomes at 6 months after OHCA. USR may serve as a valuable indicator, in conjunction with other prognostic factors, to identify patients with severe conditions and to guide the administration of more intensive treatments post-ROSC.
All data generated or analyzed during this study are included in this article and its supplementary material files. Further enquiries can be directed to the corresponding author.
These should be presented as follows: SR and DL designed the research study. SR, JL, DL, and WJ performed the research. SB and YC provided help and advice on the study. DL and BL analyzed the data. SR, JL, and DL wrote the manuscript. All authors contributed to editorial changes in the manuscript. All authors read and approved the final manuscript. All authors have participated sufficiently in the work and agreed to be accountable for all aspects of the work.
This study was approved by the Chonnam National University Hospital Institutional Review Board (CNUH-2015-164). Written informed consent was obtained from all participants or their next of kin.
Not applicable.
This study was supported by a grant (BCRI-23015) of Chonnam National University Hospital Biomedical Research Institute.
The authors declare no conflict of interest.
Publisher’s Note: IMR Press stays neutral with regard to jurisdictional claims in published maps and institutional affiliations.