
- Academic Editor
Background:
The purpose of this study was to evaluate
the impact of glucose levels on admission, on the risk of 30-day major adverse
cardiovascular events (MACEs) in patients with acute myocardial infarction (AMI),
and to assess the difference in outcome between ST-segment elevation myocardial
infarction (STEMI) and non-ST-segment elevation myocardial infarction (NSTEMI)
patients. Methods: This study was a post hoc analysis of the Acute
Coronary Syndrome Quality Improvement in Kerala Study, and 13,398 participants
were included in the final analysis. Logistic regression models were used to
assess the association between glucose levels on admission and the risk of 30-day
MACEs, adjusting for potential confounders. Results:
Participants were divided according to the
glucose quintiles. There was a positive linear association between glucose levels
at admission and the risk of 30-day MACEs in AMI patients [adjusted OR (95% CI):
1.05 (1.03, 1.07), p
Cardiovascular disease (CVD) is the leading cause of mortality in India, mainly due to ischemic heart disease (IHD) [1, 2]. As a severe subtype of coronary heart disease, acute myocardial infarction (AMI) was more common in India than in other countries due to a combination of a large population and genetic background [3, 4].
Previous studies found that hypertension, diabetes, physical activity, and moderate alcohol use were independent risk factors for coronary heart disease (CHD) in both males and females [5]. Early identification of acute coronary syndrome (ACS) patients with poor prognosis is very important. Different subtypes of ACS, such as ST-segment elevation myocardial infarction (STEMI) and non-ST-segment elevation myocardial infarction (NSTEMI), have different pathophysiological and clinical features, and their prognosis is also different [6, 7]. Myocardial troponin peak (cTn), as one of the prognostic factors of AMI, had a different prognostic value for different types of AMI [8].
Abnormally elevated blood glucose was common in patients with AMI [9, 10]. Previous studies had suggested that elevated glucose levels on admission were associated with an unfavorable prognosis in patients with AMI [11, 12]. However, the role of admission glucose levels was not previously investigated in STEMI and NSTEMI patients specifically. Therefore, the purpose of this study was to evaluate the impact of glucose levels on admission on the risk of 30-day major adverse cardiovascular events (MACEs) in AMI patients, and to assess the difference in outcome between STEMI and NSTEMI patients.
The data analyzed in this study were from the Acute Coronary Syndrome Quality Improvement in Kerala (ACS-QUIK) Study, which was available on the National Heart, Lung and Blood Institute website with reasonable application (https://biolincc.nhlbi.nih.gov/studies/acs_quik/). The rationale and main result of the ACS-QUIK Study have been published previously [13, 14]. In brief, the ACS-QUIK Study was a cluster-randomized, stepped-wedged clinical trial conducted in 63 hospitals in Kerala, India, from November 10, 2014 to November 9, 2016. The aim of this study was to assess whether a locally adapted quality improvement tool kit could improve the process of care measures and clinical outcomes for patients with acute myocardial infarction. The ACS-QUIK Study was approved by the ethics committees of local, national and international agencies and approved by the Indian Health Ministry Screening Committee. All participants or their representatives provided written informed consent to participate in the trial. Among 21,374 patients with acute myocardial infarction enrolled in this trial, the locally adopted quality improvement kits did not reduce the incidence of 30-day MACEs compared with conventional care.
This analysis was to evaluate the effect of the glucose level on admission on
the incidence of 30-day MACEs in patients
with acute myocardial infarction at ACS-QUIK Study and to assess the difference
in outcome between STEMI and NSTEMI patients. After 7976 participants without
glucose on admission were excluded, we finally included
13,398 participants in this analysis
and divided them according to the
glucose quintiles [Q1 (
Other baseline parameters included demographic data (age, gender, weight, smoking or tobacco), examination at admission (systolic blood pressure (SBP), heart rate, high density lipoprotein cholesterol (HDL-C), low density lipoprotein cholesterol (LDL-C), triglycerides), left ventricular ejection fraction (LVEF) and LVEF category, prior comorbidities [hypertension, peripheral artery disease (PAD), diabetes, prior transient ischemic attack (TIA) or stroke], type of myocardial infarction (NSTEMI, STEMI), Killip class at admission and cardiac status, medication at admission (Beta Blocker, antiplatelet), symptom onset to arrival time, and percutaneous coronary intervention (PCI).
The study outcome was 30-day MACEs, including morality, stroke and reinfarction. The diagnostic criteria for reinfarction were defined according to the Third Universal Definition of Myocardial Infarction [15].
The categorial variables were described statistically by frequency and percentage,
and the continuous variables were described statistically by mean
Table 1 shows the baseline characteristics and crude outcomes across the glucose quintiles. As expected, the higher glucose quartile was associated with a higher incidence of 30-day MACE and a higher prevalence of diabetes. Participants in the higher glucose quartile had a higher proportion of females, a higher SBP and heart rate at admission, higher Killip class (II~IV), a lower rate of smoking or tobacco and a higher prevalence of hypertension, PAD and stroke, as well as a lower LVEF and a higher incidence of cardiac arrest than participants in the lower glucose quartile. There were significant inter-group differences in weight, HDL-C, triglyceride MI type and PCI therapy, while there were no inter-group differences in medication (beta blocker, antiplatelet) at admission and time from symptom onset to arrival.
| Variables | Glucose at admission (mmol/L) | p-value | |||||
| Q1 ( |
Q2 (5.4–6.3) | Q3 (6.4–7.8) | Q4 (7.9–10.6) | Q5 ( | |||
| N | 2644 | 2519 | 2856 | 2648 | 2731 | ||
| Intervention | 1290 (51.21%) | 1109 (41.94%) | 1514 (53.01%) | 1391 (52.53%) | 1436 (52.58%) | ||
| Age, y, mean |
59.63 |
59.76 |
60.87 |
60.75 |
60.48 |
||
| Age group, n (%) | 0.160 | ||||||
| 1718 (64.98%) | 1635 (64.91%) | 1785 (62.50%) | 1669 (63.03%) | 1769 (64.77%) | |||
| 926 (35.02%) | 884 (35.09%) | 1071 (37.50%) | 979 (36.97%) | 962 (35.23%) | |||
| Sex, n (%) | |||||||
| Female | 566 (21.41%) | 532 (21.12%) | 717 (25.11%) | 685 (25.87%) | 786 (28.78%) | ||
| Male | 2078 (78.59%) | 1987 (78.88%) | 2139 (74.89%) | 1963 (74.13%) | 1945 (71.22%) | ||
| SBP, mmHg, mean |
137.29 |
138.33 |
140.31 |
141.47 |
142.06 |
||
| Heart Rate, bpm, mean |
77.72 |
78.15 |
79.79 |
81.84 |
85.10 |
||
| Weight, kg, mean |
62.75 |
63.61 |
63.15 |
63.84 |
63.62 |
||
| HDL-C, mg/dL, mean |
42.34 |
41.30 |
41.46 |
41.70 |
42.34 |
||
| LDL-C, mg/dL, median (Q1, Q3) | 120 (97, 143) | 122 (96, 148) | 122 (96, 150) | 121 (94, 151) | 121 (94, 149) | 0.053 | |
| Triglycerides, mg/dL, median (Q1, Q3) | 124 (95, 167) | 114 (87, 158) | 117.00 (86, 160) | 123 (89, 167) | 129 (94, 178) | ||
| Smoking or tobacco, n (%) | 1127 (42.62%) | 869 (34.50%) | 794 (27.80%) | 702 (26.51%) | 610 (22.34%) | ||
| Hypertension, n (%) | 1038 (39.26%) | 1056 (41.92%) | 1373 (48.07%) | 1366 (51.59%) | 1494 (54.71%) | ||
| PAD, n (%) | 18 (0.68%) | 12 (0.48%) | 41 (1.44%) | 25 (0.94%) | 44 (1.61%) | ||
| Prior TIA or stroke, n (%) | 69 (2.61%) | 59 (2.34%) | 66 (2.31%) | 65 (2.45%) | 82 (3.00%) | 0.480 | |
| Diabetes, n (%) | 583 (22.05%) | 614 (24.37%) | 1207 (42.26%) | 1770 (66.84%) | 2381 (87.18%) | ||
| NSTEMI, n (%) | 1036 (39.18%) | 907 (36.01%) | 990 (34.66%) | 989 (37.35%) | 1005 (36.80%) | ||
| STEMI, n (%) | 1608 (60.82%) | 1612 (63.99%) | 1866 (65.34%) | 1659 (62.65%) | 1726 (63.20%) | ||
| Killip class, n (%) | |||||||
| I | 2353 (88.99%) | 2266 (89.99%) | 2450 (85.78%) | 2184 (82.48%) | 2224 (81.44%) | ||
| II | 75 (2.84%) | 109 (4.33%) | 175 (6.13%) | 173 (6.53%) | 180 (6.59%) | ||
| III | 134 (5.07%) | 110 (4.37%) | 180 (6.30%) | 238 (8.99%) | 267 (9.78%) | ||
| IV | 82 (3.10%) | 33 (1.31%) | 51 (1.79%) | 53 (2.00%) | 60 (2.20%) | ||
| LVEF category, n (%) | |||||||
| 231 (8.74%) | 306 (12.15%) | 418 (14.64%) | 460 (17.37%) | 524 (19.19%) | |||
| 41% to 69% | 1976 (74.74%) | 1757 (69.75%) | 1987 (69.57%) | 1785 (67.41%) | 1821 (66.68%) | ||
| 143 (5.41%) | 177 (7.03%) | 172 (6.02%) | 139 (5.25%) | 100 (3.66%) | |||
| Unknown or not assessed | 294 (11.12%) | 279 (11.08%) | 279 (9.77%) | 264 (9.97%) | 286 (10.47%) | ||
| LVEF, %, mean |
53.40 |
53.73 |
53.43 |
53.03 |
52.33 |
||
| Symptom onset to arrival (min), median (Q1, Q3) | 256.5 (125, 960) | 270 (120, 850) | 255 (120, 830) | 270 (120, 900) | 270 (120, 885) | 0.181 | |
| Antiplatelet, n (%) | 2596 (98.26%) | 2477 (98.33%) | 2801 (98.11%) | 2580 (97.69%) | 2681 (98.31%) | 0.392 | |
| Beta Blocker, n (%) | 920 (36.74%) | 918 (37.39%) | 1070 (38.54%) | 1009 (39.17%) | 1011 (38.24%) | 0.411 | |
| Cardiac arrest at admission, n (%) | 13 (0.49%) | 25 (0.99%) | 43 (1.51%) | 39 (1.47%) | 40 (1.46%) | 0.001 | |
| PCI, n (%) | 968 (36.61%) | 1366 (54.23%) | 1604 (56.16%) | 1459 (55.10%) | 1429 (52.33%) | ||
| MACEs, n (%) | 86 (3.41%) | 97 (3.67%) | 116 (4.06%) | 121 (4.57%) | 173 (6.33%) | ||
PCI, percutaneous coronary intervention; PAD, peripheral artery disease; STEMI, ST-segment elevation myocardial infarction; NSTEMI, non-ST-segment elevation myocardial infarction; LVEF, left ventricular ejection fraction; MACEs, major adverse cardiovascular events; SBP, systolic blood pressure; HDL-C, high density lipoprotein cholesterol; LDL-C, low density lipoprotein cholesterol; TIA, transient ischemic attack; N, number of patients.
Supplementary Table 1 presented baseline characteristics and crude outcomes according to MI type (NSTEMI vs. STEMI). There were significant inter-group differences in all variables except HDL-C. Patients with STEMI had a higher risk of 30-day MACEs in the fully adjusted model [OR (95% CI): 1.41 (1.11, 1.80), p = 0.005] (Supplementary Table 2).
As shown in Table 2, comparing with the reference
(Q2, 5.4–6.3),
participants with the
highest quintile of glucose level were
associated with increased risk of 30-day MACEs in the fully adjusted logistic
regression model 3 [OR (95% CI): 1.82 (1.33,
2.50), p
| Glucose Quintiles | 30-day MACEs | ||
| OR (95% CI), p-value | |||
| Model 1 | Model 2 | Model 3 | |
| All participants | |||
| Q1 | 1.08 (0.80, 1.45) p = 0.621 | 1.06 (0.79, 1.44) p = 0.684 | 1.03 (0.75, 1.43) p = 0.835 |
| Q2 | reference | reference | reference |
| Q3 | 1.20 (0.90, 1.59) p = 0.213 | 1.17 (0.87, 1.56) p = 0.295 | 1.11 (0.81, 1.52) p = 0.519 |
| Q4 | 1.35 (1.02, 1.80) p = 0.035 | 1.35 (1.01, 1.80) p = 0.040 | 1.22 (0.89, 1.69) p = 0.219 |
| Q5 | 1.91 (1.47, 2.49) p |
1.94 (1.49, 2.54) p |
1.82 (1.33, 2.50) p |
Model 1: adjusted for none. Model 2: adjusted for intervention, age, sex and SBP. Model 3: adjusted for intervention, age, sex, SBP, weight, heart rate, HDL-C, LDL-C, TG, smoking or tobacco, diabetes, hypertension, PAD, MI Type, Symptom onset to arrival, Prior TIA or stroke, cardiac arrest at admission, LVEF category, PCI, antiplatelet, beta blocker. MACEs, major adverse cardiovascular events; SBP, systolic blood pressure; HDL-C, high density lipoprotein cholesterol; LDL-C, low density lipoprotein cholesterol; TG, triglyceride; PAD, peripheral artery disease; MI, myocardial infarction; TIA, transient ischemic attack; LVEF, left ventricular ejection fraction; PCI, percutaneous coronary intervention; OR, odds ratio; CI, confidence interval.
GAM was used to visualize the dose-response relationship between glucose level on admission and the risk of 30-day MACEs. As shown in Fig. 1, the risk of 30-day MACEs had a linear trend of increase with the increase of glucose. For each 1 mmol/L increase in blood glucose, the risk of 30-day MACES increased by 5% [OR (95% CI): 1.05 (1.03, 1.07)]. The parameters of other covariates in the Generalized additive model are shown in Supplementary Table 3. This trend was more significant in STEMI patients [OR (95% CI): 1.07 (1.04, 1.10)], with the risk of 30-day MACEs increasing with blood glucose levels more significant than in NSTEMI patients [OR (95% CI): 1.02 (0.98, 1.06)] (Fig. 2). The dose-response relationship between glucose level and the risk of 30-day MACEs was nearly flat trend (Fig. 2).
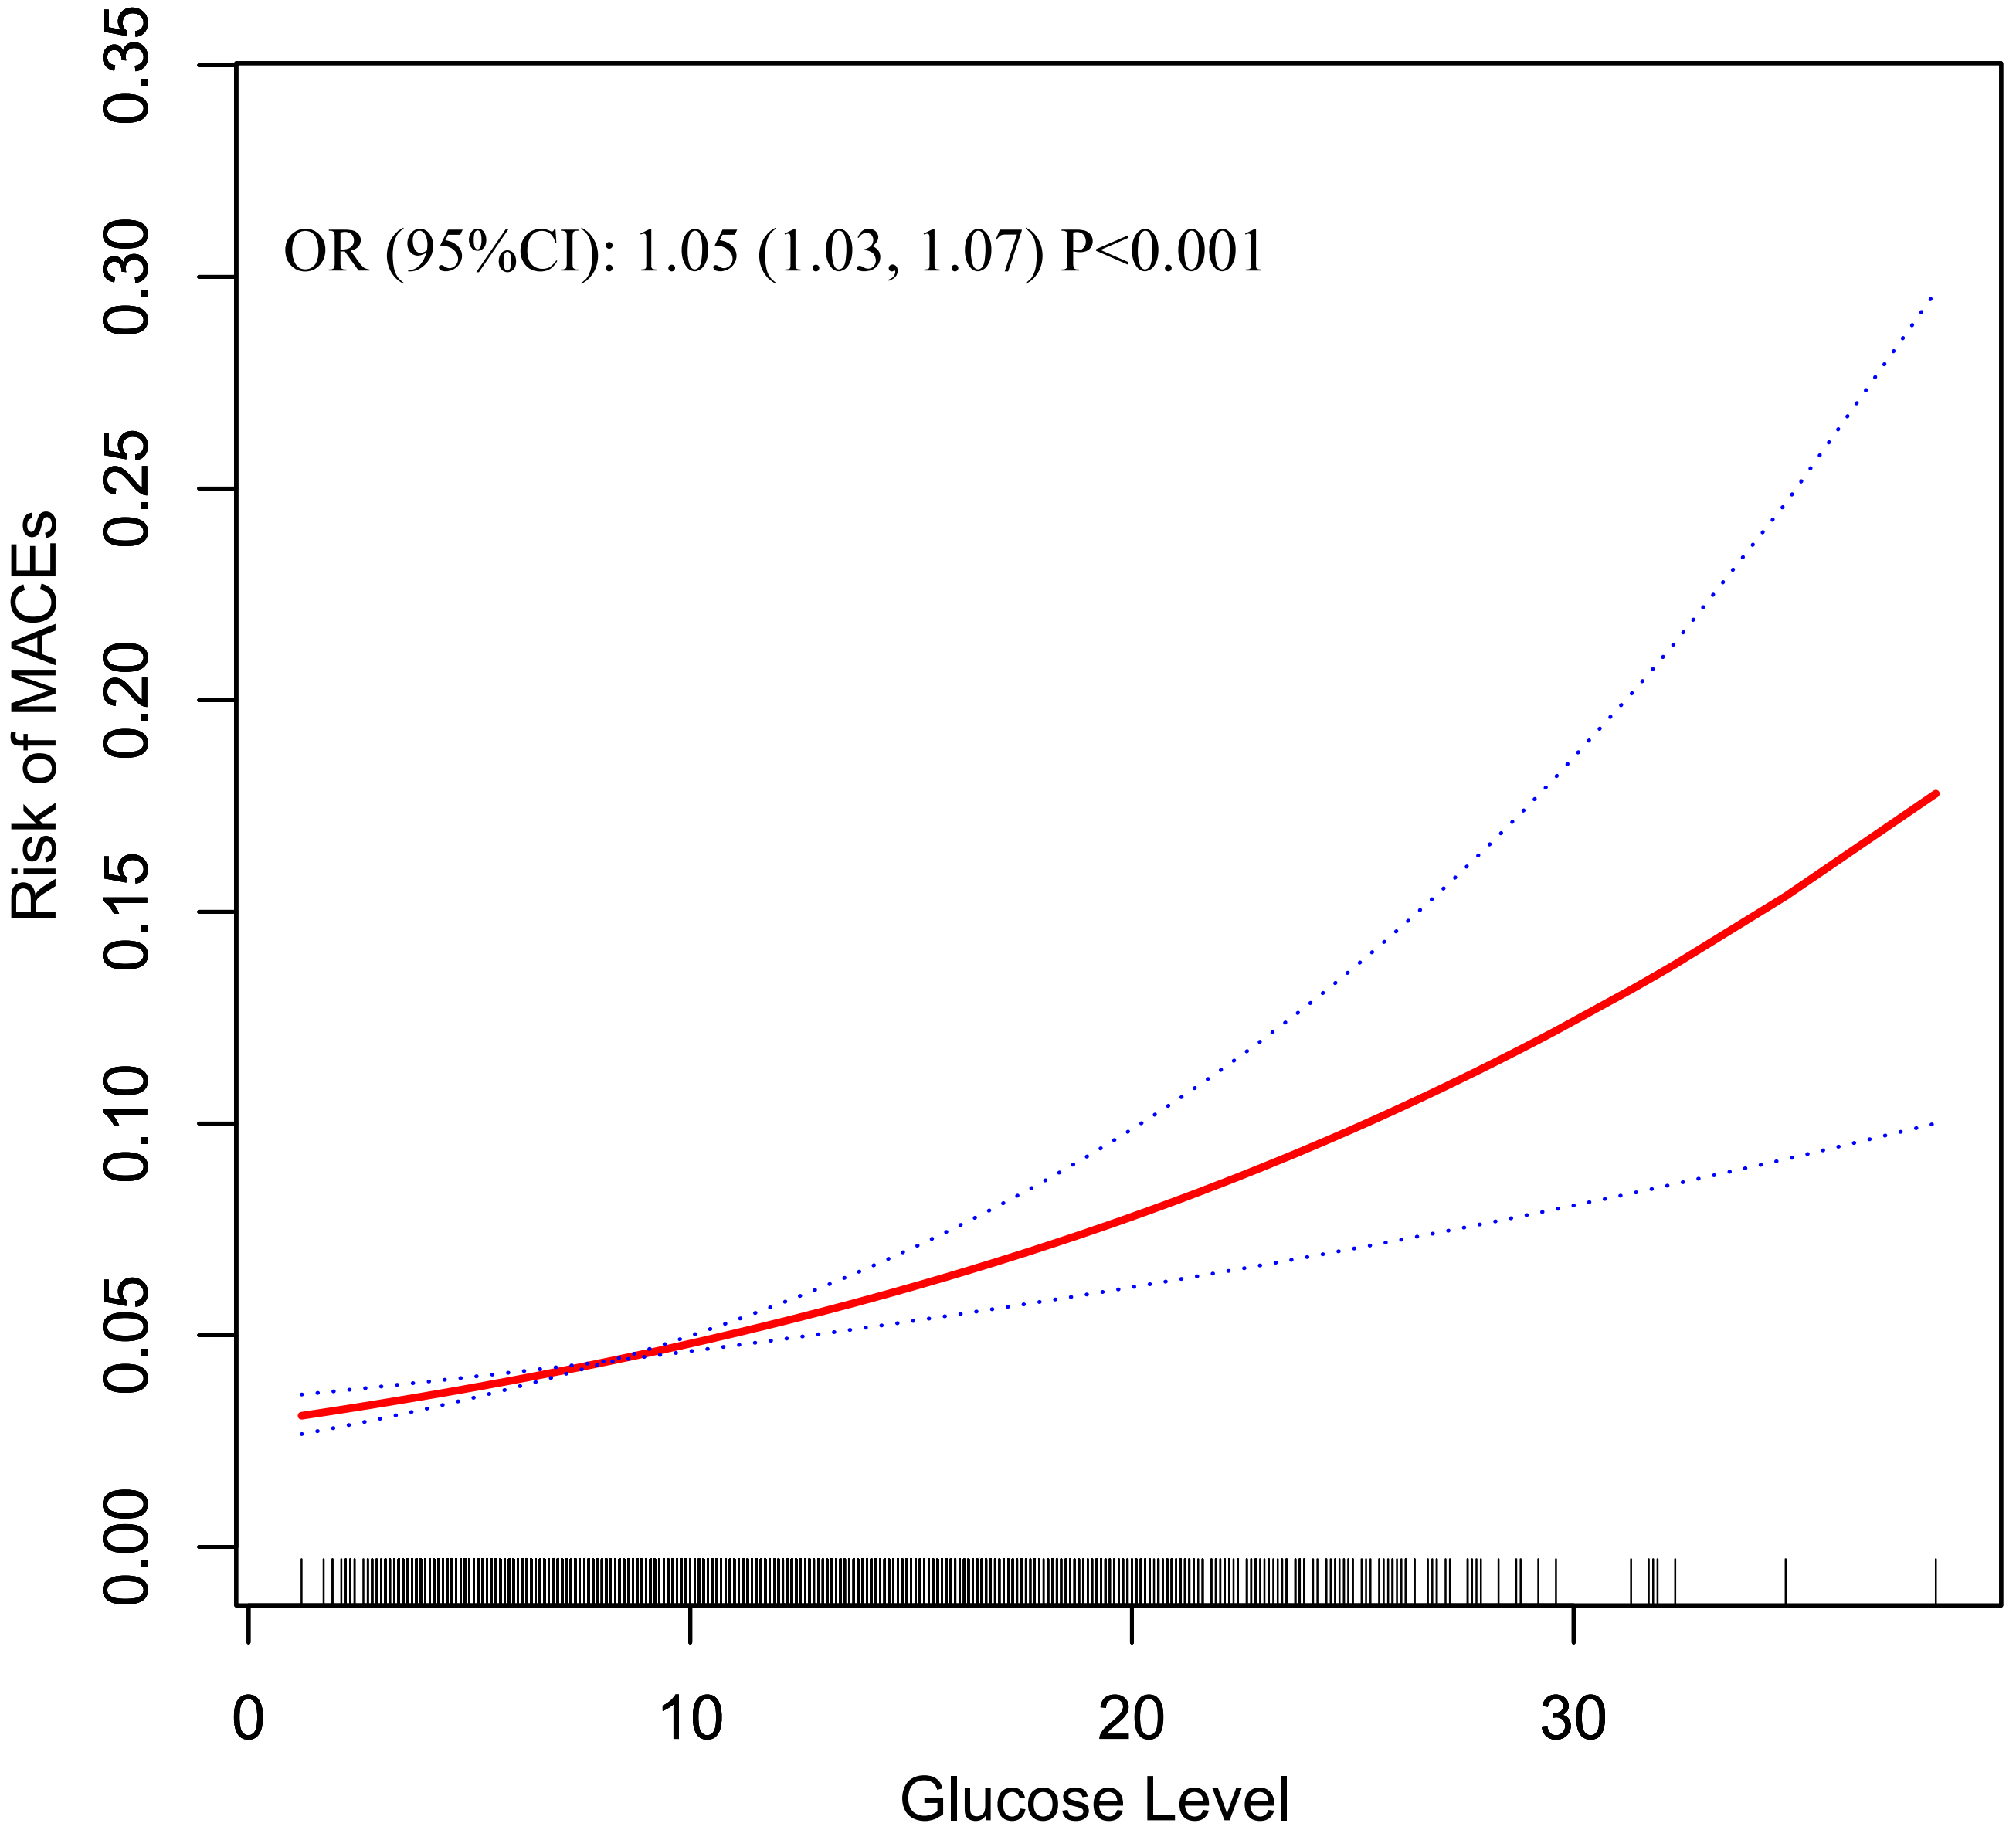 Fig. 1.
Estimated risk of MACEs in different blood glucose levels for total participants. The solid red line was the estimated risk, and the dashed lines above and below were the upper and lower limits of 95% CI, respectively. All covariates in model 3 were adjusted. MACEs, major adverse cardiovascular events; OR, odds ratio; CI, confidence interval.
 Fig. 2.
Estimated risk of MACEs in different blood glucose levels stratified by MI type. All covariates in model 3 were adjusted. MACEs, major adverse cardiovascular events; STEMI, ST-segment elevation myocardial infarction; NSTEMI, non-ST-segment elevation myocardial infarction; MI, myocardial infarction; OR, odds ratio; CI, confidence interval.
The relationship between glucose level on admission and the risk of 30-day MACEs
was still robust across the following subgroups (Table 3): age group (
| Subgroup | Glucose Quintiles | p for interaction | |||||
| Q1 | Q2 | Q3 | Q4 | Q5 | |||
| OR (95% CI), p-value | |||||||
| Age group | 0.221 | ||||||
| 0.82 (0.48, 1.40) p = 0.465 | reference | 1.06 (0.64, 1.76) p = 0.825 | 1.48 (0.90, 2.46) p = 0.125 | 2.29 (1.39, 3.77) p = 0.001 | |||
| 1.21 (0.80, 1.83) p = 0.361 | reference | 1.19 (0.79, 1.78) p = 0.406 | 1.14 (0.75, 1.73) p = 0.543 | 1.70 (1.12, 2.57) p = 0.012 | |||
| Sex | 0.894 | ||||||
| Female | 1.08 (0.63, 1.85) p = 0.790 | reference | 1.25 (0.75, 2.08) p = 0.388 | 1.34 (0.80, 2.26) p = 0.268 | 1.76 (1.05, 2.96) p = 0.032 | ||
| Male | 1.06 (0.70, 1.59) p = 0.790 | reference | 1.05 (0.70, 1.59) p = 0.802 | 1.20 (0.80, 1.82) p = 0.380 | 1.96 (1.31, 2.94) p = 0.001 | ||
| Hypertension | 0.421 | ||||||
| No | 1.13 (0.70, 1.85) p = 0.614 | reference | 1.51 (0.95, 2.42) p = 0.083 | 1.58 (0.98, 2.55) p = 0.059 | 2.16 (1.33, 3.51) p = 0.002 | ||
| Yes | 0.98 (0.63, 1.52) p = 0.924 | reference | 0.89 (0.58, 1.37) p = 0.599 | 1.00 (0.64, 1.55) p = 0.999 | 1.60 (1.05, 2.44) p = 0.030 | ||
| Diabetes | 0.109 | ||||||
| No | 1.06 (0.71, 1.58) p = 0.791 | reference | 1.44 (0.97, 2.13) p = 0.072 | 1.53 (0.98, 2.38) p = 0.062 | 2.62 (1.57, 4.39) p |
||
| Yes | 1.03 (0.75, 1.43) p = 0.839 | reference | 1.13 (0.82, 1.54) p = 0.463 | 1.24 (0.90, 1.71) p = 0.190 | 1.86 (1.35, 2.55) p |
||
All covariates in model 3 were adjusted except stratification itself. MACEs, major adverse cardiovascular events; OR, odds ratio; CI, confidence interval.
But, there was a significant interaction between glucose level and MI type in
fully adjusted model 3 (NSTEMI vs. STEMI; p for interaction = 0.036).
For example (Table 4), in STEMI patients, the highest quintile of glucose level
(Q5) was significantly associated with an increased risk of 30-day MACEs after
full adjustment [OR (95% CI): 2.23 (1.48,
3.35), p
| Glucose Quintiles | 30-day MACEs | ||
| OR (95% CI), p-value | |||
| Model 1 | Model 2 | Model 3 | |
| Patients with NSTEMI | |||
| Q1 | 1.31 (0.83, 2.09) p = 0.251 | 1.31 (0.82, 2.09) p = 0.258 | 1.21 (0.73, 2.02) p = 0.452 |
| Q2 | reference | reference | reference |
| Q3 | 1.44 (0.91, 2.28) p = 0.121 | 1.34 (0.84, 2.14) p = 0.212 | 1.22 (0.73, 2.03) p = 0.442 |
| Q4 | 1.04 (0.63, 1.70) p = 0.886 | 1.01 (0.62, 1.67) p = 0.955 | 0.85 (0.50, 1.47) p = 0.573 |
| Q5 | 1.92 (1.24, 2.98) p = 0.004 | 1.83 (1.17, 2.85) p = 0.008 | 1.40 (0.84, 2.34) p = 0.191 |
| Patients with STEMI | |||
| Q1 | 0.93 (0.63, 1.37) p = 0.703 | 0.91 (0.61, 1.35) p = 0.634 | 0.89 (0.58, 1.36) p = 0.584 |
| Q2 | reference | reference | reference |
| Q3 | 1.07 (0.75, 1.54) p = 0.712 | 1.06 (0.74, 1.54) p = 0.746 | 1.04 (0.69, 1.56) p = 0.848 |
| Q4 | 1.55 (1.10, 2.19) p = 0.013 | 1.56 (1.09, 2.21) p = 0.014 | 1.47 (0.98, 2.20) p = 0.061 |
| Q5 | 1.91 (1.37, 2.66) p |
2.02 (1.44, 2.84) p |
2.23 (1.48, 3.35) p |
| p for interaction | 0.064 | 0.054 | 0.036 |
Model 1: adjusted for none. Model 2: adjusted for intervention, age, sex and SBP. Model 3: adjusted for intervention, age, sex, SBP, weight, heart rate, HDL-C, LDL-C, TG, smoking or tobacco, diabetes, hypertension, PAD, Symptom onset to arrival, Prior TIA or stroke, cardiac arrest at admission, LVEF category, PCI, antiplatelet, beta blocker. MACEs, major adverse cardiovascular events; STEMI, ST-segment elevation myocardial infarction; NSTEMI, non-ST-segment elevation myocardial infarction; SBP, systolic blood pressure; HDL-C, high density lipoprotein cholesterol; LDL-C, low density lipoprotein cholesterol; TG, triglyceride; PAD, peripheral artery disease; TIA, transient ischemic attack; LVEF, left ventricular ejection fraction; PCI, percutaneous coronary intervention; OR, odds ratio; CI, confidence interval.
In this study, we found that AMI patients with elevated admission glucose have higher risks of 30-day MACEs, compared with patients who had normal levels of glucose on admission. There was a positive linear association between glucose levels on admission and the risk of 30-day MACEs in AMI patients. This trend was more significant in STEMI patients.
Elevated admission glucose levels were frequently reported to be an important
factor of poor prognosis for patients with AMI, including increased risk of heart
failure [17], hospital mortality [11], and left ventricular dysfunction [18]. A
single-center prospective study showed that elevated blood glucose concentrations
on admission were an independent prognostic factor for all-cause mortality in AMI
patients [19]. The Cooperative Cardiovascular Project analyzed data on 141,680
patients aged 65 years or older with AMI and reported a positive linear
association between the admission blood glucose level and the 30-day and 1-year
mortality rates [20]. With the cut-off value of 110 mg/dL (6.0 mmol/L), this
study reported a higher risk of 30-day and 1-year mortality for patients with
higher admission glucose levels [20]. A prospective study on AMI patients found
that compared to those with an admission glucose level lower than 140 mg/dL
(7.8 mmol/L), patients whose admission
glucose levels higher than 157 mg/dL (8.7 mmol/L) have a significantly higher
risk of 30-day mortality [11]. Among ACS patients undergoing primary PCI,
patients with admission glucose level
Several hypotheses have been suggested to explain the relationship between elevated admission glucose levels and a higher risk of adverse cardiovascular outcomes in AMI patients. Elevated blood glucose levels might reflect a surge in stress hormones, such as catecholamines and cortisol, which produce an insulin-resistant state. It reduced glucose uptake by ischemic myocardium, increased circulating free fatty acids, and inhibited glucose oxidation, leading to increased membrane damage, arrhythmias, and reduced contractility [22, 23, 24, 25]. In addition, acute elevated blood glucose has been reported to have an association with increased thrombin formation, platelet activation, and fibrin clot resistance to lysis, which might increase the risk of thrombotic complications among AMI patients [26, 27]. Finally, previous clinical studies had reported that acutely elevated glucose was associated with left ventricular dysfunction, larger myocardial infarction size and higher risk of cardiogenic shock [18, 21, 28], which may directly explain the association between elevated glucose level and the increased risk of MACEs among AMI patients.
In addition, our analyses first reported a significant interaction between
glucose level on admission and myocardial infarction type on the risk of 30-day
MACEs (p for interaction = 0.036). In STEMI patients, the highest
quintile of glucose level (Q5) was significantly associated with an increased
risk of 30-day MACEs after full adjustment [OR (95% CI): 2.23 (1.48, 3.35),
p
The findings from this study have several clinical applications. First, we expanded current knowledge in the relationship between glucose levels on admission and risk of 30-day MACEs in AMI patients. The prognostic value of elevated admission glucose levels might be of substantial benefit in risk stratification and management of AMI patients. Second, by demonstrating the difference of this association between STEMI patients and NSTEMI patients, our study suggested that when managing AMI patients with high glucose levels on admission, more attention should be paid to STEMI patients than NSTEMI patients. Finally, to our knowledge, this was the largest retrospective study of this subject on the Indian population using ACS-QUIK data.
A few limitations of our study need to be addressed. First, given the nature of the retrospective study, it was possible that there was some residual confounding factors that were not measured. In addition, our study was limited to glucose levels on admission. Since data on glucose levels during hospitalization and follow-up information was not available, we were not able to assess whether the glucose levels were persistent during hospitalization. Above all, the proportion of AMI patients receiving standardized coronary reperfusion and drug therapy was limited in this study, which may affect the evaluation of the relationship between admission blood glucose and Mace. Future studies are warranted into the appropriate management of patients with AMI with high glucose levels on admission to hospital.
In conclusion, our results supported that elevated admission glucose level was a significant independent predictor of 30-day MACEs for AMI patients, especially in patients with STEMI. In clinical settings, more attention should be paid to STEMI patients with high admission glucose levels to prevent the occurrence of MACEs.
Data are available from the Biologic Specimen and Data Repository Information Coordinating Center (BioLINCC), available on the National Heart, Lung and Blood Institute website (https://biolincc.nhlbi.nih.gov/studies/acs_quik/).
LLM, YNL, JYP, XPW, KYZ and WLC designed the study and drafted the methodological parts. ZXZ, JFY, RFL, TZZ and YXW drafted the tables and figures and performed statistical analysis. LLM and YNL drafted the manuscript. JFY and WLC revised the manuscript. All authors approved the final manuscript and agreed to be accountable for all aspects of the work.
The studies involving human participants were reviewed and approved by the Institutional Review Committee of Beijing Anzhen Hospital. The patients/participants provided their written informed consent to participate in this study.
Not applicable.
This research received no external funding.
The authors declare no conflict of interest.
Publisher’s Note: IMR Press stays neutral with regard to jurisdictional claims in published maps and institutional affiliations.